Article

Exploring Carbohydrate Concentration Fluctuations in Pistachio (Pistacia vera L. cv Uzun) for Deeper Insights into Alternate Bearing Patterns

1
Department of Horticulture, Faculty of Agriculture, Yozgat Bozok University, Yozgat 66100, Turkey
2
Department of Plant and Animal Production, Nurdagi Vocational School, Gaziantep University, Gaziantep 27000, Turkey
3
Department of Horticulture, Faculty of Agriculture, Cukurova University, Adana 01330, Turkey
*
Author to whom correspondence should be addressed.
Sustainability 2023, 15(21), 15300; https://doi.org/10.3390/su152115300
Submission received: 14 August 2023 / Revised: 18 October 2023 / Accepted: 24 October 2023 / Published: 26 October 2023

Abstract

:
Alternate bearing (AB) is of great importance in horticulture and leads to fluctuations in yield variation. Although AB is a natural phenomenon to optimize resource allocation and improve crop productivity and profitability in plants, understanding the factors that influence AB can help in implementing effective management strategies to reduce the negative effects and promote consistent and sustainable production. This study aimed to investigate the variation in carbohydrate levels in various tissues of both bearing and non-bearing pistachio (Pistacia vera L. cv Uzun) trees during different periods of growth development in two consecutive years to gain a deeper understanding of their potential contribution to AB. Twelve 34-year-old pistachio trees, consisting of six “ON” and six “OFF” year trees, were accidentally selected from a pistachio orchard. The “OFF” year trees were induced two years before sampling to be in the “OFF” year state by artificially removing flower buds. Sucrose was the main soluble sugar in the different parts of the pistachio tree studied. In general, the amount of sugar was higher in the non-bearing year than in the bearing year. It was found that non-structural carbohydrates of trees decreased between June and July, resulting in flower buds to abscise. The amount of carbohydrates decreased during nut development in “ON” trees, indicating the possible role of carbohydrates in AB.

1. Introduction

Alternate bearing is one of the most significant challenges of orchardists among some fruit tree species, such as pistachio, apples, olive, citrus species, etc. [1]. Alternate bearing is a phenomenon characterized by irregular crop production in trees and is often observed in various commercial fruit trees. Essentially, it involves a cycle of high fruit set (ON) in one year and low fruit set (OFF) in the subsequent year. This pattern leads to excessive fruit set in ON years, leading to non-bearing or smaller fruits in the following year [2]. Fluctuation between ON and OFF years poses financial challenges for producers and consumers and causes significant losses in fruit tree crops. However, the degree to which each mechanism influences AB varies greatly between species and varieties of fruit trees. Pistachio is considered an economically horticultural product due to its notable health-promoting attributes and its market prices can often remain elevated, even in regions that are primary producers of this crop. However, the phenomenon of alternate bearing, wherein pistachio trees yield significantly lower or negligible quantities during “OFF” years, leads to the sustainability challenges associated with pistachio production. This situation ultimately leads to reduced incomes for producers and elevated prices for consumers, thereby contributing to an unsustainable economic balance within the pistachio industry. Among pistachio varieties, there is a range of AB tendencies, and the variety ‘Uzun’ is characterized by an absolute AB pattern. As a sector-dependent product in Turkey, the economic problems resulting from this phenomenon, especially for the ‘Uzun’ cultivar, are particularly important. Initially, efforts to combat this problem encompassed utilizing cultural practices such as irrigation, pruning, fertigation, and other related techniques. These practices optimize growing conditions in pistachio orchards. Proper irrigation ensures stable moisture levels, pruning aids in tree health and balance, and fertigation supplements essential nutrients, collectively reducing alternate bearing. However, while these practices alleviate alternate bearing, additional measures are still needed to effectively address this challenge. The effects of carbohydrates, plant growth regulators, phenolic compounds, and polyamines have been studied in the management of AB and, recently, studies on molecular and biotechnological tools have also been started [1,2,3]. However, the extent to which these factors influence AB remains unclear. Monselise and Goldschmidt [4] suggested that the presence of fruit plays a pivotal role in regulating this phenomenon by affecting both external and internal factors, thereby intensifying competition among buds and fruits. The presence of fruit is the key factor regulating this phenomenon via external and internal factors. In many studies, fluctuations in the carbohydrate budget of a tree have been proposed as a key factor in triggering AB [4,5,6]. To support further metabolic needs, many tree species accumulate carbohydrate reserves between the annual cycles [7]. Deciduous trees have a close association between reserves and spring flowering [8,9]. However, with many fruit species bearing alternately, the dynamics of carbohydrate balance are probably more complicated and complex. In AB cycles of pistachio cultivars, the increased reproductive activity in the “ON” year can lead to a reduction in carbohydrate reserves. In the first studies, Crane et al. [10] and Crane and Shalan [11] reported that carbohydrate concentrations were similar in the different organs of both “ON” and “OFF”. They concluded that carbohydrate reserves were not related to bud abscission. However, in later studies, many researchers have reported that carbohydrate deficiency may be responsible for the main phase of flower bud abscission. They suggested that the translocation of carbohydrates into the reproductive organs of pistachios may be a triggering factor for the abscission of flower buds [12,13,14,15]. The regulation of carbohydrates plays an important role, mainly via accumulating and redistributing photoassimilates during the annual production cycle [16]. Some researchers have also suggested that the competition for carbohydrates between flower buds and ovaries is responsible for bud abscission [5,14,15]. The data from these studies indicated a rapid increase in carbohydrate content in 1-year-old and current-season shoots immediately after full bloom in both “ON” and “OFF” trees. However, a noticeable decrease in carbohydrate content is observed in “ON” year trees about 100 Days After Full Bloom (DAFB), coinciding with the kernel development stage. The developing fruit is an important consumer of photoassimilates and acts as a strong sink. This idea is supported by the observation that plants with a high endogenous carbon-to-nitrogen ratio tend to promote flowering. In contrast, a low C:N (carbon-to-nitrogen) ratio favors vegetative growth [16].
Several studies have discussed the hypothesis of the involvement of carbon sinks in most AB species. However, the contradictory findings regarding the role of carbohydrates in AB phenomena necessitate further investigation. Moreover, it is crucial to consider different cultivars to gain deeper insights into the relationship between carbohydrates and AB, as there is a lack of definitive data supporting clear conclusions on the influence of carbohydrates on flower bud abscission in the Turkish cultivar ‘Uzun’. Therefore, the objective of this study was to analyze both soluble sugar and starch concentrations in order to investigate the correlation between flower bud abscission (AB) and carbohydrate levels, as well as the deprivation of buds during various growth periods.

2. Materials and Methods

2.1. Plant Materials

This study was conducted on six pistachio trees per “ON” and “OFF” year (Pistacia vera cv Uzun) that were 34 years old and grafted on P. vera rootstocks with uniform size and canopy at Dr. Ahmet Munir Experimental Area of Gaziantep Pistachio Research Centre during 2015-2016. To fully understand the AB mechanism, the flowers of OFF year trees were cut off artificially. The shoots, leaves, peduncles, and nuts were collected from “ON” and “OFF” year trees approximately 45 DAFB (Days After Full Bloom) in 10-day intervals from May to September (Table 1). Samples were fixed in a lyophilizer (Ilshin Lab. Co) for one week and were stored at +4 °C. To ensure a comprehensive interpretation of the findings, meteorological data for the study period were obtained from a public meteorological station within the orchards (Figure 1).

2.2. Methods

2.2.1. Determination of Starch Analysis

The enzymatic method of thermostable α-amylase and amyloglucosidase were used to determine the total amount of starch [17]. Two hundred µL of 80% aqueous ethanol was mixed with 100 mg of samples and shaken vigorously for 30 min. Three ml of diluted thermostable α-amylase was added immediately and incubated in boiling water for 12 min. In the next step, 0.1 mL of amyloglucosidase was added and incubated at 50 °C for 30 min. The volume of the solvent was adjusted to 10 mL with distilled water and then centrifuged at 3000 rpm for 10 min. In the next step, three ml of GOPOD reagent and 100 µL of the supernatant obtained were mixed. D-glucose was used as a control. The reagent and control samples were incubated at 50 °C for 20 min. Using a spectrophotometer, the absorbance of each sample was measured at 510 nm and compared with the absorbance of the reagent blank.

2.2.2. Determination of Soluble Sugar Analysis

To determine soluble sugars, 50 mg of dried ground samples were mixed with 2 mL of extraction solvent (50% acetonitrile in ultra-deionized water), shaken coarsely for 30 s, and incubated for 15 min in an ultrasonic water bath. The extract was then centrifuged, and the supernatant was filtered through a 0.45 μm membrane philter (Schleicher and Schuell GmbH, Dassel, Germany). The individual sugars were separated and detected using a CARBOSep COREGEL 87C column (7.8 × 100 mm) set at 75 °C and a refractive index detector connected to a chart recorder (Shimadzu, Kyoto, Japan). The extraction solvent was used as a mobile phase at a flow rate of 0.6 mL per minute. Mixed external standard solutions containing glucose, fructose, and sucrose in different concentrations were used as external standards and results were expressed as mg g−1 dry weight (d.w.)

2.2.3. Statistical Analysis

This study used a split-plot design to examine the effects of “On” and “Off” trees over time. The design involved a completely randomized block structure with one group consisting of “On” trees and another group consisting of “Off” trees. The experiment was repeated three times to ensure reliable results. Various statistical methods were used to analyze the data, including the Mann–Whitney U-test, principal component analysis (PCA), t-test, and logit regression using SPSS (version 11.0.1), XLSTAT (version 2013), and STATA (version 11) software. The Mann–Whitney U test was specifically used to investigate the potential statistical significance of carbohydrate levels in different organs between the “On” and “Off” trees. This non-parametric test was chosen due to the limited number of observations for each organ and the fact that the data did not meet the normality assumption.

3. Results

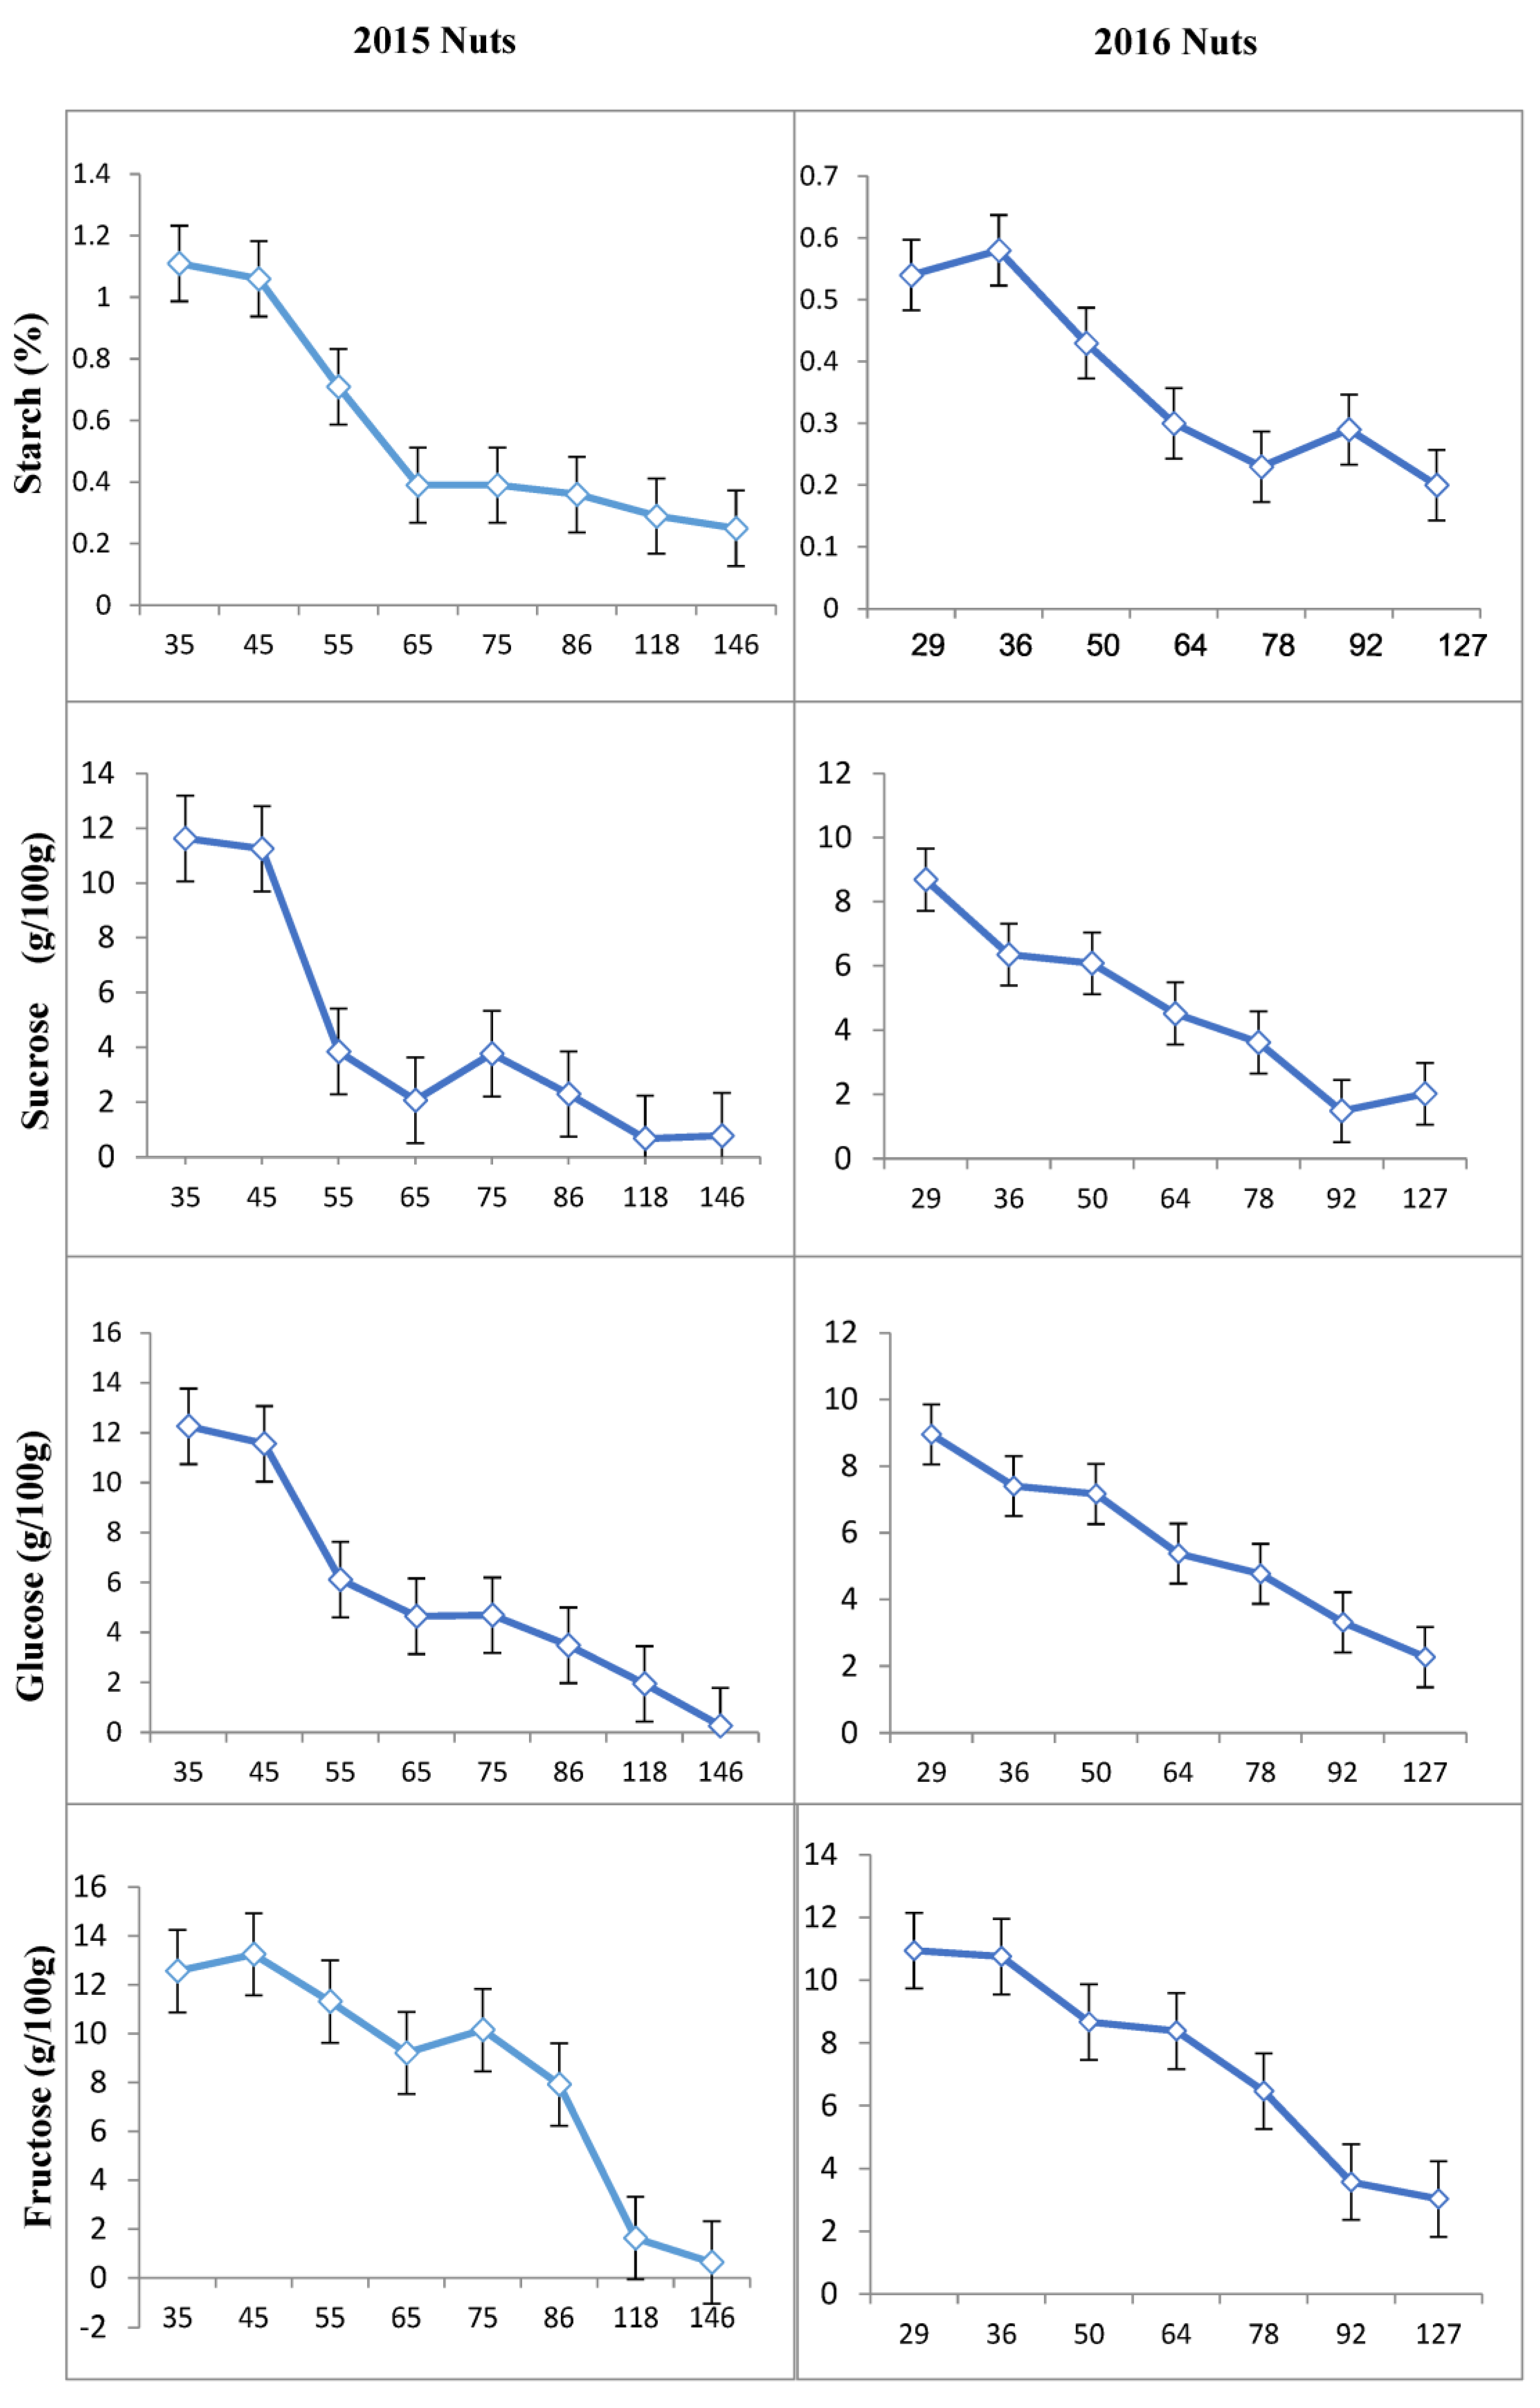
3.1. Concentration of Carbohydrates in Different Tissues of ‘Uzun’ Pistachio

The obtained results are presented in Figures, which illustrate the trends in the changes of starch (%) and soluble sugars (mg/100 g) across different sampling periods (DAFB). Statistically significant differences were found in the concentration of glucose, fructose, sucrose, and starch in different parts of the ‘Uzun’ pistachio cultivar during different growth stages (p < 0.05). After flowering, the starch concentrations in the leaves of both “OFF” and “ON” trees remained stable and relatively similar. However, during the last sampling period, an increase in starch concentration was observed in both “ON” and “OFF” years (Figure 2). Notably, it was found that the rate of increase was higher in the “ON” year than in the “OFF” year. Furthermore, in early July (about 90 DAFB), a decrease in starch concentration was observed in both “ON” and “OFF” years. This period coincided with the growth of the kernels, indicating a greater need for carbohydrates in the “ON” year. The amount of starch in shoots of “ON” and “OFF” trees was relatively similar until 75 DAFB, after which the concentration in the shoots of “ON” trees was constant and that of “OFF” trees continued to increase until 146 DAFB in 2015 (Figure 3).
The concentration of starch in shoots fluctuated, followed by two pronounced periods of decline about 60 and 90 DAFB (Figure 3). It is noteworthy that the starch concentration in the current shoot samples increased in both “ON” and “OFF” trees, with a higher rate of increase in “OFF” trees. This observation may be attributed to the extended period of the current shoot growth in “OFF” years. The starch content of nut samples initially reached a high level at the beginning of the season after full bloom, followed by a sharp decrease around 146 DAFB (year 2015) and 127 DAFB (year 2016), coinciding with the first phase of bud abscission (Figure 3).
The differences in early growing periods between years might be influenced by weather conditions, while the harvest date in 2016 was about one month earlier than in 2015. As a result, starch content gradually decreased and reached its minimum at harvest time.
In contrast to nut samples, the content of starch in peduncles was initially low in the spring after full bloom, followed by a sharp increase 86 DAFB in 2015 (Figure 4) and 64 DAFB in 2016 (Figure 4). However, this increase was followed by a decrease in the amount of starch during kernel development, reaching a similar level at the beginning of the season in 2015 and 2016. The patterns of changes in the amount of starch in fruits were the same in 2015 and 2016 (Figure 5).
The concentrations of sucrose, glucose, and fructose changed significantly in most organs during bud abscission and rapid seed growth from 2015 to 2016 (Figure 2, Figure 3, Figure 4 and Figure 5). Sucrose was the main sugar in the shoots and leaves. The level of sucrose was quite high in the shoots of “ON” trees (7.43 to 10.39 g/100 g) and was also present at considerable concentrations in the other tissues (Figure 3). Fructose content was the lowest sugar and ranged from 0.25 to 3.92 and 0.25 to 2.58 g/100 g in the shoots and leaves studied, respectively. Fructose contents were generally found to be higher than glucose and sucrose contents in peduncles and nuts (Figure 4 and Figure 5).
Based on the findings, the content of sucrose, glucose, and fructose was high during the initial sampling period (35 and 36 DAFB) in both “ON” and “OFF” trees, both in leaves and shoots. However, after some fluctuations, these sugar concentrations gradually decreased throughout the season in 2015 and 2016 (Figure 2 and Figure 3).
During the period of bud abscission and rapid seed growth, sucrose concentration exhibited a rapid decline, ultimately reaching very low levels in both shoots and leaves. Sucrose and fructose contents were relatively similar in leaves of “ON” and “OFF” trees. Generally, the sugar content in “OFF” year leaves was higher than in “ON”. However, in 2015, sucrose concentration in the leaves of the “OFF” year exhibited a decrease during the 65–86 DAFB period. Similarly, sucrose concentration in leaves of “ON” year decreased significantly during the 45–65 DAFB and 86–146 DAFB, coinciding with nut development (Figure 2).
In 2016, the sucrose content in the leaves of the “ON” year was higher at the beginning of the season than that in the leaves of the “OFF” year. However, as the season progressed, significant differences were statistically found between bearing and non-bearing years 64 DAFB. Following this period (64 DAFB), “ON” year leaves had lower sucrose contents than the leaves of “OFF” year. Similarly to 2015, the highest sucrose concentration was observed in “OFF” year trees 55 DAFB. There was also a significant difference in glucose concentration between the leaves of “ON” and “OFF” years in both 2015 and 2016, especially around 60 DAFB. Although the amount of fructose in the leaves of the “ON” year was higher than that in the “OFF” year, a sudden decrease was observed about 50 DAFB, followed by an increase for up to 64 DAFB in 2016. Subsequently, the concentration decreased again until harvest (Figure 2).
The sucrose content in the shoots of the “ON” year was higher at the beginning of the season than in the “OFF” year shoots. However, after about 60 DAFB, the sucrose content in the “ON” year shoots was lower than in the “OFF” year shoots. It is worth noting that sucrose concentration at harvest reached its minimum in both “ON” and “OFF” year shoots in 2015 and 2016. In the two periods between 35 and 65 DAFB and between 127 and 146 DAFB in 2015, corresponding to the two phases of nut development, glucose content in shoots was higher in “OFF” years than in “ON” years. Although there was a decreasing trend in glucose concentration, there was no statistically significant difference in glucose concentration between “ON” and “OFF” years during the period of 60–75 DAFB in 2015 (Figure 3). In 2016, a higher glucose concentration was observed in “ON” years at the beginning of the season. However, at 36 DAFB, the glucose concentration was significantly higher in “OFF” years compared to “ON” years (Figure 3).
The fructose content of shoots decreased during the season in both “ON” and “OFF” years and reached a minimum in all years studied. In 2015, the fructose content was higher in “ON” years than in “OFF” years between 35 and 55 DAFB. After that, however, no significant differences in fructose concentration were found between the “ON” and “OFF” years. In 2015, the fructose concentration was lower in the shoots of the “ON” year between 75 and 146 DAFB compared to the “OFF” year shoots. In contrast, in 2016, the fructose concentration in “OFF” years was significantly higher at the beginning of the season for up to 50 DAFB than in “ON” years. After that, no significant difference was found between “ON” and “OFF” years for up to 92 DAFB. Finally, from 92 to 147 DAFB, the fructose concentration was higher in “OFF” years than in “ON” years (Figure 3).
The sucrose content in the peduncles of “ON” years varied, ranging from 1.64 to 3.78 g/100 g in 2015 and from 3.49 to 5.82 g/100 g in 2016. The lowest sucrose concentration in peduncles was observed 86 DAFB in 2015 and 22 DAFB in 2016. On the other hand, the highest sucrose concentration in peduncles was observed in samples collected from 55 DAFB in 2015 and 50–92 DAFB in 2016. From 15 to 22 DAFB, sucrose concentration remained relatively stable, followed by a decrease for up to 36 DAFB. In 2016, the amount of sucrose in peduncles increased from 34 DAFB to 65 DAFB, and after a slight decrease, it increased again. However, in 2015, a decrease in the amount of sucrose in the peduncles was observed 86 DAFB. The glucose concentration in peduncles remained constant until 86 DAFB and then increased but decreased again in the last sampling period. The fructose concentration of peduncles steadily reduced throughout the season in all years studied (Figure 4).
The lowest sucrose concentration in the nuts was observed 118 DAFB in 2015 and 92 DAFB in 2016. On the other hand, the highest sucrose concentration was observed in samples collected at 35 DAFB in 2015 and 29 DAFB in 2016. According to the results, sucrose concentration in nuts decreased 35 DAFB and reached its minimum during the season after slightly increasing at the beginning of the season in both 2015 and 2016. Similarly, the lowest glucose concentration in nuts was recorded 146 DAFB in 2015 and 127 DAFB in 2016. The highest glucose was observed 35 DAFB in 2015 and 29 DAFB in 2016. After a slight increase 29 DAFB, glucose decreased 35 DAFB and reached its lowest level towards the end of the sampling period. However, an increase in glucose amount was observed again during the last sampling. The lowest concentration of fructose in nuts was found 146 DAFB in 2015 and 127 DAFB in 2016, whereas the highest amount was obtained 35 DAFB in 2015 and 29 DAFB in 2016. The fructose concentration was initially high in the early sampling periods and steadily decreased after 28 DAFB, reaching its minimum level near the harvest (Figure 5).

3.2. Mann–Whitney U Test Results

The Mann–Whitney U, a nonparametric test, was used to understand the statistically significant difference in sugars according to the explant source used in the “ON” and “OFF” years. According to the results of this test from the 2015 data, glucose in leaves (at a 10% significance level) differed statistically in “ON” and “OFF” year samples and were higher in “ON” years compared to “OFF” years (Table 2). In 2016, the only difference was observed in the concentration of glucose (at a 10% significance level) in shoots, which was higher in “OFF” years (Table 3).
Overall, the results of the pooled logit regression estimates for alternate bearing in 2015 and 2016 suggest that sucrose had a significant negative effect on alternate bearing in both 2015 and 2016. In addition, starch was found to have a significant negative effect on alternate bearing in 2016. However, there was no significant relationship between glucose, fructose, and alternate bearing in either year (Table 4).

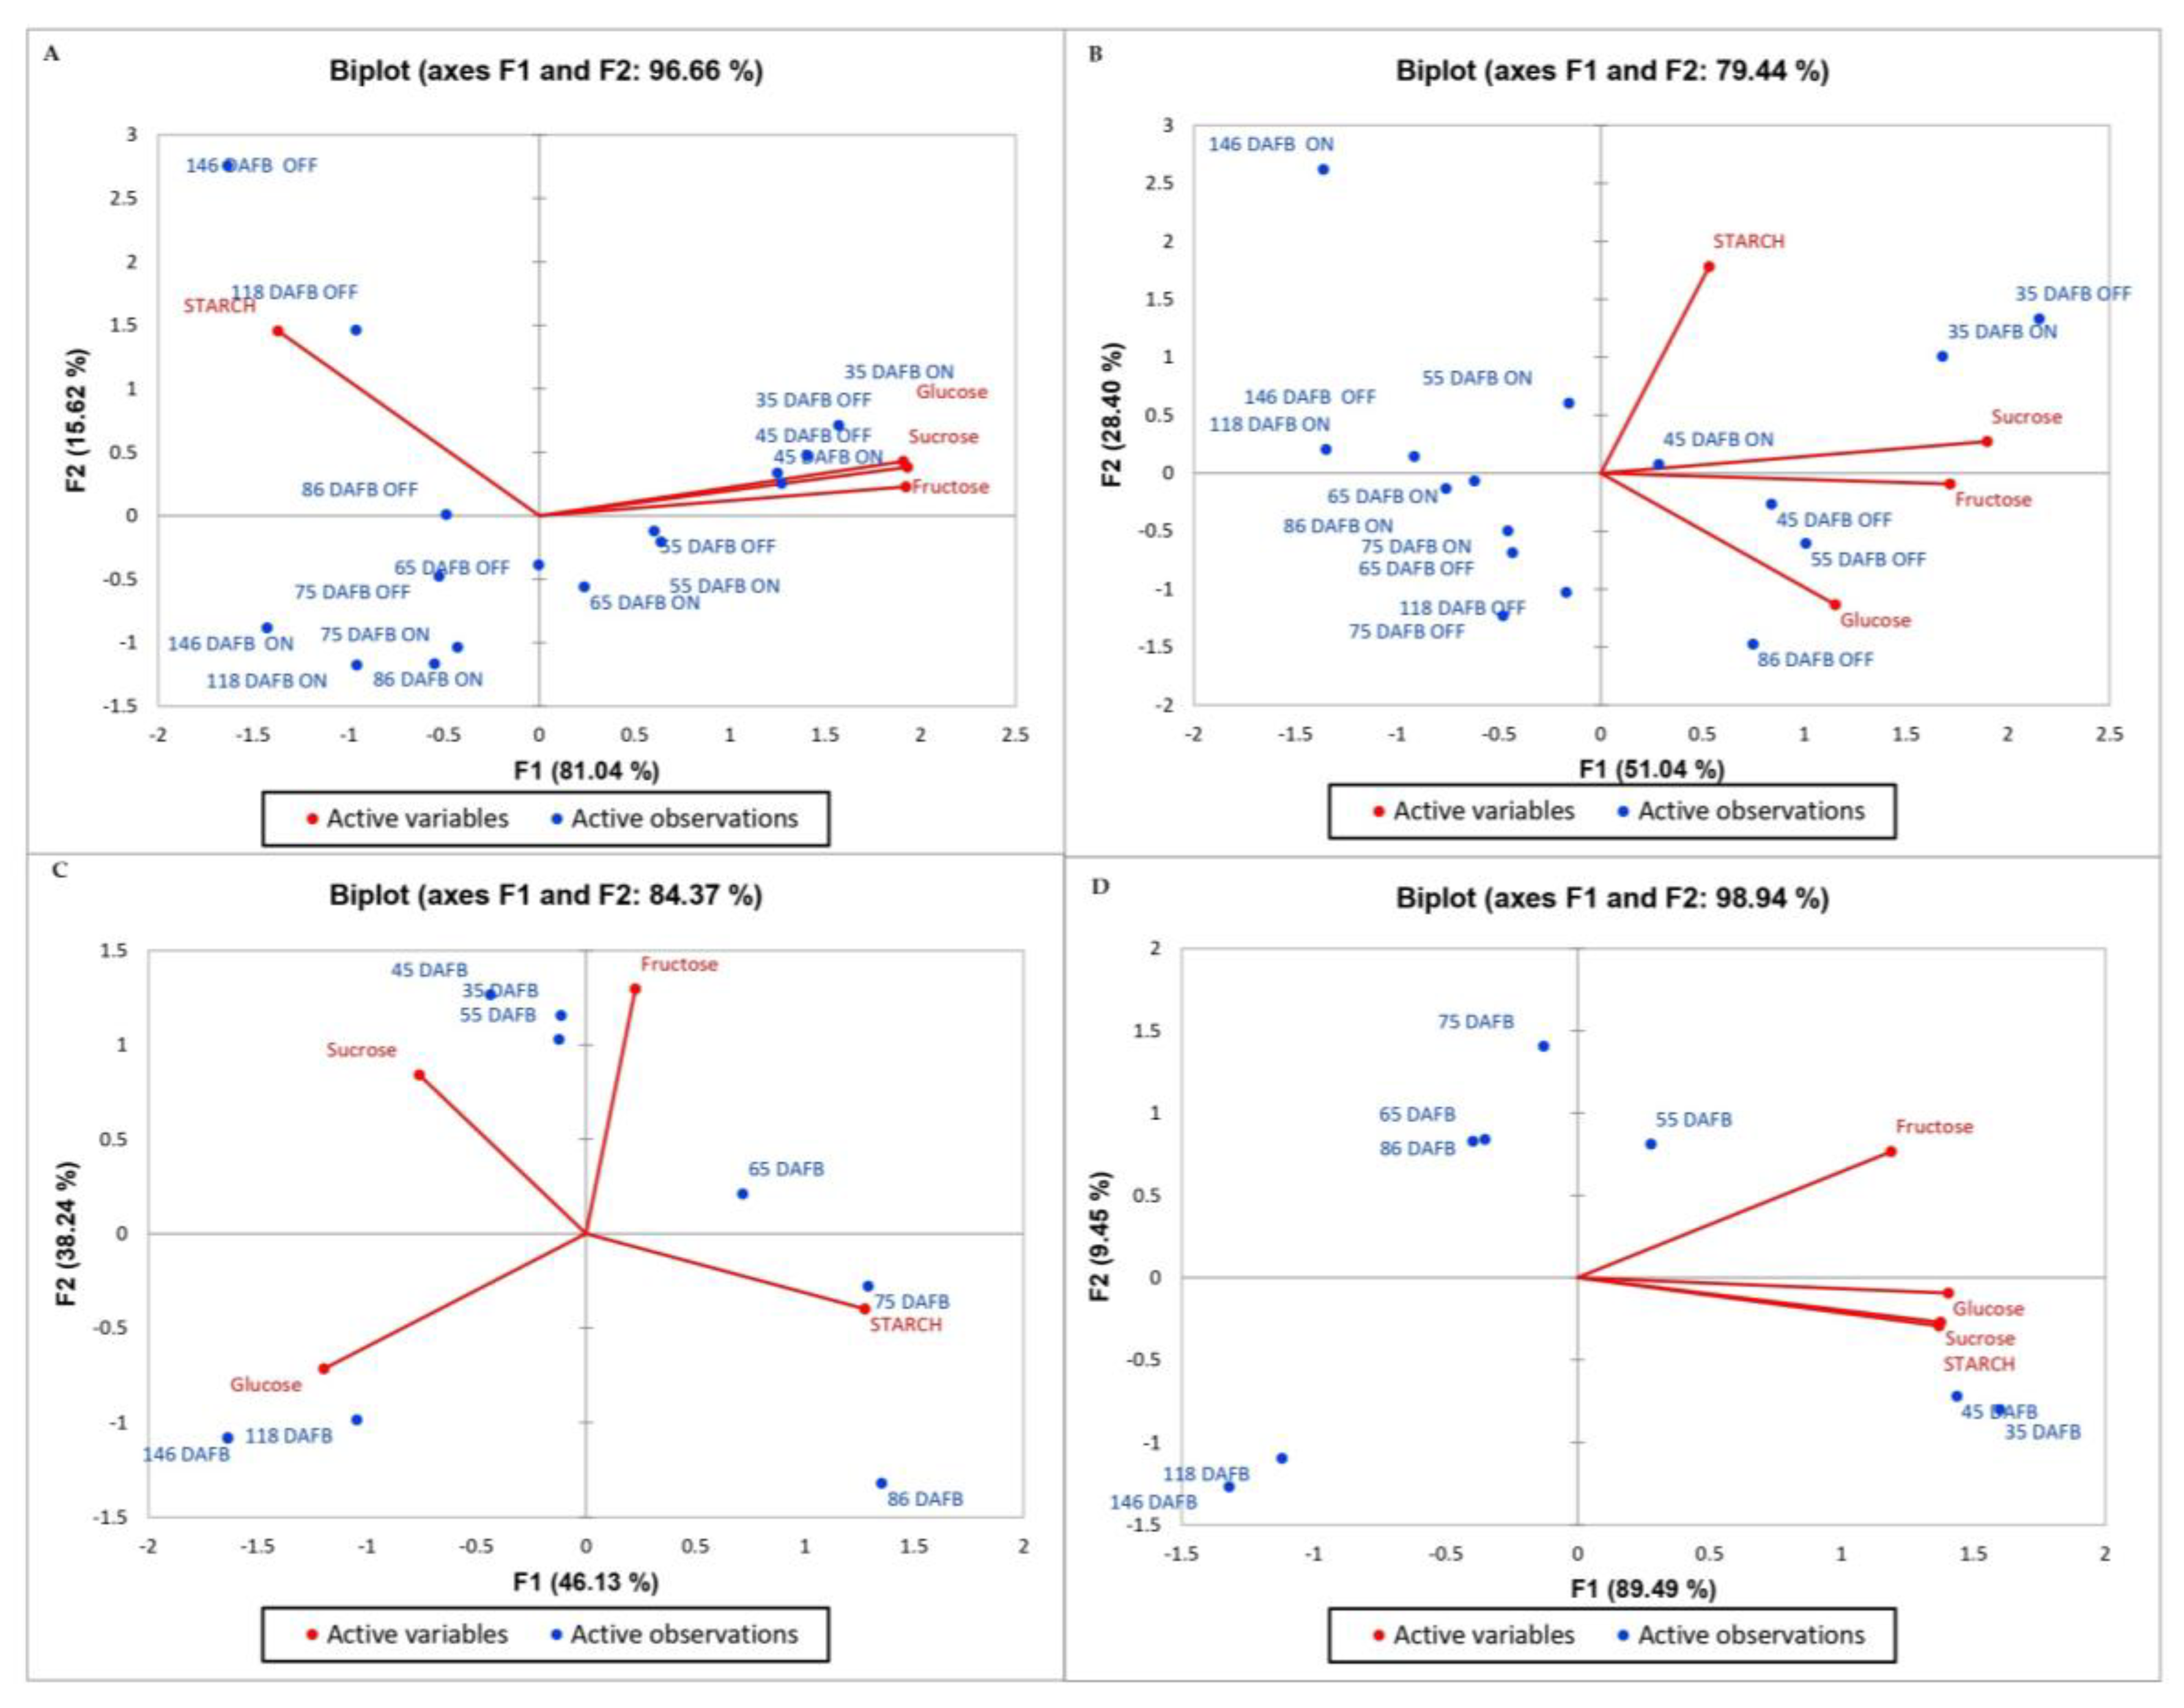
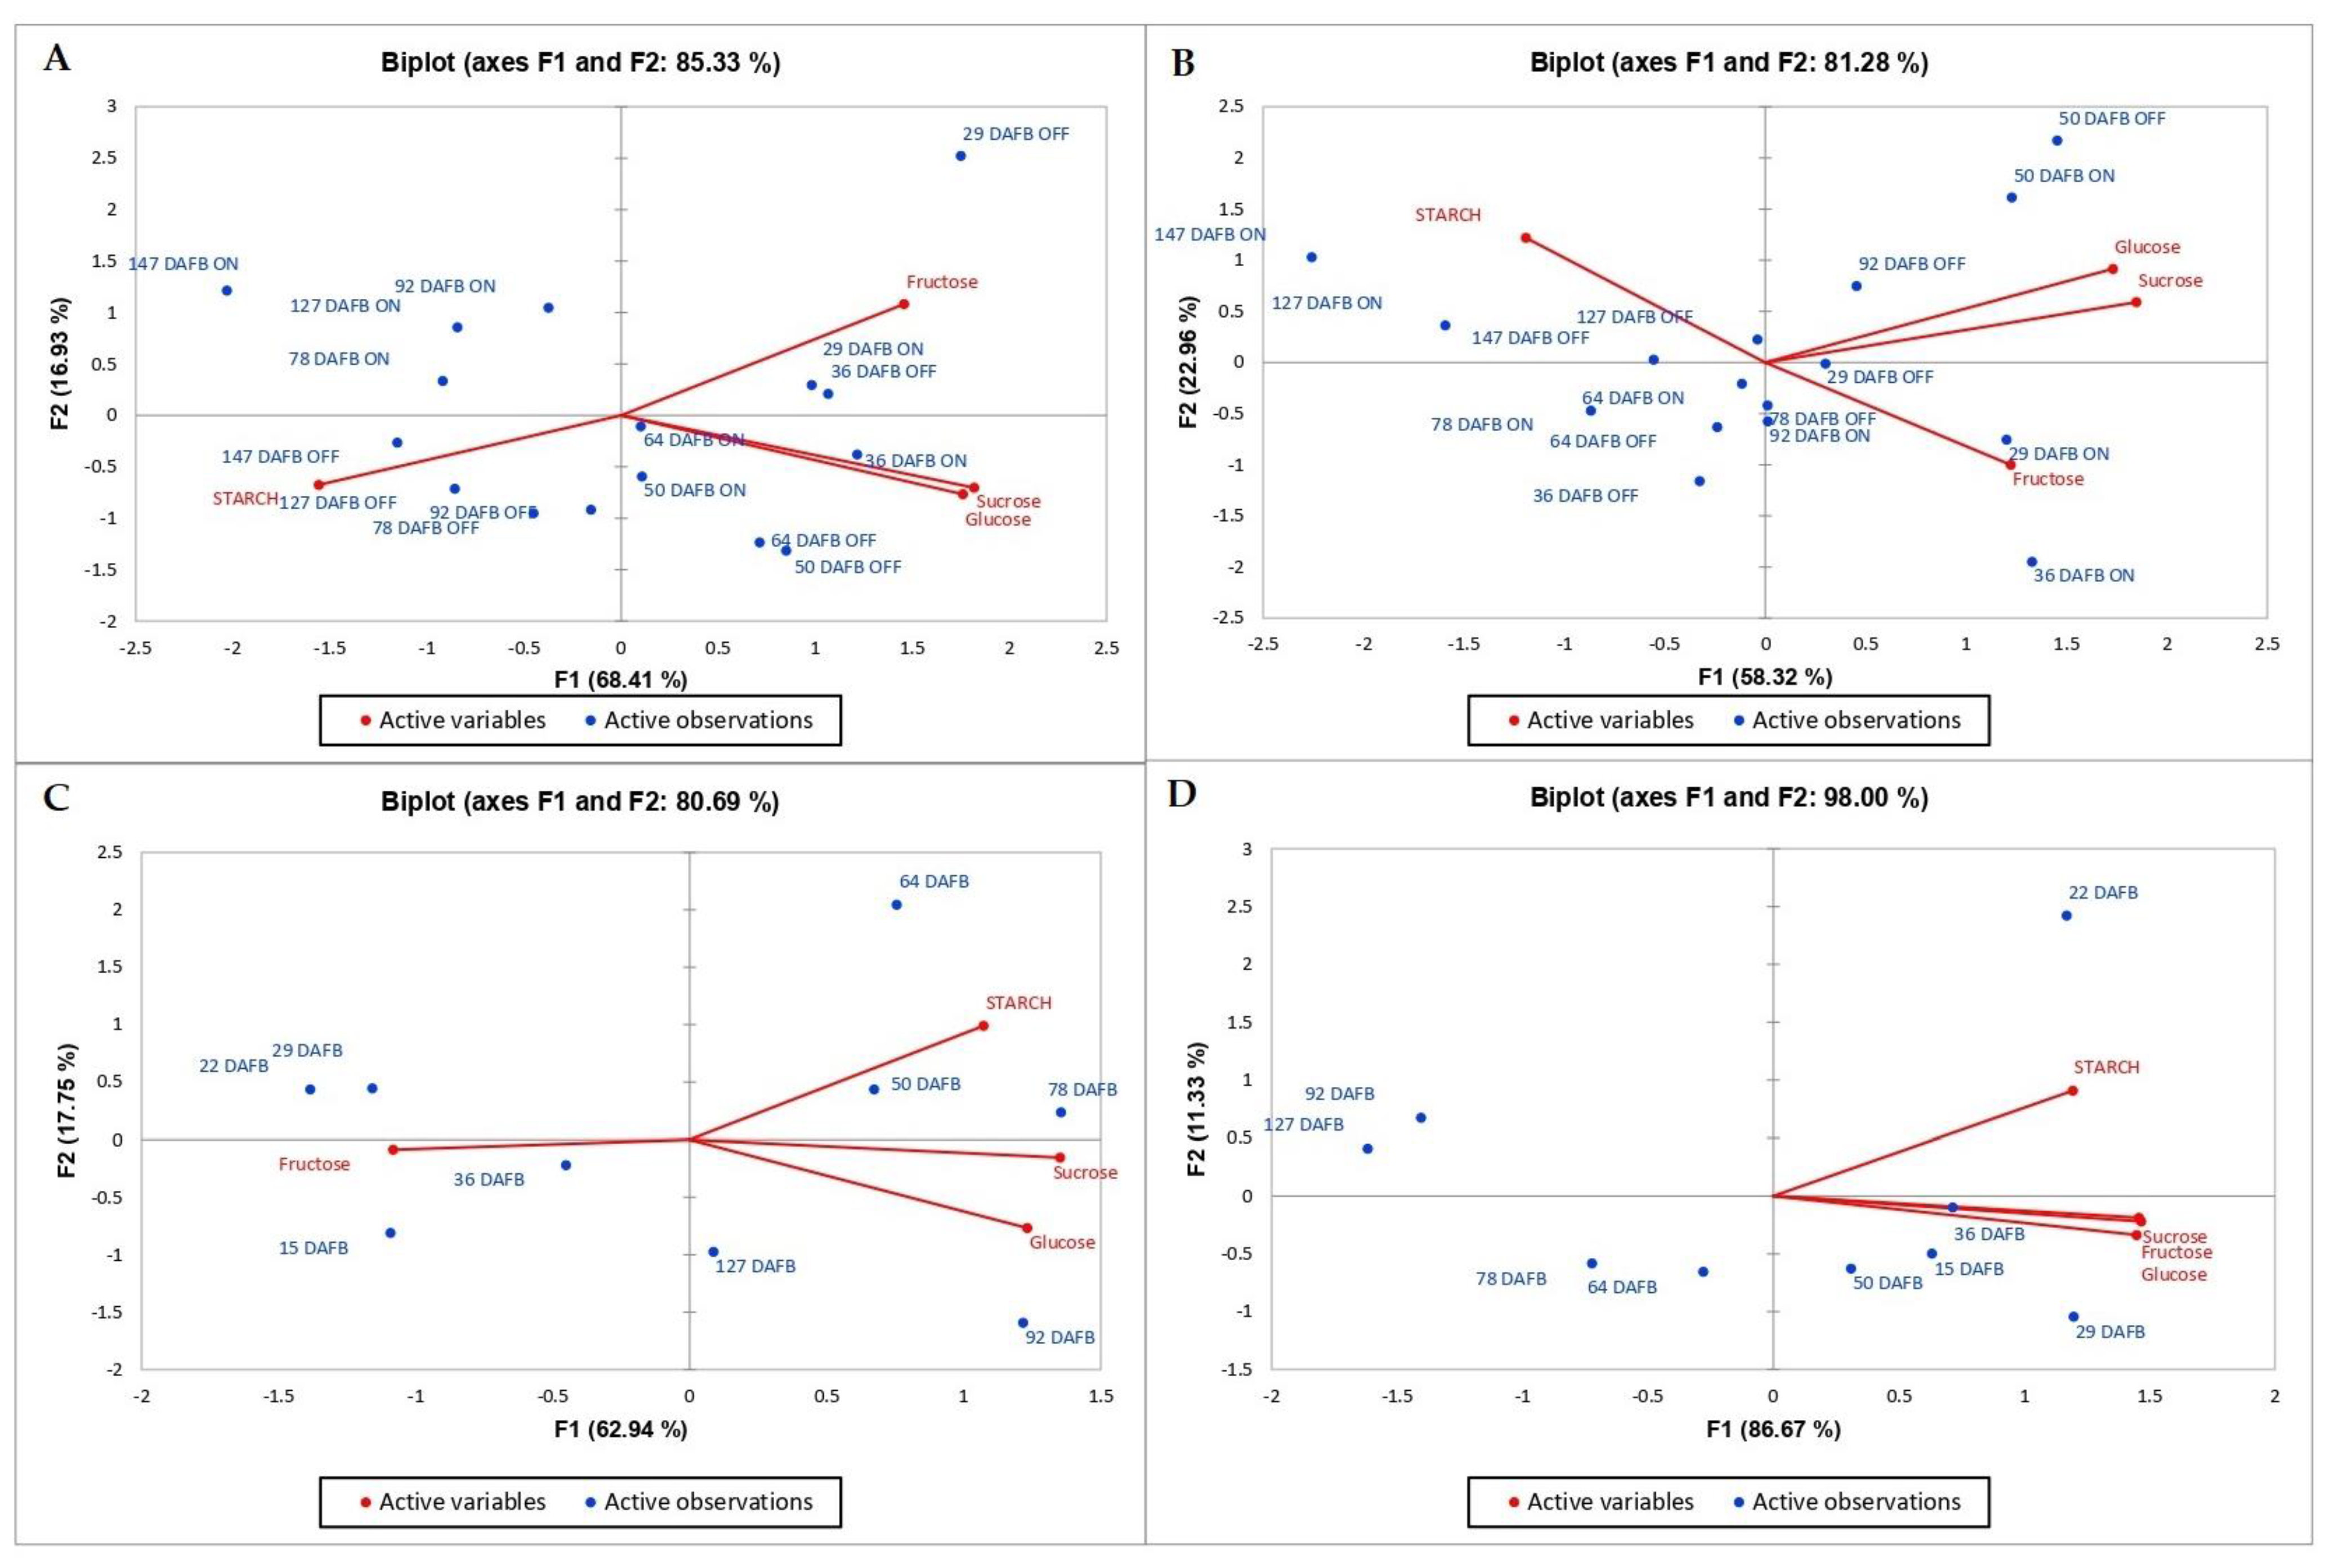
3.3. Principal Component Analysis

Principal component analysis (PCA) is a two-linear modeling method of multidimensional data. The original variables determine a smaller number of principal variables called principal components (CAMO Software AS, Oslo, Norway, 1998) [18]. PCA was conducted to assess the statistical effect of individual sugar compounds and starch content on the level of bud abscission in the ‘Uzun’ pistachio cultivar. (Figure 6 and Figure 7). In 2015, PC1 and PC2 explained 81.04% and 15.62% of the total variance in shoot samples. These two factors could explain 96.66% of the total variance. The correlation of sugars between each other was positive, but it was negative for starch. While sugars were higher in the first sampling dates (35–45–55), starch increased in the last days of “OFF” year trees (Figure 6). In 2016, PC1 could explain 68.41% of the total variance in shoots, whereas PC2 could explain 16.93%. These two components could explain 85.34% of the total variance. There was a strong positive correlation between sucrose and glucose. Starch was negatively correlated with all types of sugars. The amount of starch in the “Off” year was high in the last sampling days, whereas the amount of sugar decreased in the last sampling days of the “ON” year trees (Figure 7).
In 2015, PC1 and PC2 explained 51.04% and 28.40% of the total variance in leaves, respectively. The variance of the two factors was 79.44% of the total variance. There was a negative correlation between glucose and starch (Figure 6). In 2016, it was seen that PC1 and PC2 explained 58.32% and 22.96% of the total variance, respectively. The variance that the two factors could explain was 81.28% of the total variance. Many phenologies appeared to be lower in “ON” years and the last days of sampling dates. Starch was negatively associated with all sugar types, whereas glucose and sucrose were positively associated. Fructose and starch were positively correlated with each other (Figure 7).
In the year 2015, PC1 accounted for 46.13% of the total variance, whereas PC2 explained 38.24% of the variance in peduncle samples. These two components together may explain a total of 84.37% of the variance. Starch was negatively correlated with all sugar types. The correlation between fructose and glucose was also negative. While sucrose and fructose were high in the first days, starch increased afterward, and glucose was high in the last periods (Figure 7). In 2016, PC1 could explain 62.94% of the total variance, whereas PC2 could explain 17.75%. These two components could explain 80.69% of the total variance. Fructose was high during the first days and then decreased. In particular, sucrose and glucose increased during the last periods. Starch was positively correlated with those other than fructose, and fructose and other sugars were negatively correlated (Figure 6).
In 2015, PC1 and PC2 explained 89.49% and 9.45% of the total variance in nut samples. The variance of the two factors was 98.94% of the total variance. There was a positive correlation between all variables. However, the correlation of fructose was slightly less than the others. It appears that the variables were high during the first days of observation, after which their levels decreased (Figure 7). In 2016, PC1 and PC2 explained 86.67% and 11.33% of the total variance, respectively. The variance of the two factors was 98% of the total variance. All types of carbohydrates were positively correlated and were higher, especially during the first days, but decreased during the last sampling dates (Figure 6).

4. Discussion

Unlike other fruit types with AB, pistachio trees form abundant flower buds every year. However, the fruit buds dropped during kernel development during the “ON” years. It has been reported that excessive fruit-bud abscission in pistachio started in June, at the time of embryo development, and increased during July, causing the next year to be the “OFF year” [1,2,6,19].
Carbohydrate content may significantly influence the regulation of plant metabolic and developmental processes. While the exact mechanisms are not fully understood, it can be deduced that carbohydrates play an important role in determining fruit sets, albeit primarily via indirect means. This suggests that carbohydrate content often proves to be a notable limiting factor in the process of fruit set [20]. There is a common agreement that the reproductive and vegetative organs of deciduous tree species are formed and stored at significant rates of carbohydrate requirements from reserves during the initial growth and development. The role of carbohydrates in the abscission of flower buds of pistachio trees has been the subject of extensive research. In particular, the use of reserves by the AB is matchless because this includes vegetative growth during the non-bearing year and also involves the growth of nuts and the beginning and development of flower buds in the ‘ON’ years. Although the evidence is still indirect, it can be concluded that the carbohydrate level is usually an important factor that limits the special bud abscission and seasonal fluctuations in carbohydrate concentrations. Initially, Crane et al. [10] and Crane and Shalan [11] found that the concentrations of sugar and starch are similar in fruit and non-fruitful branches and showed that there is no relationship between carbohydrates and bud drops. However, this study was limited to measuring the carbohydrate level in the buds. In many other studies, contradictory and significant results were found. Takeda et al. [21], Nzima et al. [12], and Baninasab and Rahemi [5] suggested that the stage of bud drops coincides with the rapid seed growth period, probably due to the deficiency of carbohydrate concentration in flower buds. On the other hand, carbohydrate limitation is the primary cause of abscission and seems to be the critical factor [4]. Therefore, in this study, carbohydrate contents changed between different organs as a result of AB (“ON” and “OFF” years). The starch concentration increased in the current shoot samples in both the “ON” and the “OFF” trees. However, the increase rate was higher in the “OFF” year trees compared to “ON” trees. This discrepancy may possibly be attributed to the prolonged period of current shoot development in the “OFF” years. In “ON” years, the length of current shoots remained stable, whereas in “OFF” years, the length of current shoots increased throughout the season, leading to an increased demand for non-structural carbohydrates [19]. During the rapid growth phase in spring, Spann et al. [14] discovered that carbohydrate storage was lower in the branches of both “ON” and “OFF” years. However, in “OFF” years, the amount of stored carbohydrates increased during the first growth phase and remained high thereafter. Similar results were reported by Baninasab and Rahimi [5], who observed that the starch content in current shoots was lowest at the beginning of spring but increased during the growth and development phase in both “ON” and “OFF” years, with “OFF” year trees showing a higher rate of increase. These results are in line with previous studies by Baninasab and Rahimi [5] and Nzima et al. [12]. Interestingly, in “ON” years, starch content showed a transient increase at the beginning of summer, followed by a decline during fruit growth and a subsequent increase after harvest. These results contradict earlier studies by Crane et al. [10] and Crane and Shalan [11]. These significant results provide valuable insights into starch accumulation and storage dynamics in relation to different years and growth stages. They contribute to the existing body of knowledge while pointing out certain discrepancies with previous studies. The negative relationship obtained between fruit and peduncles is based on their starch content. Nuts had high concentrations of starch at the early sampling dates and then gradually decreased. In contrast to the nut samples, the starch content in peduncles was initially low during the early spring following full bloom. However, it exhibited a significant and rapid increase 86 DAFB in 2015 and 64 DAFB in 2016. Similar results were obtained for starch in different organs where “ON” and “OFF” trees had similar concentrations [5,12,22]. The concentration of starch in different studied organs indicates significant involvement of the carbohydrate budget during the annual cycle. Although the importance of carbohydrates in flower bud abscission has been demonstrated [12,21], the role of individual sugars in flowering and bud abscission was limited. In our study, the changes in individual sugars in “ON” and “OFF” years were examined and the most important differences were found. The results showed that individual sugar concentrations changed quite differently in different organs at both “ON” and “OFF” year trees. Sucrose is the dominant sugar in individual organs of the pistachio tree tested (Figure 2, Figure 3, Figure 4 and Figure 5). Our results agreed with those reported by Baninasab and Rahemi [5]. In this study, sucrose and fructose concentrations in almost all organs and content decreased rapidly during bud abscission and kernel development. The observed decrease in the amount of sugar during kernel development could be due to the accumulation of fats in the kernels. Crane et al. [10] previously reported that as the sugar content decreased, the fat content of the pistachio kernels simultaneously increased. These results shed light on the dynamic changes in sucrose, glucose, and fructose concentrations over time and shed light on the ripening process of pistachio kernels and the interplay between sugar and fat accumulation. The growth and development of pistachio fruits begin well before leaf photosynthetic adequacy and continue until almost harvested [23]. The fruit contained more carbohydrates than other organs. Nzima et al. [24] suggest that developing fruits derive carbon requirements from existing photo-assimilates and stored reserves. Consistent with the findings from previous studies, this study also observed a decrease in the concentration and change of sucrose, glucose, and fructose near harvest [5,10,19].
In pistachio trees, both vegetative and reproductive development relies on reserves from the previous season, as mentioned earlier [14]. Consequently, sucrose, being the initial product of photosynthesis, is mobilized in various organs to compensate for any deficits in reserves. The study’s overall findings support the potential role of carbohydrates in triggering alternate bearing (AB) in pistachio trees. However, it is essential not to overlook the influence of environmental conditions on these results. As highlighted in Figure 1, there was a notable difference in average temperatures in June between the two years, with 2016 experiencing higher temperatures. Such temperature variations can impact photosynthesis by affecting stomatal closure and, subsequently, the efficiency of photosynthesis.
Consequently, these environmental factors may have contributed to the observed differences in the patterns of individual sugars in 2016. It is widely accepted that sucrose serves as the primary sugar transported in most plants [25]. Since fruits act as significant carbohydrate sinks, it is likely that sucrose is translocated from flower buds to developing fruits [21]. Nzima et al. [24] discovered that about 60% of pistachio nuts had abscised 30 DAFB, which coincided with the accumulation of soluble sugars in the leaves of “ON” trees. In addition, Baninasab and Rahimi [5] reported that sucrose concentration in leaves remained high 40 DAFB, followed by a subsequent decline in both “ON” and “OFF” years, although sucrose content was higher in “ON” years. Notably, the leaves of “OFF” trees had a higher content of soluble sugars and starch than the leaves of “ON” year during harvest time. These results are in agreement with the results reported by Schaffer et al. [26], Baninasab and Rahimi [5], and Spann et al. [14]. This particular period probably corresponds to the second phase of nut development, which includes lignification of the endocarp and kernel growth. During this phase, there is probably a rapid decline in sucrose content, similar to the decrease observed in the vegetative phase.
While our study aimed to address a crucial aspect that could help uncover the mechanisms of alternate bearing (AB) and corroborate previous findings, it has certain limitations. These limitations include external factors, temporal scope, and geographic scope. The study may not comprehensively account for all external factors influencing alternate bearing patterns, such as pests, diseases, or other environmental variables. Additionally, our research might have a restricted time frame, potentially limiting the exploration of long-term trends or cyclical patterns related to AB. Furthermore, our findings may not have universal applicability, as regional disparities in pistachio cultivation practices and environmental conditions can influence alternate bearing differently in various areas. As a result, this study underscores the significance of further research endeavors aimed at unraveling the AB phenomenon in important hard-shelled fruits like pistachios.

5. Conclusions

This research has addressed a critical and complicated issue that challenges pistachio cultivation, commonly referred to as alternate bearing. By recognizing the crucial role of carbohydrates in plant reserve allocation, we conducted a comprehensive investigation into the dynamics of carbohydrate concentrations during the process of flower bud abscission in ‘Uzun’ pistachio trees, encompassing both bearing and non-bearing conditions. This endeavor has provided valuable insights into the physiological mechanisms underpinning alternate bearing (AB) during flower bud abscission and kernel development. Our findings have not only substantiated prior research but have also shed light on the intricate relationship between carbohydrate levels and bud abscission. Notably, “ON” trees, which undergo significant bud abscission and initial kernel development, tend to exhibit markedly lower carbohydrate concentrations across various organs than “OFF” trees. The observed inverse relationship between carbohydrate content and bud abscission suggests that the abscission mechanism may be triggered when carbohydrate levels fall below a certain threshold. However, it is imperative to acknowledge that fluctuations in temperature and other environmental variables can influence carbohydrate dynamics. While this research has contributed valuable insights, it is essential to underscore the need for further studies to delve into various aspects of the processes involved in alternate bearing. Exploring factors such as hormones, other compounds, and gene expression levels holds promise for advancing our understanding of this complex phenomenon. Such investigations will undoubtedly enhance our ability to manage and optimize pistachio cultivation practices in the future.

Author Contributions

Conceptualization, N.E.K. and S.K.; methodology, M.G. (Mujgan Guney) and M.G. (Murat Guney); software, M.G. (Mujgan Guney); formal analysis, M.G. (Mujgan Guney); investigation, M.A.G.; writing—original draft preparation, M.G. (Mujgan Guney); writing—review and editing, M.G. (Mujgan Guney); supervision, S.K.; project administration, N.E.K. All authors have read and agreed to the published version of the manuscript.

Funding

This research was funded by grants from the General Directorate of Agricultural Research and Policies of Turkey (No. TAGEM/BBAD/14/A10/P01) and Cukurova University Scientific Research Projects (Turkey) (FDK-2017-8721).

Institutional Review Board Statement

Not applicable.

Informed Consent Statement

Not applicable.

Data Availability Statement

All associated data have been included in the text.

Conflicts of Interest

The authors declare no conflict of interest.

References

  1. Gundesli, M.A.; Kafkas, S.; Zarifikhosroshahi, M.; Kafkas, N.E. Role of endogenous polyamines in the alternate bearing phenomenon in pistachio. Turk. J. Agric. For. 2019, 43, 265–274. [Google Scholar] [CrossRef]
  2. Jangid, R.; Kumar, A.; Masu, M.M.; Kanade, N.; Pant, D. Alternate Bearing in Fruit Crops: Causes and Control Measures. Asian J. Agric. Res. 2023, 10, 10–19. [Google Scholar] [CrossRef]
  3. Sharma, N.; Singh, S.K.; Mahato, A.K.; Ravishankar, H.; Dubey, A.K.; Singh, N.K. Physiological and molecular basis of alternate bearing in perennial fruit crops. Sci. Hortic. 2019, 243, 214–225. [Google Scholar] [CrossRef]
  4. Haim, D.; Shalom, L.; Simhon, Y.; Shlizerman, L.; Kamara, I.; Morozov, M.; Sadka, A. Alternate bearing in fruit trees: Fruit presence induces polar auxin transport in citrus and olive stem and represses IAA release from the bud. J. Exp. Bot. 2021, 72, 2450–2462. [Google Scholar] [CrossRef]
  5. Ali, H.; Abbas, A.; Rehman, A.U. Alternate bearing in fruit plants. J. Agric. Biol. Sci. 2022, 1, 1–6. [Google Scholar] [CrossRef]
  6. Baninasab, B.; Rahemi, M. Possible role of non-structural carbohydrates in alternate bearing of pistachio. Eur. J. Hortic. Sci. 2006, 71, 277–282. [Google Scholar]
  7. Vemmos, S.N. Alternate bearing and the possible role of carbohydrates in bud abscission of pistachio (Pistacia vera L.). In Proceedings of the XIV GREMPA Meeting on Pistachios and Almonds, Zaragoza: CIHEAM/FAO/AUA/TEI Kalamatas/NAGREF, Athens, Greece, 30 March–5 April 2010; Volume 94, pp. 9–18. [Google Scholar]
  8. Zhu, J.; Gou, F.; Rossouw, G.; Begum, F.; Henke, M.; Johnson, E.; Seleznyova, A. Simulating organ biomass variability and carbohydrate distribution in perennial fruit crops: A comparison between the common assimilate pool and phloem carbohydrate transport models. Silico Plants 2021, 3, diab024. [Google Scholar] [CrossRef]
  9. Goyal, R.K.; Bishnoi, C. Assimilate partitioning and distribution in fruit crops: A review. J. Pharmacogn. Phytochem. 2017, 6, 479–484. [Google Scholar]
  10. Kozlowski, T.T. Carbohydrate sources and sinks in woody plants. Bot. Rev. 1992, 58, 107–222. [Google Scholar] [CrossRef]
  11. Crane, J.C.; Catlin, P.B.; Alshalan, I. Carbohydrate levels in the pistachio as related to alternate bearing. J. Am. Soc. Hort. Sci. 1976, 101, 371–374. [Google Scholar] [CrossRef]
  12. Crane, J.C.; Al Shalan, I.M. Carbohydrate and nitrogen levels in pistachio as related to shoot extension and yield. J. Am. Soc. Hort. Sci. 1977, 102, 396–399. [Google Scholar] [CrossRef]
  13. Nzima, M.D.; Martin, G.C.; Nishijima, C. Leaf development, dry matter accumulation, and distribution within branches of alternate-bearing ‘kerman’ pistachio trees. J. Am. Soc. Hortic. Sci. 1997, 122, 31–37. [Google Scholar] [CrossRef]
  14. Mahvelati, N.M.; Archer, L.F.; Marino, G.; Fichtner, E.; Ferguson, L. Pistachio inflorescence bud abscission dynamics as a function of embryo weight, crop load and vegetative growth. Acta Hortic. 2018, 1229, 349–354. [Google Scholar] [CrossRef]
  15. Spann, T.M.; Beede, R.H.; DeJong, T.M. Seasonal carbohydrate storage and mobilization in bearing and non-bearing pistachio (Pistacia vera) trees. Tree Physiol. 2008, 28, 207–213. [Google Scholar] [CrossRef] [PubMed]
  16. Vittal, H.; Sharma, N.; Dubey, A.K.; Shivran, M.; Singh, S.K.; Meena, M.C.; Sharma, R.M. Rootstock-mediated carbohydrate metabolism, nutrient contents, and physiological modifications in regular and alternate mango (Mangifera indica L.) scion varieties. PLoS ONE 2023, 18, e0284910. [Google Scholar] [CrossRef]
  17. Vemmos, S.N. Effects of shoot girdling on bud abscission, carbohydrate and nutrient concentrations in pistachio (Pistacia vera L.). J. Hortic. Sci. Biotech. 2005, 80, 529–536. [Google Scholar] [CrossRef]
  18. Mccleary, B.V.; Gibson, T.S.; Mugford, D.C. Measurement of total starch in cereal products by amyloglucosidase—α-amylase method: Collaborative study. J. AOAC Int. 1997, 80, 571–579. [Google Scholar] [CrossRef]
  19. Kara, D. Evaluation of trace metal concentrations in some herbs and herbal teas by principal component analysis. Food Chem. 2009, 114, 347–354. [Google Scholar] [CrossRef]
  20. Gundesli, M.A. Determination of Sugar, Total Phenol contents-and Antioxidant Activity of various parts ‘Uzun’ pistachio cultivar (Pistacia vera L.). Int. J. Agric. Environ. Food Sci. 2020, 4, 62–69. [Google Scholar]
  21. Sakr, S.; Wang, M.; Dédaldéchamp, F.; Perez-Garcia, M.D.; Ogé, L.; Hamama, L.; Atanassova, R. The sugar-signaling hub: Overview of regulators and interaction with the hormonal and metabolic network. Int. J. Mol. Sci. 2018, 19, 2506. [Google Scholar] [CrossRef]
  22. Takeda, F.; Crane, J.C. Abscisic acid in pistachio as related to inflorescence bud abscission [and consequent alternate bearing]. J. Am. Soc. Hortic. Sci. 1980, 105, 573–576. [Google Scholar] [CrossRef]
  23. Gómez-González, S.; Ruiz-Jiménez, J.; Priego-Capote, F.; Luque de Castro, M.D. Qualitative and quantitative sugar profiling in olive fruits, leaves, and stems by gas chromatography-tandem mass spectrometry (GC-MS/MS) after ultrasound-assisted leaching. J. Agric. Food Chem. 2010, 58, 12292–12299. [Google Scholar] [CrossRef]
  24. Nzima, M.D.; Martin, G.C.; Nishijima, C. Seasonal changes in total nonstructural carbohydrates within branches and roots of naturally “OFF” and “ON” Kerman’ pistachio trees. J. Am. Soc. Hortic. Sci. 1997, 122, 856–862. [Google Scholar] [CrossRef]
  25. Ho, L.C.; Baker, D.A. Regulation of loading and unloading in long distance transport systems. Phys. Plant 1982, 56, 225–230. [Google Scholar] [CrossRef]
  26. Schaffer, A.A.; Goldschmidt, E.E.; Goren, R.; Galili, D. Fruit set and carbohydrate status in alternate and nonalternate bearing Citrus cultivars. J. Am. Soc. Hort. Sci. 1985, 110, 574–578. [Google Scholar] [CrossRef]
Figure 1. Metrological data of experiment field during season (2015 and 2016).
Sustainability 15 15300 g001
Figure 2. Changes in starch and individual sugar content of leaves in the “OFF” and “ON” year of “Uzun” pistachio trees in two successive years. Bars indicate ± SE. X-axis indicates DAFB: Days After full bloom.
Sustainability 15 15300 g002
Figure 3. Changes in starch and individual sugar content of shoots in the “OFF” and “ON” years of “Uzun” pistachio trees in two successive years. Bars indicate ± SE. X-axis indicates DAFB: Days After Full Bloom.
Sustainability 15 15300 g003
Figure 4. Changes in starch and individual sugar content of peduncles in the “ON” year of “Uzun” pistachio trees in two successive years. Bars indicate ± SE. X-axis indicates DAFB: Days After Full Bloom.
Sustainability 15 15300 g004
Figure 5. Changes in starch and individual sugar content of nuts in the “ON” year of “Uzun” pistachio trees in two successive years. Bars indicate ± SE. X-axis indicates DAFB: Days After Full Bloom.
Sustainability 15 15300 g005
Figure 6. Biplot graph obtained from the principal component analysis: (A) shoot, (B) leaf, (C) ped, and (D) nut (2015).
Sustainability 15 15300 g006
Figure 7. Biplot graph obtained from the principal component analysis: (A) shoot, (B) leaf, (C) ped, and (D) nut (2016).
Sustainability 15 15300 g007
Table 1. Periods of sampling in two successive years.
Year 2015Year 2016
Date* DAFBDateDAFB
--22 April15
--29 April22
15 May356 May29
25 May4513 May36
4 June5527 May50
14 June6510 June64
24 June7524 June78
5 July868 July92
6 August11812 August127
3 September1461 September147
* DAFB represents the Days After Full Bloom. Full bloom dates: 10 April 2015 and 8 April 2016.
Table 2. The results of Mann–Whitney U test (2015).
SucroseGlucoseFructoseStarch
shootMann–Whitney U28.50027.00031.00021.000
Wilcoxon W64.50063.00067.00057.000
Z−0.368−0.525−0.105−1.155
Asymp. Sig. (2-tailed)0.7130.6000.9160.248
leafMann–Whitney U22.0003.00025.00025.000
Wilcoxon W58.00039.00061.00061.000
Z−1.050−3.046−0.736−0.747
Asymp. Sig. (2-tailed)0.2940.0020.4620.455
Table 3. The results of Mann–Whitney U test (2016).
SucroseGlucoseFructoseStarch
shootMann–Whitney U23.00016.00023.50020.500
Wilcoxon W59.00052.00059.50056.500
Z−0.945−1.680−0.893−1.209
Asymp. Sig. (2-tailed)0.3450.0930.3720.227
leafMann–Whitney U27.00025.50028.00023.500
Wilcoxon W63.00061.50064.00059.500
Z−0.525−0.684−0.421−0.897
Asymp. Sig. (2-tailed)0.6000.4940.6740.370
Table 4. Pooled logit regression estimations.
Regression Estimated for 2015 Regression Estimated for 2016
sucrose−0.737 ***−1.337 *
(0.072)(0.022)
glucose−0.261−0.343
(0.570)(0.580)
fructose0.5800.664
(0.113)(0.130)
starch−0.894−1.354 *
(0.128)(0.027)
_cons6.406 ***9.824 *
(0.060)(0.023)
N4848
LR Statistics18.55 *** (0.0696)24.24 ** (0.0117)
Pseudo R20.3040.3967
Hosmer–Lemeshow Test Chi-Square 37.35 (0.4067)36.69 (0.4366)
p-values in parentheses; * p < 0.05, ** p < 0.01, and *** p < 0.001.
Disclaimer/Publisher’s Note: The statements, opinions and data contained in all publications are solely those of the individual author(s) and contributor(s) and not of MDPI and/or the editor(s). MDPI and/or the editor(s) disclaim responsibility for any injury to people or property resulting from any ideas, methods, instructions or products referred to in the content.

