Abstract
Electrified transportation systems are emerging quickly worldwide, helping to diminish carbon gas emissions and paving the way for the reduction of global warming possessions. Battery remaining useful life (RUL) prediction is gaining attention in real world applications to tone down maintenance expenses and improve system reliability and efficiency. RUL forms the prominent component of fault analysis forecast and health management when the equipment operation life cycle is considered. The uprightness of RUL prediction is vital in providing the effectiveness of electric batteries and reducing the chance of battery illness. In assessing battery performance, the existing prediction approaches are unsatisfactory even though the battery operational parameters are well tabulated. In addition, battery management has an important contribution to several sustainable development goals, such as Clean and Affordable Energy (SDG 7), and Climate Action (SDG 13). The current work attempts to increase the prediction accuracy and robustness with selected machine learning algorithms. A Real battery life cycle data set from the Hawaii National Energy Institute (HNEI) is used to evaluate accuracy estimation using selected machine learning algorithms and is validated in Google Co-laboratory using Python. Evaluated error metrics such as Mean Square Error (MSE), Root Mean Square Error (RMSE), Mean Absolute Error (MAE), R-Squared, and execution time are computed for different L methods and relevant inferences are presented which highlight the potential of battery RUL prediction close to the most accurate values.
1. Introduction
One of the major challenges facing society today is reducing greenhouse gas emissions Which has prompted the industry’s top producers to promote the progress of electric vehicles (EVs). Since the majority of end user electronics are motorized by battery-like technology, and the use of renewable energy sources to generate electricity is expanding quickly, energy storage has emerged as one of the key sectors. Due to their high energy density and lengthy cyclical and calendrical lifetime, lithium-ion batteries (LIBs), which are efficient energy storage systems, have assumed a leading position in powering EVs. RUL is the required amount of time, which is commonly calculated using the numerical subsequent charge–discharge cycles, from the active profile point to the end of a battery’s life. A battery’s lifespan ends when its remaining capacity reaches 70–80% of its initial value, according to a widely accepted generalization. RUL is a well-liked research area in the realm of electric battery research because it has an obvious significance for the assessment of the safety of batteries. The length of time a machine or asset is liable to function before needing repair or substituent is known as the remaining useful life (RUL). In addition, it is important to highlight that good management and prediction of battery use can significantly contribute to improving the efficiency and sustainability of energy storage systems, promoting the adoption of clean energy, reducing emissions, and encouraging innovation and collaboration [1]. In this way, its contribution to several sustainable development goals is interesting, including, for example, Clean and Affordable Energy (SDG 7), and Climate Action (SDG 13) [2]. The Battery RUL problem is directly related to SDG 7 by supporting the development and deployment of affordable, reliable, and clean energy solutions. In systems relying on batteries, knowing the remaining useful life allows for efficient planning and operation. By optimizing the use of batteries and extending their useful life, we can enhance the sustainability of energy systems, promote renewable energy adoption, and work toward the achievement of SDG 7’s targets for universal access to clean and affordable energy [3]. In the same vein, solving the Battery RUL problem contributes to SDG 13 by supporting efforts to combat climate change, promote renewable energy, reduce greenhouse gas emissions, and enhance resilience in the face of climate-related challenges. By extending the useful life of batteries and optimizing their use, we can minimize the environmental and economic impact of battery-related activities and contribute to a more sustainable and climate-resilient future [4].
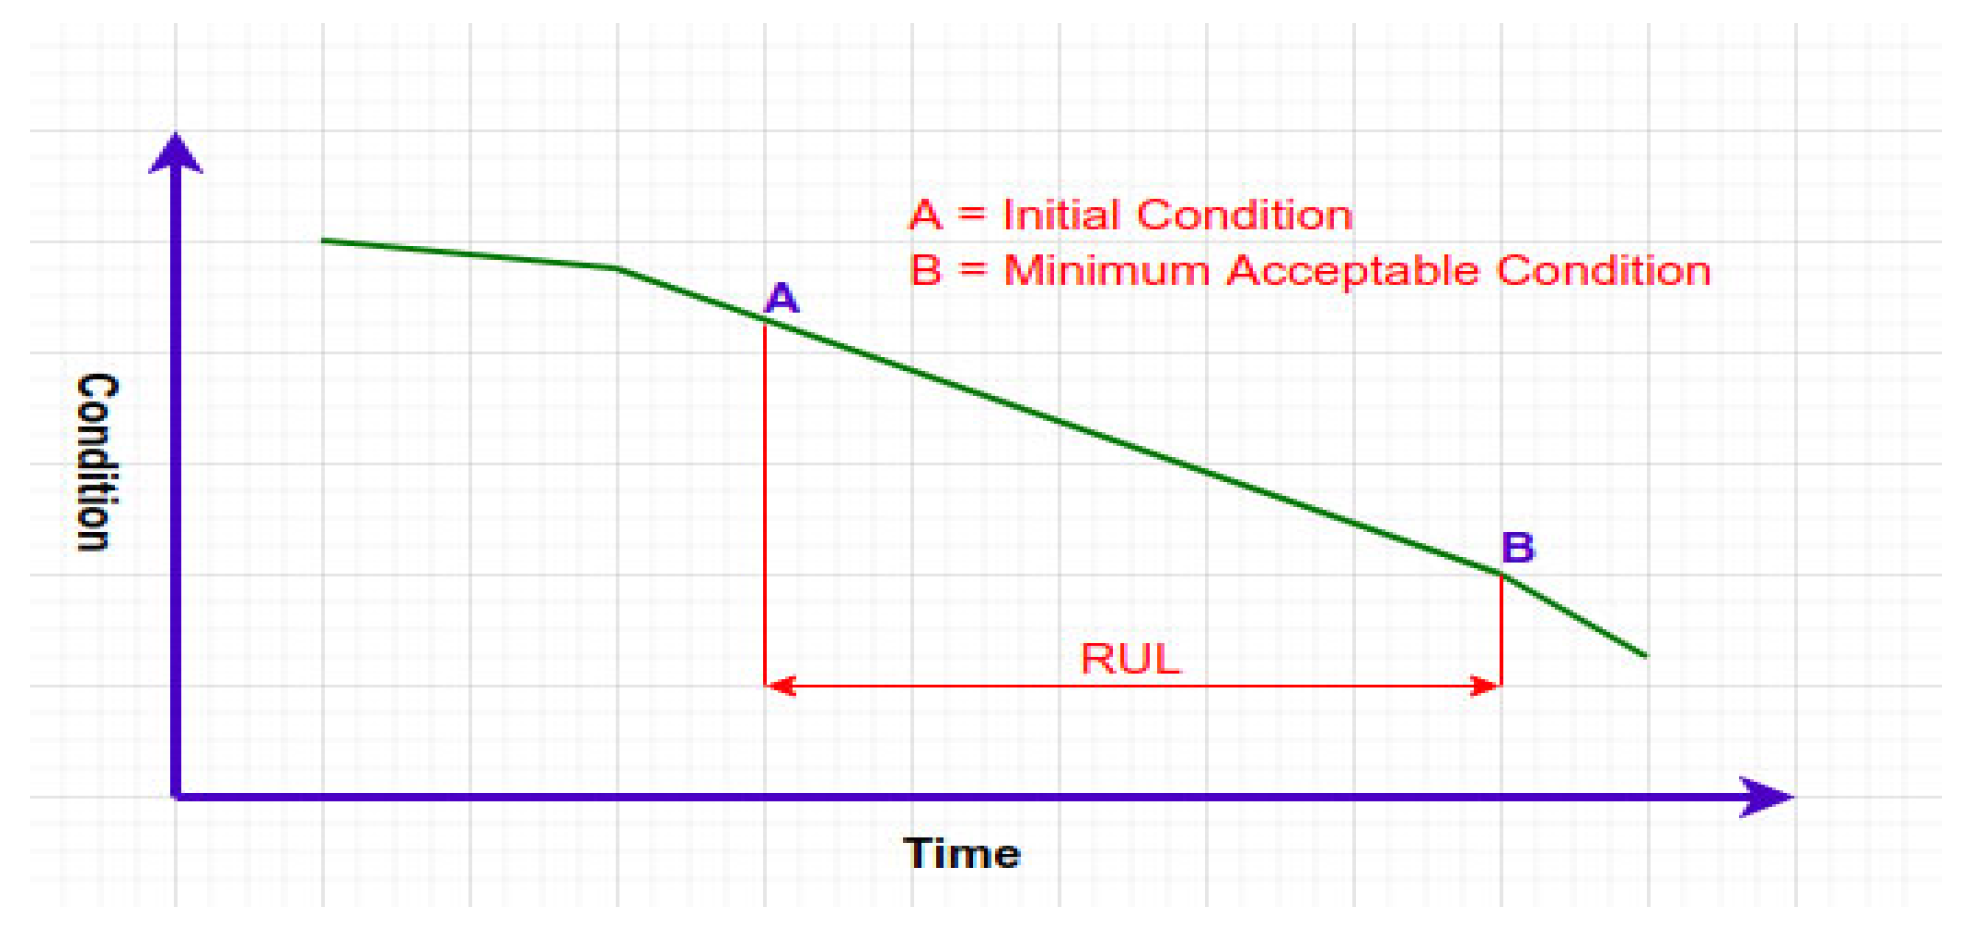
The time period may be expressed in terms of days, miles, cycles, or any other number, depending on the system you are using. RUL prediction offers early failure alerts and has evolved into a crucial part of system prognostics and health management. Figure 1 shows deterioration of a machine over time.
Figure 1.
Prediction of RUL.
This picture illustrates how a machine degrades over time. Remaining useful life is calculated as the interval between these two points if A is the current condition and B is the minimal condition beyond which the machine will fail. RUL can be replaced or maintained to prevent unforeseen downtime and financial losses if it is forecast in advance. It is crucial to estimate RUL precisely because it is essential for operations and decision-making. The study of the most precise RUL calculation has recently gained popularity due to the swift advancement of situation and health tracking technology. In the most recent modelling trends for figuring out the RUL the examination places a strong emphasis on statistical methods that are fact-driven and use the finest readily available historical determined records and statistical models.
The different procedures that have been suggested and put into exercise to simulate the degradation of these complex systems have led to the evolution of two techniques: entirely model-based techniques and information-driven techniques. Due to the model’s complexity, its universality is also limited and usually impossible to attain. As a result, the generalization impact cannot be determined. The kinetics of SEI generation and solvent transportation are considered in a one-dimensional model to examine possible decline in lithium-ion batteries. This work advises analyzing potential fade at various cyclic charge–discharge settings within a lithium-ion electrochemical pseudo-dimensional (P2D) battery version.
The model exhibits a stronger relationship between battery performance and electrolyte chemical characteristics by combining porosity exchange with electrolyte partial molar concentration [3]. The changing modern pricing and cut-off voltages are expected to cause fluctuations in the stable electrolyte interface (SEI) layer. The results show that the porosity version and convective heat switch coefficient have a substantial impact on the SEI layer development and battery life.
The semi-empirical cycle aging model for an LFP-based fully cylindrical cell presented here has been improved as a result of better knowledge of aging phenomena under the effect of DOD and Ah-throughput variables [4]. It is based on ability loss and is the primary LLI degradation technique since it takes into account both internal resistance aging and capacity loss. A Thevenin version has been described with a single RC branch and constant values for all model parameters. In this work, parameters of similar circuit models that account for battery aging and qualities for resistance aging, as well as several internal battery capabilities are included [5].
A substitute is used for random initialization, a prediction model with LSTM is initialized, and the system parameters are optimized based on test temperature and test dates, which presents an 89.18% average accuracy [6]. A comparison has been drawn between Naïve Bayes (NB) and Support Vector Machine (SVM): where NB is employed, the RUL of Li-ion batteries exhibit stable and better competitive prediction performance than SVM under constant discharge conditions [7].
A probabilistic-based adaptive estimator is used with caution for both SOE and SOC estimation using neural networks and information-pushed methodology, and accurate battery models are examined [8]. The voltage prediction effects that may be more accurate for the SOC calculation are provided by an electrochemical model and an n ordered RC equal circuit model. For SOE estimation, the relationship between the terminal voltage and the model input is often examined using a sliding window neural network model. The results demonstrate that the proposed voltage mistakes and records pushed neural network models can produce accurate version predictions.
A weighted least squares assist vector device is used for online estimation of the SOH of 2D-use lithium-ion batteries. The suggested method has been tested on a variety of 2D-use lithium-ion battery data units under various environmental conditions and battery types [9]. The results of the application show that, in comparison to the totally BPNN-based technique and the totally GPR-based approaches, the SOH accuracy anticipated via the totally WLSSVM-based approach is the best because the suggested approach has a higher ideal for nonlinear conditions with much less educational information. Battery terminal voltage characteristics during the charge process for RUL prediction has been considered Importance Sampling which has been employed in combination with a Feed Forward Neural Network [10].
In ref. [11] the author worked on a fusion of 3-D CNN and 2-D CNN which yielded a 1.1% test error for battery cycle life and a 36% test error for RUL prediction. The design and development of a lithium-ion cell version battery management system may also be used to execute state machines for charge and discharge current limit calculations, fault management, contactor management, and other duties [12]. The simulation model for designing and testing these methodologies includes Li-ion battery cell parameter estimation, battery packs with 6 and 96 cells, test documents with check cases to confirm state machine logic and linking requirements to models. Bayesian methodology is a probabilistic method for forecasting the RUL of a battery. When we initially offer a framework for feature extraction, we use the RUL estimation model to apply Bayesian inference of linear regression [13].
The lithium battery deterioration model and its RUL can both be accommodated by an integrated mastering approach that is entirely based on tracking records [14]. The relevance vector device (RVM), the random woodland (RF), the elastic net (EN), the autoregressive model (AR), and the lengthy quick-time period memory (LSTM) community are the five fundamental rookies used by the ensemble learning approach, which aims to improve prediction performance [15]. Remaining useful life (RUL) estimation of drilling pumps and critical components in fossil energy production is carried out with deep feature learning technique that uses a Convolutional Neural Network (CNN), Convolutional Block Attention Module (CBAM) [16].
Rechargeable battery systems with attractive potential for commercial applications are emerging as alternatives to traditional lithium-ion batteries (LIBs). They offer the promise of higher theoretical energy density and lower production costs compared to LIBs. However, despite their potential, these emerging lithium-sulfur Batteries (LSBs) continue to face persistent challenges that hinder their widespread industrial adoption. These issues include the inevitable dissolution of lithium polysulfide intermediates during electrochemical reactions and significant volume expansion, sometimes reaching up to 80%, upon the formation of Li2S. These challenges result in severe limitations on battery lifespan and safety [17].
In this comprehensive review [18], an overview of the theoretical and experimental advancements in Ge-based monoelemental and binary two-dimensional (2D) materials is presented and encompasses various aspects, including crystal structures, as well as electronic, mechanical, thermal, optical, and photoelectric properties. Furthermore, we delve into the potential applications of these materials across a wide spectrum, including field-effect transistors, photodetectors, optical devices, catalysts, energy storage devices, solar cells, thermoelectric devices, sensors, biomedical materials, and spintronic devices.
Effective monomer design can lead to the creation of a sulfur-containing polymer with advantageous characteristics. These properties encompass ion and electron conductivity, high sulfur content, suitable viscosity, processability, and controllable morphology. These attributes hold significant promise for application in the cathodes of Li-S batteries, facilitating high capacity and consistent discharge even at elevated rates. This review provides a concise overview of the latest advancements in cathode materials based on sulfur-containing polymers [19].
The introduction of lithium iodide (LiI) as a Lewis basic salt serves to prevent the interaction between LiTFSI and the MoS2 electrocatalyst, thereby inhibiting the formation of a surface gel layer. This electron-deficient center, induced by the trifluoromethanesulfonyl group in LiTFSI interacting with the Lewis acidic sites on MoS2, triggers the cationic polymerization of the 1,3-dioxolane solvent and leads to a reduction in electrocatalytic activity. As a result of this modification, Li-S batteries incorporating the MoS2 electrocatalyst and the LiI additive achieve an exceptionally high actual energy density of 416 W h kg−1 demonstrated at the pouch cell level [20].
Despite the notable theoretical energy density associated with lithium-sulfur (Li-S) batteries, they grapple with practical challenges, notably sluggish conversion kinetics and the notorious shuttle effect of polysulfides. In response to these challenges, a novel approach has been introduced involving a nitrogen-doped continuous porous carbon (CPC) host that firmly anchors monodispersed sub-10 nm FeS2 nanoclusters, referred to as CPC@FeS2. This innovative host exhibits a robust capability for adsorbing polysulfides, holding the promise of mitigating the polysulfide shuttle effect and enhancing the initial stages of the catalytic conversion process [21].
The other sections of this paper are prepared as follows: Section 2 explains the recent relevant works based on model-dependent and data-driven methods. Section 3 presents the pre-requisites of the data set, ML Algorithms, and Problem formulation. Section 4 presents Proposed Methodology of ML Methods for RUL Prediction and estimation of Performance error indices. Section 5 shows the results of our proposed method and discussion. Finally, Section 6 offers a conclusion and directions for future work.
2. Literature Review
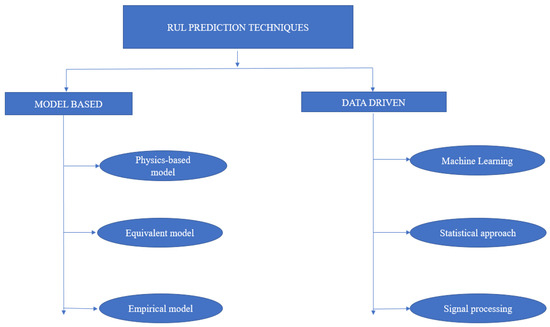
To predict the RUL of lithium-ion batteries, completely version-based and statistics-driven techniques are frequently used. Primarily version-based procedures frequently make use of an extension of algebraic, differential, and empirical equations. Records-driven algorithms estimate battery RUL in the realm of mathematical fashions by utilizing latent mappings between inputs and outputs, hidden correlations between developments or features, hidden correlations between qualities and skills, and so on [22]. Several approaches for estimating lithium-ion battery RUL are currently linked. RUL prediction algorithms are classified into three categories: entirely version-based, facts-driven, and hybrid. Figure 2 depicts a thorough evaluation of the RUL prediction methods. The completely version-based approach makes use of modelling that is generally based on physics to enlarge the degradation and an empirical version to disclose how a linked item declines with time. Statistic-driven styles, on the other hand, embellish the degrading version to expand packages using ML approaches and historical statistics. In order to incorporate the respective advantages of the two models, hybrid-based solutions are finally developed.
Figure 2.
Classification of various RUL prediction methods for lithium-ion battery.
- (A)
- Model Dependent Methods
Algebraic and empirical equations, linked elements, and mathematical models make up the model-based techniques. They also include a significant amount of empirical data gathering via experimentation. A physics or regression model can be used to create the battery’s deterioration behavior, and the results can then be extrapolated to estimate battery performance.
- (A.1)
- Physics-based model
The physical and electrochemical phenomena that take place inside the battery serve as the foundation of the physics model. The electrode porosity and reaction kinetics theories are used to create the physics model for RUL prediction. The physical and chemical processes, as well as calculating battery states like SOC and SOH, may also be better understood by using the physics model. The pros and cons of using dynamic models for the operation and diagnosis of Li-ion batteries are discussed in [23]. The summary of models and dynamics is succinct but clear, and it also looks at the necessary advancements for the field’s future. The fundamental processes, including their dynamics, parameters, and time, must be understood in order to determine battery diagnostics and operation constants. Compared to other model-based methodologies, the accuracy of physics models is relatively poor [24]. The demand for batteries is rising as new energy electric vehicles and smart grids emerge quickly. An essential component of a system using batteries for energy storage is the battery management system (BMS). The state estimation approaches are evaluated in terms of ultimate potential and power estimation, strength functioning prediction, lifespan and health forecasting, and other important indicators in BMS.
- (A.2)
- Equivalent circuit model
The equivalent circuit model (ECM), which stands based on knowledge of the physical and chemical processes involved in popular battery production, has been developed. It is entirely predicated on the idea that different electrical element combinations can result in outcomes that are electrically comparable to those of a battery. Consequently, a mathematical model can be developed using circuit assessment techniques. Additionally, the employment of ECM results in the simulation of several significant characteristics, such as the production of power, electricity, and heat under challenging operating conditions [25]. As the SEI movie layer matures, it has been seen that the battery’s internal resistance continuously rises. Additionally, the electrochemical impedance spectroscopy (ECM) characteristics may be seen using EIS datasets, and RUL can be predicted using a regression model. One of the most important metrics for assessing the health of lithium-ion batteries is the electrochemical impedance spectrum (EIS). Ref. [26] outlines a method for online implementation that determines the EIS of lithium-ion batteries using a fractional-order equal circuit model (FOECM). The parameters of the fractional-order model are first generated based on measurements of current and voltage using a fractional-order kingdom variable clean out and the recursive least-squares approach. The parameters that were gathered are then used to construct the battery’s expected EIS under various ageing scenarios. The regression version of the estimated EIS spectrum is then utilized to show how the battery is deteriorating in terms of the rise in internal resistance. Finally, compared to tests applicable to current FOECM-based regression models, the enhanced regression model is successfully applied in the context of particle filtering to predict the battery’s final usable lifetime (RUL).
- (A.3)
- Empirical model
The foundation of the empirical model is built by looking at the association between a wide range of factual aspects. Several battery degradation traits are included in the empirical model for RUL prediction. Empirical models can predict degradation trends using empirical formulas or exceptional regression models to represent degradation behavior. In [27], a framework for RUL prediction based on a logarithmic variant was established, proving its superiority over conventional empirical models. It is important to carefully choose version settings related to scalar quantities to prevent the introduction of complex values for expected ability. A two-term logarithmic variant was built to reflect the 2-segment nonlinear concave degradation of cylindrical-type Li-ion batteries. The proposed design accurately captured the inflection factor of the two-section concave deterioration. Reference [28] recommended a dual EKF (DEKF) based entirely on the Thevenin model for estimating battery kingdom. When a primary-order Taylor expression was employed for country estimate, the DEFK was used to convert a non-linear state and statement expression hooked on a linear feature. The empirical model remains a non-linear system, therefore conventional KF remains appropriate. The equivalent circuit version is constructed from basic circuit components, and the modelling process is challenging. The form acts as a real replacement for the outside function switch of battery charge and discharge. The comparable circuit version’s parameter identification is rather straightforward; as a result, it is frequently used. As a result, we created the second-order Thevenin equal circuit version as well as the RC version.
- (B)
- Data-driven-based Techniques for RUL Prediction
Utilizing past data, data-driven context predicts the rate of battery degeneration. At this time, it is still unclear how data-driven models function and propagate. Without using physics-based methods, the weight limitations in the data-driven mathematical context are determined using the training data. Recently, the flexibility and applicability of data driven models have attracted attention on a worldwide scale. Three categories can be made to classify the RUL estimation techniques created with data-driven methods: machine learning (ML), statistical methods, and signal processing.
- (B.1)
- Machine learning (ML)
RUL can be predicted using model-based, statistics-driven, or hybrid strategies using historical data or direct statistics extraction. Developing version-based strategies in complex devices is particularly challenging, expensive, and time-consuming because it calls for a great deal of skill outside of the realm of machine learning, because data-driven tactics mainly rely on machine learning (ML) techniques.
The component’s maximum useful life (MUL) is one of the most significant indicators of expected failure. The studies on RUL prediction using ML approaches are described in [29]. It is difficult, expensive, and time-consuming to develop totally version-based procedures in complex equipment since it requires extensive outside device expertise. Statistics-driven techniques had been heavily reliant on machine learning (ML) procedures.
Machine learning is employed in [30] to predict battery cycle life and early pleasant class throughout manufacture. Information-driven machine learning algorithms have been used to forecast and classify the early success of battery manufacture. The predictive power of linear regression models and artificial neural networks (ANNs) were investigated using a variety of datasets. However, the linear regression shows an equivalent look at errors of about 13% when only a few enter features are used. The focus of the RUL prediction investigation was on three top-ranked regions [31]. The first entails compiling battery data using publicly and commercially available Li-ion battery data sets. The second part of the section involves estimating battery statuses using a battery management system [32]. The symbolic regression machine learning algorithm was used to anticipate the final useful existence of these batteries. A single methodology for batch categorization, unit utilization, and battery recycling is provided by the information-pushed device mastery method used to anticipate strong state battery life. Offline training and online correction of data driven models for RUL prediction has been worked and the author inferred that a reduction of 40% in Root Mean Square Error and 34% in mean uncertainty calibration error is achieved with the augmented model [33].
- (B.2)
- Statistical approach
The method of building a model for RUL prediction is statistical. A capacity deterioration model was created using data from earlier measurements. The application of statistical modelling is straightforward and precise. In the subsections below, a few of the statistical techniques utilized for RUL prediction are displayed.
- (a)
- Autoregressive integrated moving average (ARIMA) technique
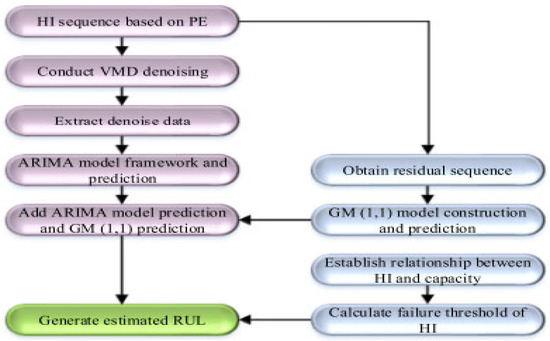
For battery RUL estimation, the ARIMA typical mostly substitutes the Autoregressive version due to the predominance of underfitting at some point in version schooling. To alleviate the problems associated with underfitting, ARIMA combines a shifting common approach with an autoregressive model. A novel hybrid Elman-LSTM approach for estimating the amount of usable existence that a battery has left was developed using Elman neural networks, long and short-term memory, and empirical model decomposition. This method is made available by way of [34]. The recorded battery potential versus cycle number data is broken down into several sub-layers using the empirical version decomposition set of rules. Then, utilizing Elman neural networks and recurrent long and short-term memory, high- and occasional-frequency sub-layer forecasting is performed. Large battery test datasets were used to parameterize the models and assess their performance. The appropriate HI for RUL prediction was determined using the capacity regeneration profile data from the state of health (SOH) estimation. When compared to the RVM, echo state network (ESN), and traditional ARIMA models, the determined RUL errors become insignificant. The performance of the model can be enhanced through PDF computation, as shown in [35]. A fractional-order equal circuit device is created using a combined Genetic Algorithm/Particle Swarm Optimization technique. The model is able to predict the voltage response using cycle-based comprehensive testing with a root-mean-squared error below many others. A dual fractional-order prolonged Kalman filter is suggested in order to obtain concurrent SOC and SOH estimates. Combining GM (1, 1), the ARIMA model, and the Variational mode decomposition (VMD) denoising scheme allowed us to forecast RUL, as is shown in Figure 3.
Figure 3.
ARIMA based RUL prediction.
- (b)
- Grey model technique
Enhancing the grey prediction classical means that we can use it to predict the number of users in a public road transportation system [36]. For evaluating the behavior of an unknown system, only small amounts of data are necessary. The forecasts are based on a small number of data points. Three different strategies are used in three different grey prediction models that have been presented to boost accuracy. To achieve the prediction of time series, these models convert discrete sequences into a continuous and dynamic differential equation. Each grey model is denoted by the notation GM (H, N), where H is the number of variables and N is the order of the differential equation. Small amounts of data are needed by the grey models to estimate the behavior of an unidentified system. The grey prediction model is described in greater detail in the ensuing subsections.
With the appropriate optimization of the extracted HI, the accuracy of the grey model’s performance was increased [37]. The suggested model showed great accuracy, robustness, and dynamic flexibility. However, taking into account dynamic circumstances such as EV application, the provided results may vary. The RUL is predicted using an improved grey model, GM (1, 1), based on the HI that has been given. The experimental findings demonstrate the effectiveness and precision of the suggested strategy for battery degradation modelling and RUL prediction.
- (B.3)
- Signal processing approach
With the help of the signal processing technique, significant data can be extracted. Data augmentation is one of the traits of signal processing methods. To estimate battery RUL, one can utilize a signal processing method. The DWT method is used to split a signal into its component parts. Although the DWT technique is rarely used for battery RUL prediction, it is commonly recognized for removing noise during the pre-processing of battery data. In ref. [38], lithium-ion battery remaining useful life prediction is performed using discrete wavelet transform. The remaining usable life and health are important factors in determining how safely and reliably an electric vehicle operates. Several methods have been used to estimate the RUL and SOH, with a focus on capacity loss, internal resistance growth, voltage drop, self-discharge, and cycle count. Most works only take batteries into account in specific circumstances. The model and identification techniques are the most crucial elements in figuring out how accurate the prediction results would be.
3. Problem Formulation
- (A)
- Data set
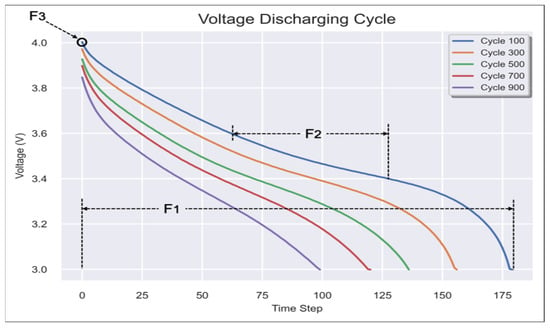
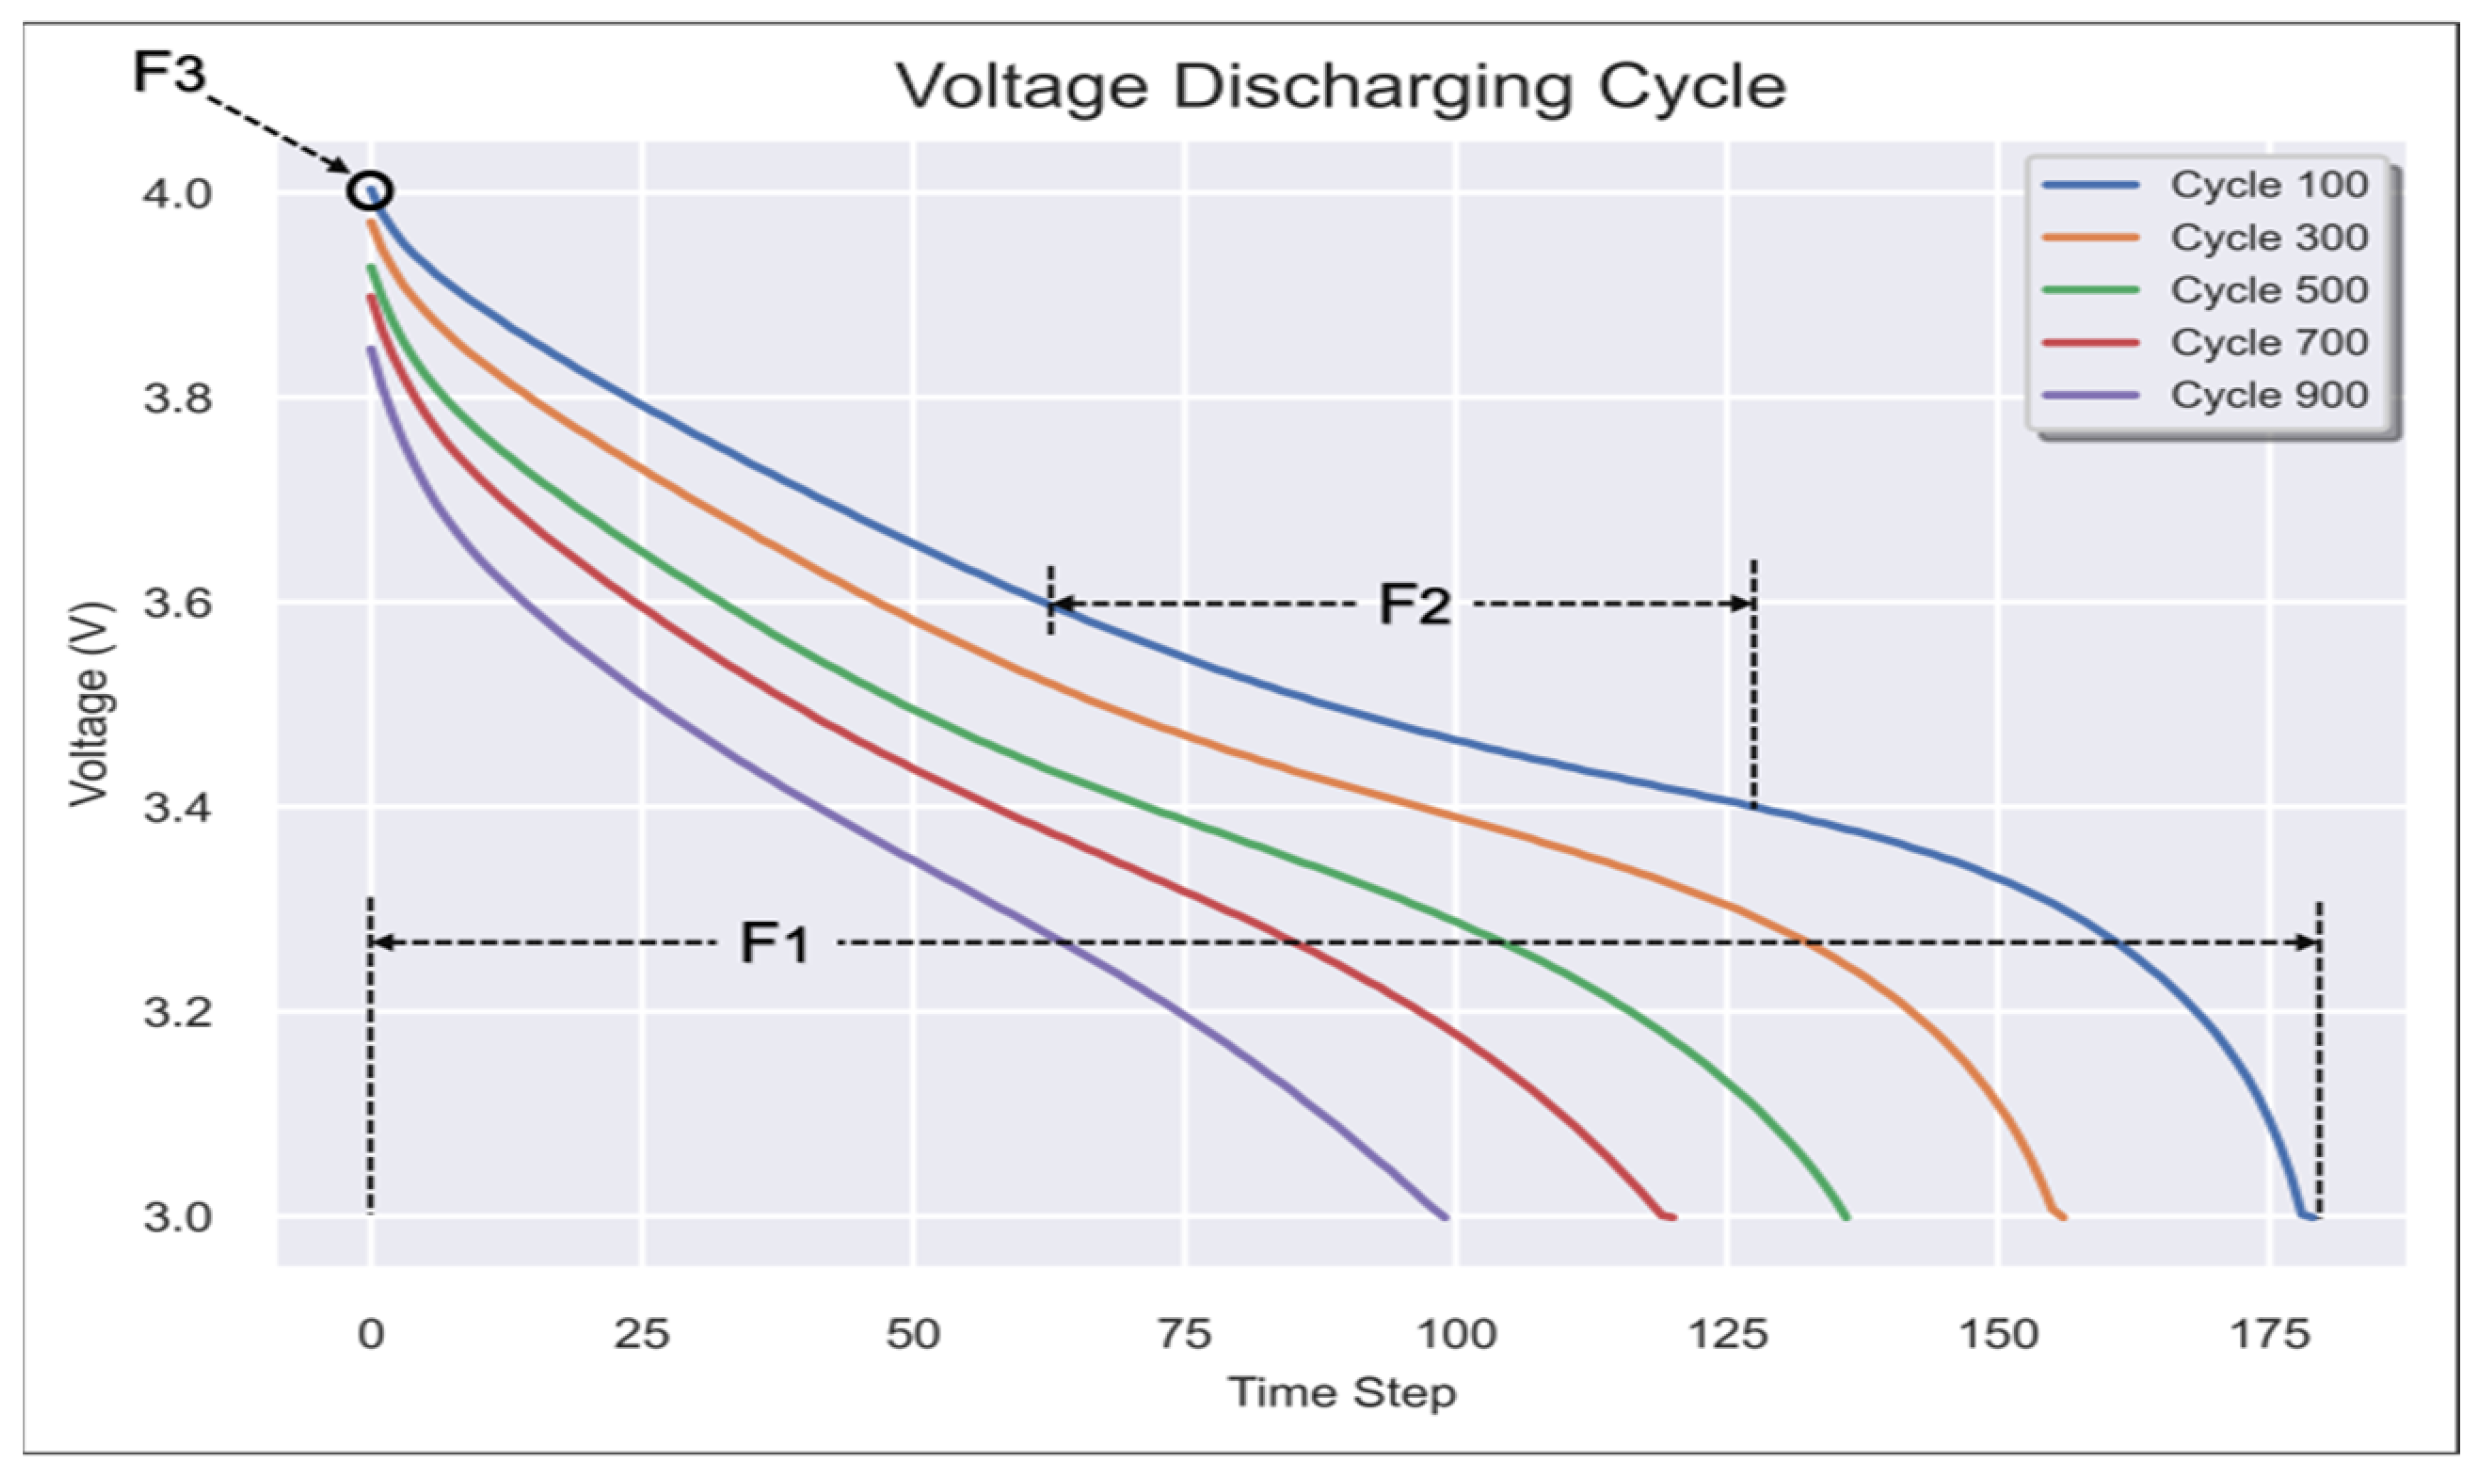
The overall performance of a battery diminishes for a variety of reasons, and the reduction is not necessarily linear. Battery becoming older facts are required to develop an RUL prediction set of rules and compare its balance and correctness. In the early days of lithium-ion technology, battery life was limited. As a result, many ageing checks are required to swiftly acquire battery growing older facts. Numerous charge–discharge charges and ambient temperature are the most commonly utilized pressure parameters. However, apparent battery aging checks take time, and complex and expensive sign collection equipment is required to extract battery attributes from multiple aging cycles. Several researchers have used publicly available battery information to validate their RUL prediction algorithms. The Hawaii Natural Energy Institute evaluated 14 NMC-LCO 18,650 batteries with a nominal capacity of 2.8 Ah after being cycled over a thousand times at a temperature of 25 °C with a CC–CV rate of C/2 and a discharge price of 1.5C. The unique dataset is used to create features that emphasize the behavior of the voltage and current over the course of each cycle. These characteristics can be used to calculate the batteries’ ultimate beneficial life (RUL). The dataset contains summaries for the 14 batteries. Finally, voltage, current, and time are used to extract seven functions from the original datasets. The goal is to forecast the battery’s RUL using these features. The characteristics are listed in Figure 4, Figure 5 and Figure 6:
Figure 4.
Profile of features F1, F2 and F3 in Voltage Discharge Cycle.
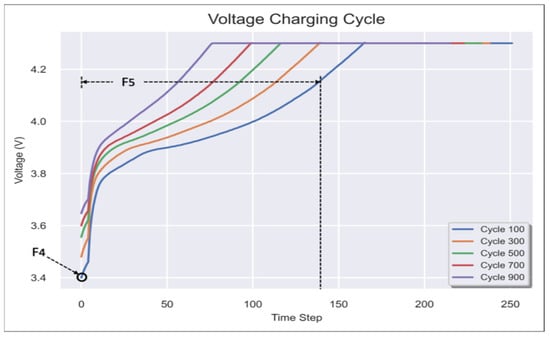
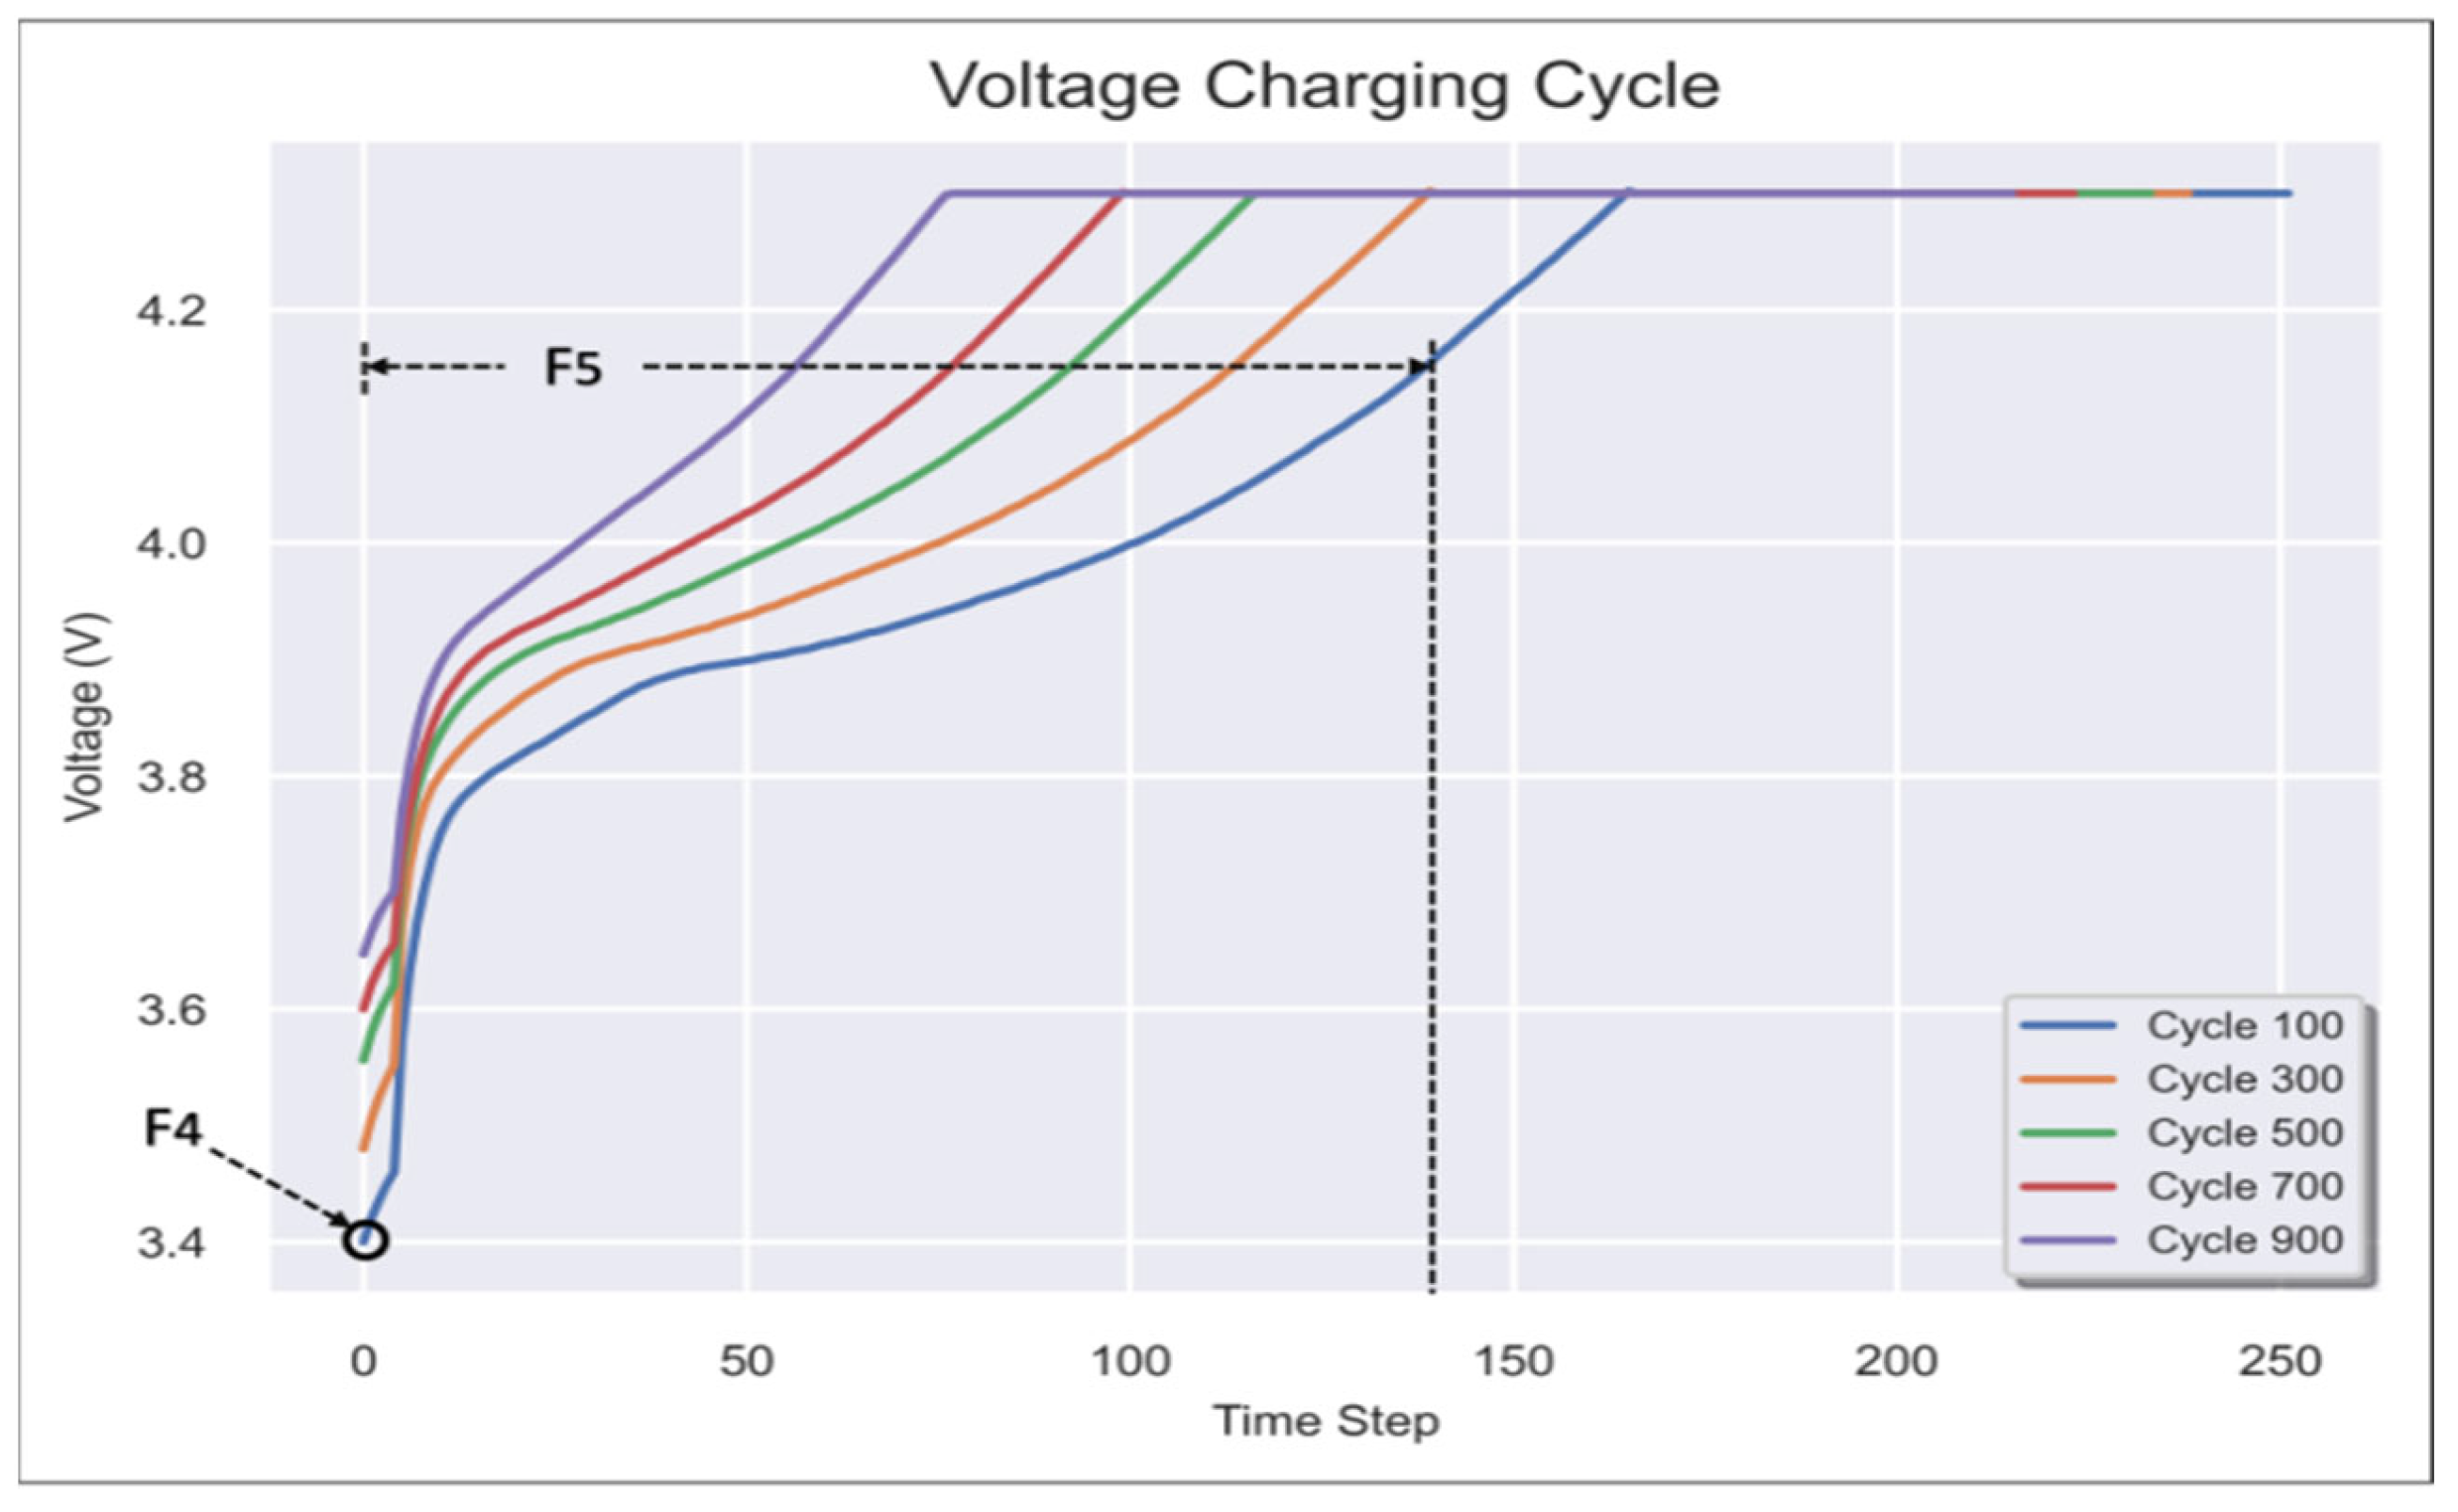
Figure 5.
Profile of features F4 and F5 in Voltage charge Cycle.
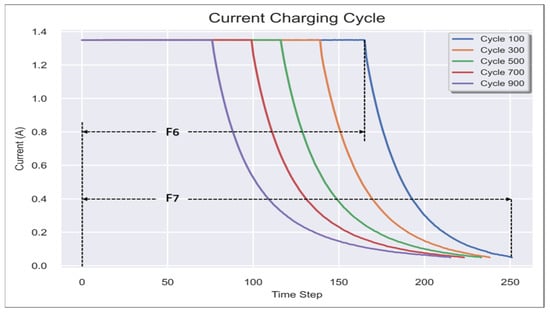
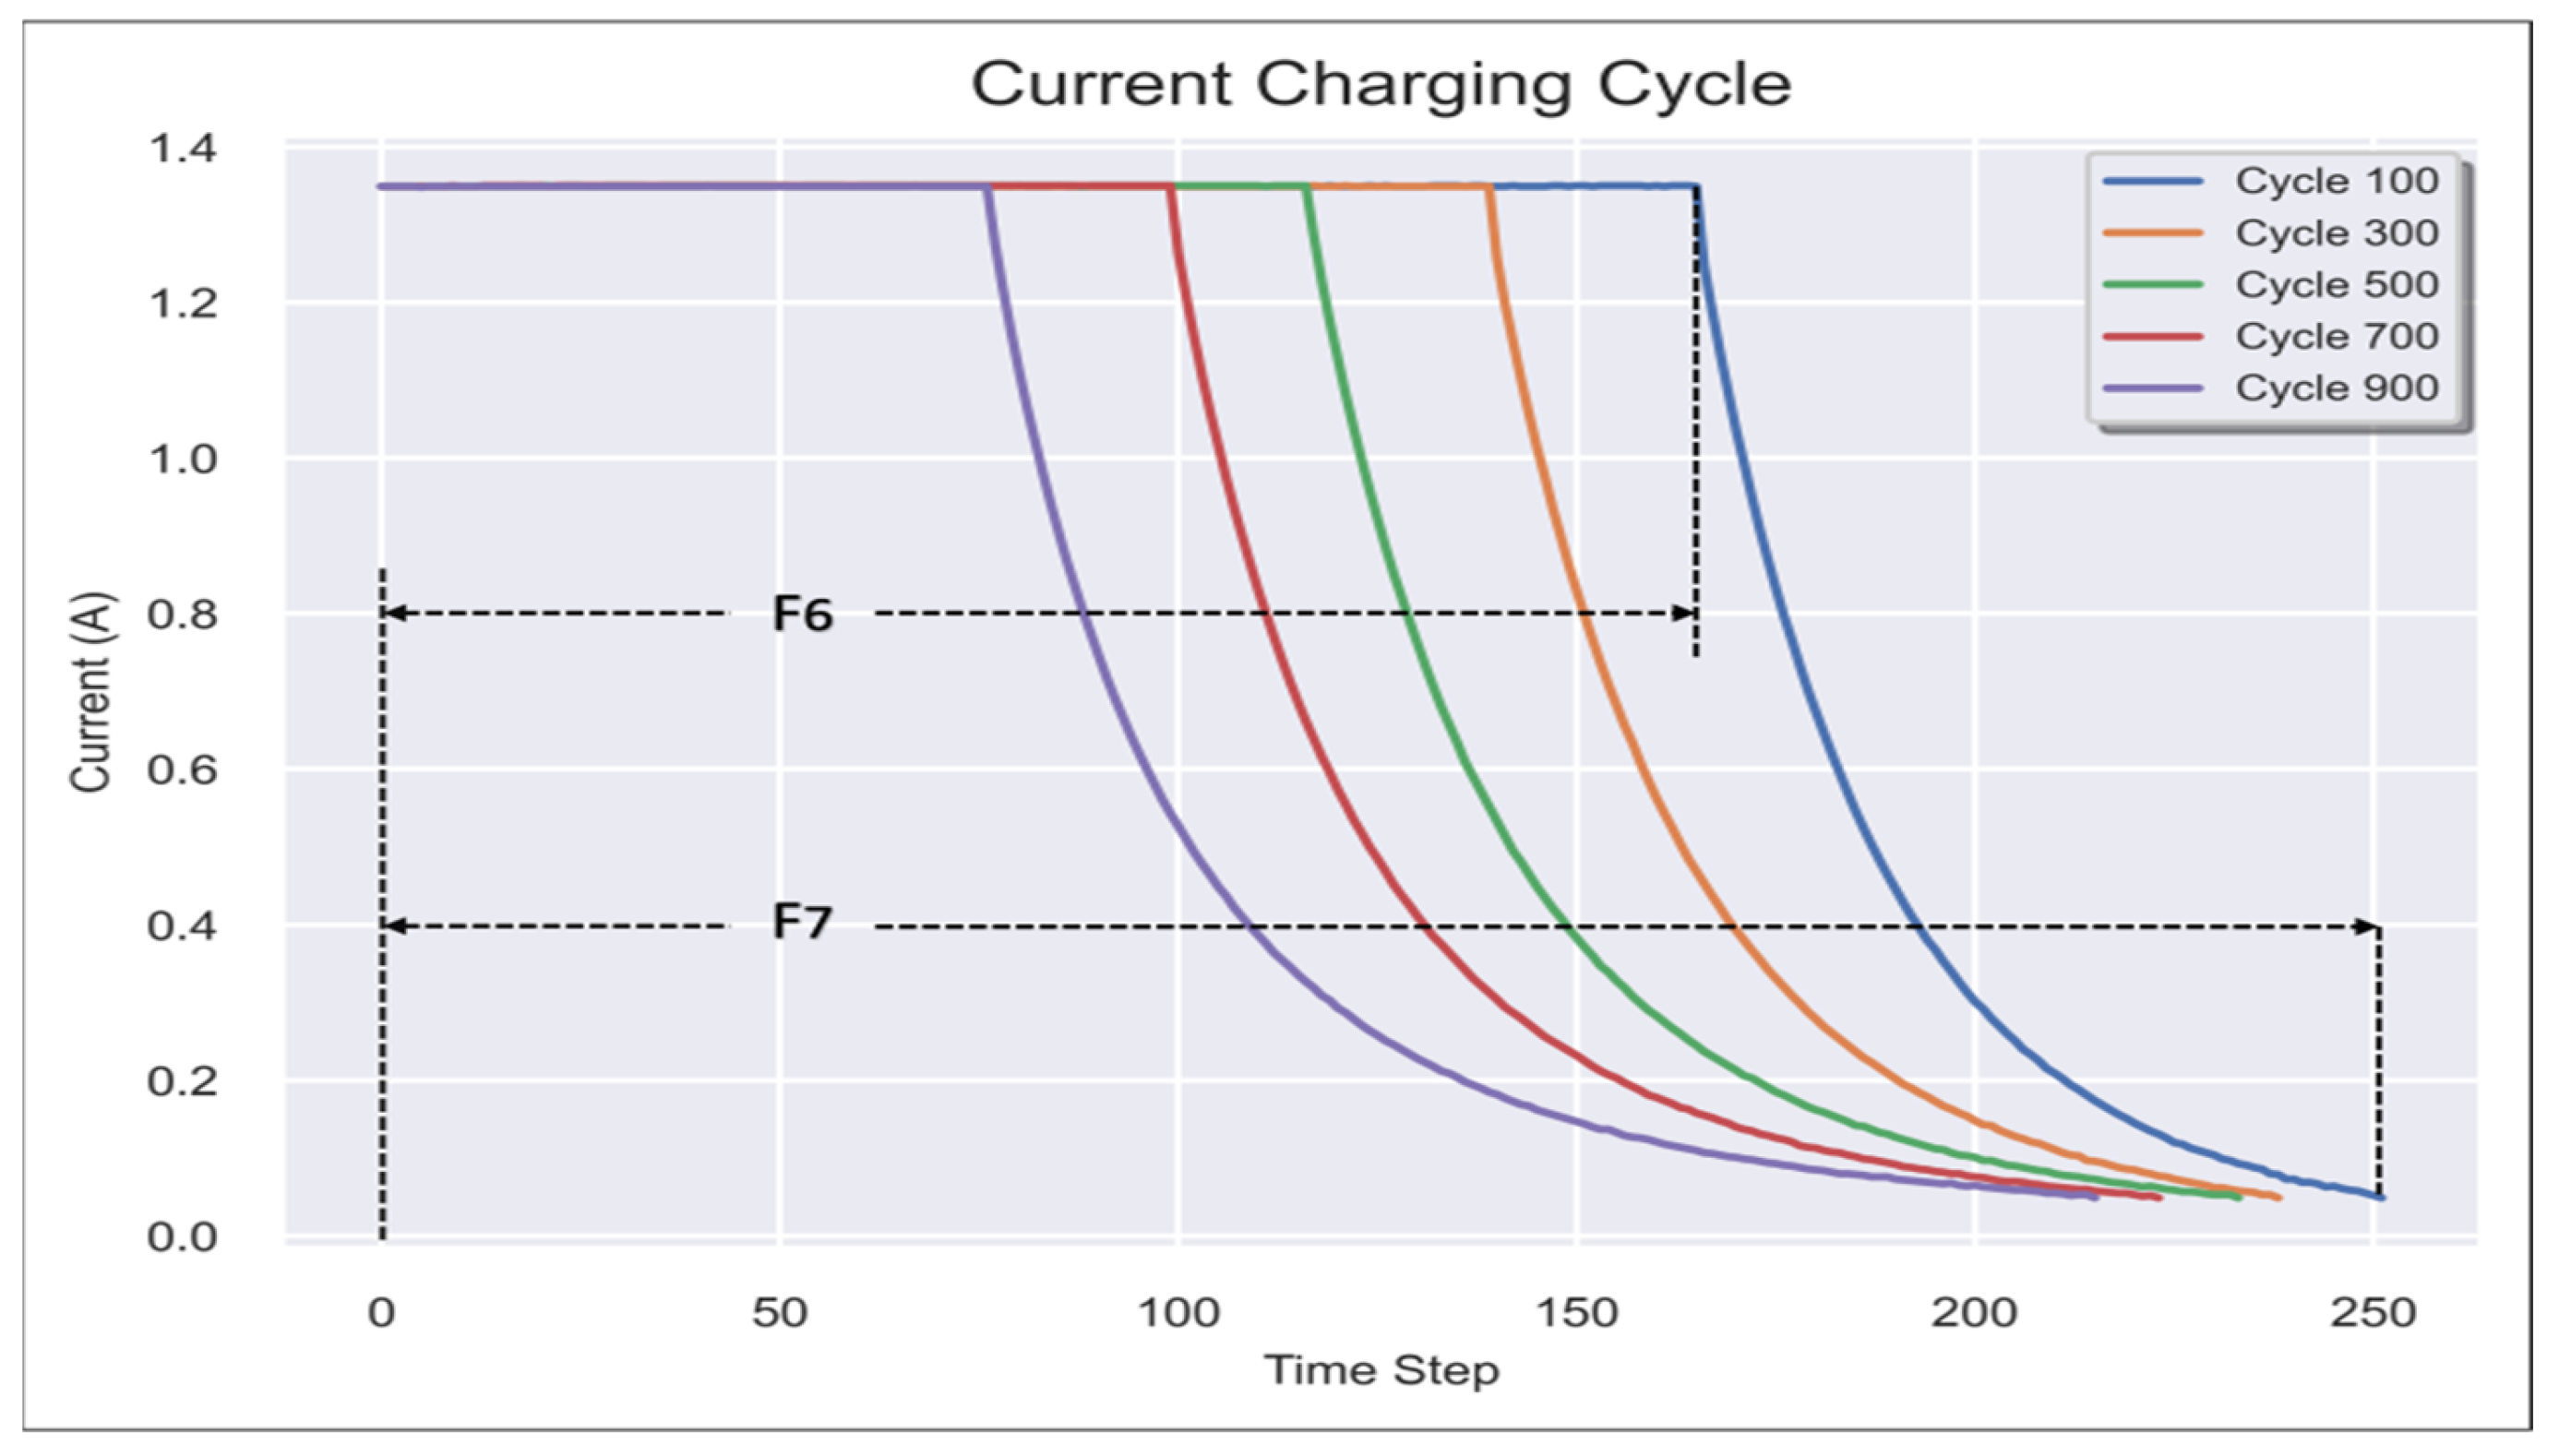
Figure 6.
Profile of features F6 and F7 in Current charge Cycle.
Characteristic features:
- Cycle Index: number of cycle;
- F1: Discharge Time (s);
- F2: Time at 4.15 V (s);
- F3: Time Constant Current (s);
- F4: Decrement 3.6–3.4 V (s);
- F5: Max. Voltage Discharge (V);
- F6: Min. Voltage Charge (V);
- F7: Charging Time (s);
- Total time (s);
- RUL: target.
The battery life cycle databases that are available to the general public do not provide ready-to-use data for the assignment in [39]. Despite the fact that they incorporate various factors such as voltage (V), current (A), time (S), discharge and fee capability (Ah), and charge and discharge energy (Wh), not all of these factors can be employed for this enterprise. Voltage, cutting-edge, and time are the best inputs allowed. However, using such variables as inputs right away is impractical because they provide worthless information and are insufficient to construct a version. As a result, they must be used as a starting point and adjusted to produce new qualities, which the neural community can use to educate.
- (B)
- Elucidation of ML Algorithms
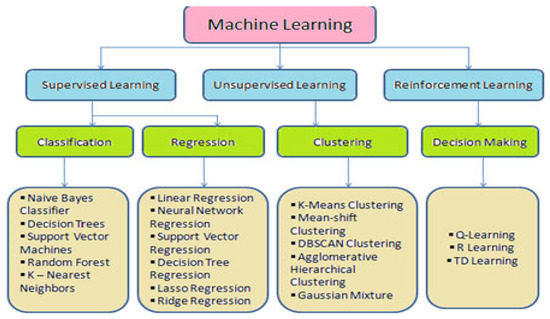
Machine learning (ML), a completely AI-based technique, teaches a machine to mimic human behavior in order to carry out previously impossible tasks. It also encourages communication between individuals and ML systems in order to make ML outcomes intelligible to humans. Figure 7 depicts the extensive classification of gadget learning methods. The ML era has the potential to improve both prognostic accuracy and computing efficiency for predicting the RUL of Li-ion-based batteries. Machine learning aims to discover styles and laws mechanically, using data experiments or in-person interactions [40].
Figure 7.
Classification of Machine learning algorithms.
This type of guide vector tool technique has grown in popularity during the last ten years. While using the technique as a regression strategy, its critical functions can be maintained. When records are regressed using the SVM, it is known as support vector regression (SVR). The RUL for Li-ion batteries can be predicted using the SVR technique. We decided to use a hybrid version of the SVR particle elimination technique [41]. For the terminal life cycle, an RUL prediction version that would offer the charge of RUL while updating the possibility distribution was provided. The results confirmed the efficacy of the cautioned RUL function prediction algorithms.
A simple and effective technique called KNN has been widely used in sample recognition for categorization. Using KNN and a specific number (k) of its closest neighbors in the feature area, a testing factor is categorized. These neighbors are chosen from a selection of educational websites with the right established categories. KNN regionally approximates the feature and waits to compute it because it is a lazy studying collection of rules [42].
Supervised Learning:
The supervised learning approach uses an enter-and-output pair-based learning dataset with the goal of implicitly establishing the mapping and intentional links between the inputs and outputs. The enter-and-output pairs’ class output for the education dataset addresses a constrained set of discrete classes that need labelling. Information input and output are mapped as the basic goal of supervised learning. As it depends on supervision, supervised learning is analogous to when a student studies under a teacher’s direction. Two further sorts of supervised learning issues can be identified:
- (i)
- Classification;
- (ii)
- Regression.
Unsupervised Learning:
Unsupervised learning is a sort of machine learning in which the computer is free to make decisions based solely on the information provided. The algorithm wishes to act on those records without supervision, thus the unsupervised models may be trained using the unlabeled dataset, which is neither categorized nor labelled. The version in unsupervised learning digs through the enormous number of facts in search of insightful data rather than providing a deliberate outcome. They are used to overcome the Association and Clustering difficulties As a result, they can be split into two groups:
- (i)
- Clustering;
- (ii)
- Association.
Reinforcement Learning:
When an agent uses reinforcement learning, it engages with its surroundings and learns from the feedback it receives. The agent receives feedback in the form of prizes; for instance, he gets a high compliment for every admirable activity and a bad reward for every distasteful conduct. The agent is not subject to any supervision. The decision-making process, which includes reinforcement algorithms, can be further divided into:
- (i)
- Q-learning;
- (ii)
- R-learning;
- (iii)
- TD-learning.
Some of the popular machine learning algorithms which are used for prediction purpose are:
- Linear Regression Algorithm;
- Random Forest;
- Decision Tree;
- Support Vector Machine;
- Naïve Bayes;
- K-Nearest neighbor;
- Gradient Boosting Regressor;
- Deep Neural Network;
- K-means Clustering;
- Q learning.
- (C)
- Work Objective and Problem Formulation
A twofold objective is proposed for the present work. The first step is to extract and build new features based on voltage, current, and time from the given source datasets. And the second is to predict a battery’s RUL by working with machine learning methods using Python 3.6.8 in Google Co laboratory. The methods employed produce the outcome in terms of performance evaluation metrics like MSE, MAE, RMSE, and R2.
4. Proposed Methodology
- (A)
- Framework for RUL Prediction
Although data-driven models can train quickly since they are based on historical data, choosing the right hyperparameters for effective model training requires human judgement. In this research, we suggest a novel RUL prediction framework. RUL prediction implementation is broken down into three stages, which are covered below.
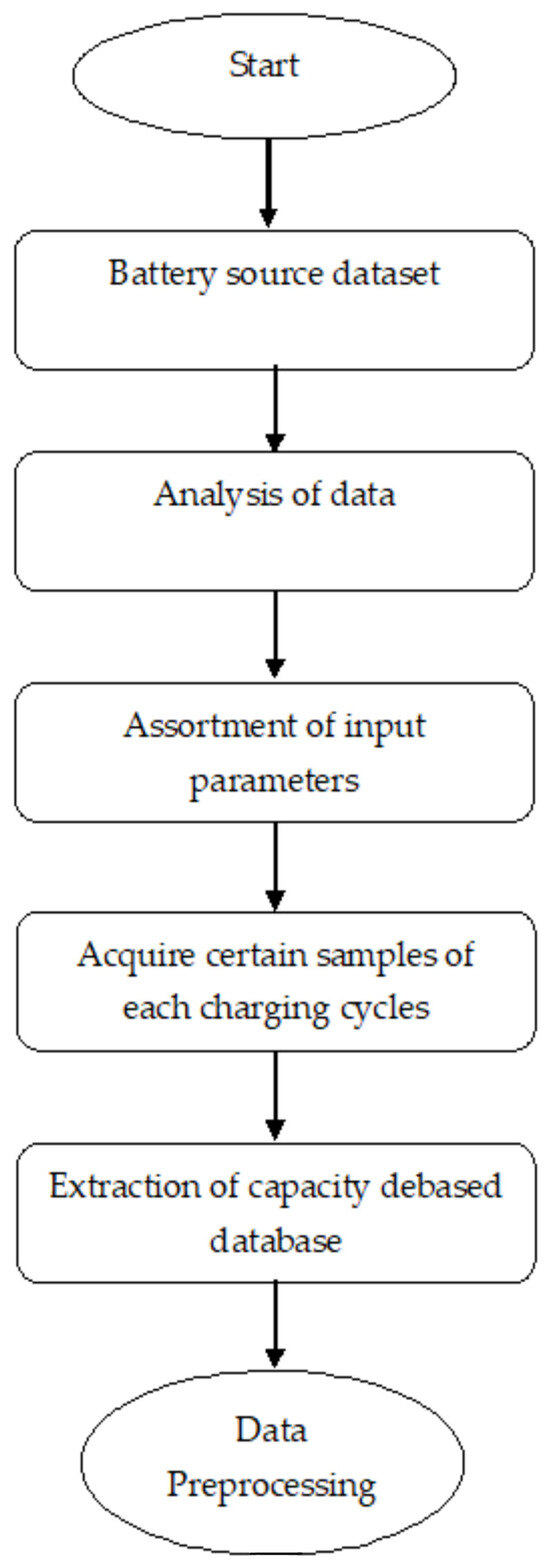
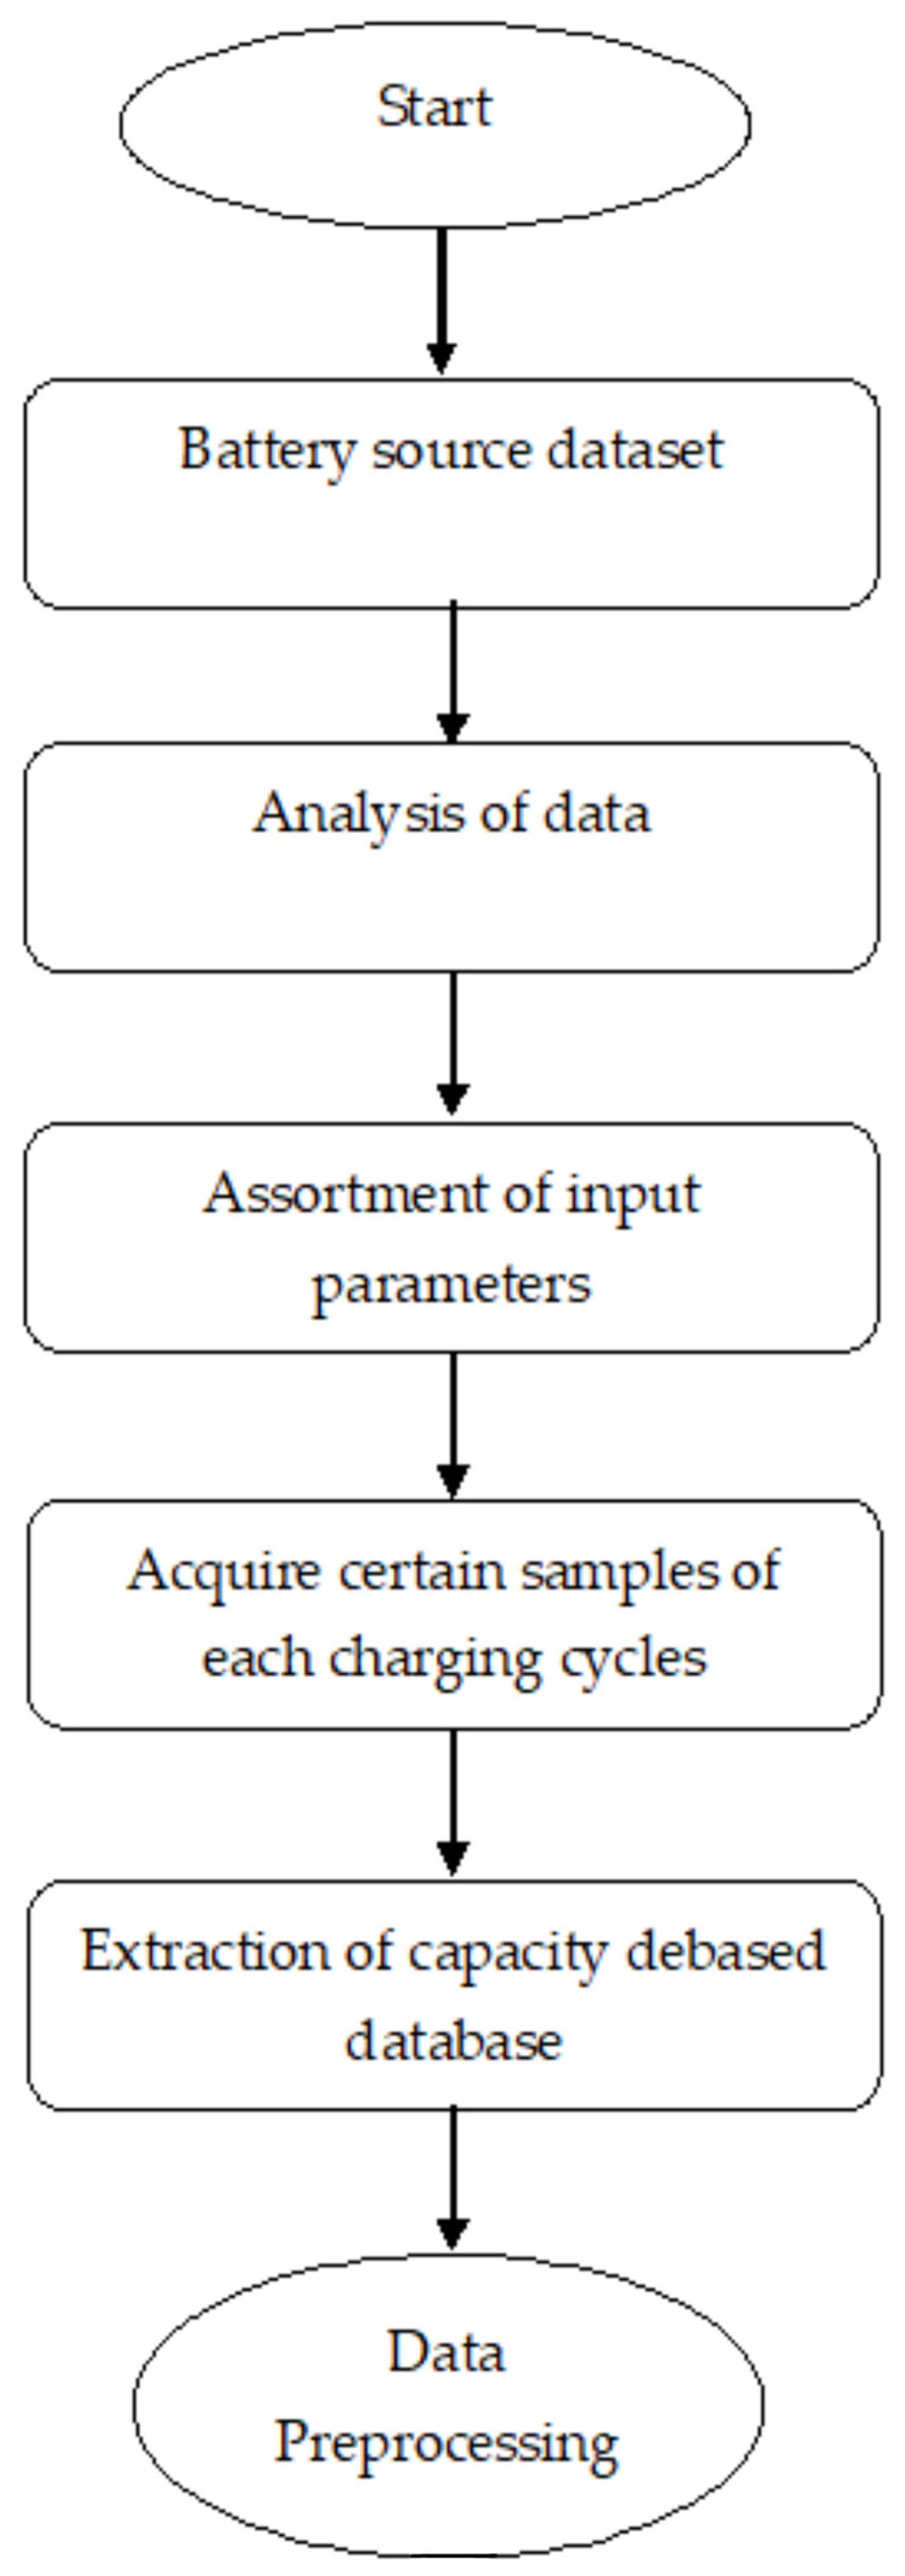
Stage 1: Extraction of characteristics from considered dataset and subsequent pre-processing of data is performed.
Figure 8 shows the stage 1 flow chart. Here the battery dataset is obtained from Hawaii Natural Energy Institute (HNEI). By evaluating the charging profile data and capacity the input parameters voltage, current, and time are chosen, methodical sampling is employed. The capacity degradation data are attained from discharging cycles, and normalizations of data are done in this process.
Figure 8.
Extraction and Processing of data.
Stage 2: Data Division and Model Training
Figure 9 shows the flow chart of the stage 2 process. In the second stage, the data are divided into two components to facilitate model training, i.e., train and test the data. By using the hit and trail method for solution of focused parameters input features are selected and suitable algorithms are applied.
Figure 9.
Data division and model training.
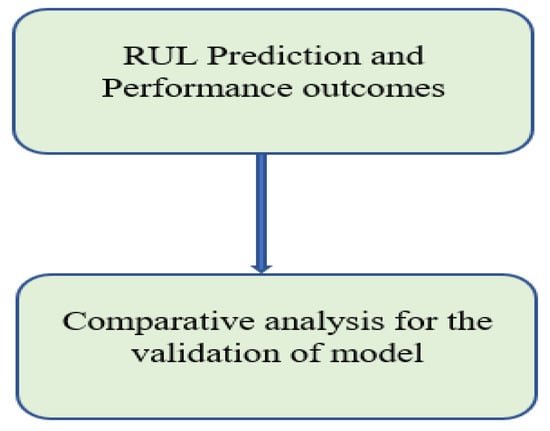
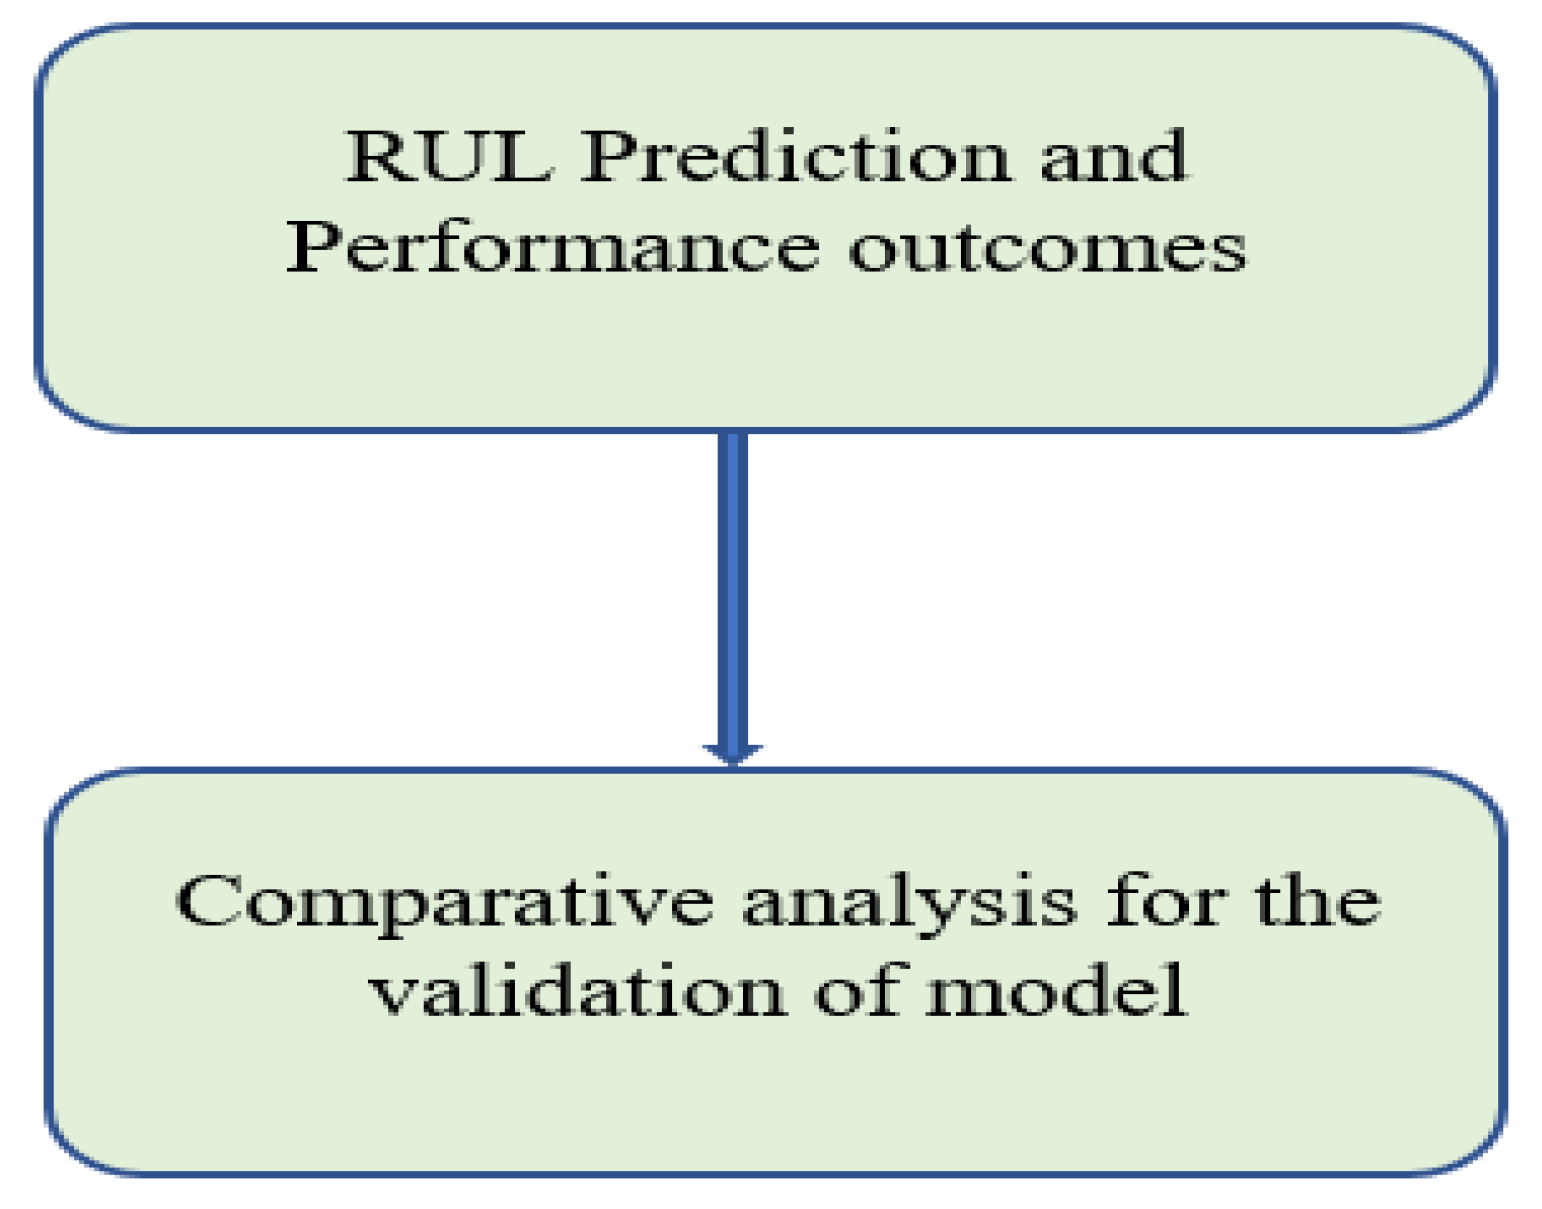
Stage 3: Prediction and Investigation
In the last stage, as displayed in Figure 10, RUL prediction and performance indices are calculated by Root Mean Square Error (RMSE), Mean Absolute Error (MAE), Mean Square Error (MSE), and Root Square (R2), and various training dataset combinations are employed.
Figure 10.
Prediction and Investigation of data.
- (B)
- Selected ML Algorithms
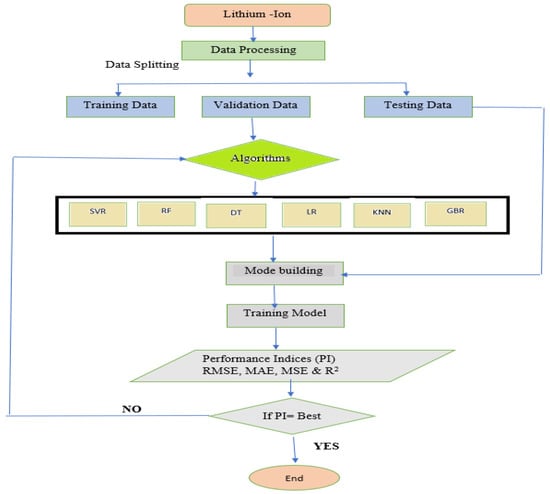
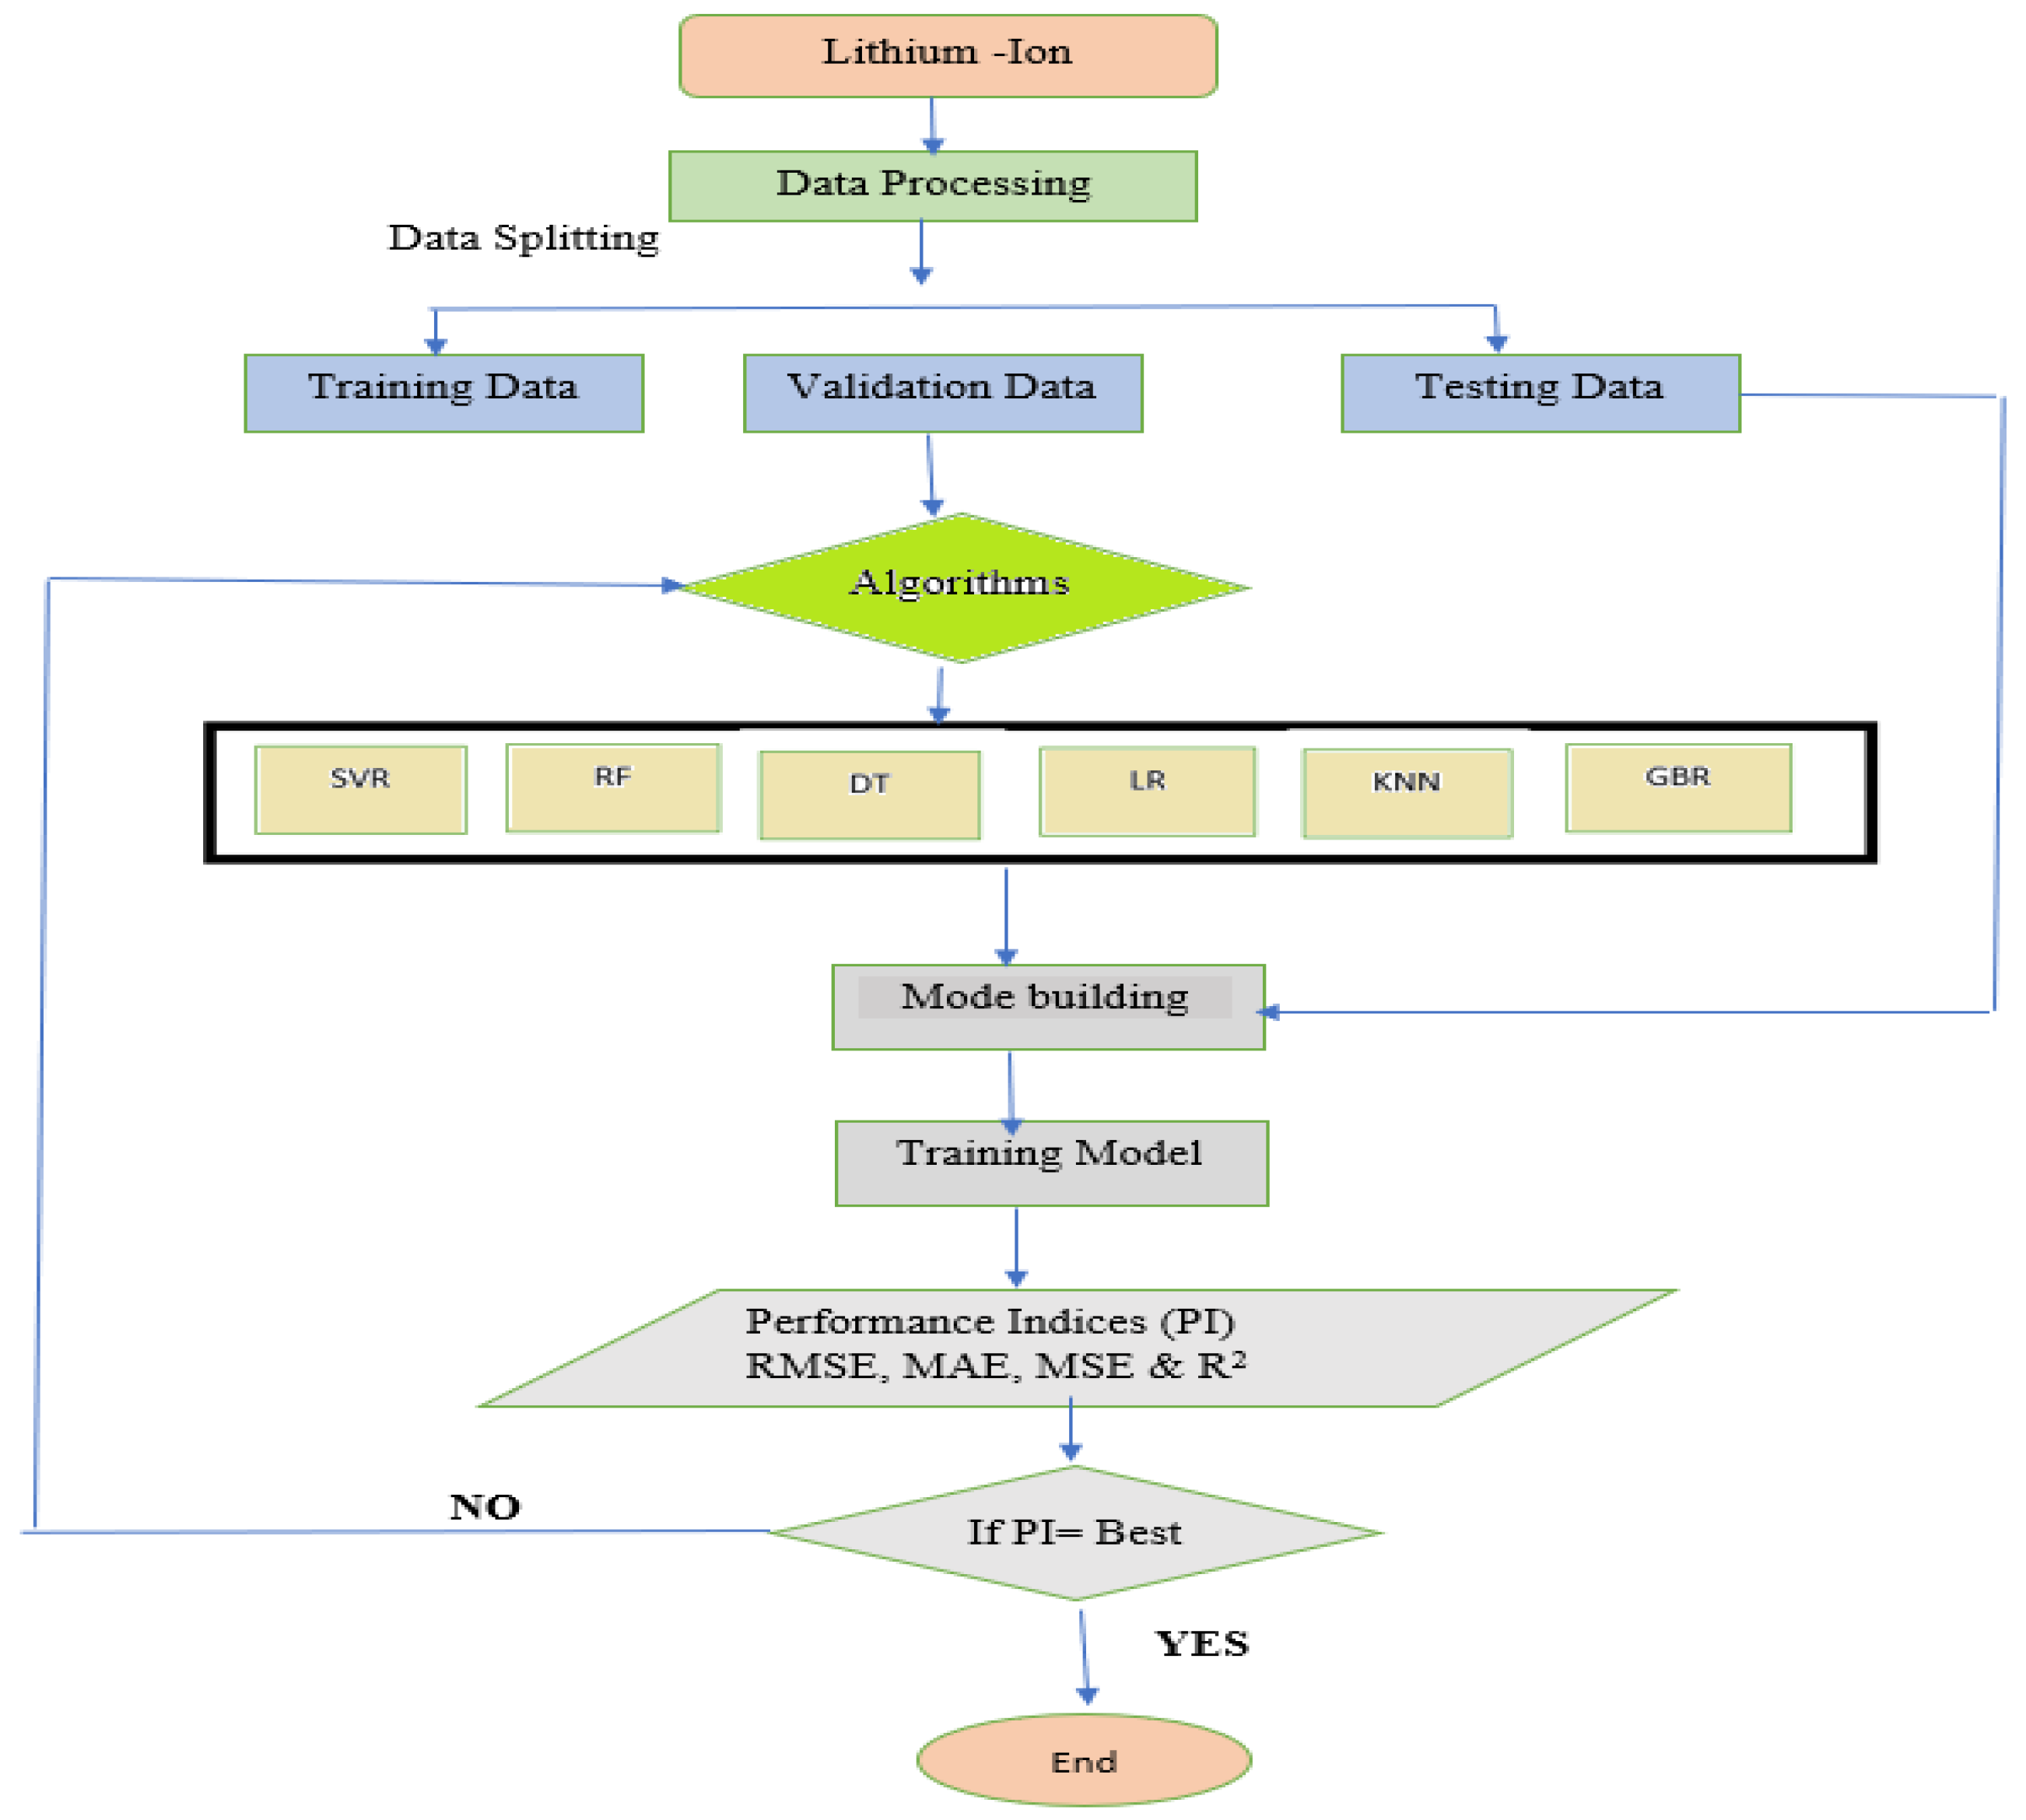
The efficacy of a battery is determined by determining its remaining usable life. Through the identification of elements that will raise and improve their efficiency, it supports the development and testing of numerous EV variations. The method involves a number of parameters. Engineering difficulties with non-linearity and complexity can be modelled using machine learning approaches. ML approaches offer a non-invasive alternative with good accuracy and little processing, in contrast to the temporal constraints of battery degradation. The report provides a thorough and impartial assessment of the difficulties. Individual studies of numerous RUL evaluation methods are conducted. Finally, an overview that focuses on applications is provided, emphasizing the benefits in relations of accuracy and efficiency. The planned technique has six different algorithms that are used for obtaining the values of MSE, MAE, RMSE, and R Squared error. Figure 11 shows the flow chart for the proposed method.
Figure 11.
Flow chart for proposed method.
Random Forest Regression:
Random Forest, RF, may be applied for each type and regression, and it can manage a tremendous quantity of information. Many parallels exist between decision tree and random forest. The most basic distinction is that after the set of rules is run at some time in education, RF generates a larger number of DTs. The three primary benefits of using RF are that it eliminates the overfitting problem, has extremely high predictive accuracy, and is simple to use. The Gini index, which is frequently used, must be understood when using random forests that are entirely dependent on categorization data. The formula used to decide how nodes on a decision tree branch is given below.
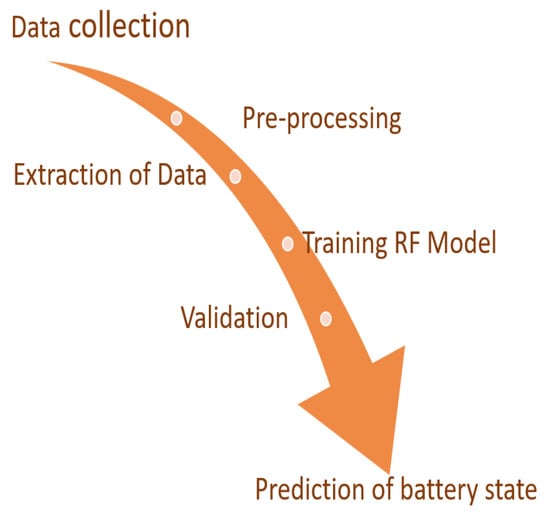
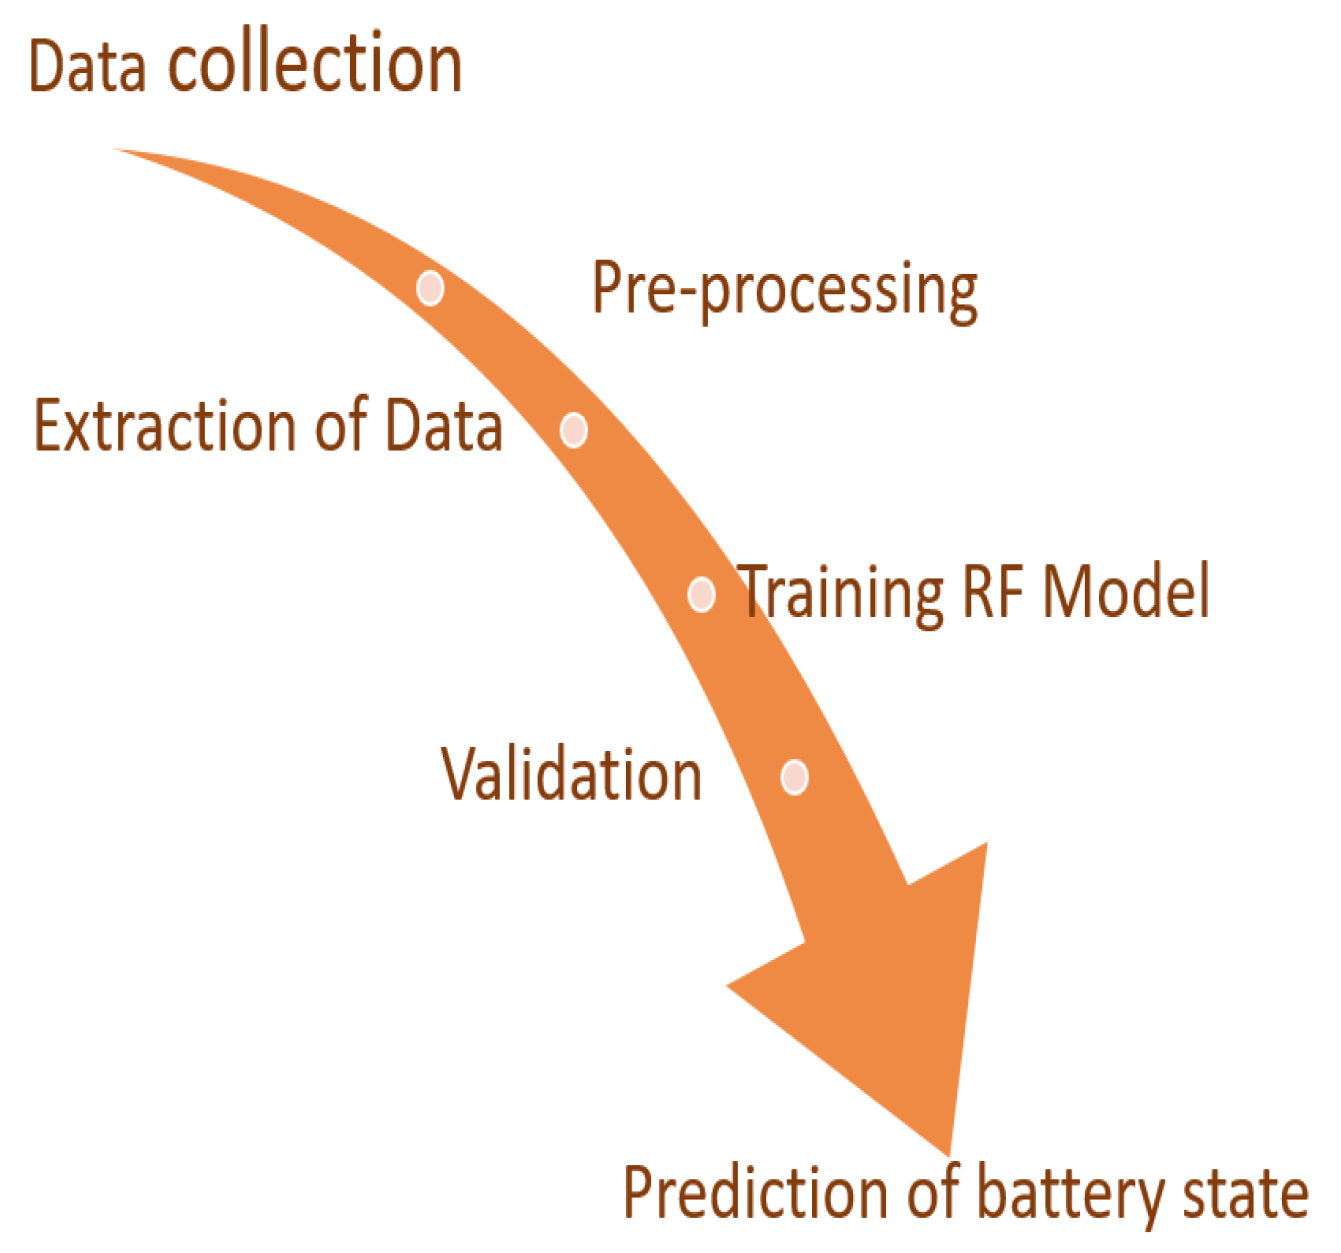
The capacity to anticipate batteries for the purpose of maintaining a consistent supply of energy and the best possible use of that energy, remaining usable life (RUL), must be calculated beforehand. When it comes to accurately anticipating the battery management systems’ state of charge, we decided to forecast RUL using a random forest model. With the help of this model, data may be gathered, pre-processed, and classified in order to forecast RUL. In terms of R2 and Root Mean Square Error (RMSE), the simulation is run. According to the findings, the ensemble random forest model has a greater level of prediction accuracy shows in Table 1. The random forest approaches utilized for RUL prediction are depicted in Figure 12.
Table 1.
Features of random forest method.
Figure 12.
Flow chart for RF method.
Decision Tree Regression:
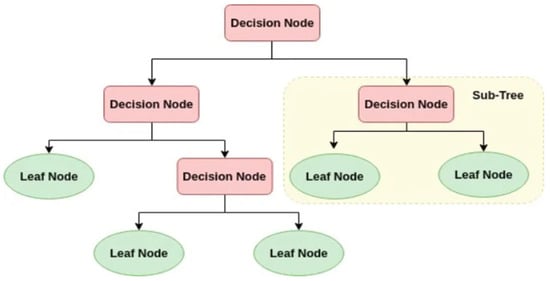
Although it can also be used to address regression problems, the decision tree approach to supervised learning is commonly used to solve classification problems. It is properly suited to each unique and continuous variable. Figure 13 depicts a tree-like structure with nodes and branches, beginning from the root node and progressing along extra branches to the leaf nodes. The central node represents the dataset’s features, whereas branches indicate decision-making techniques, and leaf nodes represent results.
Figure 13.
Decision tree Regression.
To determine which direction the node should head in, entropy analyzes the likelihood of a chosen outcome. It is more theoretically difficult to calculate than the Gini index since it uses a logarithmic feature. Entropy can also be used to analyze the branching patterns of nodes in a selection tree.
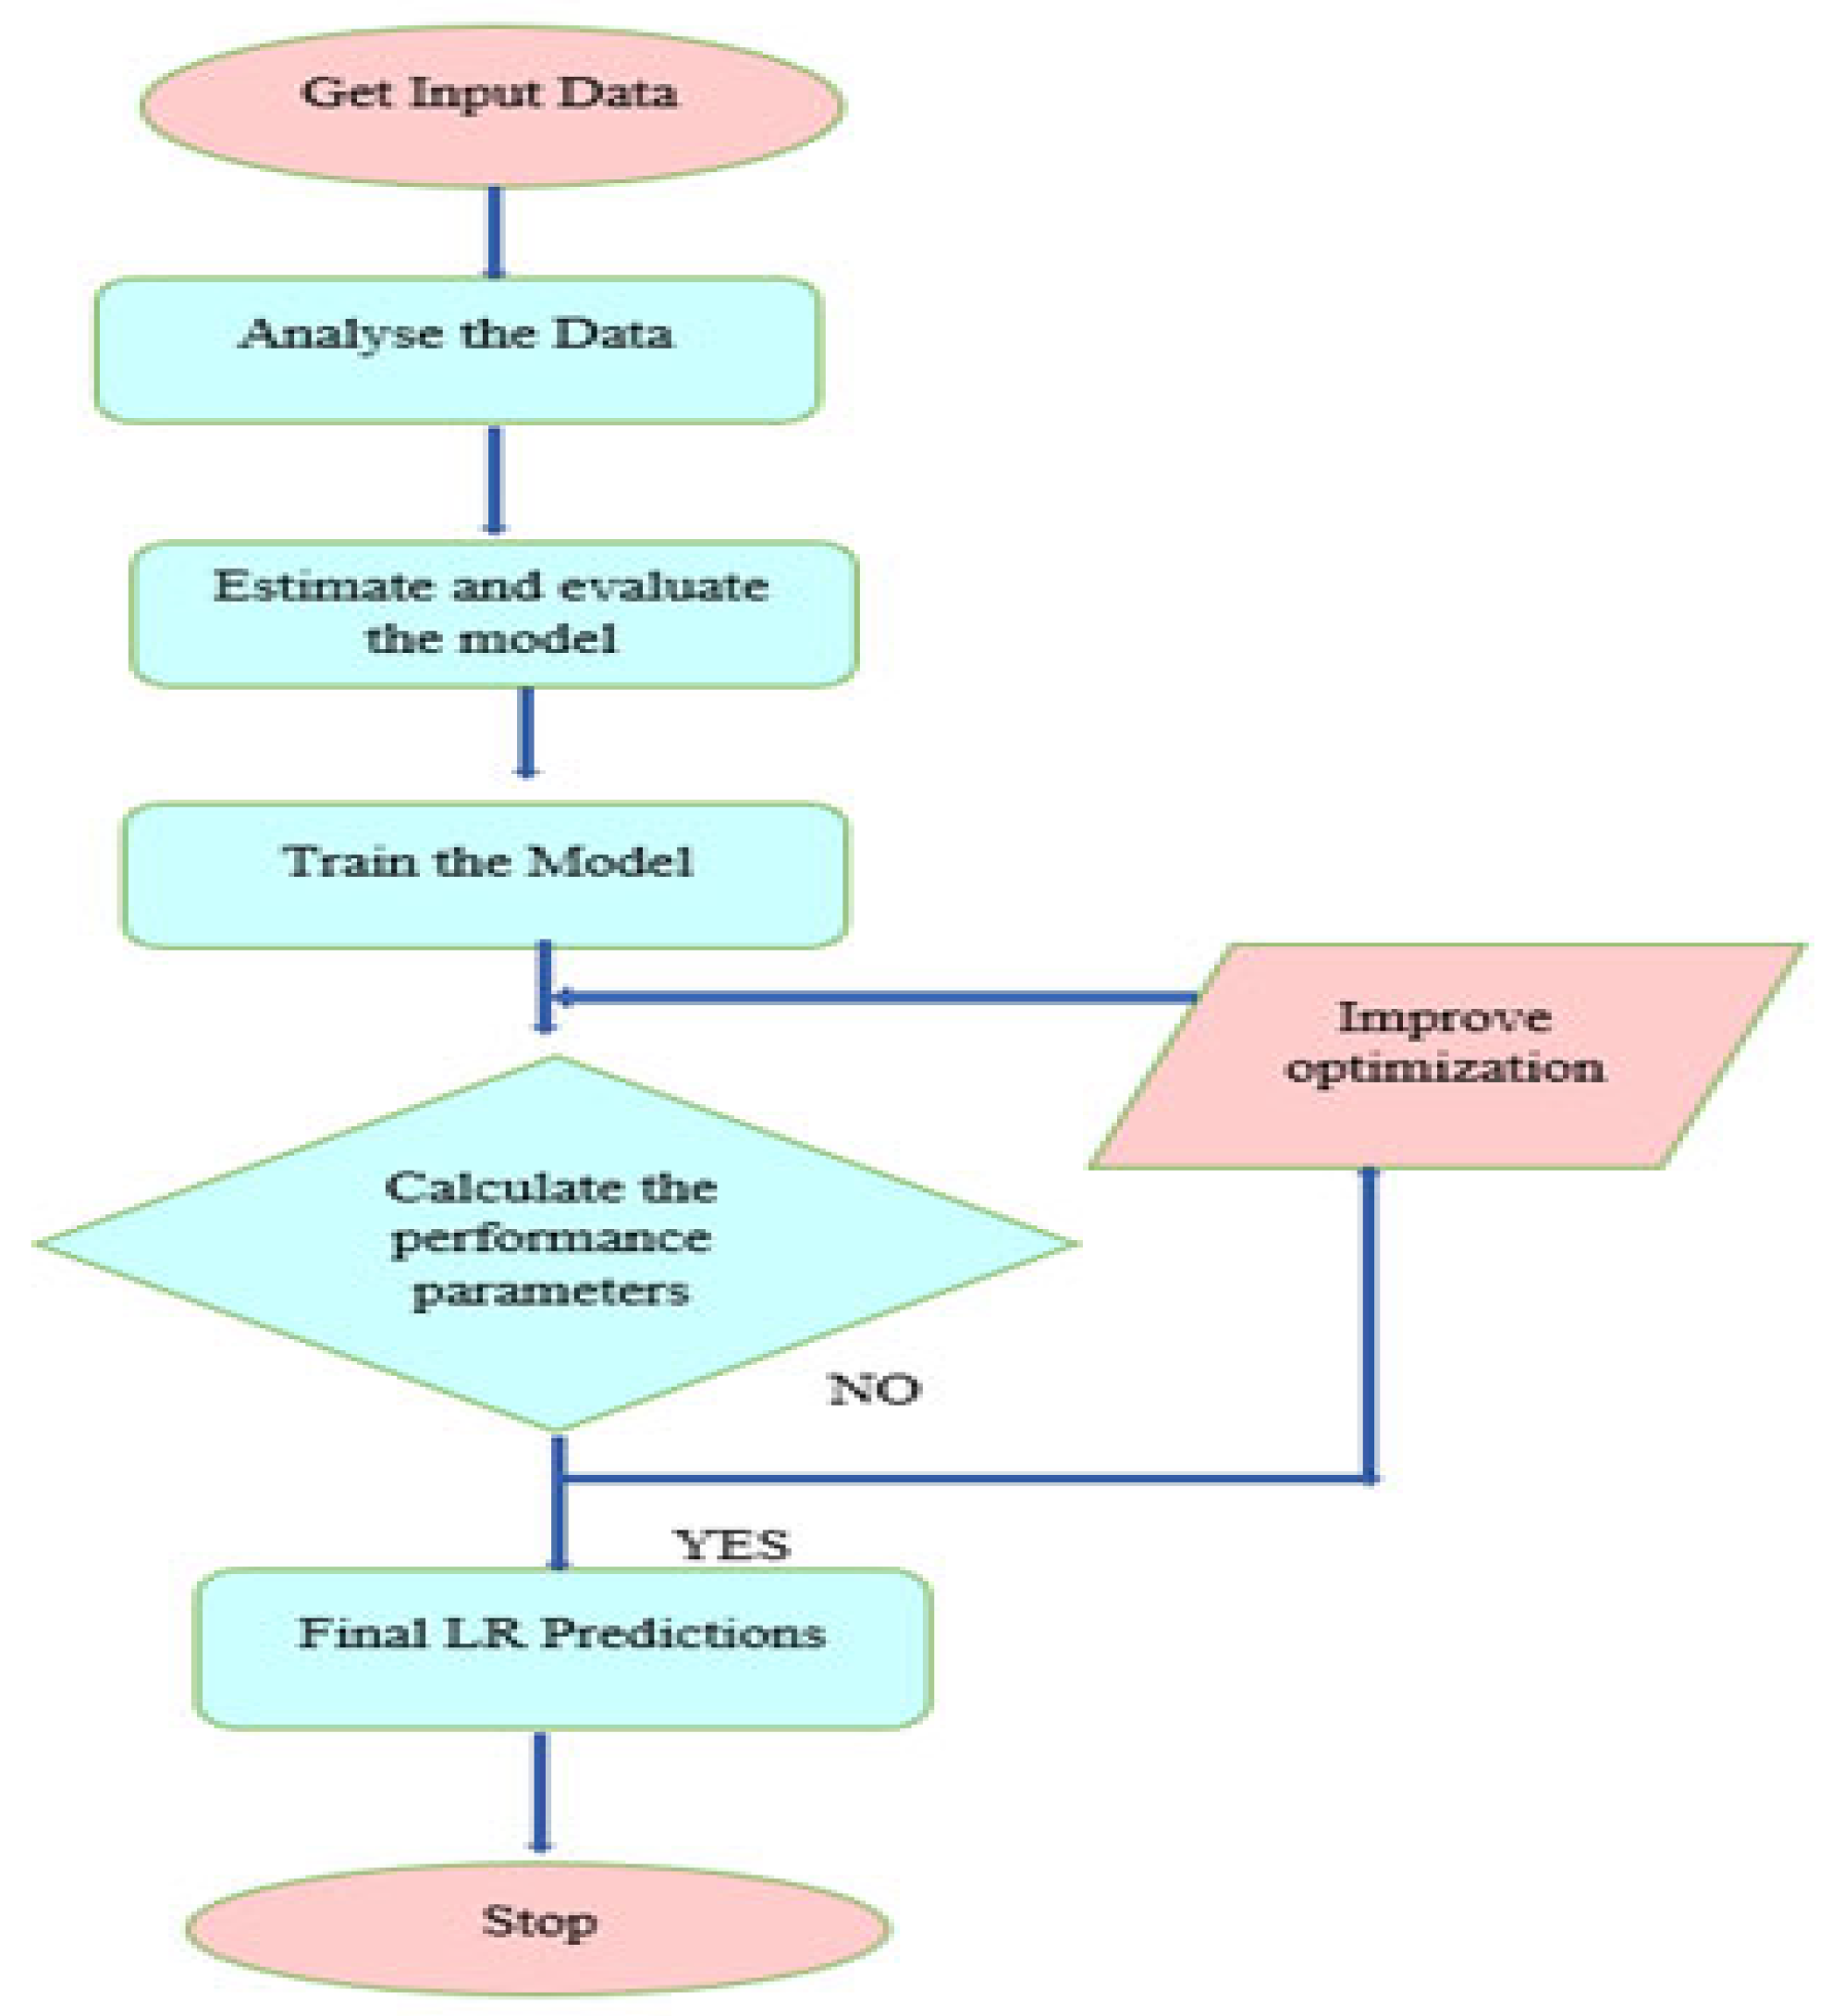
The DT classifier generates a final tree with leaves that reflect the final prediction and branches that represent the observations [43]. The dataset is split up into a number of subsets while the process is running, and these subsets are subsequently utilized to create the DT. The well-known classifier DT is applicable to both classification and regression. DT can therefore be applied to both numerical and categorical data. DTs are useful in a range of applications because they work well when the dataset contains missing values. Figure 14 shows the steps for predicting decision tree regression for RUL calculations shows in Table 2.
Figure 14.
Decision tree regression for RUL.
Table 2.
Features of decision tree method.
Linear Regression (LR):
Linear regression is one of the most well-liked and straightforward device mastery procedures for predictive evaluation. Predictive analysis is used to explain what is predicted, and linear regression anticipates continuous values such as age, profitability, and other factors. In response to the unbiased variable (x), the dependent variable (y) adjusts, and the linear dating between the structured and independent variables is confirmed. The regression line is the path that aims to maximize the statistics among the dependent and independent variables. The equation for the regression line is:
where y = dependent variable; x = independent variable; and a0 = Intercept of line.
Procedures for linear regression are applied if the output is a continuous variable. Instead, grading algorithms are utilized when output is classified into categories like pass/fail, good/average/bad, etc. [44] shows in Table 3. The LR method is the basic regression algorithm, but we also have other regression algorithms or classifying behaviors. Figure 15 displays the flow chart for the linear regression model.
Table 3.
Features of linear regression.
Figure 15.
Flow chart for linear regression.
Gradient Boosting Regression:
An electric vehicle’s battery management system must be reliable and durable in order to anticipate the state of charge. Lithium-ion batteries are heavily dependent on ageing information, which is occasionally pricey, or no longer accessible online. For the purpose of electrical car programs, it is strongly advised in [45] that the state of rate estimate of lithium-ion battery systems be carried out using a gradient boosting approach, which may also accumulate the nonlinear relationship model through offline training. The intensive gradient boosting methodology, which successfully works and accelerates, is used in the tree-based learning method.
To correct the flaws in the prior model, gradient boosting tree ensembles upload more timber at each stage. Those models are typically applied when the heterogeneity of the features is excessive. Unlike other boosting techniques like AdaBoost, this uses gradients to identify flaws. Additionally, the Gradient Boosting model is more resilient against outliers than the AdaBoost approach [46]. Evidently, gradient boosting is an expanded form of AdaBoost that is capable of handling unique loss features showed in Table 4. Typical loss features used in regression models include “huber” and “absolute” loss capabilities. More protection against outliers is provided by these loss features than by squared loss capabilities. We employed the Huber loss function as the loss function parameter in our gradient boosting regressor model. x Consider a training set (xi, yi) with i = 1, 2, 3, …, N and a differential loss function (L(yi, z), here referred to as “deviance”), where z is the predicted value. Set the model’s parameters to:
Table 4.
Features of gradient boosting regression method.
For each observation in each tree calculate the gradient which is given by:
Now, update the model of the succeeding tree with the gradient of the previous tree. This is given by:
For each x which belongs to the region of that tree (i.e., Rjm), the overall output is given by fm(x).
The steps evolved for prediction of RUL using GBR are given below:
- Step 1: Load the data.
- Step 2: Define the target variables.
- Step 3: Split the data into training and test sets.
- Step 4: Initialize the GBR.
- Step 5: Model the training data.
- Step 6: Predict the target.
- Step 7: Evaluate the performance.
Known as a Bayesian network, certain types of probabilistic graphics use Bayesian reasoning to calculate probabilities. Bayesian networks represent conditional dependency as edges in a directed graph with the objective of explaining conditional dependence and, by extension, causality. Using factors, these correlations can readily be exploited to extract data about the random variables in the graph [47].
To fully comprehend a Bayesian network, it is necessary to first grasp probability theory. It is vital to remember that the joint probability distribution of the random variables A_0, A_1, …, A_n, abbreviated as P(A_0, A_1, …, A_n), equals P(A_1|A_2, …, A_n) * P(A_2|A_3, …, A_n) *... * P(A_n). As it comprises N components, each with a localized probability, we can think of it as a factorized representation of the distribution.
A and B are independent as long as C has a known and stable value. Remember that the conditional independence between the random variables A and B equals C * P B, assuming that C is the only other random variable. This can also be expressed in the way we will utilize it, which is C = A community software.
A Bayesian network’s nodes and edges are directed acyclic graphs that represent conditional relationships and discrete random variables, respectively. Because the region (A, B) within the graph that implies A connects the random variables A and B, the joint opportunity distribution explicitly considers this. In order for it to execute inference, we must be aware of the P(B) possible values of A and B. Bayesian networks satisfy the nearby Markov asset, which asserts that a node is conditionally independent of its non-descendants given its parents. After simplification, In the Table 5 joint distribution of a Bayesian network is equal (mother and father(node)), as shown below:
Table 5.
Features of Bayesian Network.
This feature allows us to drastically reduce the amount of processing required in larger networks because most nodes often have few parents relative to the size of the network as a whole.
- (C)
- Performance Error Indices
To assess the model’s accuracy and gauge how well it is functioning in its predictions, the process of developing system mastering models must include this step. The evaluation metrics vary depending on the problem type. The main issue with the regression problem—possibly the most famous example of this kind of issue—is that a dataset’s objectives can only include real values [48]. The errors display how frequently the version makes erroneous predictions. The fundamental concept behind accuracy evaluation is to use a set of criteria to compare the original aim with the anticipated one. Following are the evaluation metrics:
C.1. MAE (Mean Absolute Error) is the difference between the original and predicted values calculated by averaging the absolute difference over the facts set. As the projected aim is the same, MAE is primarily a degree of accuracy for the labored model expressed on the same scale. If MAE is closer to zero, the more accurate the model is.
C.2. MSE (Mean Squared Error) depicts the variance between the original and predicted values as determined by square rooting the mean variance throughout the data set.
C.3. The error rate by the square root of MSE is known as (Root Mean Squared Error) RMSE.
C.4. R-Squared (Coefficient of determination) represents the degree to which the values fit the initial values. the proportions of values in the range of 0 and 1. The model improves as the value increases.
5. Results Analysis
Heat Map:
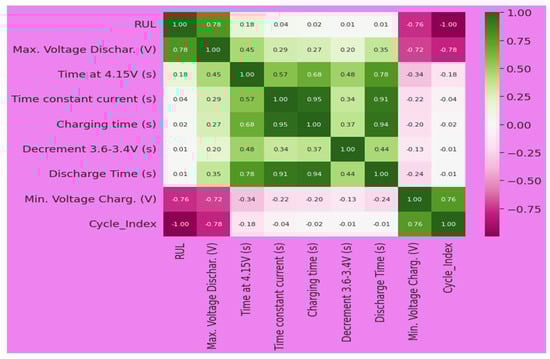
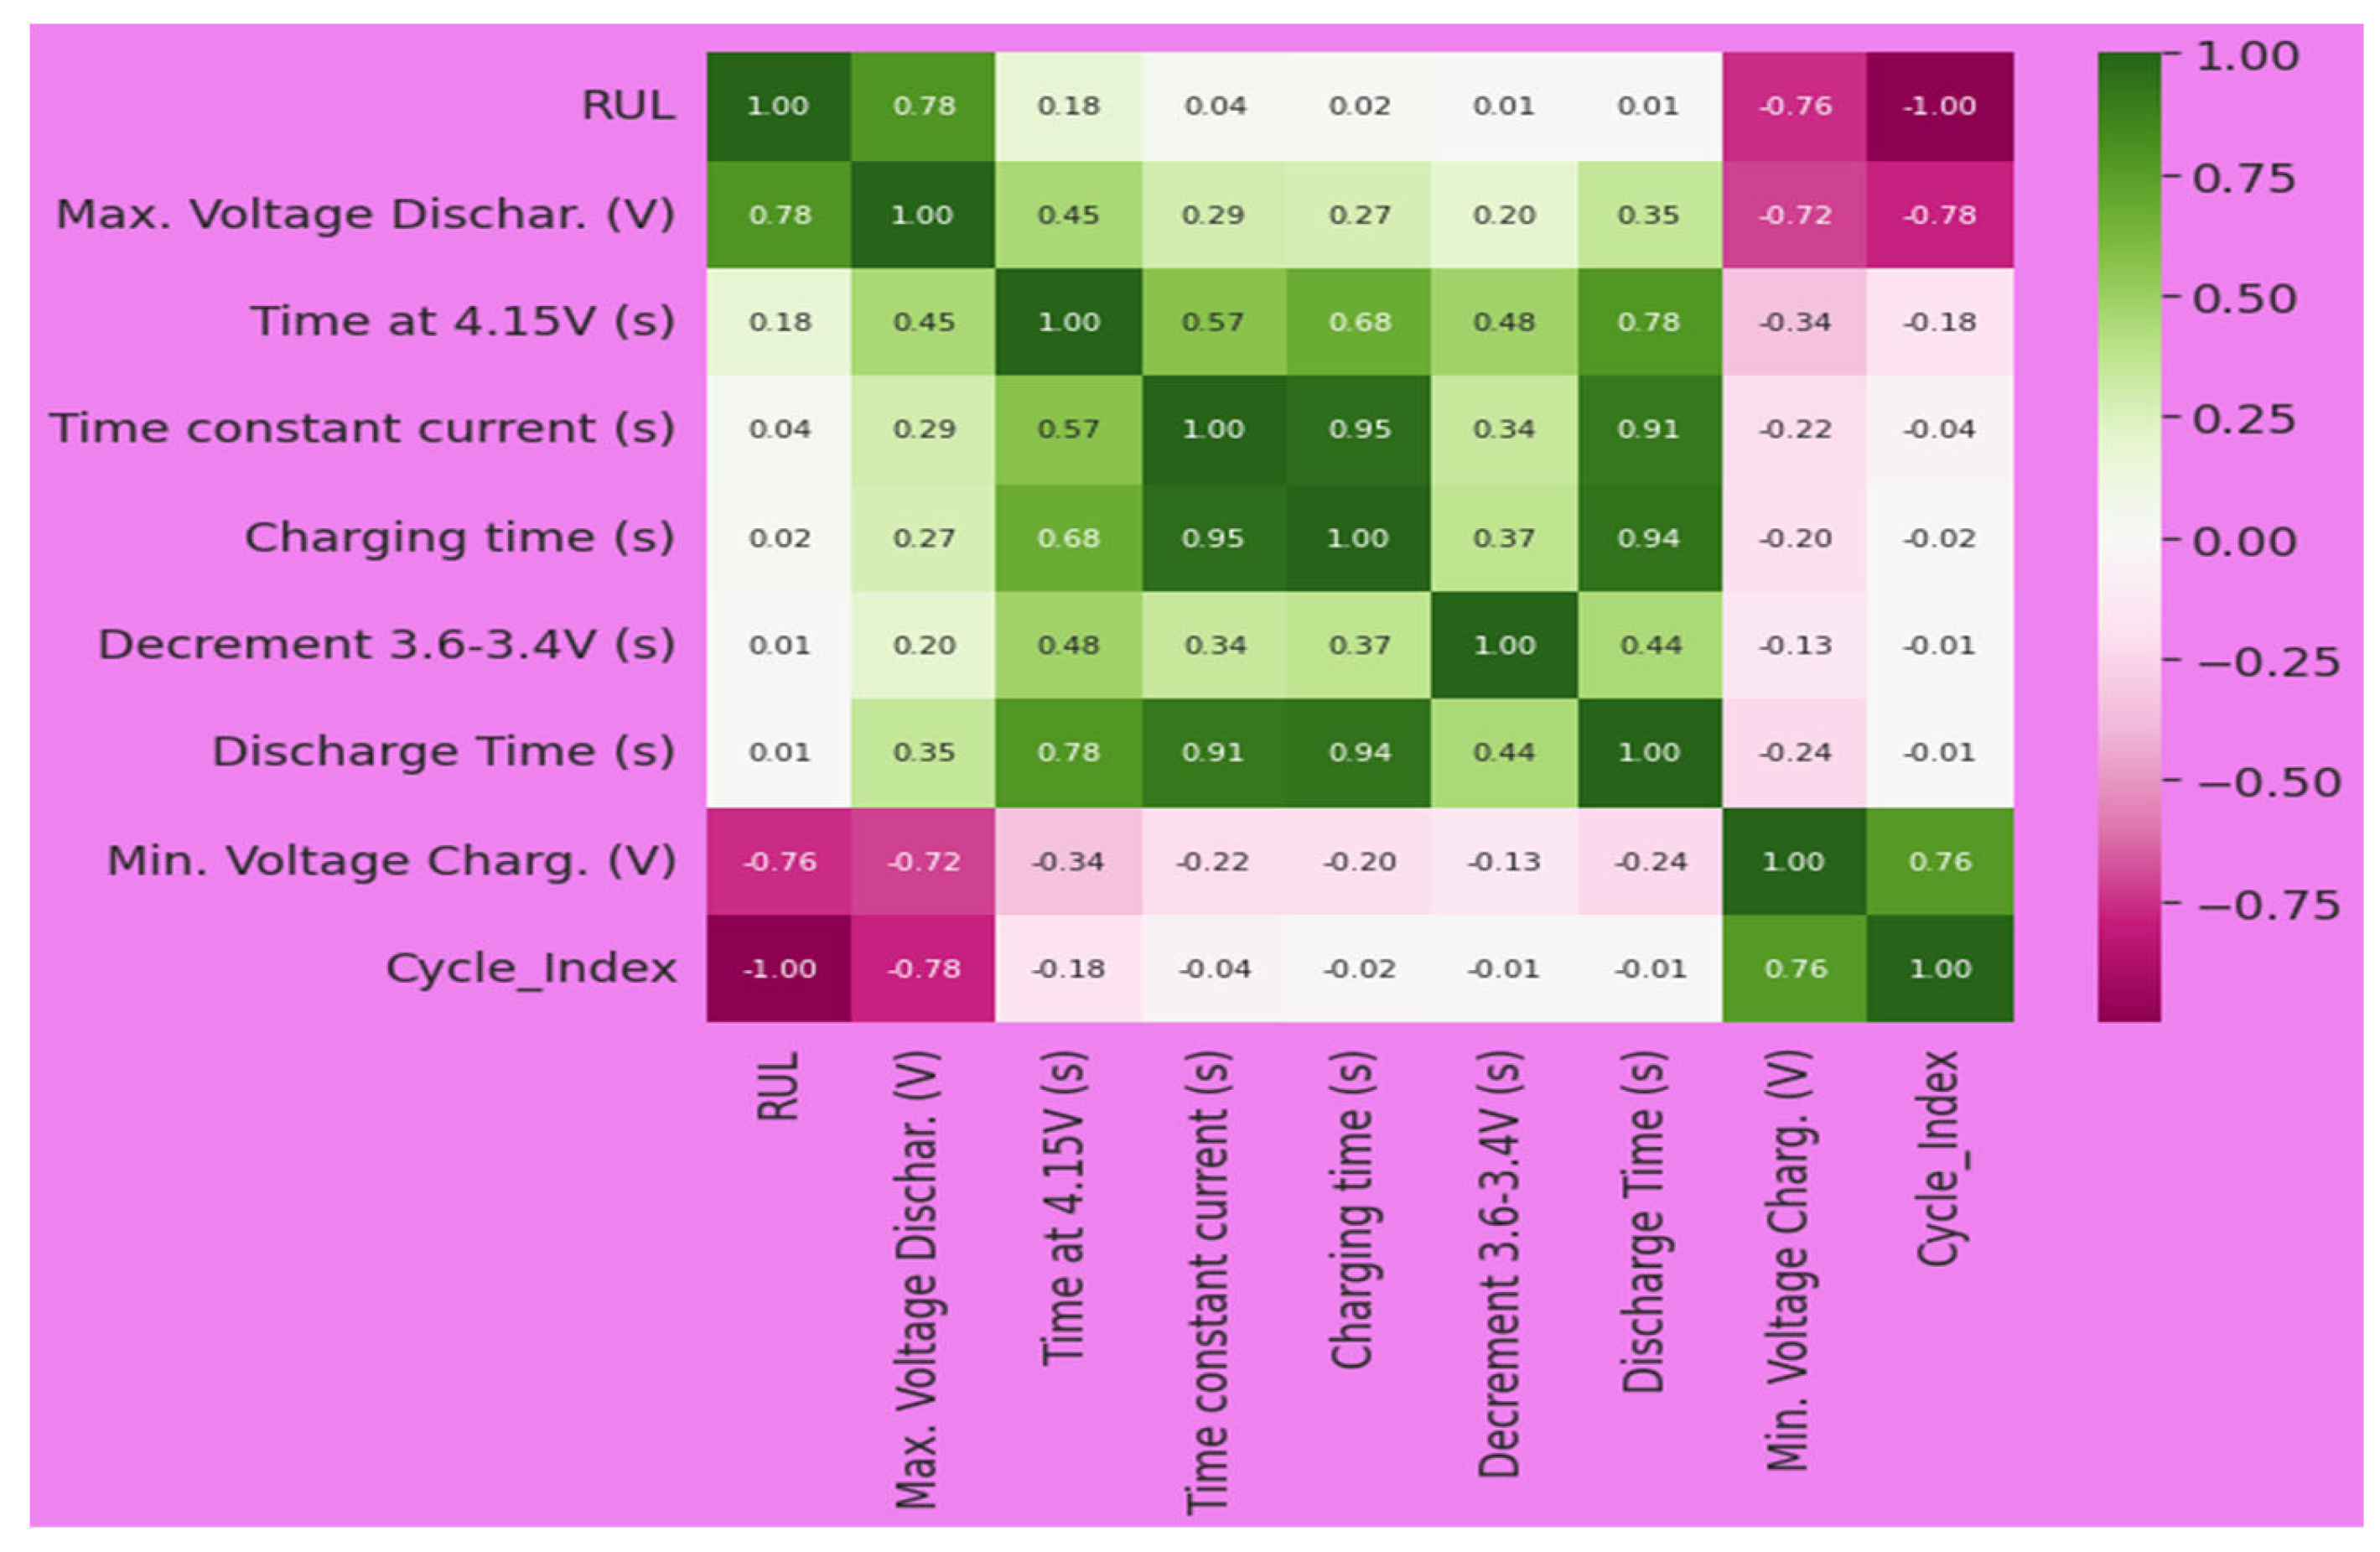
To show how closely related various factors are, these coefficients are presented as a warmth map. It aids in locating trends that are useful for constructing device learning models. The warmth map converts the correlation matrix into a color-coding system. The correlation matrix displays how the variables are connected to one another on a scale of −1 to 1, with 1 signifying an extremely bad connection and −1 a flawless exceptional correlation. The main function of the Heatmap in Seaborn is to show a color-coded correlation matrix enabling easy visualization of the relationships between the statistical data.
From the heatmap in Figure 16, it can be inferred that:
Figure 16.
Heat map for the features of the source dataset.
- Features Time Constant Current’ and Charging Time have a strong positive correlation with a value of 0.95.
- Features ‘RUL’ and ‘Maximum Voltage Discharge’ also have a strong positive correlation with a value of 0.78.
- Another positive correlation is between features ‘Time at 4.15 V’ and ‘Discharge Time’ with a value of 0.78.
- Feature ‘Minimum Voltage Discharge’ has a strong negative correlation with features ‘RUL’ and ‘Maximum Voltage Discharge’ with values −0.76 and −0.72, respectively.
Table 6 illustrates the numeric RUL prediction errors of the Hawaii Natural Energy Institute (HNEI) dataset’s batteries. In addition, it compares ML strategies. We looked at five separate machine learning algorithms for predicting assessment metrics and the range of evaluation predictive accuracy. In this case, the records are educated, and the high-quality version forecasts are evaluated using the four outstanding overall performance error indices MSE, RMSE, MAE, and R-Squared. In this case, inputs are defined for a wide range of voltages, moderns, and temperatures for separate charging and discharging cycles. This provides a simple framework for including an expansion of input features for prediction, as well as general elapsed real time for training all algorithms. The battery RUL problem is crucial for the efficient and reliable operation of battery-dependent systems and is an active area of research and development, particularly in industries where batteries play a vital role in powering critical applications. Predicting RUL accurately can help extend the lifespan of batteries, reduce maintenance costs, and enhance overall system performance and safety [49].
Table 6.
Comparison of ML methods with evaluation metrics.
In summary, the battery RUL problem is closely related to various Sustainable Development Goals, particularly those related to clean energy, sustainable infrastructure, climate action, responsible consumption, economic growth, and collaboration. Addressing the battery RUL problem through research and innovation can contribute significantly to achieving these global sustainability development goals:
Affordable and Clean Energy (SDG 7): one of the targets of SDG 7 aims to ensure access to affordable, reliable, sustainable, and modern energy for all. Batteries play a crucial role in energy storage and the transition to renewable energy sources such as solar and wind. Extending battery run-time can make these energy sources more reliable and accessible, helping to achieve the goal of clean and sustainable energy for everyone [50]. In systems relying on batteries, knowing the remaining useful life allows for efficient planning and operation. This information helps to ensure that energy storage systems and devices continue to function reliably until the end of their expected lifespan [51].
Climate Action (SDG 13): It’s aims to combat climate change and its impacts. Batteries are essential for electric vehicles and renewable energy systems, both of which play a critical role in reducing greenhouse gas emissions. Improving battery run-time can accelerate the adoption of these technologies and contribute to mitigating climate change. Further regarding goal 13.1, one of the key targets is to strengthen resilience and adaptive capacity to climate-related hazards and natural disasters [52].
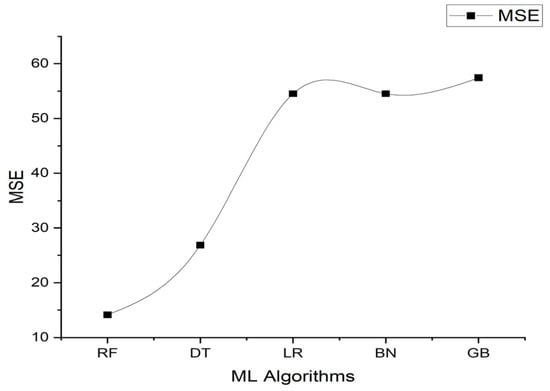
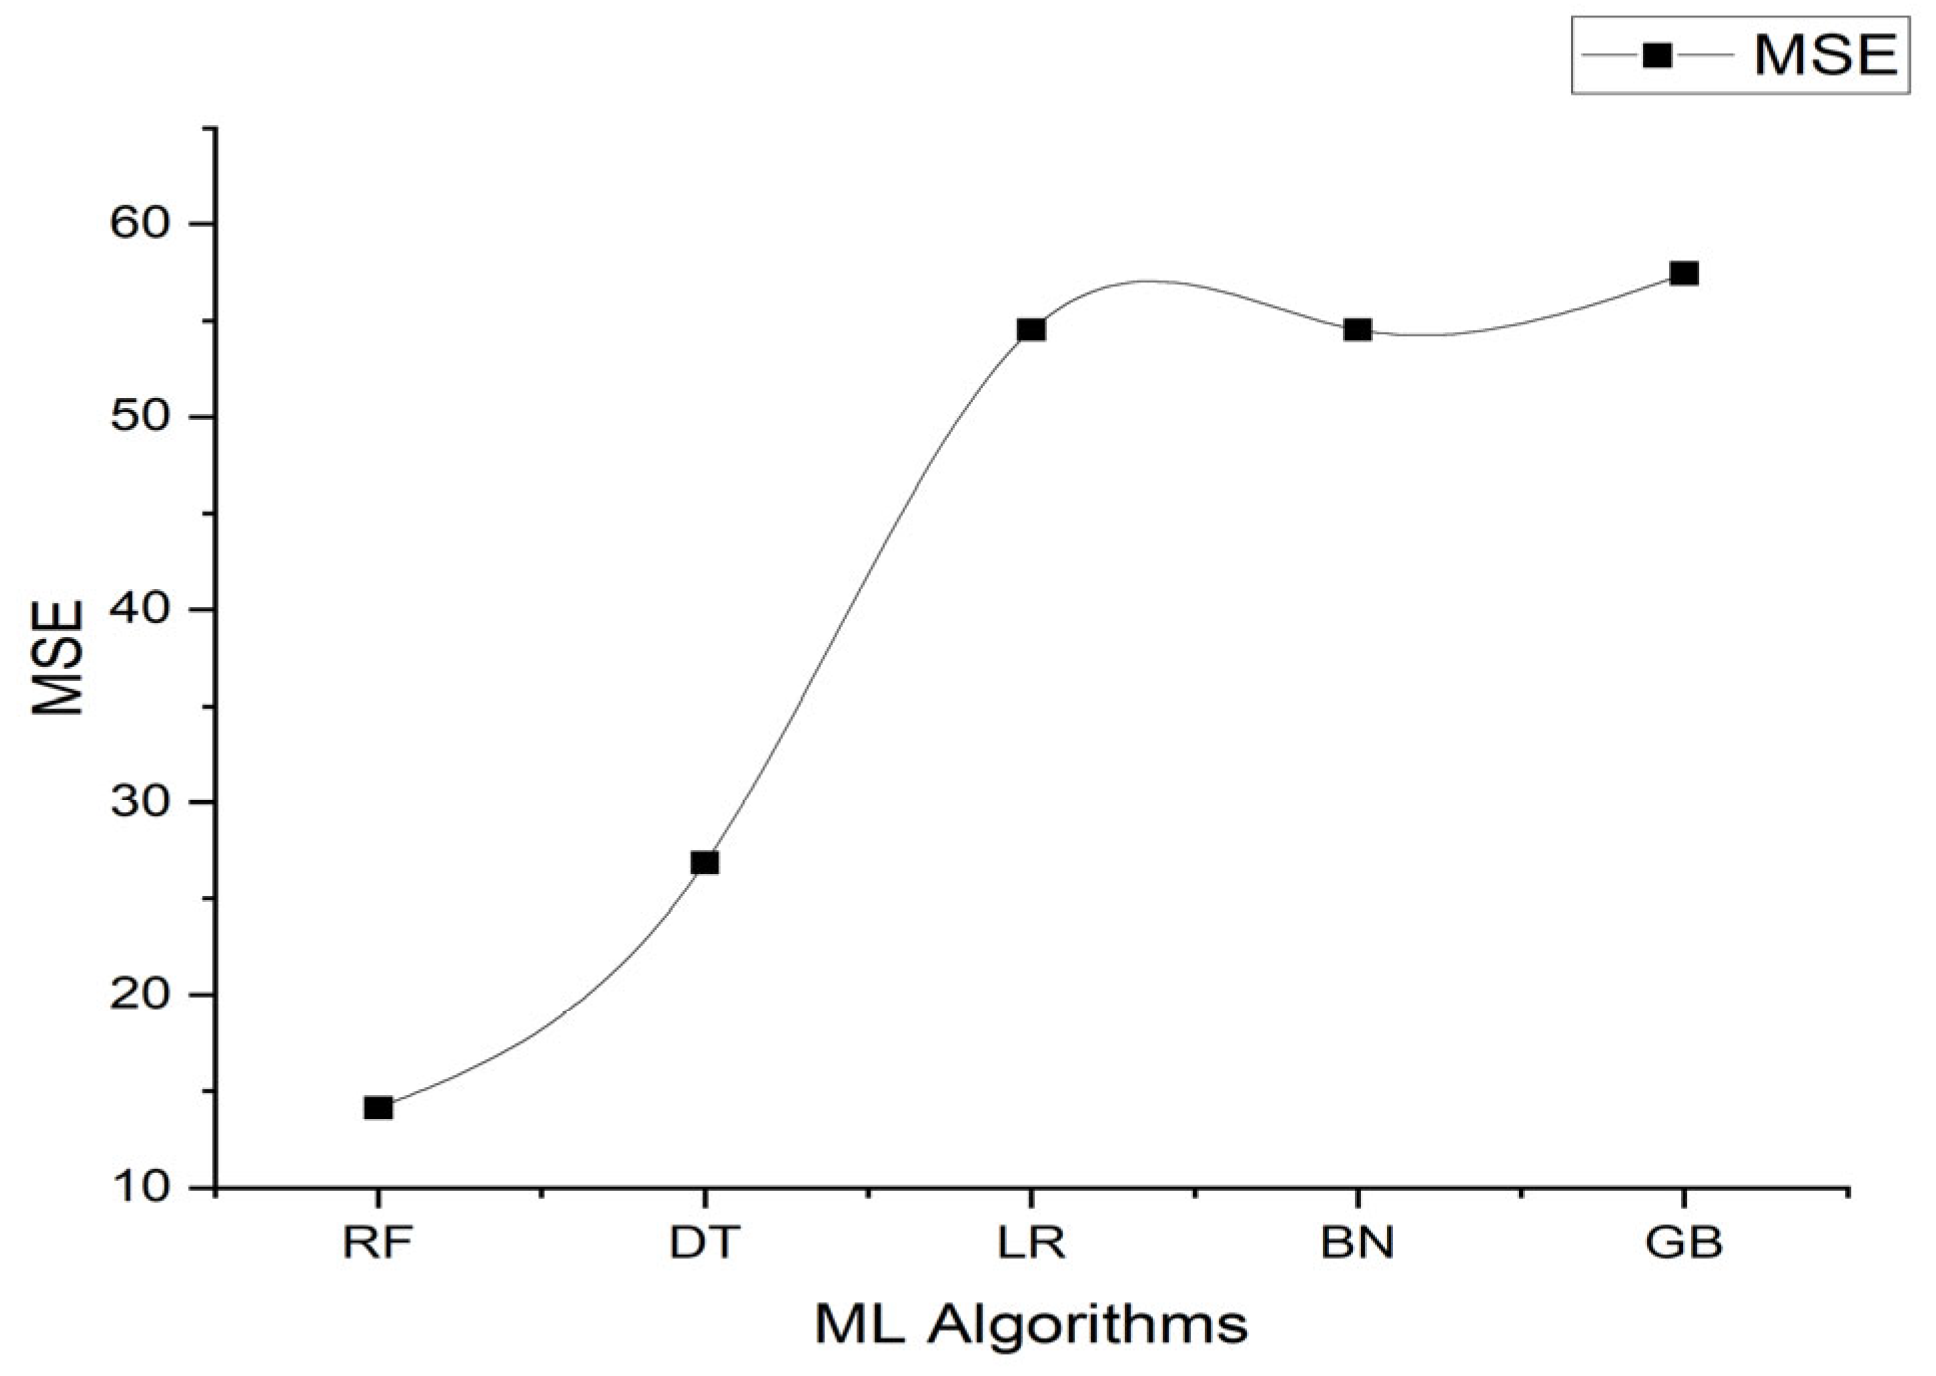
The comparison graph of RF, DT, LR, BN, and GBR are shown in Figure 17 and it is observed that the random forest regression (RF) method achieves the best value in MSE measurement with 14.1186 which is lower than all the other four methods. Therefore, this learning prediction method has higher robustness and better applicability. Accurate estimation of a battery’s remaining useful life is crucial in various climate-related applications, such as renewable energy systems and electric vehicles. By optimizing battery usage and ensuring batteries operate at their full lifespan, we can reduce the need for premature replacements and the associated environmental impacts, such as the carbon footprint of manufacturing and disposing of batteries [53].
Figure 17.
Mean Squared Error for different machine learning methods.
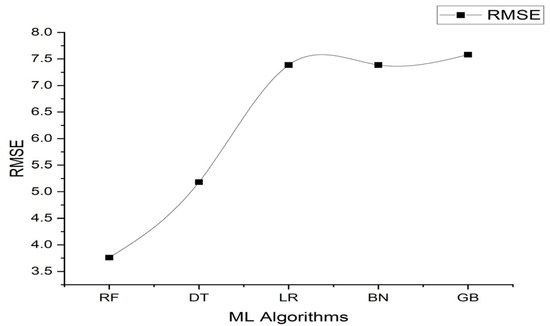
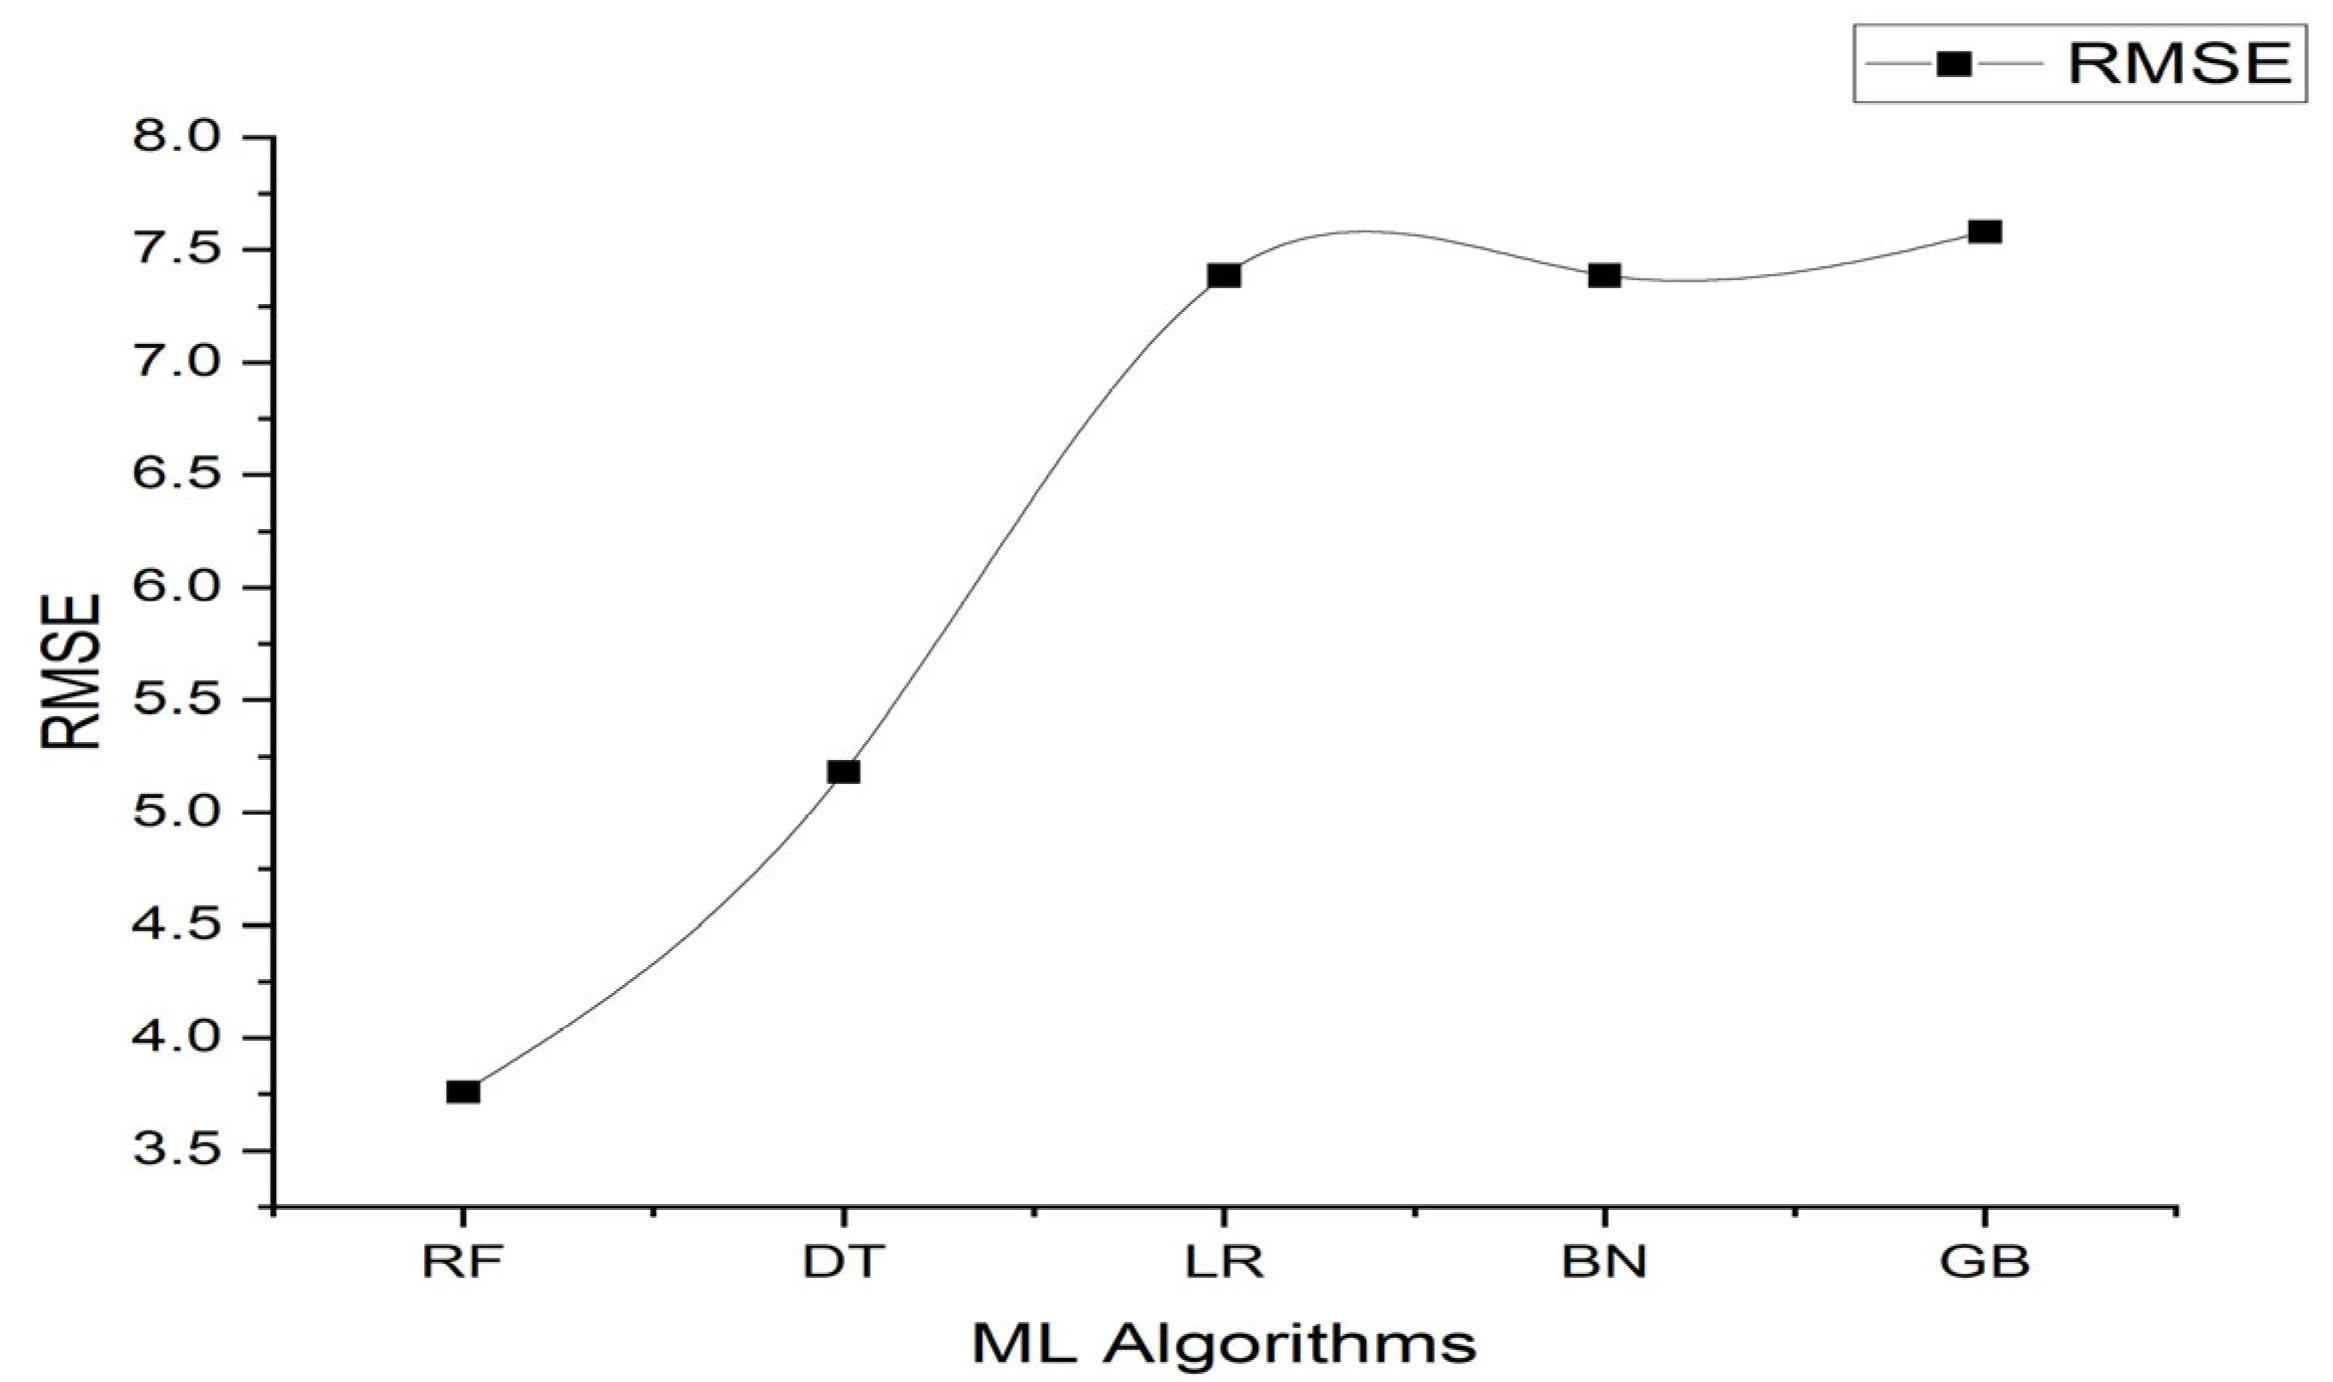
Figure 18 shows the training and prediction result for battery RUL prediction based on RMSE evaluation. It can also be seen that the random forest (RF) model stages the best performance for RUL prediction in terms of RMSE. This also verifies the advantage and superiority of all the five different machine learning algorithms.
Figure 18.
Root Mean Squared Error for different machine learning methods.
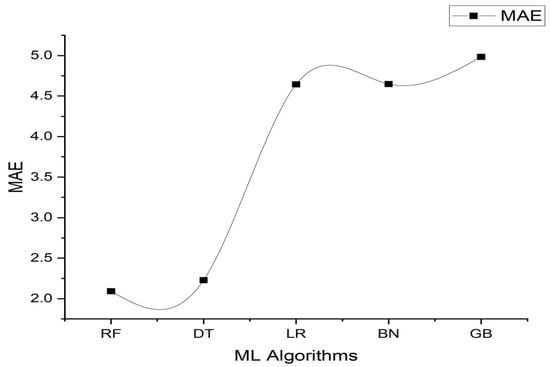
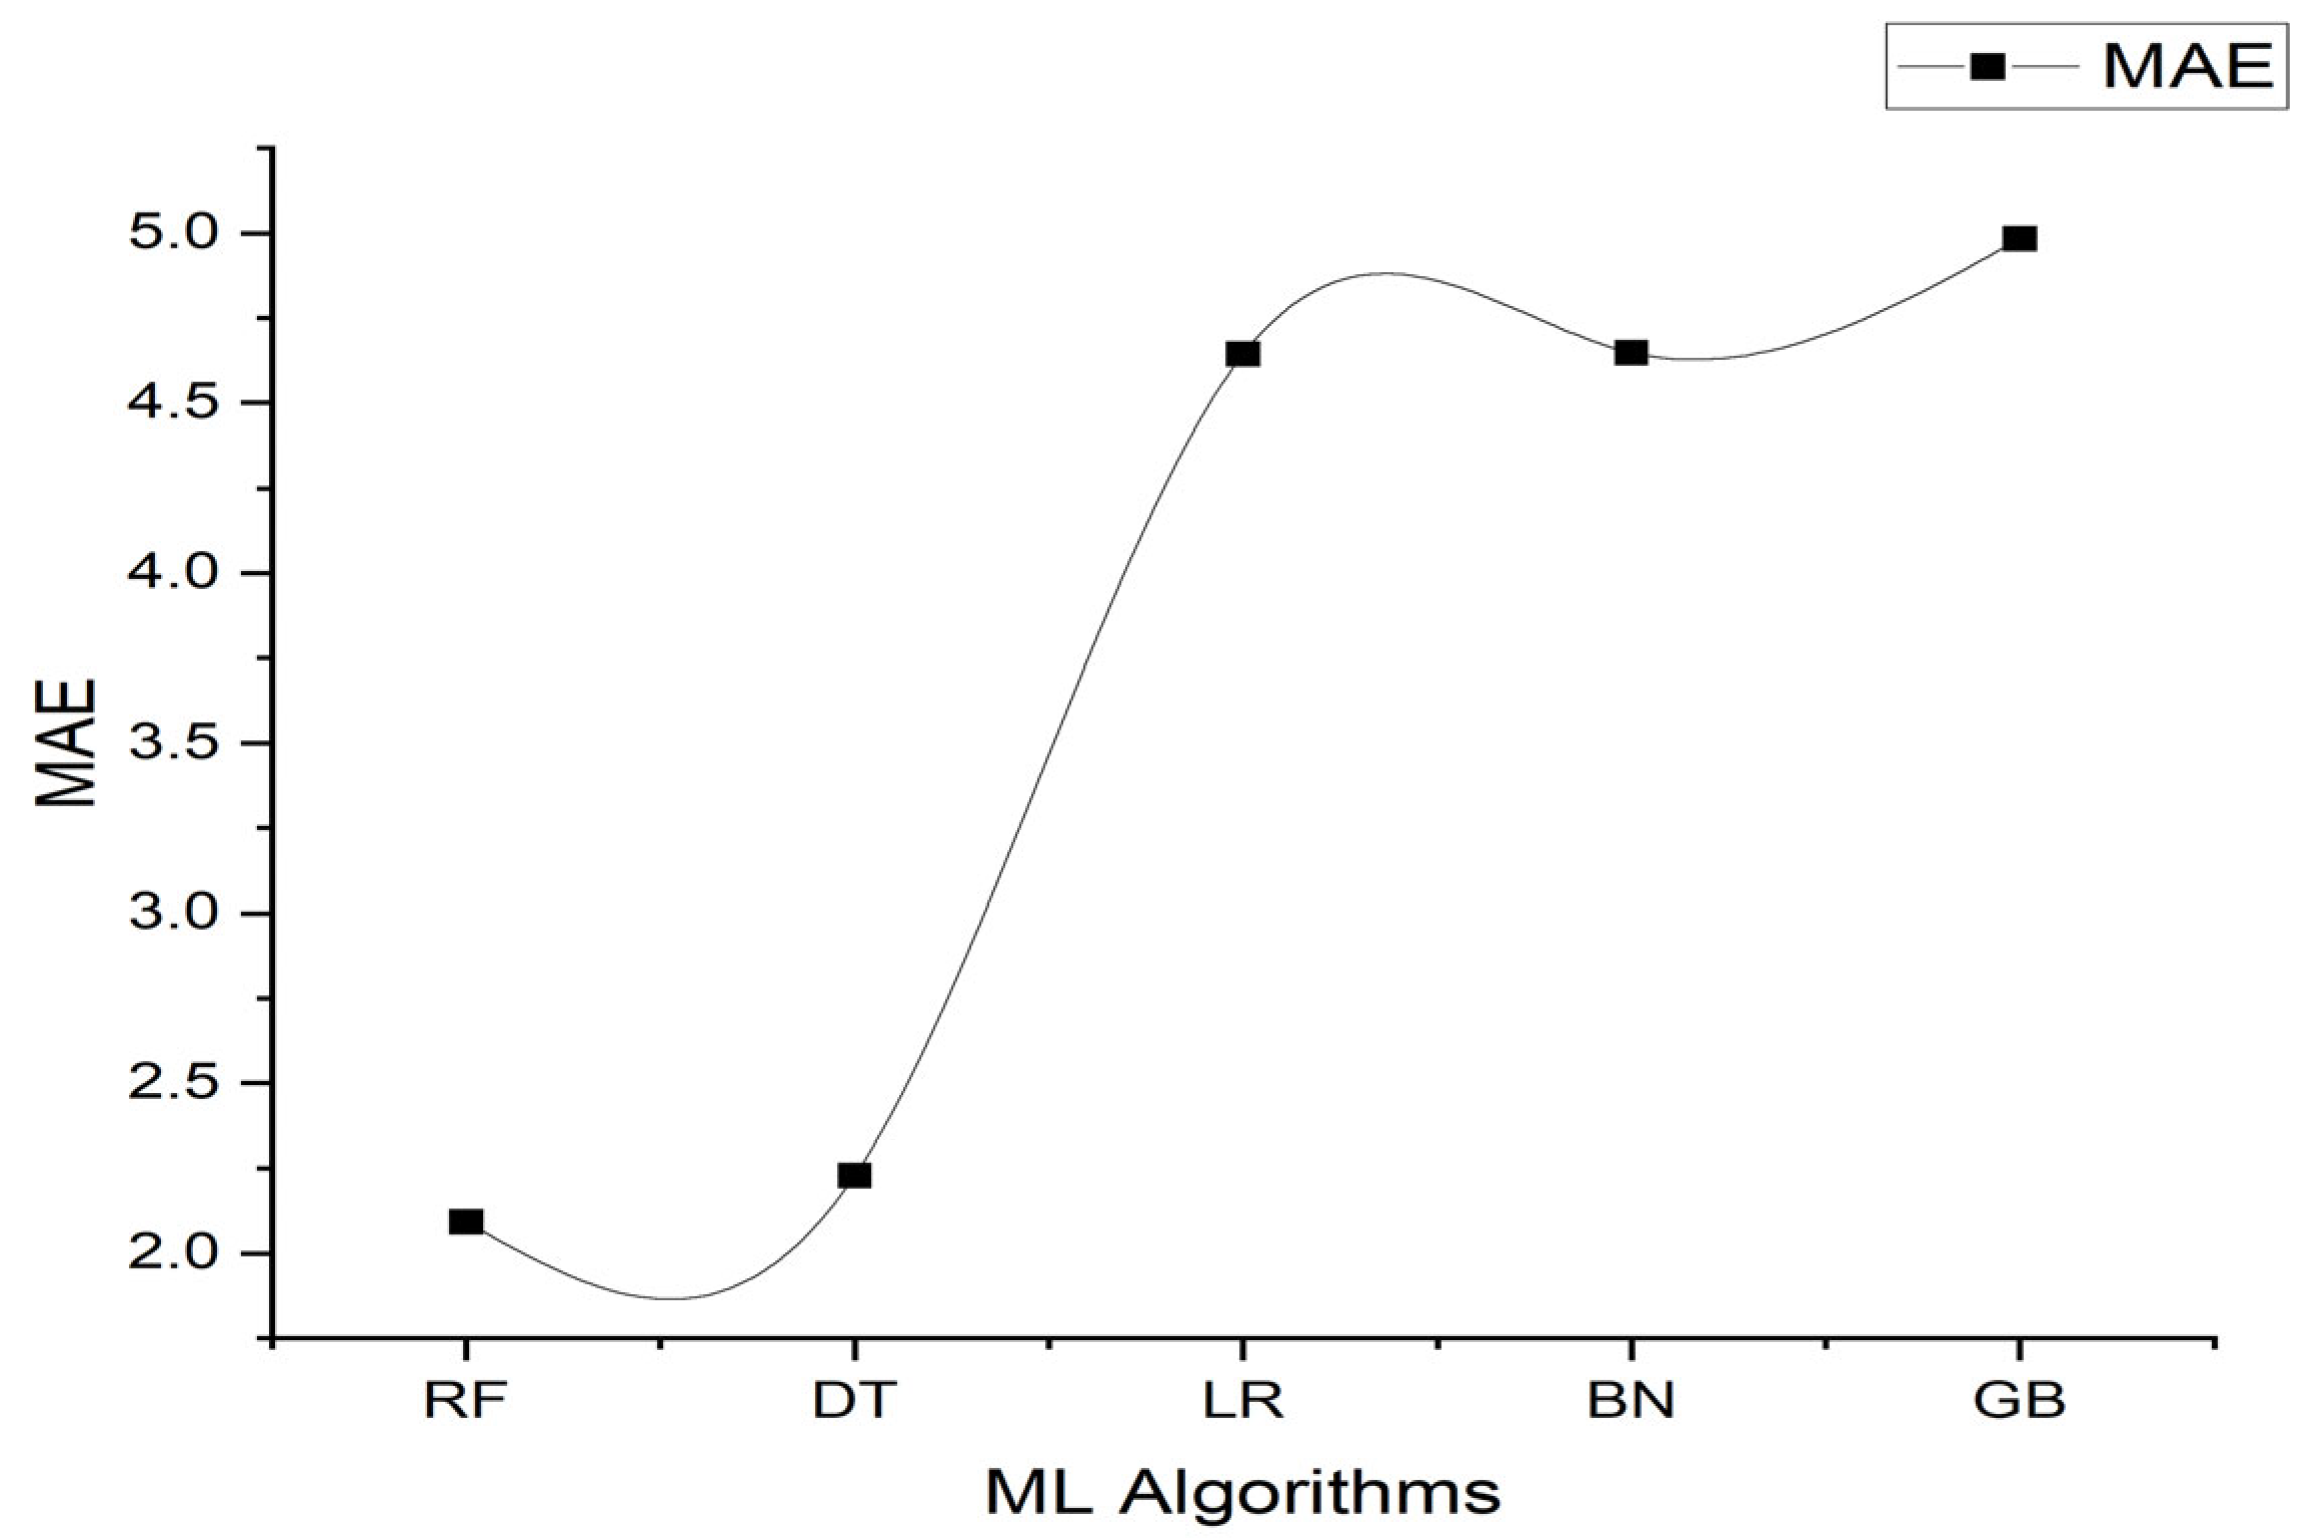
The MAE prediction of battery RUL is shown in Figure 19. This also verifies five different ML algorithms for prediction and determines that the random forest regression model has a good prediction capacity for determination of a battery’s RUL. This also validates the effectiveness of the model for prediction.
Figure 19.
Mean Absolute Error for different machine learning methods.
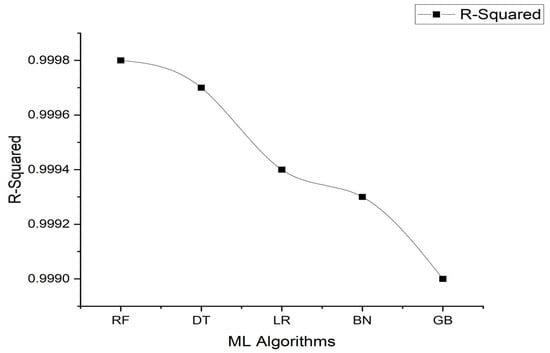
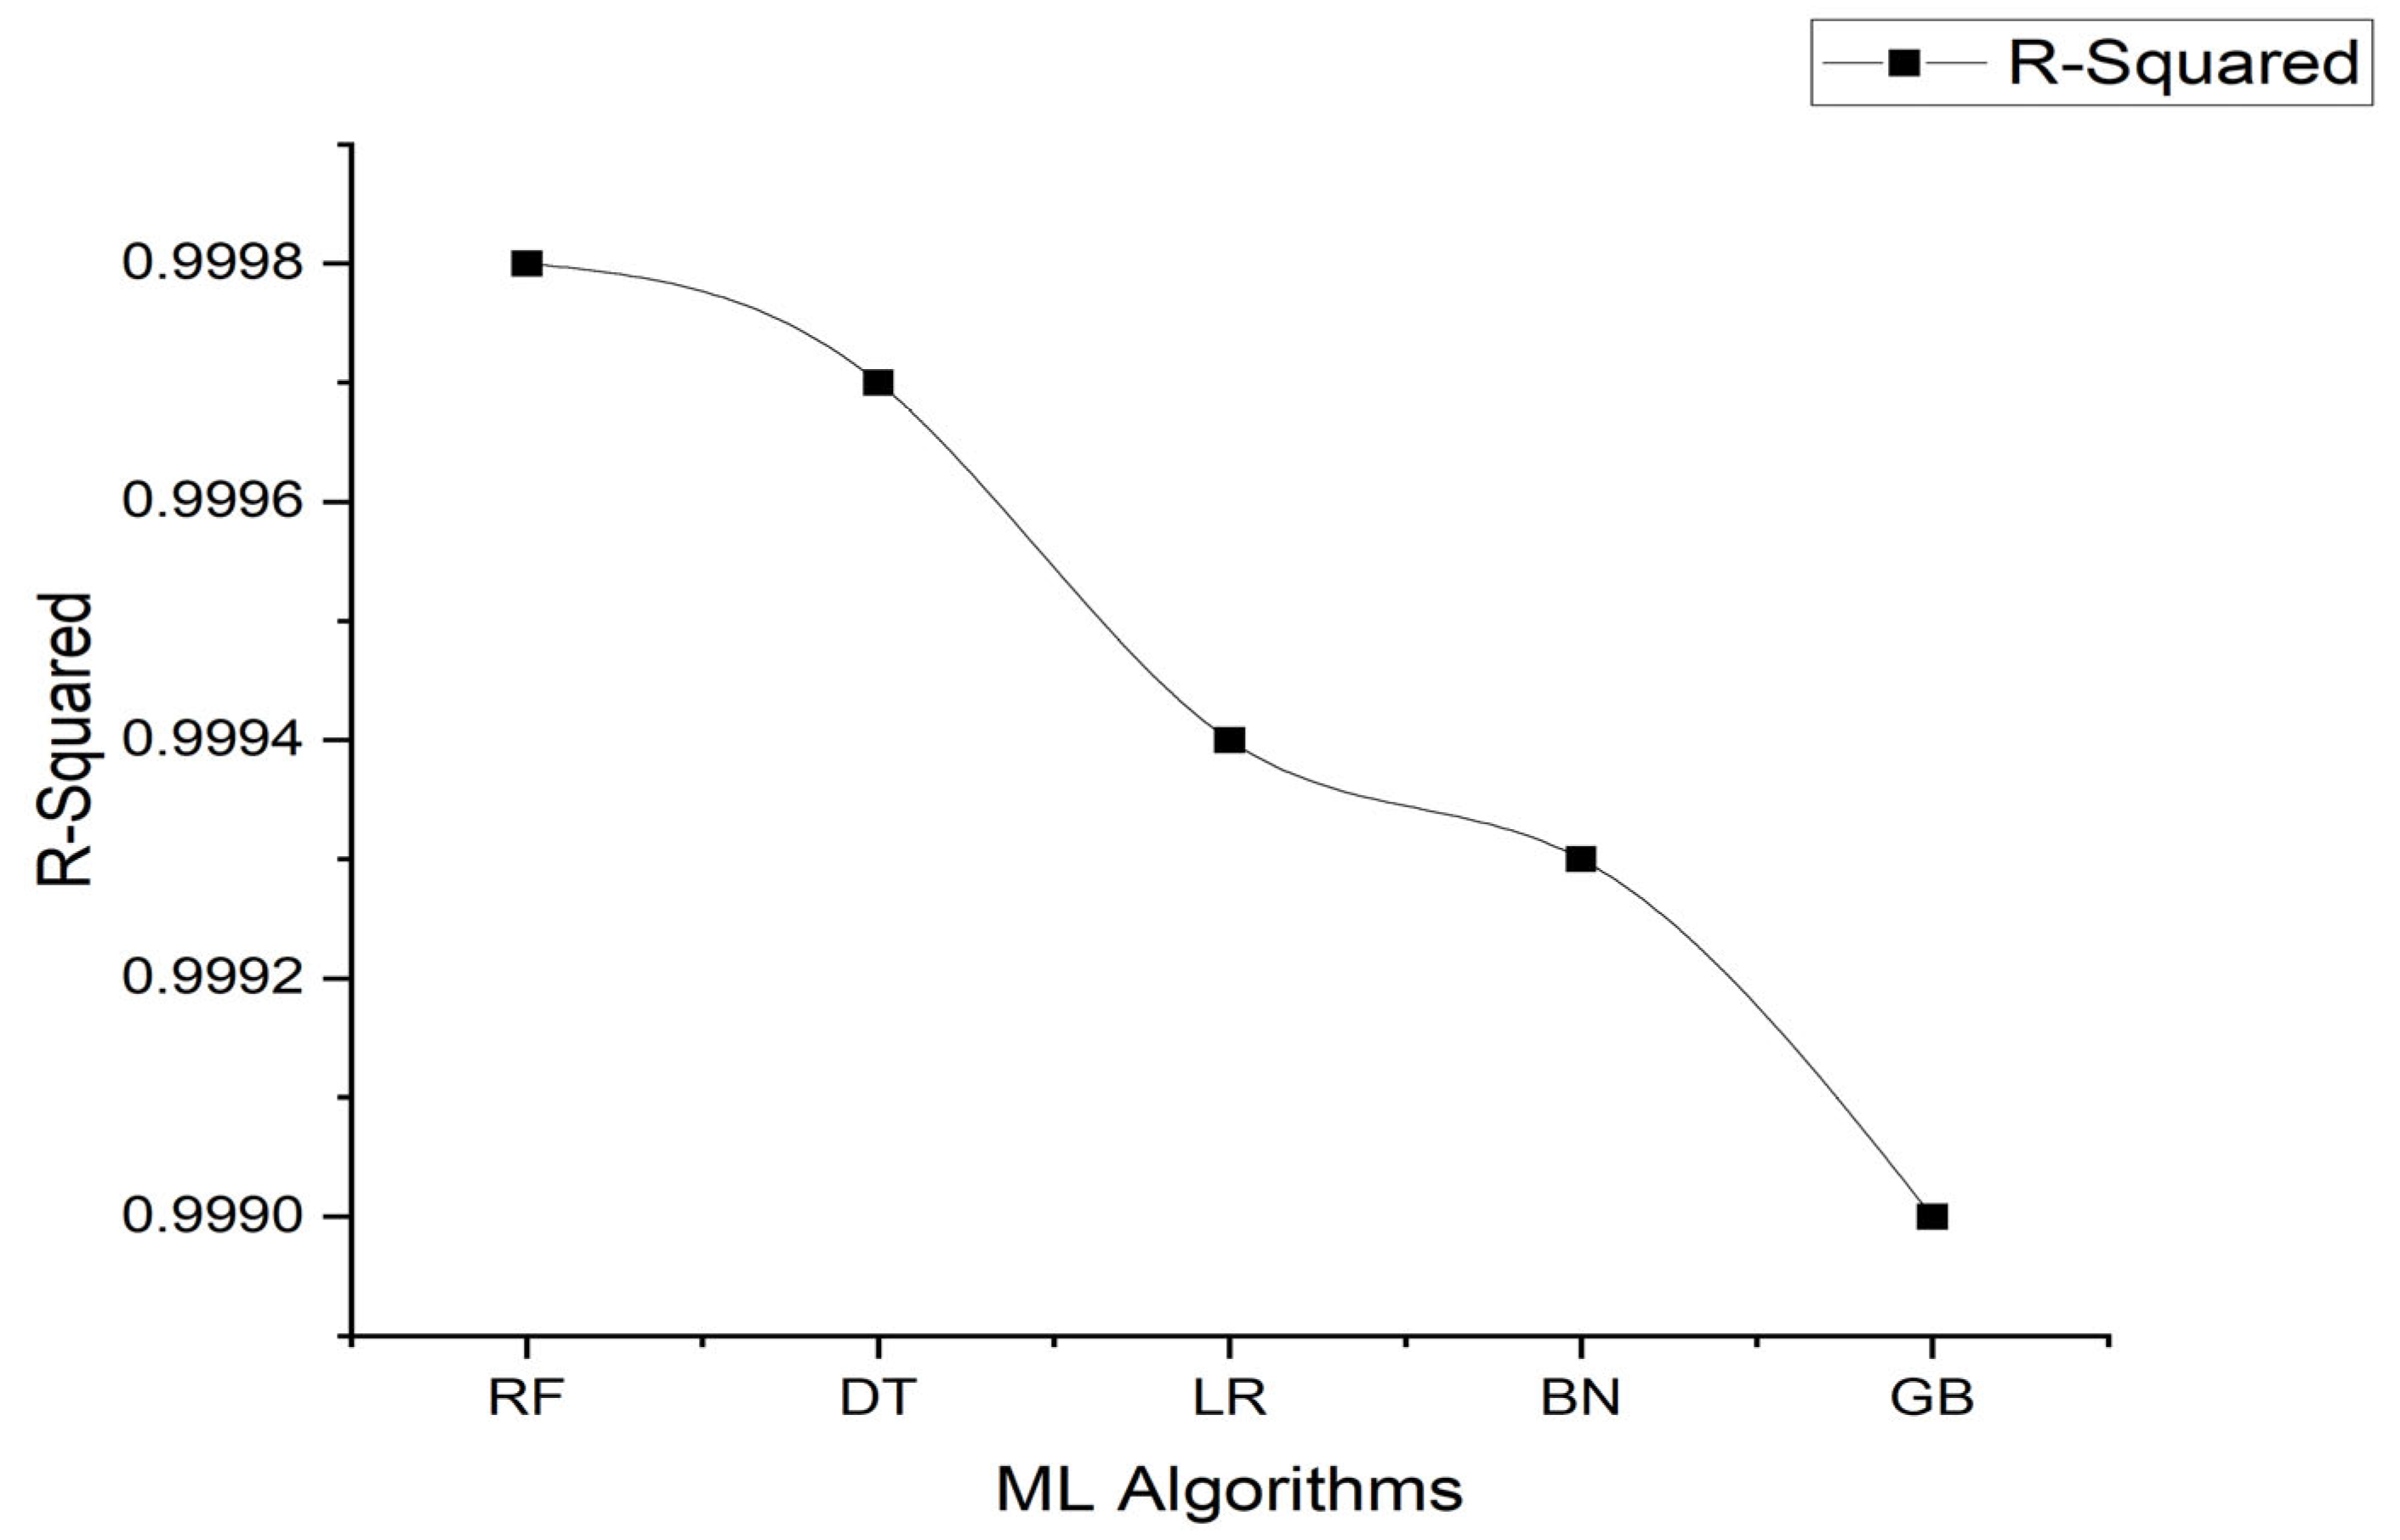
The statistical indicator R-Squared is predicted for RF, DT, LR, BN, and GB as shown in Figure 20. This performance indicator describes the amount of uncertainty explained by an independent variable. From these performance error indices, it determines which approach achieves good efficiency with the other outperformed all the other methods.
Figure 20.
R-Squared Error for different machine learning methods.
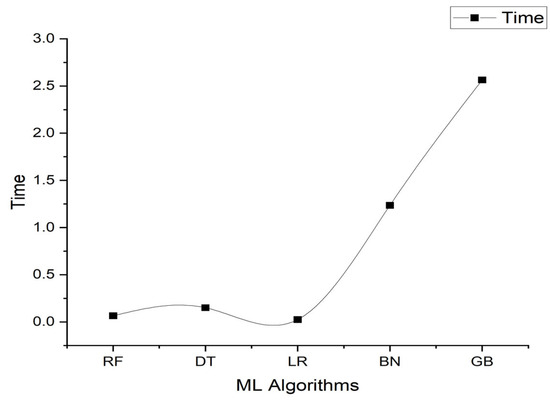
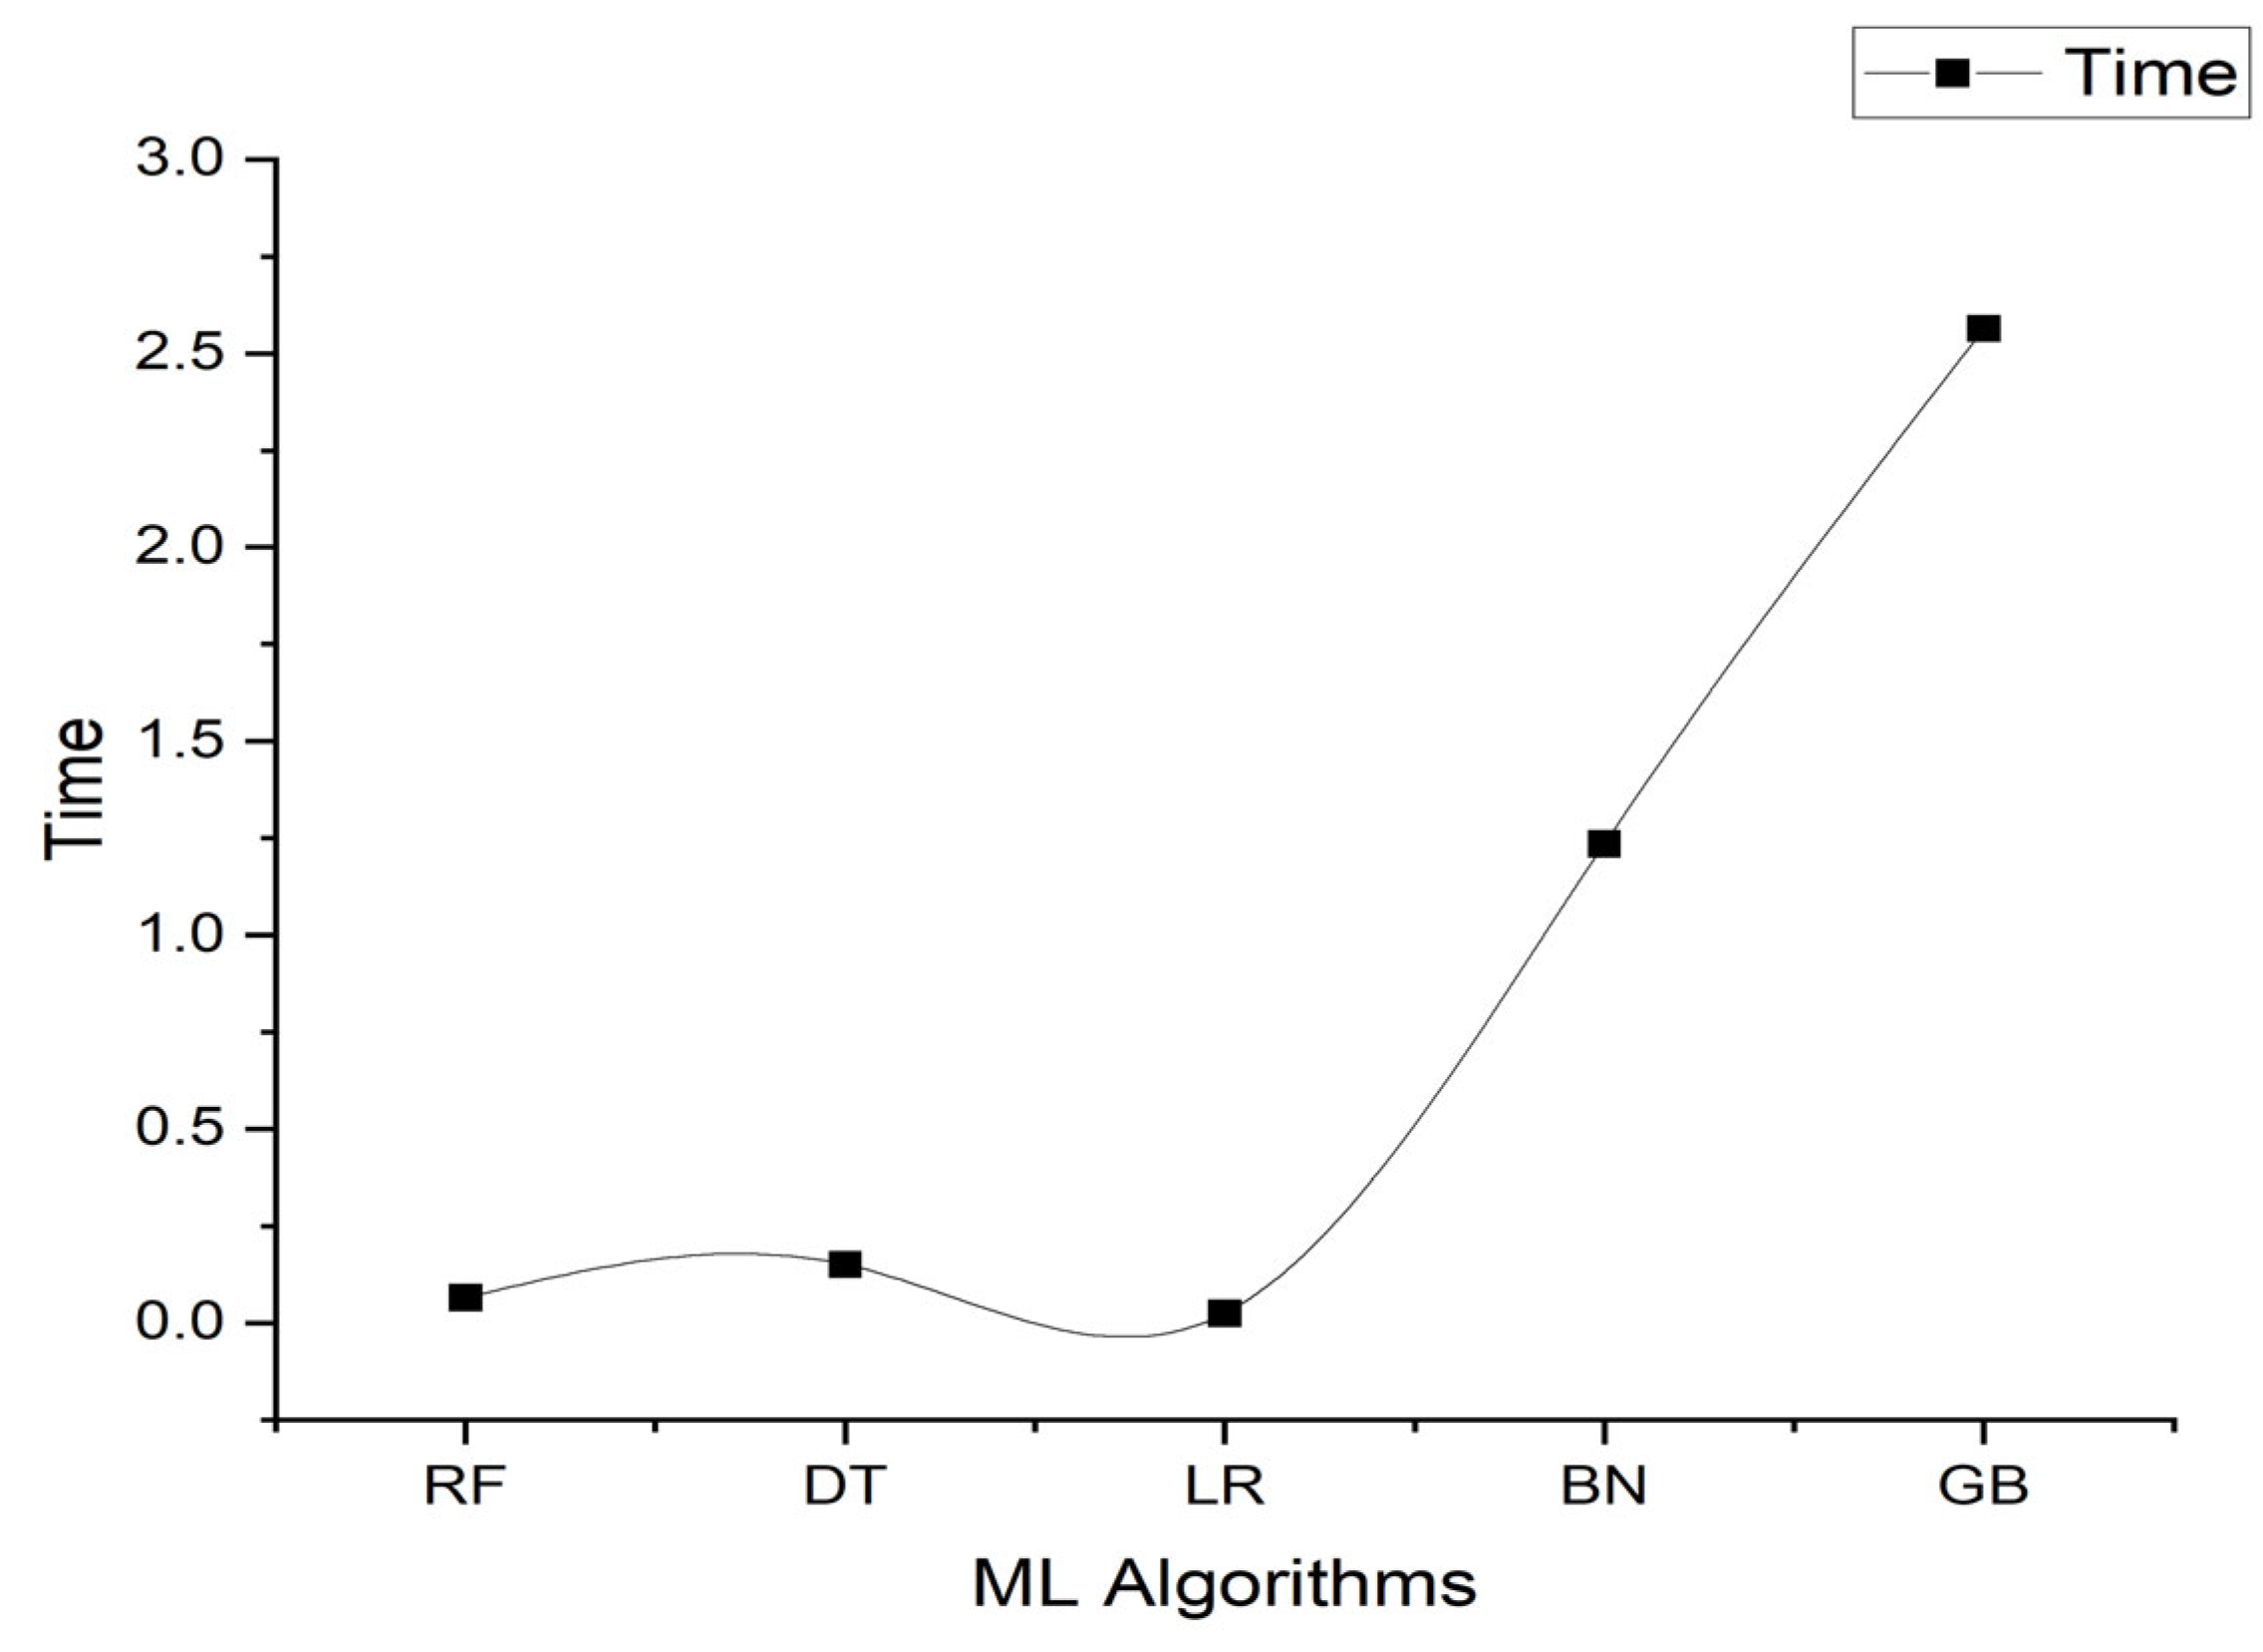
The main contribution of this study is that it finds the optimized version and effectively captures characteristics of RUL model prediction with less execution time. Figure 21 shows the execution time obtained for all five of the ML algorithms to perform different performance error indices. This also shows the shorter training time and advantage features of all the models proposed for prediction of RUL.
Figure 21.
Time taken by different Machine Learning Methods.
In addition, the following two SDGs are also positively impacted by addressing battery run-time problem:
Responsible Consumption and Production (SDG 12): Sustainable batteries that last longer reduce the frequency at which batteries need to be replaced, resulting in less waste and fewer raw materials used in manufacturing. This aligns with SDG 12’s target to ensure sustainable consumption and production patterns. Replacing batteries prematurely can be costly, especially in applications such as electric vehicles, where batteries are a significant part of the overall cost. Accurate RUL predictions help optimize the replacement schedule, reducing unnecessary expenses, waste, and raw materials used [54].
Industry, Innovation, and Infrastructure (SDG 9): SDG 9 emphasizes the development of resilient infrastructure and the promotion of sustainable industrialization. Longer battery run-time can contribute to the development of more efficient and sustainable transportation, communication, and industrial systems, reducing energy waste and promoting sustainable infrastructure [55].
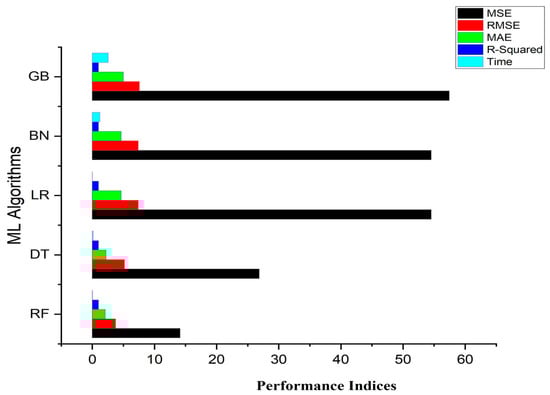
The profile of the five performance error indices of the given data set using all five different machine learning algorithms is shown in Figure 22.
Figure 22.
Error indices for different Machine Learning Methods.
6. Conclusions
This article studied the RUL prediction for the Hawaii Natural Energy Institute’s (HNEI) real life battery dataset with various machine learning algorithms such as linear regression, gradient boosting, random forest, decision tree, and the Bayesian network. Subsequently the error metrics such as Mean Square Error (MSE), Root Mean Square Error (RMSE), Mean Absolute Error (MAE), R-Squared, and execution time were determined for the considered battery dataset. The proposed data driven model with all the ML algorithms was executed in python with Google Co-laboratory. Each algorithm exhibited a notable deviated relevancy with regard to the different system error indices. It is observed from the obtained results that the random forest method had better optimized evaluation metrics with less execution time and was also well suited for accurate RUL prediction. A heatmap in seaborn was also generated for the dataset where voltage, current, and time were considered to extract seven functions from the original datasets. A correlation matrix has also been computed to illustrate the association between the coefficients as presented in the warmth map.
In a global context, where energy sector emissions represent more than 75%, it is important to highlight that good management and prediction of battery use can significantly contribute to improving the efficiency and sustainability of energy storage systems. In addition to promoting the adoption of clean energy, good battery management can help reduce sector emissions and encourage innovation and collaboration between members of the supply chain. In this way, the proposed methodology is interesting for its contribution to several sustainable development goals, such as Clean and Affordable Energy (SDG 7), and Climate Action (SDG 13).
The research findings highlighted in this article may be useful for the researchers in predicting the battery RUL accuracy enhancing the overall battery efficiency. Future research can be focused on further improving the accuracy of prediction by employing Deep Learning, Hybrid Learning algorithms.
Author Contributions
Each author contributed equally in each part. All authors have read and agreed to the published version of the manuscript.
Funding
This research received no external funding.
Institutional Review Board Statement
This article does not contain any studies with human participants or animals performed by any of the authors.
Informed Consent Statement
Not applicable.
Data Availability Statement
The data used to support the findings of this study are available from the corresponding author upon request.
Acknowledgments
The authors thank to Sri Venkateswara University College of Engineering for providing characterization supports to complete this research work. The authors claim that none of the material in the paper has been published or is under consideration for publication elsewhere.
Conflicts of Interest
The authors declare that they have no conflict of interest.
Abbreviations
| Abbreviation | Explanation |
| LIB | Lithium-ion battery |
| RUL | Remaining useful life |
| SOH | State of health |
| SOC | State of charge |
| ML | Machine learning |
| SVR | Support vector regression |
| KNN | K-Nearest neighbor |
| DT | Decision Tree |
| GBR | Gradient Boosting Regressor |
| DNN | Deep Neural Network |
| MAE | Mean Absolute error |
| MSE | Mean Square Error |
| RMSE | Root Mean Square Error |
| HNEI | Hawaii National Energy Institute |
References
- Si, X.-S.; Wang, W.; Hu, C.H.; Zhou, D.H. Remaining useful life estimation–a review on the statistical data driven approaches. Eur. J. Oper. Res. 2011, 213, 1–14. [Google Scholar] [CrossRef]
- Sankarasubramanian, S.; Krishnamurthy, B. A capacity fade model for lithium-ion batteries including diffusion and kinetics. Electrochim. Acta 2012, 70, 248–254. [Google Scholar] [CrossRef]
- Ashwin, T.R.; Chung, Y.M.; Wang, J. Capacity fade modelling of lithium-ion battery under cyclic loading conditions. J. Power Sources 2016, 328, 586–598. [Google Scholar] [CrossRef]
- Sarasketa-Zabala, E.; Gandiaga, I.; Martinez-Laserna, E.; Rodriguez-Martinez, L.M.; Villarreal, I. Cycle ageing analysis of a lifepo4/graphite cell with dynamic model validations: Towards realistic lifetime predictions. J. Power Sources 2015, 275, 573–587. [Google Scholar] [CrossRef]
- Liu, C.; Wang, Y.; Chen, Z. Degradation model and cycle life prediction for lithium-ion battery used in hybrid energy storge system. Energy 2019, 166, 796–806. [Google Scholar] [CrossRef]
- Ma, J.; Shang, P.; Zou, X.; Ma, N.; Ding, Y.; Sun, J.; Cheng, Y.; Tao, L.; Lu, C.; Su, Y.; et al. A hybrid transfer learning scheme for remaining useful life prediction and cycle life test optimization of different formulation Li-ion power batteries. Appl. Energy 2021, 282, 116167. [Google Scholar] [CrossRef]
- Ng, S.S.; Xing, Y.; Tsui, K.L. A Naïve Bayes Method for Robust Remaining Useful Life Prediction for Lithium-ion Battery. Appl. Energy 2014, 118, 114–123. [Google Scholar] [CrossRef]
- Wang, Y.; Yang, D.; Zhang, X.; Chen, Z. Probability based remaining capacity estimation using data-driven and neural network model. J. Power Sources 2016, 315, 199–208. [Google Scholar] [CrossRef]
- Feng, X.; Weng, C.; He, X.; Han, X.; Lu, L.; Ren, D. Online state-of-health estimation for Li-ion battery using partial charging segment based on support vector machine. IEEE Trans. Veh. Technol. 2019, 68, 8583–8592. [Google Scholar] [CrossRef]
- Wu, J.; Zhang, C.; Chen, Z. An online method for lithium-ion battery remaining useful life estimation using importance sampling and neural networks. Appl. Energy 2016, 173, 134–140. [Google Scholar] [CrossRef]
- Richardson, R.R.; Osborne, M.A.; Howey, D.A. Battery health prediction under generalized conditions using a Gaussian process transition model. J. Energy Storage 2019, 23, 320–328. [Google Scholar] [CrossRef]
- Hitesh Chandra, S.; Chandra Sekhar, J.N. Battery Management Systems for Electric Vehicles using Lithium-Ion Batteries International. J. Sci. Res. 2022, 11, 1255–1261. [Google Scholar]
- Yang, Y. A machine-learning prediction method of lithium-ion battery life based on charge process for different applications. Appl. Energy 2021, 292, 116897. [Google Scholar] [CrossRef]
- Bhalaji, N. Rimi Chowdhury Remaining Useful Life (RUL) Estimation of Lead Acid Battery using Bayesian Approach. J. Electr. Eng. Autom. 2020, 2, 25–34. [Google Scholar]
- Wua, J.; Kong, L. RUL Prediction for Lithium Batteries Using a Novel Ensemble Learning Method. Energy Rep. 2022, 8, 313–326. [Google Scholar] [CrossRef]
- Ansari, S.; Ayob, A.; Lipu, M.H.; Hussain, A.; Saad, M.H.M. Remaining useful life prediction for lithium-ion battery storage system: A comprehensive review of methods, key factors, issues and future outlook. Energy Rep. 2022, 8, 12153–12185. [Google Scholar] [CrossRef]
- Krewer, U.; Röder, F.; Harinath, E.; Braatz, R.D.; Bedürftig, B.; Findeisen, R. Review—Dynamic models of Li-ion batteries for diagnosis and operation: A review and perspective. J. Electrochem. Soc. 2018, 165, A3656–A3673. [Google Scholar] [CrossRef]
- Wang, Y.; Tian, J.; Sun, Z.; Wang, L. A comprehensive review of battery modeling and state estimation approaches for advanced battery management systems. Renew. Sustain. Energy Rev. 2020, 131, 110015. [Google Scholar]
- Laayouj, N.; Jamouli, H. Lithium-ion battery degradation assessment and remaining useful life estimation in hybrid electric vehicle. Renew. Energy Sustain. Dev. 2016, 2, 37–44. [Google Scholar] [CrossRef]
- Guha, A.; Patra, A. Online estimation of the electrochemical impedance spectrum and remaining useful life of lithium-ion batteries. IEEE Trans. Instrum. Meas. 2018, 67, 1836–1849. [Google Scholar] [CrossRef]
- Yang, F.; Wang, D.; Xing, Y.; Tsui, K.L. Prognostics of Li(NiMnCo)O2-based lithium-ion batteries using a novel battery degradation model. Microelectron. Reliab. 2017, 70, 70–78. [Google Scholar] [CrossRef]
- Wang, A.; Chen, H.; Jin, P.; Huang, J.; Feng, D.; Zheng, M. RUL estimation of lithium-ion power battery based on DEKF algorithm. In Proceedings of the 2019 14th IEEE Conference on Industrial Electronics and Applications (ICIEA), Xi’an, China, 19–21 June 2019; pp. 1851–1856. [Google Scholar] [CrossRef]
- Ferreira, C.; Gonçalves, G. Remaining Useful Life prediction and challenges: A literature review on the use of Machine Learning Methods. J. Manuf. Syst. 2022, 63, 550–562. [Google Scholar] [CrossRef]
- Stock, S.; Pohlmann, S.; Guenter, F.J.; Hille, L.; Hagemeister, J.; Reinhart, G. Early Quality Classification and Prediction of Battery Cycle Life in Production Using Machine Learning. J. Energy Storage 2022, 50, 104144. [Google Scholar] [CrossRef]
- Hasib, S.A.; Islam, S.; Chakrabortty, R.K.; Ryan, M.J.; Saha, D.K.; Ahamed, M.H.; Moyeen, S.I.; Das, S.K.; Ali, M.F.; Islam, M.R.; et al. A Comprehensive Review of Available Battery Datasets, RUL Prediction Approaches, and Advanced Battery Management. IEEE Trans. 2021, 9, 86166–86193. [Google Scholar] [CrossRef]
- Cheng, D.; Sha, W.; Wang, L.; Tang, S.; Ma, A.; Chen, Y.; Wang, H.; Lou, P.; Lu, S.; Cao, Y.C. Solid-State Lithium Battery Cycle Life Prediction Using Machine Learning. Appl. Sci. 2021, 11, 4671. [Google Scholar] [CrossRef]
- Thelen, A.; Li, M.; Hu, C.; Bekyarova, E.; Kalinin, S.; Sanghadasa, M. Augmented model-based framework for battery remaining useful life prediction. Appl. Energy 2022, 324, 119624. [Google Scholar] [CrossRef]
- Li, X.; Zhang, L.; Wang, Z.; Dong, P. Remaining useful life prediction for lithium-ion batteries based on a hybrid model combining the long shortterm memory and elman neural networks. J. Energy Storage 2019, 21, 510–518. [Google Scholar] [CrossRef]
- Chen, L.; Xu, L.; Zhou, Y. Novel Approach for Lithium-Ion Battery On-Line Remaining Useful Life Prediction Based on Permutation Entropy. Energies 2018, 11, 820. [Google Scholar] [CrossRef]
- Balochian, S.; Baloochian, H. Improving grey prediction model and its application in predicting the number of users of a public road transportation system. J. Intell. Syst. 2020, 30, 104–114. [Google Scholar] [CrossRef]
- Zhou, D.; Xue, L.; Song, Y.; Chen, J. On-line remaining useful life prediction of lithium-ion batteries based on the optimized gray model GM (1, 1). Batteries 2017, 3, 21. [Google Scholar] [CrossRef]
- Wang, Y.; Pan, R.; Yang, D.; Tang, X.; Chen, Z. Remaining useful life prediction of lithium-ion battery based on discrete wavelet transform. Energy Procedia 2017, 105, 2053–2058. [Google Scholar] [CrossRef]
- GitHub. How the Dataset Was Built. Available online: https://github.com/ignavinuales/Battery_RUL_Prediction (accessed on 1 March 2022).
- Zhao, S.; Blaabjerg, F.; Wang, H. An Overview of Artificial Intelligence Applications for Power Electronics. IEEE Trans. Power Electron. 2020, 36, 4633–4658. [Google Scholar] [CrossRef]
- Dong, H.; Jin, X.; Lou, Y.; Wang, C. Lithium-Ion Battery State of Health Monitoring and Remaining Useful Life Prediction Based on Support Vector Regression-Particle Filter. J. Power Sources 2014, 271, 114–123. [Google Scholar] [CrossRef]
- Jayakumar, T.; Gowda, N.M.; Sujatha, R.; Bhukya, S.N.; Padmapriya, G.; Radhika, S.; Mohanavel, V.; Sudhakar, M.; Sathyamurthy, R. Machine Learning approach for Prediction of residual energy in batteries. Energy Rep. 2022, 8, 756–764. [Google Scholar] [CrossRef]
- Chandran, V.; Patil, C.K.; Karthick, A.; Ganeshaperumal, D.; Rahim, R.; Ghosh, A. State of Charge Estimation of Lithium-Ion Battery for Electric Vehicles Using Machine Learning Algorithms. World Electr. Veh. J. 2021, 12, 38. [Google Scholar] [CrossRef]
- Hu, C.; Jain, G.; Zhang, P.; Schmidt, C.; Gomadam, P.; Gorka, T. Data-driven method based on particle swarm optimization and k-nearest neighbor regression for estimating capacity of lithium-ion battery. Appl. Energy 2014, 129, 49–55. [Google Scholar] [CrossRef]
- Jafari, S.; Shahbazi, Z.; Byun, Y.C.; Lee, S.J. Lithium-Ion Battery Estimation in Online Framework Using Extreme Gradient Boosting Machine Learning Approach. Mathematics 2022, 10, 888. [Google Scholar] [CrossRef]
- Patil, S.; Patil, A.; Handikherkar, V.; Desai, S.; Phalle, V.M.; Kazi, F.S. Remaining Useful Life (Rul) Prediction of Rolling Element Bearing Using Random Forest and Gradient Boosting Technique. In Proceedings of the ASME 2018 International Mechanical Engineering Congress and Exposition, Pittsburgh, PA, USA, 9–15 November 2018. [Google Scholar]
- Guo, J.; Wan, J.L.; Yang, Y.; Dai, L.; Tang, A.; Huang, B.; Zhang, F.; Li, H. A deep feature learning method for remaining useful life prediction of drilling pumps. Energy 2023, 282, 128442. [Google Scholar] [CrossRef]
- Domathoti, B.; Ch, C.; Madala, S.; Berhanu, A.A.; Rao, Y.N. Simulation Analysis of 4G/5G OFDM Systems by Optimal Wavelets with BPSK Modulator. J. Sens. 2022, 2022, 8070428. [Google Scholar] [CrossRef]
- Zhao, F.; Xue, J.; Shao, W.; Yu, H.; Huang, W.; Xiao, J. Toward high-sulfur-content, high-performance lithium-sulfur batteries: Review of materials and technologies. J. Energy Chem. 2023, 80, 625–657. [Google Scholar] [CrossRef]
- Zhao, F.; Feng, Y.; Feng, W. Germanium-based monoelemental and binary two-dimensional materials: Theoretical and experimental investigations and promising applications. InfoMat 2022, 4, e12365. [Google Scholar] [CrossRef]
- Zhao, F.; Li, Y.; Feng, W. Recent Advances in Applying Vulcanization/Inverse Vulcanization Methods to Achieve High-Performance Sulfur-Containing Polymer Cathode Materials for Li–S Batteries. Small Methods 2018, 2, 1800156. [Google Scholar] [CrossRef]
- Li, X.Y.; Feng, S.; Zhao, C.X.; Cheng, Q.; Chen, Z.X.; Sun, S.Y.; Chen, X.; Zhang, X.Q.; Li, B.Q.; Huang, J.Q.; et al. Regulating Lithium Salt to Inhibit Surface Gelation on an Electrocatalyst for High-Energy-Density Lithium–Sulfur Batteries. Am. Chem. Soc. 2022, 144, 14638–14646. [Google Scholar] [CrossRef] [PubMed]
- Sun, W.; Liu, S.; Li, Y.; Wang, D.; Guo, Q.; Hong, X.; Xie, K.; Ma, Z.; Zheng, C.; Xiong, S. Monodispersed FeS2 Electrocatalyst Anchored to Nitrogen-Doped Carbon Host for Lithium–Sulfur Batteries. Adv. Funct. Mater. 2022, 32, 2205471. [Google Scholar] [CrossRef]
- He, X.; Khan, S.; Ozturk, I.; Murshed, M. The role of renewable energy investment in tackling climate change concerns: En-vironmental policies for achieving SDG-13. Sustain. Dev. 2023, 31, 1888–1901. [Google Scholar] [CrossRef]
- Ali, S.M.; Appolloni, A.; Cavallaro, F.; D’adamo, I.; Di Vaio, A.; Ferella, F.; Gastaldi, M.; Ikram, M.; Kumar, N.M.; Martin, M.A.; et al. Development Goals towards Sustainability. Sustainability 2023, 15, 9443. [Google Scholar] [CrossRef]
- Türk, H. The Oil Crisis of 1973 as a Challenge to Multilateral Energy Cooperation among Western Industrialized Countries. Hist. Soc. Res. 2014, 39, 209–230. [Google Scholar] [CrossRef]
- India Becomes Associate Member of International Energy Agency; The Economic Times: Mumbai, India, 2022.
- Javaid, M.; Haleem, A.; Singh, R.P.; Suman, R.; Gonzalez, E.S. Understanding the adoption of Industry 4.0 technologies in improving environmental sustainability. Sustain. Oper. Comput. 2022, 3, 203–217. [Google Scholar] [CrossRef]
- Yazdani, M.; Gonzalez, E.D.; Chatterjee, P. A multi-criteria decision-making framework for agriculture supply chain risk management under a circular economy context. Manag. Decis. 2021, 59, 1801–1826. [Google Scholar] [CrossRef]
- Küfeoğlu, S. SDG-13: Climate Action. In Emerging Technologies; Sustainable Development Goals Series; Springer: Cham, Switzerland, 2022. [Google Scholar] [CrossRef]
- Campbell, B.M.; Hansen, J.; Rioux, J.; Stirling, C.M.; Twomlow, S.; Wollenberg, E. Urgent action to combat climate change and its impacts (SDG 13): Transforming agriculture and food systems. Curr. Opin. Environ. Sustain. 2018, 34, 13–20. [Google Scholar] [CrossRef]


Disclaimer/Publisher’s Note: The statements, opinions and data contained in all publications are solely those of the individual author(s) and contributor(s) and not of MDPI and/or the editor(s). MDPI and/or the editor(s) disclaim responsibility for any injury to people or property resulting from any ideas, methods, instructions or products referred to in the content. |
© 2023 by the authors. Licensee MDPI, Basel, Switzerland. This article is an open access article distributed under the terms and conditions of the Creative Commons Attribution (CC BY) license (https://creativecommons.org/licenses/by/4.0/).