
A Comprehensive Evaluation on the Performances of China’s Information Technology Characteristic Towns Utilizing the Advantage-Oriented Competitive Evaluation (ACE) Method


Abstract
:1. Introduction
2. Information Technology Characteristic Towns
2.1. ITCTs’ Distinctive Features
- Distinctive location advantages. Most ITCTs are located in economically developed areas where high-tech industries concentrate [30]. This overlap between ITCTs’ locations and China’s high-tech industries denotes the ITCTs’ prominent location characteristics among all CT types.
- New urbanization community integrating industry, town, and population. The ITCTs’ dependent industries primarily aggregate on the emerging high-end technology industries, such as new-generation information technology, cloud computing, big data, the Internet, the Internet of Things, artificial intelligence, and gene technology. As platforms aiding incubation, innovation, and entrepreneurship, the ITCTs aim to attract high-end scientific and technological talents—the vital elements of the technology industry.
- Government-enterprise cooperation pattern. The developed countries usually adopted a ‘construction and development without government’s guidance’ pattern in their urbanization practice, e.g., the development of Western Silicon Valley, USA matches the pattern well. Unlike this pattern, the ITCTs in China follow the ‘government-led, social-capital-based’ pattern. In this pattern, the government first establishes policies covering various perspectives such as town planning, financial support, and supporting facilities. Meanwhile, social capital functions as the main construction body and jointly works with governments promoting ITCTs. This novel pattern first exhibits its advantage in the ITCT construction of Zhejiang, the CT program’s origin.
- Integration with the ecological and cultural advantages. Most ITCTs’ plannings consider the ‘science and technology featured cultural tourism’ essential component, aiming to balance the local ecological environment and the scientific and technological elements and save spaces for science and technology landscapes, such as science- and technology-related theme parks, culture expos, and theme hotels.
2.2. ITCT Case Selection
3. ACE Methodology
3.1. The Principal Idea of the ACE
3.2. The ACE Evaluation Procedure
3.2.1. The Evaluation Index Construction
3.2.2. Feature Data Normalization
3.2.3. Recognition of Individuals’ Advantageous Patterns
3.2.4. ACE Performance Evaluation
- The one that shows the most significant advantage if its performance ranks first in the column;
- The one that shows NO advantage if its performance ranks the last in the column;
- Otherwise, the one that shows ordinary performance or no significant advantage.
4. ACE-Based ITCTs Evaluation
4.1. The ITCTs Evaluation Index Construction
4.2. Data Normalization
4.3. IAP Recognition Results of the Fifteen ITCTs
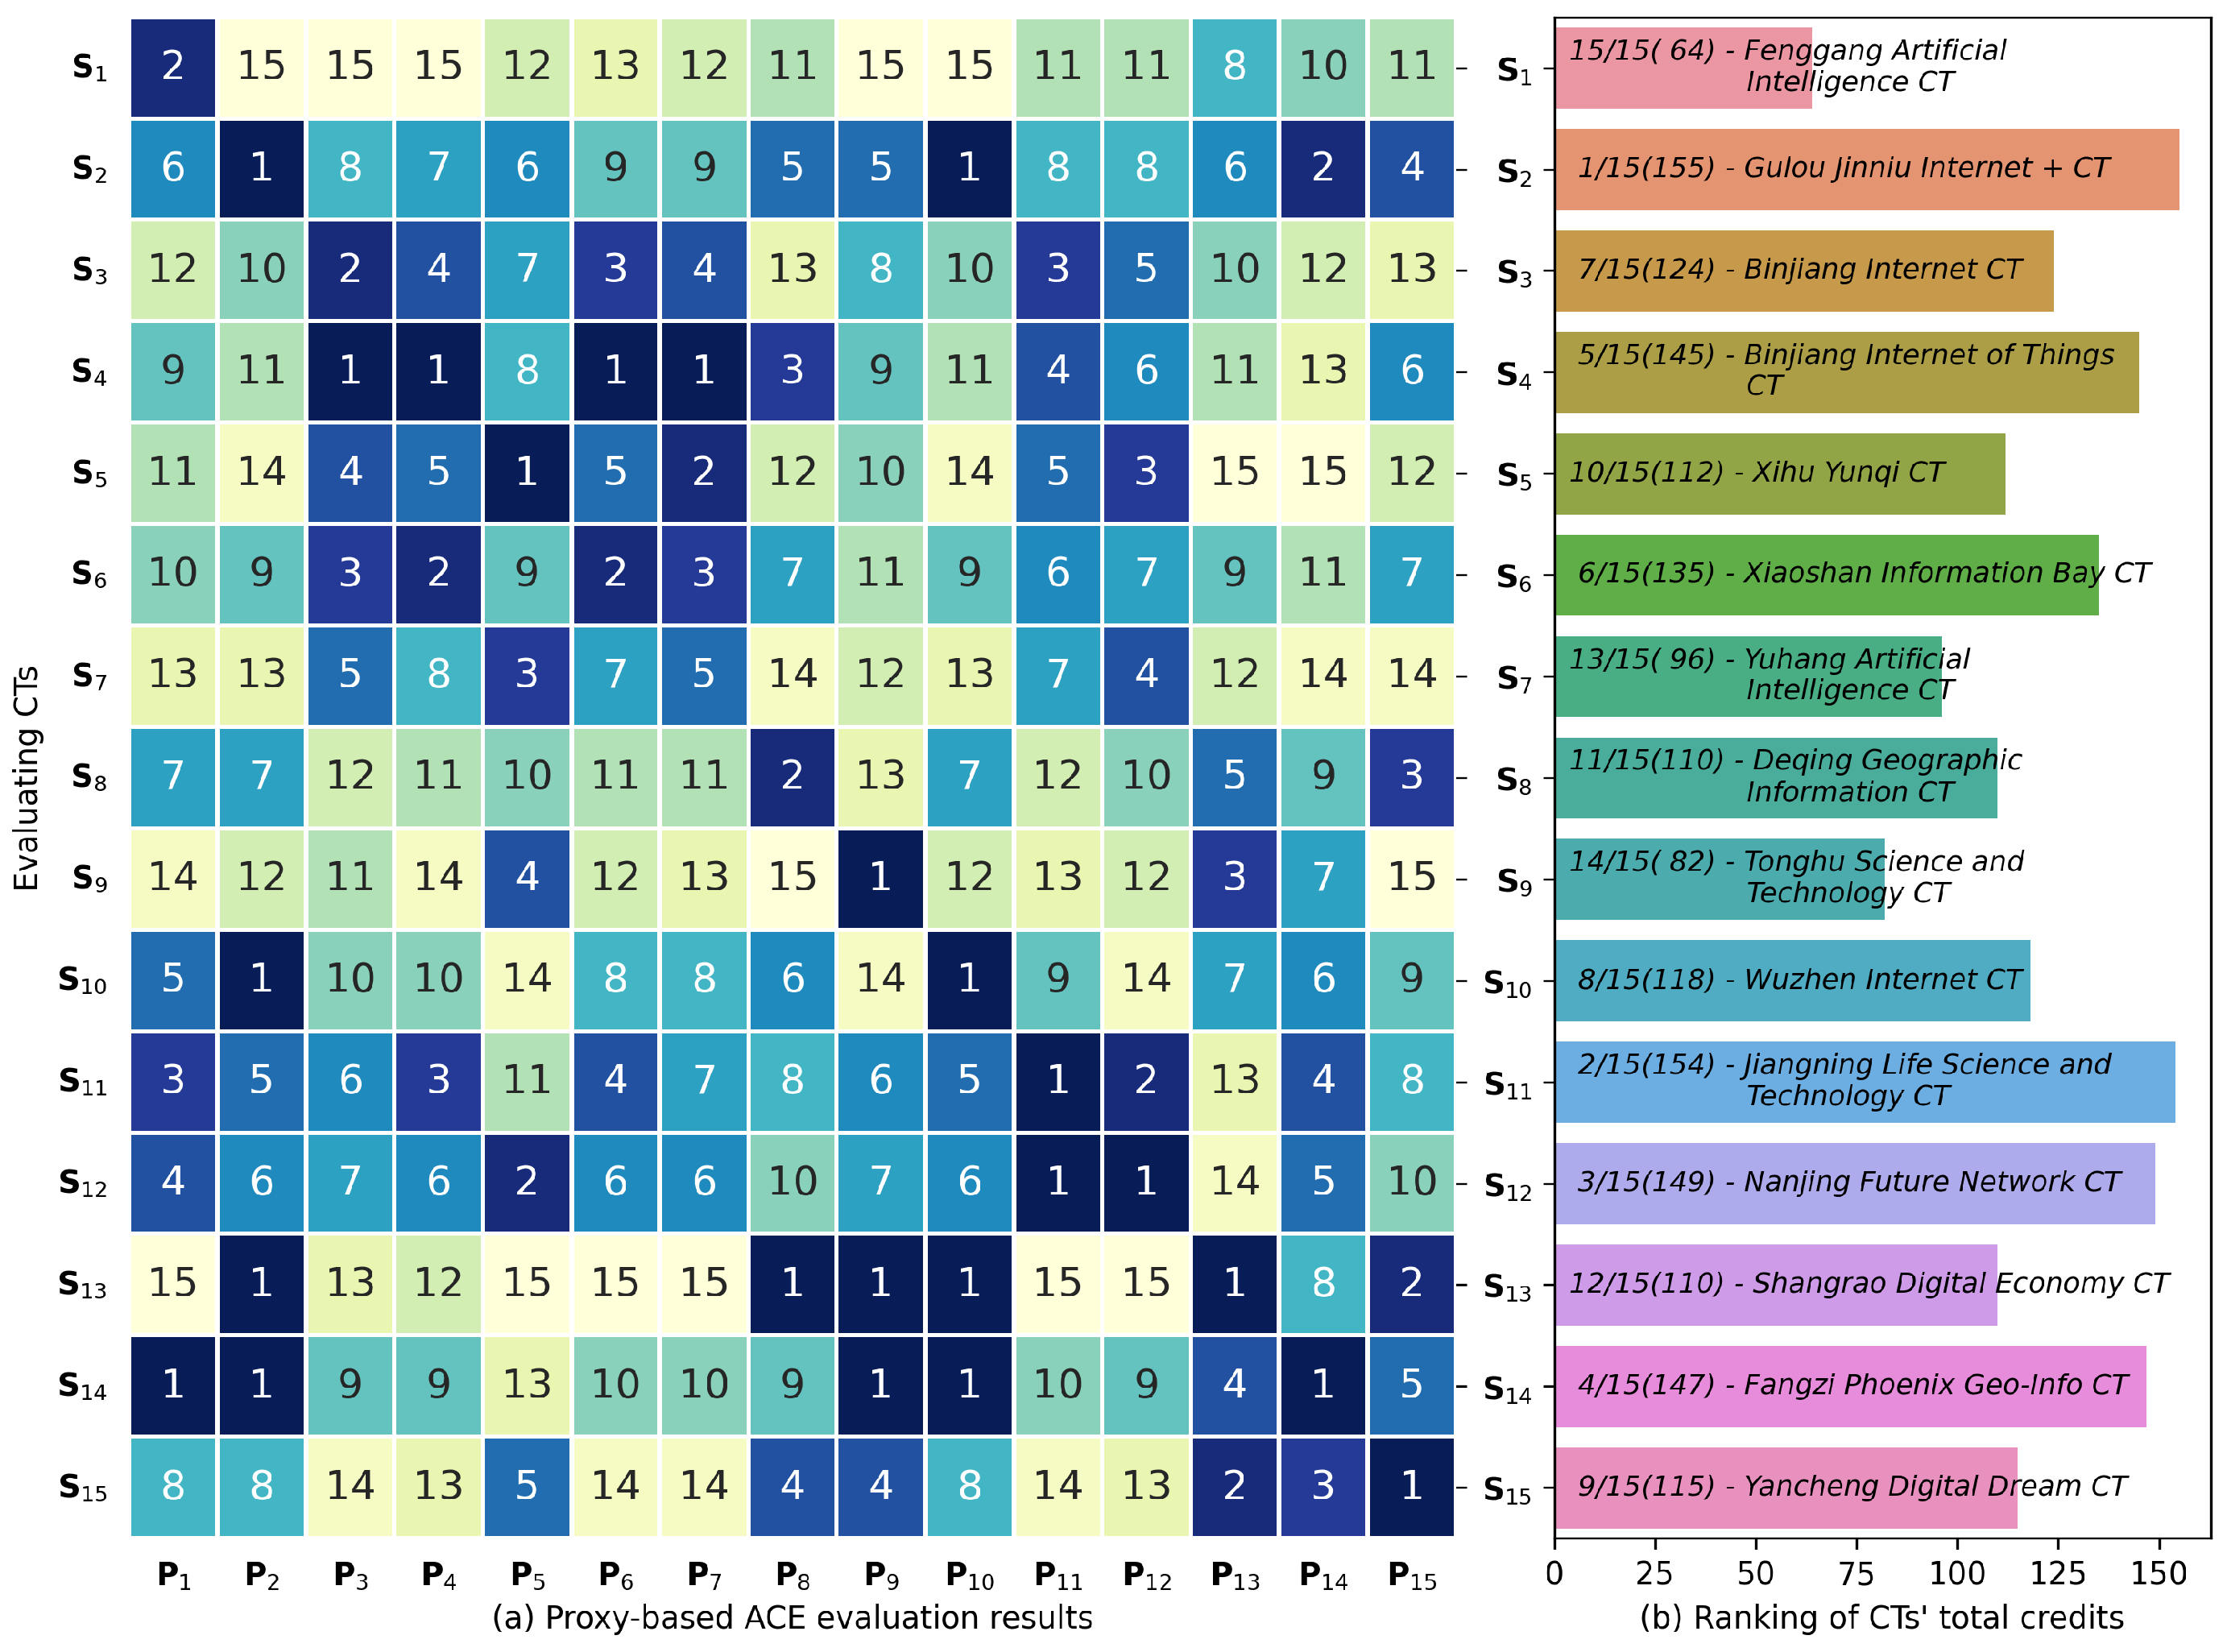
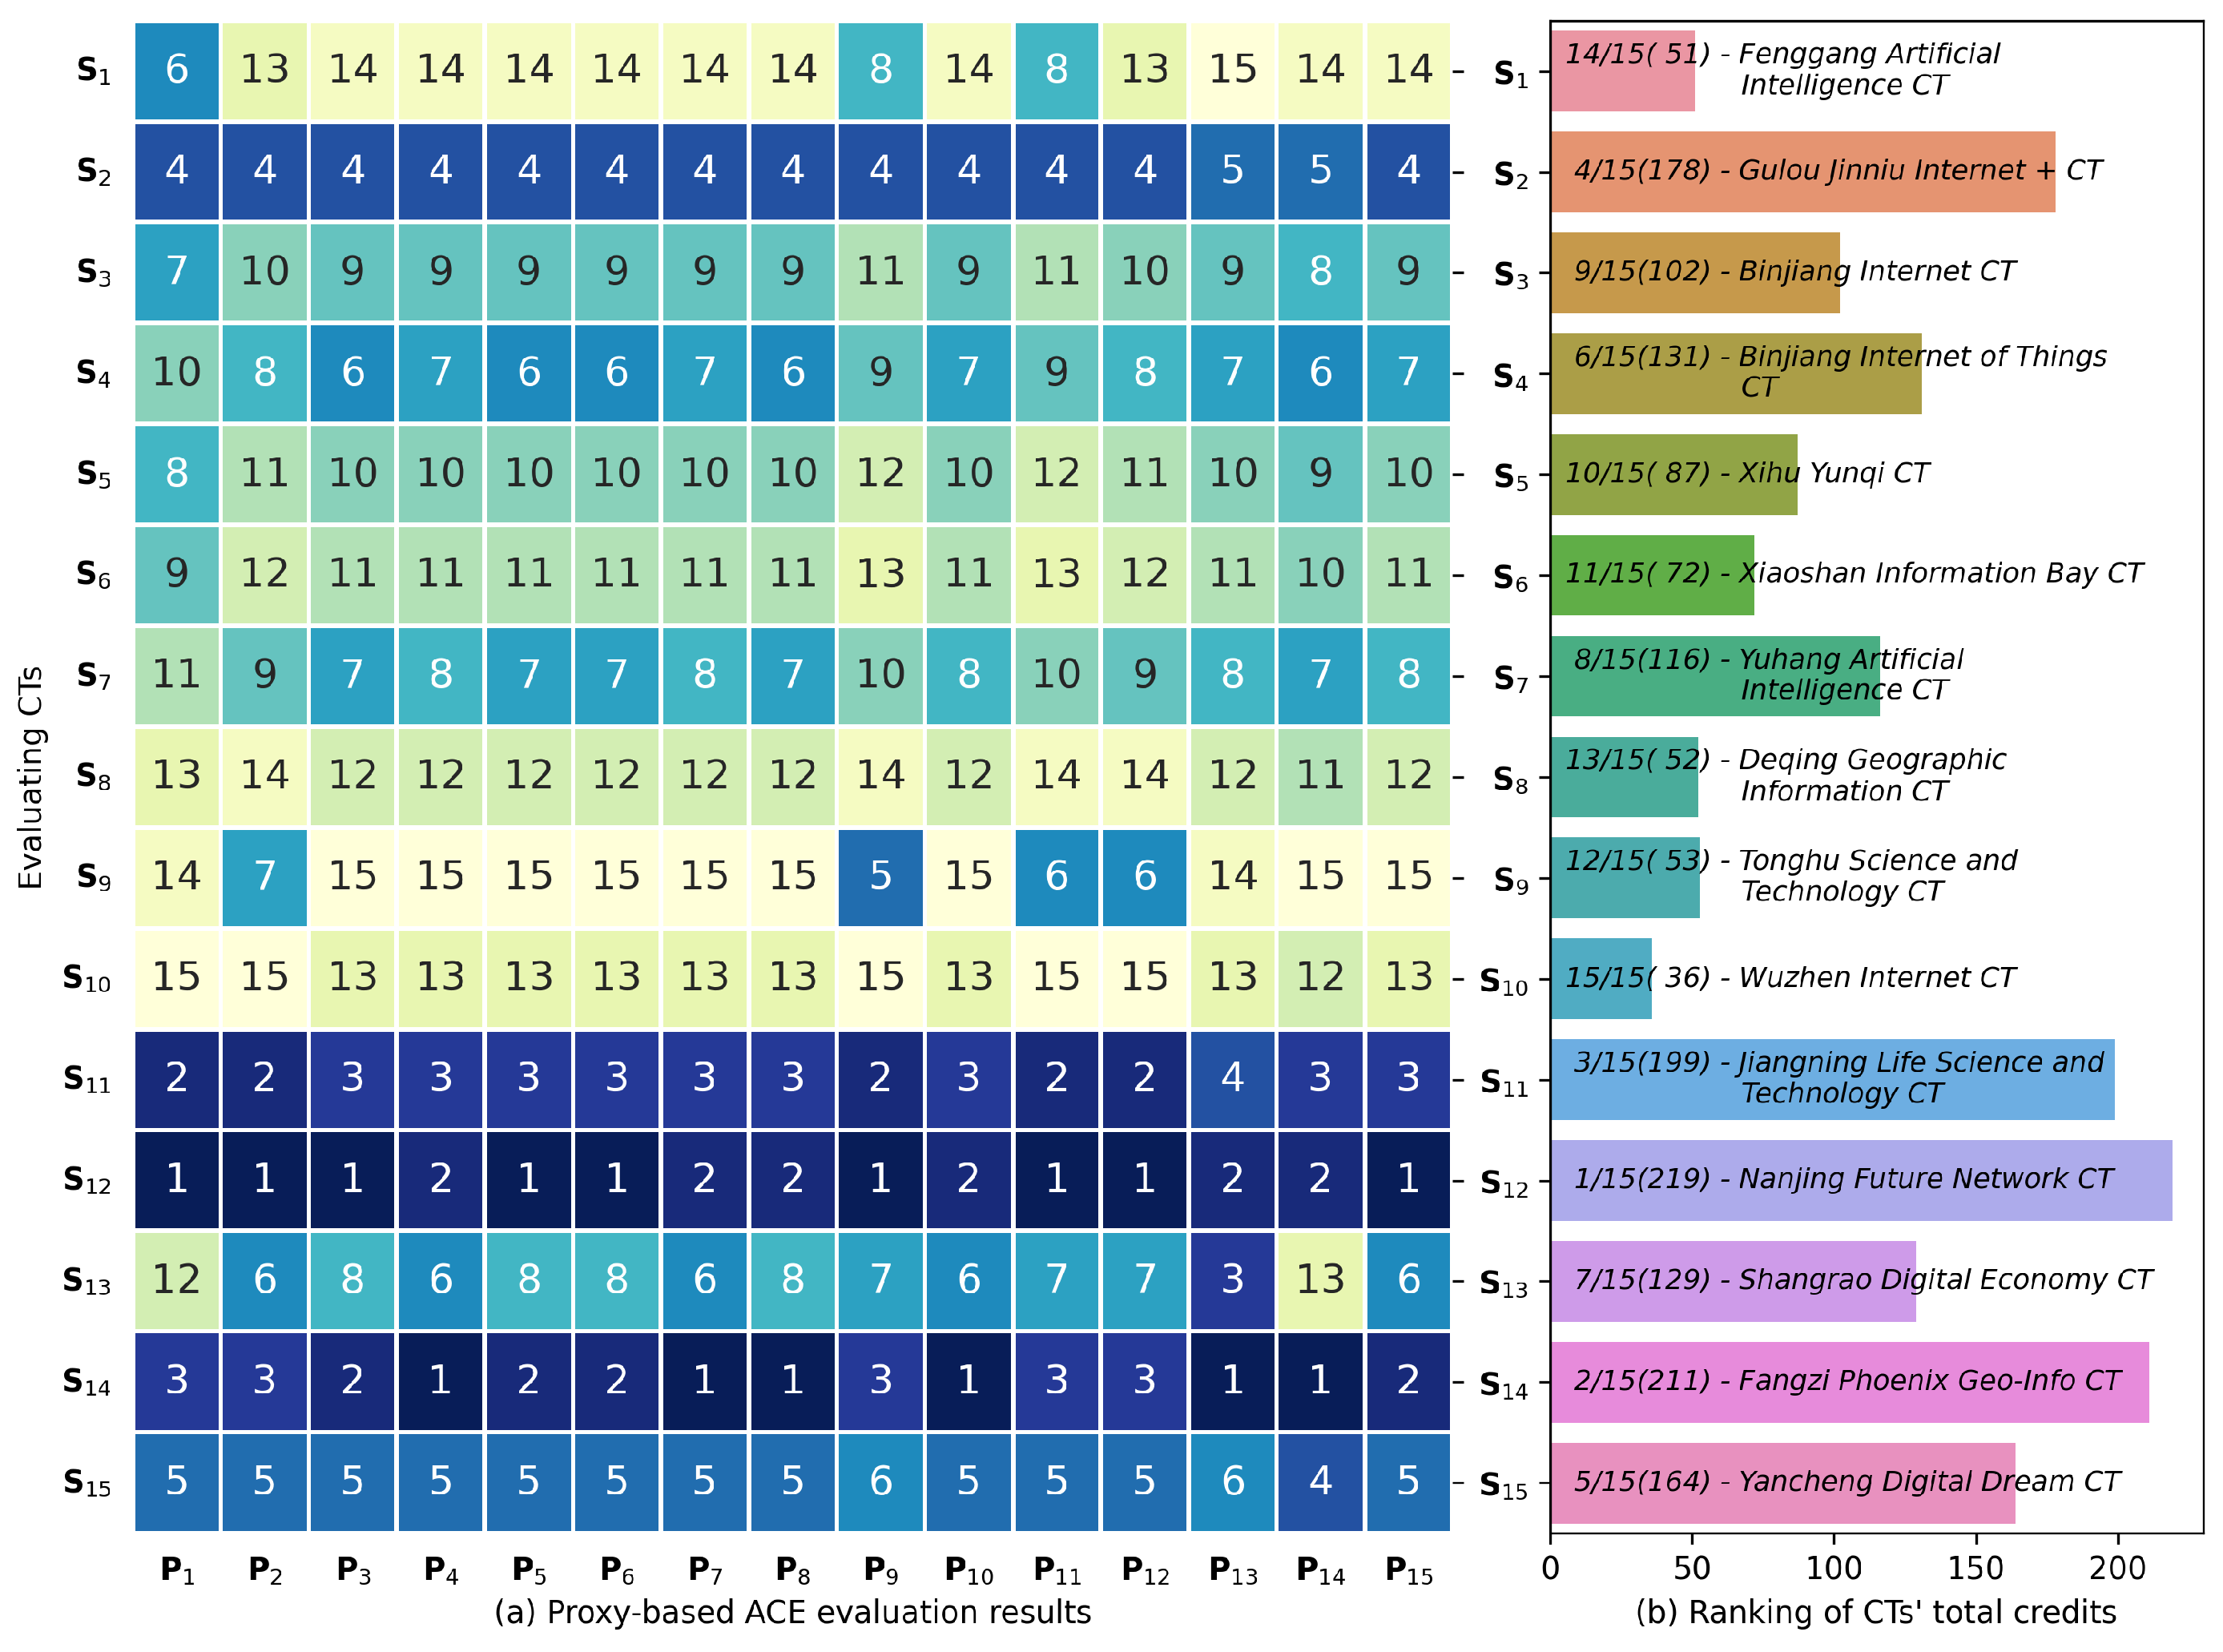
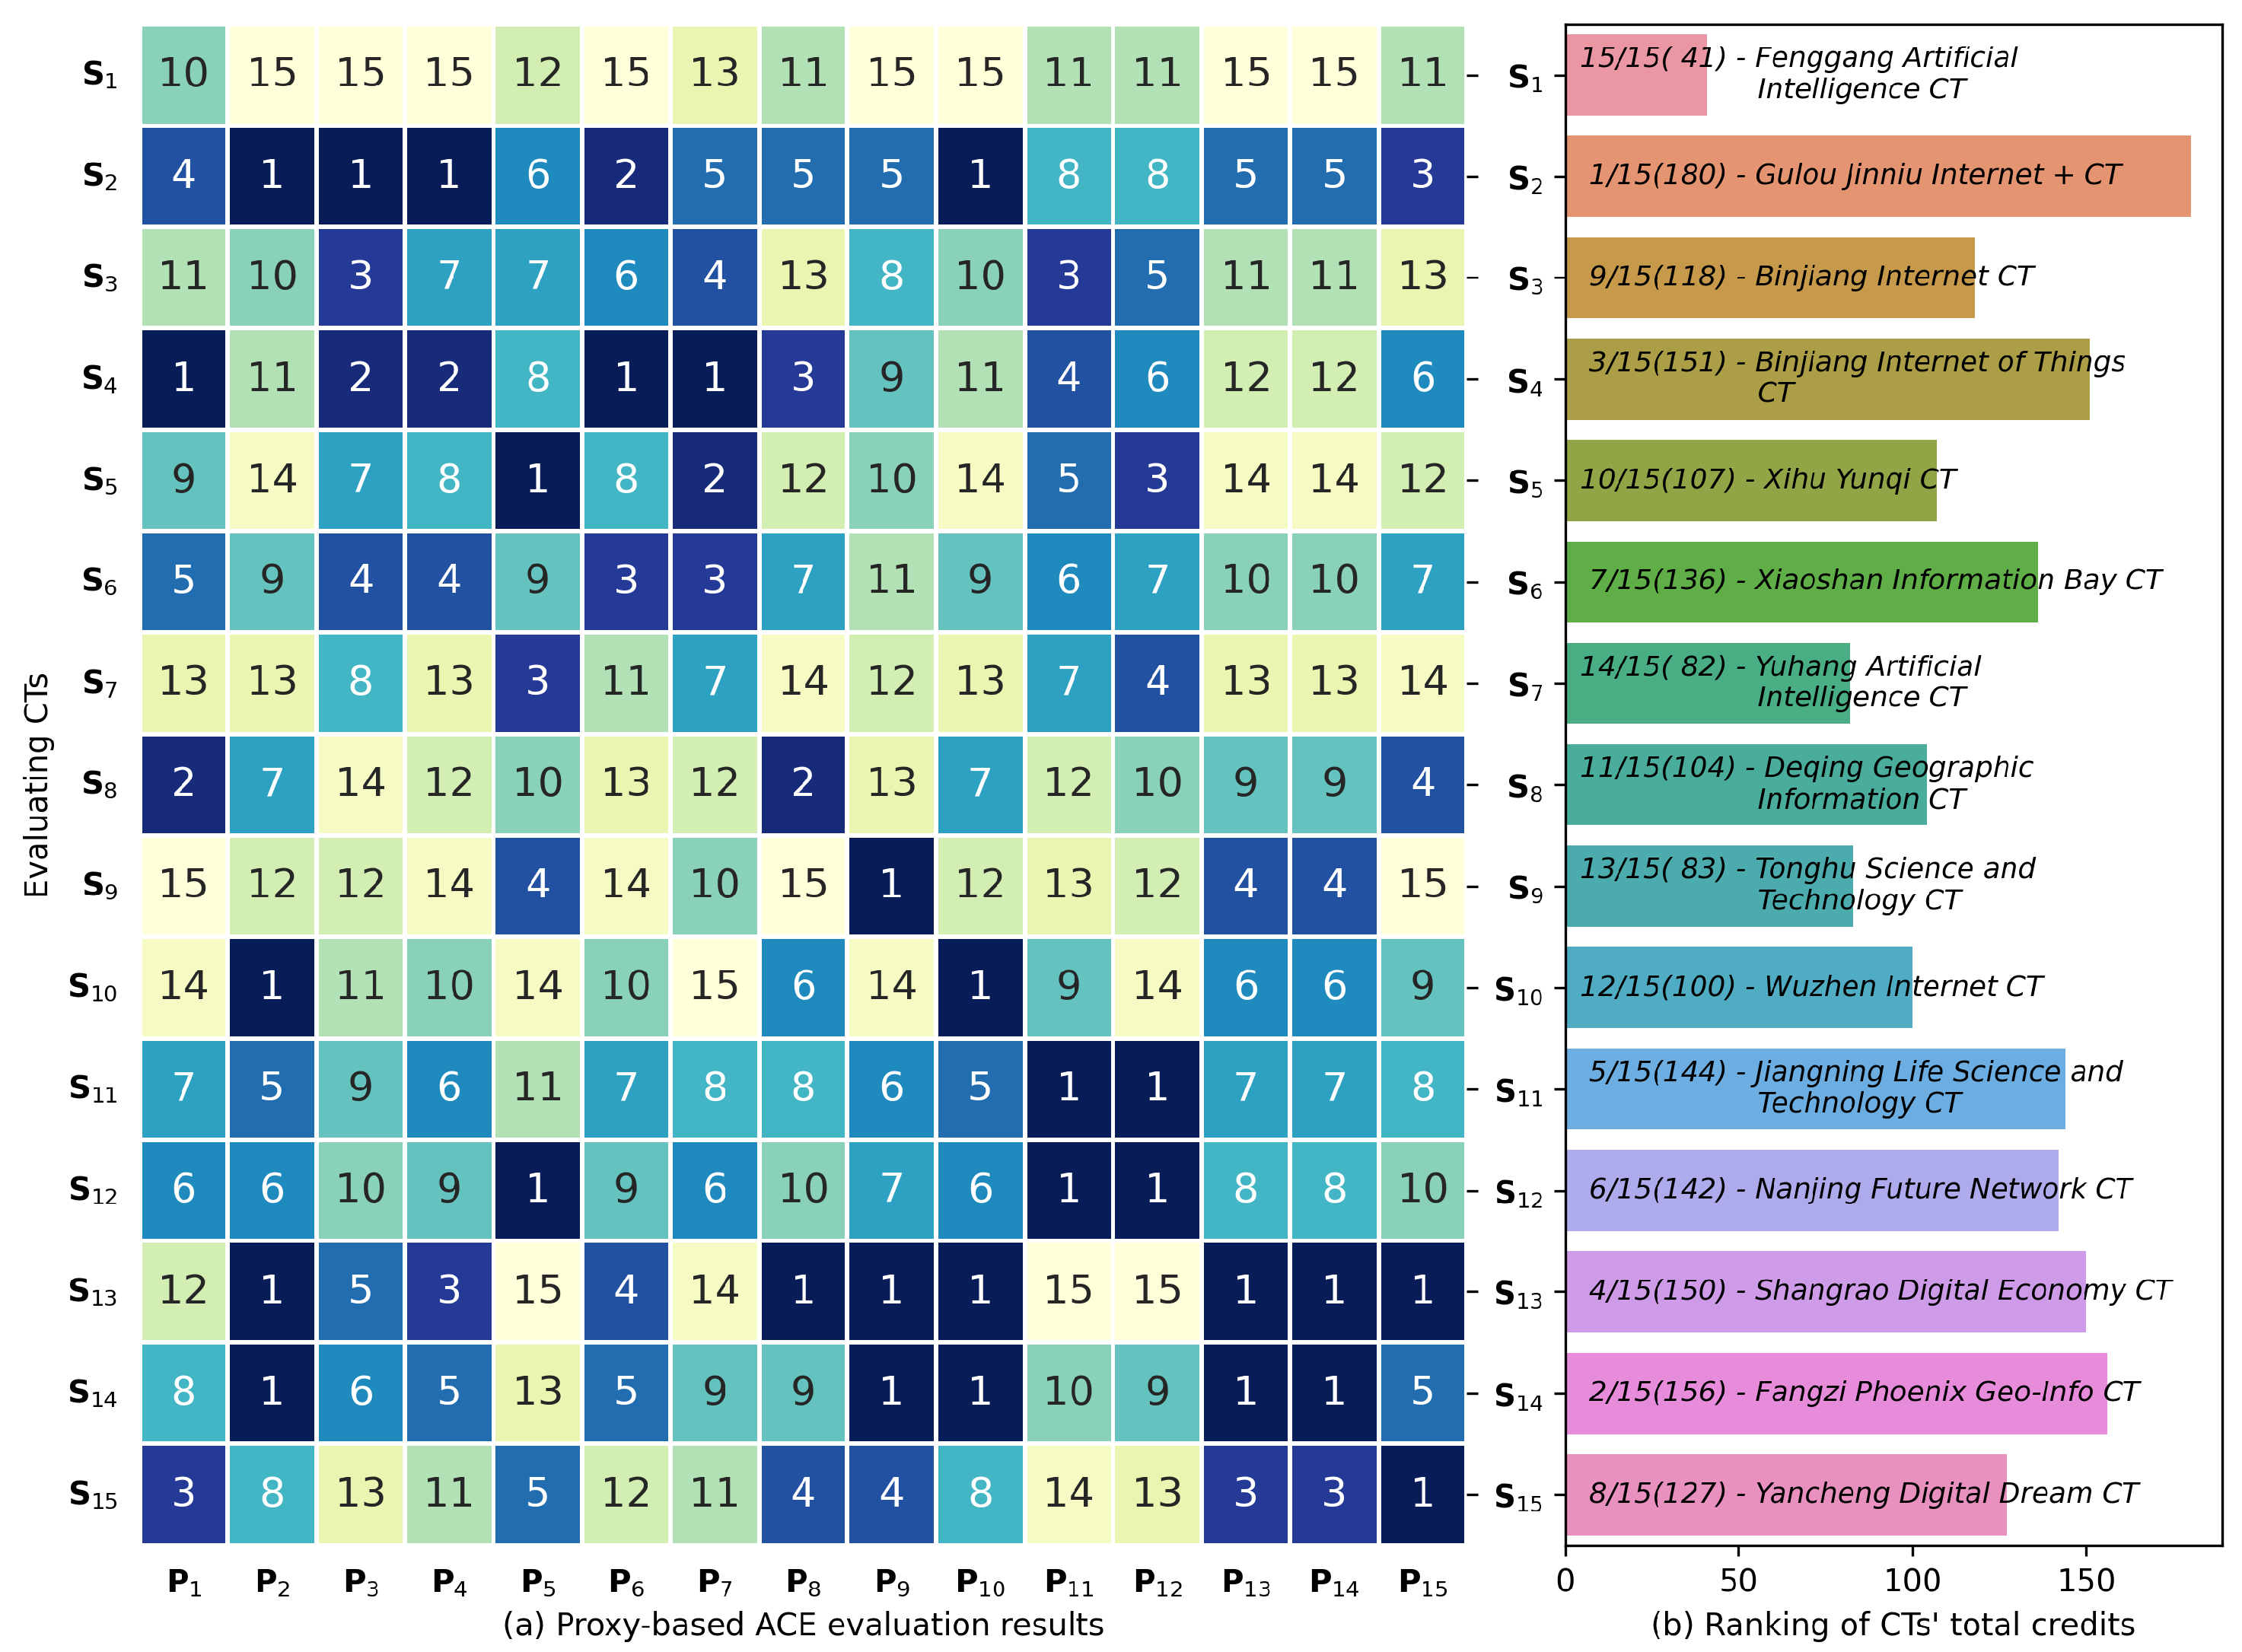
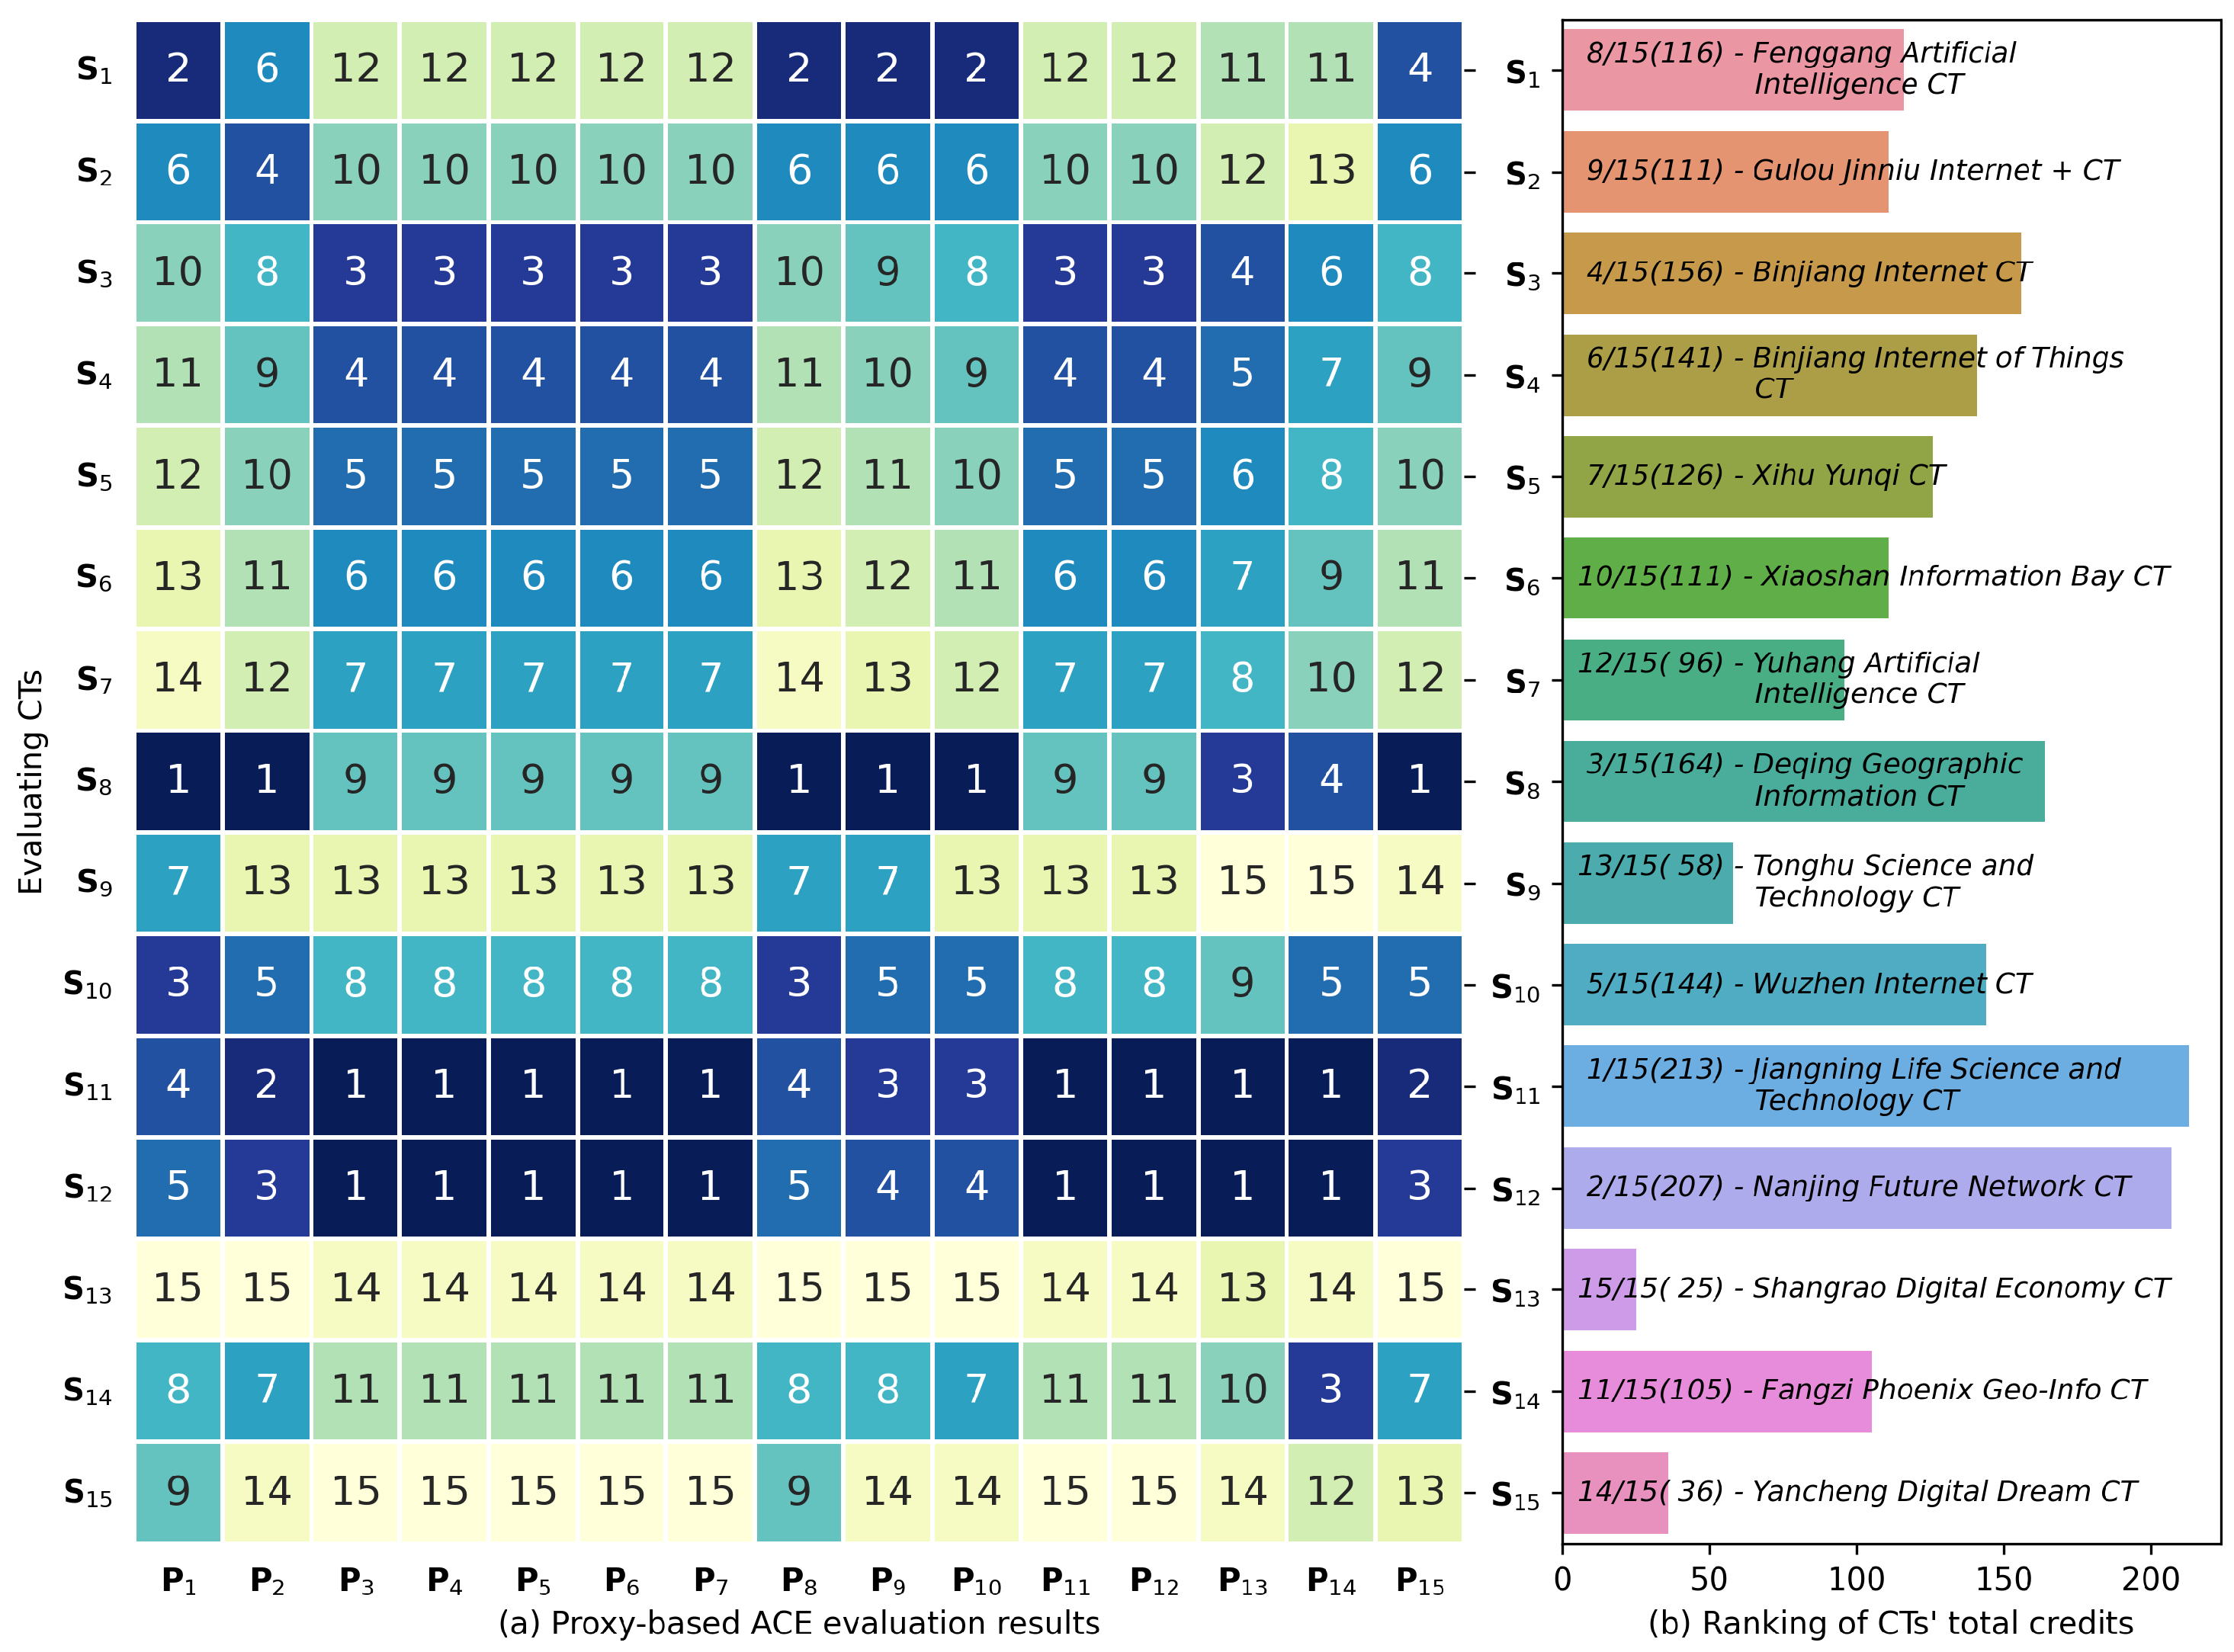
4.4. Proxy ACE Results of the ITCTs
5. Discussion
5.1. The ITCTs’ Universal Well Developments
5.2. Five Outperformed ITCTs at the Distinctive Industry Development Indicator
5.3. Prevailing Advantages of the ITCTs at the Development Foundation Indicator
5.4. Two Regional ITCT Clusters at the Indicator Urban Environment
5.5. ITCTs’ Diverged Performance in Investment Environment
6. Conclusions
- All fifteen ITCTs, except for Fenggang Artificial Intelligence CT and Tonghu Science and Technology CT at Guangdong province, presented universal sound developments and no apparent disadvantages at the top-level indicator. A parallel “blossoming” trend shows the non-homogeneous characteristics of the ITCTs and varies from the increasing concerns in the unbalanced development of China’s CT construction.
- The ITCTs’ mutual evaluation results show varying distribution patterns at the four second-level indicators, which include Distinctive Industry Development, Development Foundation, Urban Environment, and Investment Environment. For example, the indicator Distinctive Industry Development can uniformly measure an ITCT’s construction performance; however, the indicator Urban Environment fails to distinguish ITCTs in the same geographical regions regarding the indicator’s close correlation with local advantages. Moreover, the fifteen ITCTs’ prevailing advantages at the indicator Development Foundation confirms the soundness of the current work in selecting ITCTs as the research objects for the CT evaluation study.
- The significant divergence in ITCTs’ self-evaluation, mutual evaluation, and final ranking indicates the ACE’s favor in the global comparative advantages, not the absolute advantages obtained under a single standard. For instance, most ITCTs rank themselves the best under their IAP at the secondary indicator Investment Environment but need better evaluation results from other provinces. For the same indicator, the Fenggang Artificial Intelligence CT can even win the best in the final ranking based on total credits, even after losing the first at its most beneficial IAP. The comprehensive evaluation results of other secondary indicators also confirm this statement. By revealing their distinctive advantages, the presented work verifies the ACE approach’s value in evaluating CT performance and highlighting their comparative advantages.
Author Contributions
Funding
Acknowledgments
Conflicts of Interest
Abbreviations
| ACE | Advantage-oriented competitive evaluation method |
| AHP | Analytical hierarchical process |
| AOCT | Agricultural-oriented characteristic town |
| ASIEs | Above-scale industrial enterprises |
| CT | Characteristic town |
| DMEs | Density of market entities |
| EGM | Experts grading method |
| ITCT | Information technology characteristic town |
| IVQ | Interval-valued quantification |
| LQ | Location quotient |
| UN | United Nations |
Appendix A. The Individual Advantageous Patterns of Fifteen ITCTs at Secondary and Tertiary Indicators

| X | X | X | X | ||||||||||
|---|---|---|---|---|---|---|---|---|---|---|---|---|---|
| X | X | X | X | X | X | X | X | X | X | X | X | X | |
| S | 0.105 | 0.593 | 0.302 | 0.009 | 0.805 | 0.149 | 0.038 | 0.030 | 0.141 | 0.040 | 0.789 | 0.942 | 0.059 |
| S | 0.081 | 0.546 | 0.373 | 1.000 | 0.000 | 0.000 | 0.000 | 0.157 | 0.120 | 0.086 | 0.637 | 0.303 | 0.697 |
| S | 0.137 | 0.480 | 0.383 | 0.004 | 0.939 | 0.043 | 0.015 | 0.010 | 0.019 | 0.899 | 0.073 | 0.025 | 0.975 |
| S | 0.103 | 0.449 | 0.449 | 0.002 | 0.963 | 0.026 | 0.009 | 0.010 | 0.019 | 0.899 | 0.073 | 0.025 | 0.975 |
| S | 0.137 | 0.480 | 0.383 | 0.000 | 0.000 | 1.000 | 0.000 | 0.010 | 0.019 | 0.899 | 0.073 | 0.025 | 0.975 |
| S | 0.137 | 0.480 | 0.383 | 0.005 | 0.929 | 0.050 | 0.017 | 0.010 | 0.019 | 0.899 | 0.073 | 0.025 | 0.975 |
| S | 0.103 | 0.449 | 0.449 | 0.011 | 0.671 | 0.259 | 0.058 | 0.010 | 0.019 | 0.899 | 0.073 | 0.025 | 0.975 |
| S | 0.110 | 0.468 | 0.422 | 0.001 | 0.990 | 0.008 | 0.001 | 0.035 | 0.078 | 0.046 | 0.841 | 0.444 | 0.556 |
| S | 0.105 | 0.595 | 0.300 | 0.000 | 1.000 | 0.000 | 0.000 | 0.060 | 0.135 | 0.081 | 0.725 | 0.477 | 0.523 |
| S | 0.114 | 0.466 | 0.420 | 1.000 | 0.000 | 0.000 | 0.000 | 0.063 | 0.173 | 0.085 | 0.680 | 0.444 | 0.556 |
| S | 0.039 | 0.787 | 0.174 | 0.000 | 0.000 | 0.000 | 1.000 | 0.003 | 0.008 | 0.959 | 0.031 | 0.411 | 0.590 |
| S | 0.036 | 0.732 | 0.232 | 0.000 | 0.000 | 0.500 | 0.500 | 0.003 | 0.008 | 0.959 | 0.031 | 0.418 | 0.583 |
| S | 0.074 | 0.323 | 0.602 | 0.500 | 0.500 | 0.000 | 0.000 | 0.091 | 0.203 | 0.100 | 0.606 | 1.000 | 0.000 |
| S | 0.041 | 0.547 | 0.412 | 0.500 | 0.500 | 0.000 | 0.000 | 0.074 | 0.128 | 0.078 | 0.720 | 1.000 | 0.000 |
| S | 0.087 | 0.511 | 0.402 | 0.005 | 0.934 | 0.058 | 0.003 | 0.078 | 0.158 | 0.069 | 0.695 | 0.697 | 0.303 |
| Avg. | 0.094 | 0.527 | 0.379 | 0.203 | 0.549 | 0.140 | 0.109 | 0.043 | 0.083 | 0.466 | 0.408 | 0.417 | 0.583 |
| X | X | X | X | X | X | X | X | X | X | X | X | X | ||||||||||||||
|---|---|---|---|---|---|---|---|---|---|---|---|---|---|---|---|---|---|---|---|---|---|---|---|---|---|---|
| X | X | X | X | X | X | X | X | X | X | X | X | X | X | X | X | X | X | X | X | X | X | X | X | X | X | |
| S | 1 | 0.250 | 0.428 | 0.322 | 0.615 | 0.385 | 1 | 0.153 | 0.012 | 0.835 | 0.084 | 0.916 | 0.643 | 0.357 | 1 | 0.215 | 0.785 | 1 | 0.896 | 0.065 | 0.039 | 0.003 | 0.997 | 0.283 | 0.545 | 0.172 |
| S | 1 | 0.276 | 0.145 | 0.579 | 0.750 | 0.250 | 1 | 0.967 | 0.000 | 0.033 | 0.084 | 0.916 | 0.275 | 0.726 | 1 | 0.397 | 0.603 | 1 | 0.801 | 0.097 | 0.102 | 0.093 | 0.907 | 0.087 | 0.118 | 0.795 |
| S | 1 | 0.426 | 0.232 | 0.342 | 0.676 | 0.324 | 1 | 0.934 | 0.002 | 0.064 | 0.340 | 0.660 | 0.090 | 0.910 | 1 | 0.360 | 0.641 | 1 | 0.599 | 0.276 | 0.125 | 0.192 | 0.808 | 0.007 | 0.661 | 0.332 |
| S | 1 | 0.426 | 0.232 | 0.342 | 0.742 | 0.258 | 1 | 0.547 | 0.001 | 0.452 | 0.340 | 0.660 | 0.090 | 0.910 | 1 | 0.360 | 0.641 | 1 | 0.599 | 0.276 | 0.125 | 0.192 | 0.808 | 0.007 | 0.661 | 0.332 |
| S | 1 | 0.426 | 0.232 | 0.342 | 0.676 | 0.324 | 1 | 0.655 | 0.006 | 0.339 | 0.000 | 1 | 0.090 | 0.910 | 1 | 0.360 | 0.641 | 1 | 0.599 | 0.276 | 0.125 | 0.192 | 0.808 | 0.007 | 0.661 | 0.332 |
| S | 1 | 0.426 | 0.232 | 0.342 | 0.676 | 0.324 | 1 | 0.566 | 0.002 | 0.432 | 0.340 | 0.660 | 0.090 | 0.910 | 1 | 0.360 | 0.641 | 1 | 0.599 | 0.276 | 0.125 | 0.192 | 0.808 | 0.007 | 0.661 | 0.332 |
| S | 1 | 0.426 | 0.232 | 0.342 | 0.742 | 0.258 | 1 | 0.732 | 0.008 | 0.260 | 0.225 | 0.776 | 0.090 | 0.910 | 1 | 0.360 | 0.641 | 1 | 0.599 | 0.276 | 0.125 | 0.192 | 0.808 | 0.007 | 0.661 | 0.332 |
| S | 1 | 0.469 | 0.241 | 0.290 | 0.647 | 0.353 | 1 | 0.013 | 0.000 | 0.987 | 0.044 | 0.956 | 0.402 | 0.598 | 1 | 0.329 | 0.671 | 1 | 0.871 | 0.081 | 0.048 | 0.321 | 0.679 | 0.056 | 0.368 | 0.575 |
| S | 1 | 0.212 | 0.183 | 0.605 | 0.618 | 0.382 | 1 | 0.000 | 1 | 0.000 | 0.026 | 0.974 | 0.427 | 0.573 | 1 | 0.449 | 0.552 | 1 | 0.752 | 0.104 | 0.144 | 0.828 | 0.172 | 0.503 | 0.192 | 0.306 |
| S | 1 | 0.433 | 0.273 | 0.293 | 0.676 | 0.324 | 1 | 0.157 | 0.003 | 0.840 | 0.463 | 0.537 | 0.400 | 0.600 | 1 | 0.237 | 0.763 | 1 | 0.789 | 0.145 | 0.065 | 0.078 | 0.922 | 0.049 | 0.639 | 0.312 |
| S | 1 | 0.365 | 0.060 | 0.575 | 0.740 | 0.261 | 1 | 0.376 | 0.005 | 0.620 | 0.210 | 0.790 | 0.000 | 1 | 1 | 0.235 | 0.765 | 1 | 0.723 | 0.214 | 0.064 | 0.014 | 0.986 | 0.044 | 0.732 | 0.224 |
| S | 1 | 0.365 | 0.060 | 0.575 | 0.819 | 0.181 | 1 | 0.335 | 0.006 | 0.659 | 0.000 | 1 | 0.000 | 1 | 1 | 0.235 | 0.765 | 1 | 0.723 | 0.214 | 0.064 | 0.014 | 0.986 | 0.016 | 0.753 | 0.231 |
| S | 1 | 0.264 | 0.232 | 0.505 | 0.816 | 0.184 | 1 | 0.000 | 1 | 0.000 | 0.410 | 0.590 | 0.459 | 0.541 | 1 | 0.402 | 0.598 | 1 | 0.419 | 0.307 | 0.275 | 1 | 0.000 | 0.200 | 0.406 | 0.394 |
| S | 1 | 0.673 | 0.078 | 0.249 | 0.876 | 0.124 | 1 | 0.000 | 1 | 0.000 | 0.076 | 0.924 | 0.370 | 0.630 | 1 | 0.387 | 0.613 | 1 | 0.528 | 0.405 | 0.068 | 0.000 | 1 | 0.148 | 0.505 | 0.347 |
| S | 1 | 0.437 | 0.176 | 0.387 | 0.742 | 0.258 | 1 | 0.056 | 0.072 | 0.871 | 0.027 | 0.973 | 0.420 | 0.580 | 1 | 0.410 | 0.590 | 1 | 0.700 | 0.194 | 0.106 | 0.743 | 0.257 | 0.162 | 0.272 | 0.566 |
| Avg. | 1 | 0.392 | 0.202 | 0.406 | 0.721 | 0.279 | 1 | 0.366 | 0.208 | 0.426 | 0.178 | 0.822 | 0.256 | 0.744 | 1 | 0.340 | 0.661 | 1 | 0.680 | 0.214 | 0.107 | 0.270 | 0.730 | 0.106 | 0.522 | 0.372 |
Appendix B. Rankings of the Fifteen ITCTs at Secondary Indicators
| Ranking | Proxy Characteristic Town | ||||||||||||||
|---|---|---|---|---|---|---|---|---|---|---|---|---|---|---|---|
| S | S | S | S | S | S | S | S | S | S | S | S | S | S | S | |
| 1 | S | S | S | S | S | S | S | S | S | S | S | ● | S | ● | S |
| 2 | S | S | S | S | S | S | S | S | S | S | ❍ | S | S | S | S |
| 3 | S | S | S | S | S | S | S | S | S | S | S | S | ❍ | S | S |
| 4 | S | ❍ | S | S | S | S | S | S | S | S | S | S | S | S | S |
| 5 | S | S | S | S | S | S | S | S | ❍ | S | S | S | S | S | ❍ |
| 6 | ❍ | S | S | S | S | S | S | S | S | S | S | S | S | S | S |
| 7 | S | S | S | ❍ | S | S | S | S | S | S | S | S | S | S | S |
| 8 | S | S | S | S | S | S | ❍ | S | S | S | S | S | S | S | S |
| 9 | S | S | ❍ | S | S | S | S | S | S | S | S | S | S | S | S |
| 10 | S | S | S | S | ❍ | S | S | S | S | S | S | S | S | S | S |
| 11 | S | S | S | S | S | ❍ | S | S | S | S | S | S | S | S | S |
| 12 | S | S | S | S | S | S | S | ❍ | S | S | S | S | S | S | S |
| 13 | S | S | S | S | S | S | S | S | S | ❍ | S | S | S | S | S |
| 14 | S | S | S | S | S | S | S | S | S | S | S | S | S | S | S |
| 15 | S | S | S | S | S | S | S | S | S | S | S | S | S | S | S |
| Ranking | Proxy Characteristic Town | ||||||||||||||
|---|---|---|---|---|---|---|---|---|---|---|---|---|---|---|---|
| S | S | S | S | S | S | S | S | S | S | S | S | S | S | S | |
| 1 | S | ● | S | S | ● | S | S | S | ● | ● | ● | ● | ● | ● | ● |
| 2 | S | S | S | ❍ | S | S | S | ❍ | S | S | S | S | S | S | S |
| 3 | S | S | ❍ | S | S | ❍ | S | S | S | S | S | S | S | S | S |
| 4 | S | S | S | S | S | S | S | S | S | S | S | S | S | S | S |
| 5 | S | S | S | S | S | S | S | S | S | S | S | S | S | S | S |
| 6 | S | S | S | S | S | S | S | S | S | S | S | S | S | S | S |
| 7 | S | S | S | S | S | S | ❍ | S | S | S | S | S | S | S | S |
| 8 | S | S | S | S | S | S | S | S | S | S | S | S | S | S | S |
| 9 | S | S | S | S | S | S | S | S | S | S | S | S | S | S | S |
| 10 | ❍ | S | S | S | S | S | S | S | S | S | S | S | S | S | S |
| 11 | S | S | S | S | S | S | S | S | S | S | S | S | S | S | S |
| 12 | S | S | S | S | S | S | S | S | S | S | S | S | S | S | S |
| 13 | S | S | S | S | S | S | S | S | S | S | S | S | S | S | S |
| 14 | S | S | S | S | S | S | S | S | S | S | S | S | S | S | S |
| 15 | S | S | S | S | S | S | S | S | S | S | S | S | S | S | S |
| Ranking | Proxy Characteristic Town | ||||||||||||||
|---|---|---|---|---|---|---|---|---|---|---|---|---|---|---|---|
| S | S | S | S | S | S | S | S | S | S | S | S | S | S | S | |
| 1 | S | S | S | S | S | S | S | ● | S | S | ● | ● | S | S | S |
| 2 | ❍ | S | S | S | S | S | S | S | S | S | S | S | S | S | S |
| 3 | S | S | ❍ | S | S | S | S | S | S | S | S | S | S | ❍ | S |
| 4 | S | ❍ | S | ❍ | S | S | S | S | S | S | S | S | S | S | S |
| 5 | S | S | S | S | ❍ | S | S | S | S | ❍ | S | S | S | S | S |
| 6 | S | S | S | S | S | ❍ | S | S | S | S | S | S | S | S | S |
| 7 | S | S | S | S | S | S | ❍ | S | ❍ | S | S | S | S | S | S |
| 8 | S | S | S | S | S | S | S | S | S | S | S | S | S | S | S |
| 9 | S | S | S | S | S | S | S | S | S | S | S | S | S | S | S |
| 10 | S | S | S | S | S | S | S | S | S | S | S | S | S | S | S |
| 11 | S | S | S | S | S | S | S | S | S | S | S | S | S | S | S |
| 12 | S | S | S | S | S | S | S | S | S | S | S | S | S | S | S |
| 13 | S | S | S | S | S | S | S | S | S | S | S | S | ❍ | S | ❍ |
| 14 | S | S | S | S | S | S | S | S | S | S | S | S | S | S | S |
| 15 | S | S | S | S | S | S | S | S | S | S | S | S | S | S | S |
| Ranking | Proxy Characteristic Town | ||||||||||||||
|---|---|---|---|---|---|---|---|---|---|---|---|---|---|---|---|
| S | S | S | S | S | S | S | S | S | S | S | S | S | S | S | |
| 1 | S | ● | ● | ● | ● | ● | ● | S | ● | S | ● | S | ● | ● | S |
| 2 | ❍ | S | S | S | S | S | S | S | S | S | S | ❍ | S | S | ❍ |
| 3 | S | S | S | S | S | S | S | S | S | S | S | S | S | S | S |
| 4 | S | S | S | S | S | S | S | S | S | S | S | S | S | S | S |
| 5 | S | S | S | S | S | S | S | S | S | ❍ | S | S | S | S | S |
| 6 | S | S | S | S | S | S | S | S | S | S | S | S | S | S | S |
| 7 | S | S | S | S | S | S | S | ❍ | S | S | S | S | S | S | S |
| 8 | S | S | S | S | S | S | S | S | S | S | S | S | S | S | S |
| 9 | S | S | S | S | S | S | S | S | S | S | S | S | S | S | S |
| 10 | S | S | S | S | S | S | S | S | S | S | S | S | S | S | S |
| 11 | S | S | S | S | S | S | S | S | S | S | S | S | S | S | S |
| 12 | S | S | S | S | S | S | S | S | S | S | S | S | S | S | S |
| 13 | S | S | S | S | S | S | S | S | S | S | S | S | S | S | S |
| 14 | S | S | S | S | S | S | S | S | S | S | S | S | S | S | S |
| 15 | S | S | S | S | S | S | S | S | S | S | S | S | S | S | S |
References
- Wang, X.; Liu, S.; Sykes, O.; Wang, C. Characteristic Development Model: A Transformation for the Sustainable Development of Small Towns in China. Sustainability 2019, 11, 3753. [Google Scholar] [CrossRef]
- Qi, H.; Xi, X. Does Urbanization Development Narrow China’s Income and Consumption Gap between Urban and Rural Areas? Nanjing J. Soc. Sci. 2015, 7–14. [Google Scholar] [CrossRef]
- Chen, Z.; Zhao, Y.; Zhou, X.; Zhang, L. Investigating Critical Factors That Encourage Private Partners to Participate in Sports and Leisure Characteristic Town Public-Private Partnerships: Evidence from China. Sustainability 2020, 12, 3212. [Google Scholar] [CrossRef]
- Chu, Y.w. China’s New Urbanization Plan: Progress and Structural Constraints. Cities 2020, 103, 102736. [Google Scholar] [CrossRef]
- Zhou, F.; Zhao, F.; Xu, Q.; Yuan, Y.; Zhang, M. Evaluation and Selection Methods of Tourism Characteristic Town: The Case of Liaoning Province, China. Sustainability 2020, 12, 5372. [Google Scholar] [CrossRef]
- Du, Z.; Jin, L.; Ye, Y.; Zhang, H. Characteristics and Influences of Urban Shrinkage in the Exo-Urbanization Area of the Pearl River Delta, China. Cities 2020, 103, 102767. [Google Scholar] [CrossRef]
- Wu, Y.; Chen, Y.; Deng, X.; Hui, E.C. Development of Characteristic Towns in China. Habitat Int. 2018, 77, 21–31. [Google Scholar] [CrossRef]
- Zhao, W.; Zou, Y. Creating a Makerspace in a Characteristic Town: The Case of Dream Town in Hangzhou. Habitat Int. 2021, 114, 102399. [Google Scholar] [CrossRef]
- Ruoppila, S.; Zhao, F. The Role of Universities in Developing China’s University Towns: The Case of Songjiang University Town in Shanghai. Cities 2017, 69, 56–63. [Google Scholar] [CrossRef]
- Miao, J.T.; Phelps, N.A. ‘Featured Town’ Fever: The Anatomy of a Concept and Its Elevation to National Policy in China. Habitat Int. 2019, 87, 44–53. [Google Scholar] [CrossRef]
- Zou, Y.; Zhao, W. Searching for a New Dynamic of Industrialization and Urbanization: Anatomy of China’s Characteristic Town Program. Urban Geogr. 2018, 39, 1060–1069. [Google Scholar] [CrossRef]
- Rong, X. Attaching Great Importance to the Supporting Role of Small Towns in National Strategy. Dev. Small Cities Towns 2022, 40, 5–9. [Google Scholar]
- Chen, M.; Liu, W.; Lu, D.; Chen, H.; Ye, C. Progress of China’s New-Type Urbanization Construction since 2014: A Preliminary Assessment. Cities 2018, 78, 180–193. [Google Scholar] [CrossRef]
- Miao, J.T.; Phelps, N.A.; Lu, T.; Wang, C.C. The Trials of China’s Technoburbia: The Case of the Future Sci-tech City Corridor in Hangzhou. Urban Geogr. 2019, 40, 1443–1466. [Google Scholar] [CrossRef]
- Longlong, L.; Fan, W.; Bingxin, Z. Construction of tourism function evaluation system in Qinling characteristic towns of Shangluo City. Hubei Agric. Sci. 2023, 62, 74–78. [Google Scholar] [CrossRef]
- Fan, W. Research on the Evaluation of the High Quality Development Level of Handan Agricultural-type Characteristic Towns. Rural. Sci. Technol. 2023, 14, 47–52. [Google Scholar] [CrossRef]
- Haili, W. Research on the Competitiveness Evaluation of Characteristic Towns—Based on the Data of Characteristic Towns in Jiangxi Province. Ph.D. Thesis, Shanghai University of Finance and Economics, Shanghai, China, 2021. [Google Scholar]
- Yongcheng, W.; Xueting, W.; Min, L. Research on Comprehensive Competitiveness Evaluation of Characteristic Towns of Cultural Tourism and Trade in Anhui Province Based on AHP–Taking “Sangua Commune” in Anhui Province as an Example. J. Guangdong Univ. Petrochem. Technol. 2021, 31, 75–80. [Google Scholar]
- Chen, Z. Cooperative Governance of Complex Public-Private Partnership Program: Case Study of Characteristic Town Program. Adv. Civ. Eng. 2020, 2020, 8873402. [Google Scholar] [CrossRef]
- Hu, M.; Wang, L.; Wang, W.; Tong, L.; Lin, Y. Study on the Sustainable Development Factors of Agriculture-Oriented Characteristic Towns in China. Sustainability 2022, 14, 12292. [Google Scholar] [CrossRef]
- Guo, W.; Wu, D.F.; Li, Y.; Wang, F.X.; Ye, Y.Q.; Lin, H.W.; Zhang, C.F. Suitability Evaluation of Popular Science Tourism Sites in University Towns: Case Study of Guangzhou University Town. Sustainability 2022, 14, 2296. [Google Scholar] [CrossRef]
- He, T.; Song, H.; Guo, A. Can Small Industrial Platforms Achieve Large Space Spillover? Identifying the Spatial Spillover Scope of Characteristic Towns Using the Gradient Difference Method. Remote Sens. 2022, 14, 3851. [Google Scholar] [CrossRef]
- Guin, D. Contemporary Perspectives of Small Towns in India: A Review. Habitat Int. 2019, 86, 19–27. [Google Scholar] [CrossRef]
- Senetra, A.; Szarek-Iwaniuk, P. Socio-Economic Development of Small Towns in the Polish Cittaslow Network—A Case Study. Cities 2020, 103, 102758. [Google Scholar] [CrossRef]
- Meng, Z.; Wang, S.; Wang, Z.; Xie, D. Evaluation Study on the Competitiveness of China’s Characteristic Towns. J. Shandong Acad. Gov. 2020, 5, 91–101. [Google Scholar] [CrossRef]
- Zhao, X.; Chu, H.; Wang, F. On Jingyou and Its Management. Chinese J. Manag. 2012, 9, 492–498. [Google Scholar]
- Liu, H.; Zhao, X. An Evaluation Method for Better Action Conforming to Natural Rules and Application of Knowledge Employee’s Performance Evaluation Based on Three Advantages. J. Syst. Manag. 2019, 28, 725–731. [Google Scholar]
- Liu, H.; Zhao, X.; Zhou, Y.; Jin, H. A Study on the Performance Jingyou Evaluation of R&D Personnel Based on Evaluated Objects’ Trait Pattern Recognition. Sci. Technol. Manag. Res. 2020, 40, 98–104. [Google Scholar]
- Jia, M.; Zhang, L.; Fu, J.; Zhang, L. Evaluation of High-level Sci-tech Talents Based on the Method of Better Action Conforming to Natural Rule. Sci. Technol. Prog. Policy 2017, 34, 120–125. [Google Scholar]
- Zhang, W.C.; Wang, B.; Cai, Y. Research on Characteristic Towns in China (Theory, Practice and Policy); China Social Sciences Press: Beijing, China, 2018. [Google Scholar]
- Huang, Y.; Wang, L.; Meng, Z. China Characteristic Town Development Report (2018–2019)—Evaluation of the Competitiveness of Chinese Characteristic Towns; Social Sciences Academic Press(China): Beijing, China, 2020. [Google Scholar]
- Meipian. Feng Huang Xiao Zhen. 2019-06-22. 2019. Available online: https://www.meipian.cn/27fr77p8 (accessed on 9 November 2022).
- Tian, F. The Oppenning of Yun Qi CT. 2017. Available online: https://www.sohu.com/a/197505915_99967819 (accessed on 9 November 2022).
- Dist, H.W.L. Yunqi CT. 2021. Available online: https://www.hzxh.gov.cn/art/2021/2/22/art_1228971990_40382207.html (accessed on 9 November 2022).
- Suzhou Multispace Media & Exhibition Co., Ltd. Suzhou Multispace Media & Exhibition Creates a New Business Card for China Gene Valley. 2016. Available online: http://www.multispace.cn/news/read.aspx?id=118 (accessed on 9 November 2022).
- Huang, S.; Zhao, X.; Liu, S. Research on a Particle Swarm Optimization Based Jingyou the Extensive Method and Evaluation Guiding Effect—A Case Study of TOPSIS Model. Oper. Res. Manag. Sci. 2021, 30, 160–166. [Google Scholar]
- Huang, S.; Zhao, X.; Zhou, Y. Long-term Effective Mechanism and Construction for Dynamic Evaluation. Chin. J. Manag. 2022, 30, 180–191. [Google Scholar] [CrossRef]
- Yang, K.; Zhao, X.; Zhou, Y. Competitive Advantage evaluation of Urban Sci-tech Innovation Ability from Comparative Advantage Perspective—Taking Zheng Luoxin National Demonstration Zone as an Example. J. Henan Univ. Technol. (Soc. Sci. Ed.) 2018, 14, 26–35. [Google Scholar]
- Yang, K.; Zhao, X.; Zhou, Y. Study on Evaluation Methodology Using Main Pattern Analysis towards City’s Scientific Innovation Ability. J. Zhengzhou Inst. Aeronaut. Ind. Manag. 2018, 36, 43–53. [Google Scholar]
- Myeong, S.; Jung, Y.; Lee, E. A Study on Determinant Factors in Smart City Development: An Analytic Hierarchy Process Analysis. Sustainability 2018, 10, 2606. [Google Scholar] [CrossRef]
- National Bureau of Statistics of China. China City Statistical Yearbook 2021; China Statistics Press: Beijing, China, 2022. [Google Scholar]
- National Bureau of Statistics of China. China Statistical Yearbook 2022; China Statistics Press: Beijing, China, 2022. [Google Scholar]
- Annual Report on Development of Small and Medium-Sized Cities in China (2022); Technical Report; Social Sciences Academic Press(China): Beijing, China, 2022.
- Ministry of Transport of the People’s Republic of China. The Transport Yearbook of China (2021); China Communication Press: Beijing, China, 2022. [Google Scholar]
- Baidu. Baidu Map. 2023. Available online: https://map.baidu.com/ (accessed on 9 November 2022).
- National Bureau of Statistics of China. Tabulation on the 2010 Population Census of the People’s Republic of China; National Bureau of Statistics of China: Beijing, China, 2010. [Google Scholar]
- National Bureau of Statistics of China. China City Statistical Yearbook 2017; China Statistics Press: Beijing, China, 2017. [Google Scholar]
- Ministry of Ecology and Environment the People’s Republic of China. Bulletin of Marine Ecology and Environment Status of China in 2021; Ministry of Ecology and Environment the People’s Republic of China: Beijing, China, 2022. [Google Scholar]
- Russell, F. Forbes China’s Best 100 Cities for Business List (Full Ranking). 2018. Available online: https://www.forbes.com/sites/russellflannery/2018/01/02/forbes-chinas-best-100-cities-for-business-list-full-ranking/?sh=3aaa5e736328 (accessed on 9 November 2022).
- Jihong, M.; He, T.; Yanbin, L.; Xiaomei, W. Annual Report on Rule of Law in China; Social Sciences Academic Press (China): Beijing, China, 2022. [Google Scholar]


| ID | Name | City | Province | Area () | Population ( pl) |
|---|---|---|---|---|---|
| Fenggang Artificial Intelligence CT | Dongguan | Guangdong | 2460 | 8261.4 | |
| Gulou Jinniu Internet + CT | Fuzhou | Fujian | 12,675 | 7570 | |
| Binjiang Internet CT | Hangzhou | Zhejiang | 16,596 | 9188 | |
| Binjiang Internet of Things CT | Hangzhou | Zhejiang | 16,596 | 9188 | |
| Xihu Yunqi CT | Hangzhou | Zhejiang | 16,596 | 9188 | |
| Xiaoshan Information Bay CT | Hangzhou | Zhejiang | 16,596 | 9188 | |
| Yuhang Artificial Intelligence CT | Hangzhou | Zhejiang | 16,596 | 9188 | |
| Deqing Geographic Information CT | Huzhou | Zhejiang | 5820 | 2648 | |
| Tonghu Science and Technology CT | Huizhou | Guangdong | 11,346 | 4775 | |
| Wuzhen Internet CT | Jiaxing | Zhejiang | 4223 | 4614 | |
| Jiangning Life Science and Technology CT | Nanjing | Jiangsu | 6587 | 8270 | |
| Nanjing Future Network CT | Nanjing | Jiangsu | 6587 | 8270 | |
| Shangrao High-speed Railway Economic Pilot Zone Digital Economy CT | Shangrao | Jiangxi | 22,791 | 6752 | |
| Fangzi Phoenix Geo-Info CT | Weifang | Shandong | 16,143 | 9357 | |
| Yancheng Digital Dream CT | Yancheng | Jiangsu | 16,931 | 7235 |
| Variable | Description | Data Source | Quantification |
|---|---|---|---|
| Distinctive Industry Development ( | |||
| Industry aggregation level ( | |||
| Location Quotient (LQ) of a local region measures an industry’s spatially relative concentration such as , where denote the j-th industry’s regional and national value of a particular statistical index, e.g., for product output, and q denote the regional and national statistics such as GDP. | China City Statistical Yearbook (2021) [41], China Statistical Yearbook (2022) [42] | ||
| Development level () | |||
| Industrial labor productivity is the industrial output per capita of the industry or the secondary industry sector, which reflects the overall productivity of the regional industry sector. | China City Statistical Yearbook (2021) [41], China Statistical Yearbook 2022 [42] | ||
| Density of Market Entities (DMEs) is the ratio of active market subjects to the area of the local administrative area. | China City Statistical Yearbook (2021) [41] | IVQ | |
| Scale economies effect index of above-scale industrial enterprises (ASIEs) is the ratio of the overall business income of ASIEs to the number of ASIEs. The ASIEs, which are defined as the industrial enterprises with annual revenue of more than 20 million RMB, can significantly reflect the industry’s overall competitiveness. | China City Statistical Yearbook (2021) [41] | ||
| Development prospect () | |||
| 2 | Sustainable development of regional industries (mainly in the industrial sector) is quantified by the emissions of three primary pollutants per 10,000 RMB of industrial output value of the ASIEs. | China City Statistical Yearbook (2021) [41] | |
| Development Foundation () | |||
| Regional Capability () | |||
| Township Capability is the rank of a CT’s belonging town in the national ranking named “one-thousand national comprehensive powerful towns of China”. | Annual Report on Development of Small- and Medium-sized Cities in China (2022) [43] | IVQ | |
| Regional Transportation () | |||
| City spatial location is the distance from a CT’s center to the center of its belonging town/city | The Transport Yearbook of China (2022) [44], Baidu Map [45] | ||
| Air Transportation is the annual passenger of the civil airports in the CT’s belonging town. | The Transport Yearbook of China (2022) [44] | IVQ | |
| High-speed Railway Transportation is the linear spatial distance between a CT and its nearest high-speed railway station. | The Transport Yearbook of China (2022) [44] | ||
| Capital Elements () | |||
| Strength of Local Financial Institutions uses the balance of RMB (in 100 million) loans of all financial institutions (city-wide) at year-end. | China City Statistical Yearbook (2021) [41] | ||
| Strength of the Leading Development Body is a CT’s credit rating of primary development and construction entities in the open financial market. | China City Statistical Yearbook (2021) [41] | EGM | |
| Human Capital Elements () | |||
| Labor Density is quantified by the average distribution of the labor force, i.e., the ratio of the employed persons in urban entities at the year-end to the area of the local administrative region. | The Transport Yearbook of China (2022) [44] | ||
| Education Level of the Population is the ratio of the local population with tertiary education or above to the resident population in the sixth census in 2010. | Tabulation on the 2010 Population Census of the People’s Republic of China [46] | ||
| Urban Environment () | |||
| Urban Construction Foundation () | |||
| Construction Investment Intensity is calculated as the total fixed asset investment in five years to the increase in the built-up area of the CT’s belonging city over the same period. | China City Statistical Yearbook (2017) [47], China City Statistical Yearbook (2021) [41] | IVQ | |
| Infrastructure () | |||
| The Highway Network Density is the ratio of a CT’s year-end road mileage to the area of the city’s administrative region. | China City Statistical Yearbook (2021) [41], The Transport Yearbook of China (2022) [44] | ||
| The Health care level of a CT is evaluated by its belonging city’s average number of hospitals and health centers per 100 . | China City Statistical Yearbook (2021) [41] | ||
| Exclusive Resource () | |||
| The Cultural Heritage of a CT is quantified by the number of intangible cultural heritage sites, the acquisition of prestigious and influential titles such as the UN Habitat City. | China City Statistical Yearbook (2021) [41], questionnaire. | EGM | |
| Ecology () | |||
| Urban Greening Coverage is the percentage of greening coverage area in a CT’s built-up area. | China City Statistical Yearbook (2021) [41] | ||
| Air Quality, or a CT’s Annual Average Ambient Air Quality Composite Index in the “Annual White Paper on China’s Environment”. | Bulletin of Marine Ecology and Environment Status of China in 2021 [48] | IVQ | |
| Water Quality is evaluated by the clean water resources available per person in the CT’s region. | Bulletin of Marine Ecology and Environment Status of China in 2021 [48] | ||
| Investment Environment () | |||
| Business Development Environment () | |||
| Business City Rankings is the ranking of a CT’s belonging city in the “Best Business Cities in China” published by the Forbes magazine. | Forbes China’s Best 100 Cities For Business List (Full Ranking) [49] | IVQ | |
| Achievements of Supported Entrepreneurship is quantified by the variation rate of urban self-employed private workers in five years. | China City Statistical Yearbook (2017) [47], China City Statistical Yearbook (2021) [41] | IVQ | |
| Administrative Environment () | |||
| Regional Development Strategy of a CT is rated according to if the CT’s belonging city is entitled with any of following titles: National New District, National Comprehensive Reform Pilot Zone, Free Trade Pilot Zone Area, National Demonstration Zone of Industry–City Integration, National Demonstration Zone of Independent Innovation, Guangdong–Hong Kong–Macao Bay Area, National Poverty-stricken County, Provincial Poverty-stricken County, and Expanded Power County. | China City Statistical Yearbook (2021) [41] | EGM | |
| Local Financial Support is calculated as the local level financial self-sufficiency rate = annual local fiscal expenditure/annual local fiscal revenue × 100% | China City Statistical Yearbook (2021) [41] | ||
| Administration Level of the rank of a CT’s belonging city in the “Annual Report on Rule of Law in China 2022”. | Annual Report on Rule of Law in China (2022) [50] | IVQ | |
| X | X | |||||||||||||
| X | X | X | X | X | X | X | ||||||||
| ID | X | X | X | X | X | X | X | X | X | X | X | X | X | X |
| S | 0.699 | 33.854 | 187.148 | 25,034.010 | 0.125 | 35.957 | 36 | −48.7 | 6 | −14.8 | 6402.48 | 75 | 939.995 | 0.071 |
| S | 1.408 | 47.599 | 13.879 | 37,926.335 | 0.239 | 54.731 | 1000 | −3.6 | 26 | −6.9 | 12,124.69 | 80 | 123.730 | 0.125 |
| S | 5.179 | 47.448 | 20.767 | 21,852.496 | 0.182 | 49.245 | 439.21 | −8.3 | 10 | −18 | 25,464.83 | 80 | 174.822 | 0.189 |
| S | 1.391 | 47.448 | 20.767 | 21,852.496 | 0.233 | 49.245 | 439.21 | −8.3 | 10 | −5.3 | 25,464.83 | 80 | 174.822 | 0.189 |
| S | 5.179 | 47.448 | 20.767 | 21,852.496 | 0.182 | 49.245 | 155 | −17.1 | 10 | −15.6 | 25,464.83 | 100 | 174.822 | 0.189 |
| S | 5.179 | 47.448 | 20.767 | 21852.496 | 0.182 | 49.245 | 477.38 | −10.8 | 10 | −7.6 | 25,464.83 | 80 | 174.822 | 0.189 |
| S | 1.391 | 47.448 | 20.767 | 21,852.496 | 0.233 | 49.245 | 371 | −19 | 10 | −21.1 | 25,464.83 | 85 | 174.822 | 0.189 |
| S | 0.450 | 48.120 | 10.820 | 16,415.006 | 0.182 | 78.481 | 534.33 | −30.2 | 10 | −2.5 | 2740.35 | 80 | 86.298 | 0.066 |
| S | 0.678 | 26.075 | 17.299 | 35,595.057 | 0.125 | 32.710 | 431 | −25.3 | 76 | −29.7 | 3155.13 | 85 | 84.692 | 0.058 |
| S | 0.414 | 43.114 | 30.905 | 15,606.693 | 0.182 | 49.532 | 1000 | −24.8 | 7 | −7.4 | 5185.23 | 20 | 190.731 | 0.077 |
| S | 1.161 | 86.938 | 57.109 | 48,647.200 | 0.231 | 51.767 | 608.67 | −19.2 | 12 | −10 | 21,681.28 | 80 | 311.508 | 0.261 |
| S | 1.161 | 86.938 | 57.109 | 48,647.200 | 0.286 | 51.767 | 608.67 | −23.1 | 12 | −11.2 | 21,681.28 | 100 | 311.508 | 0.261 |
| S | 0.190 | 22.038 | 3.028 | 27,989.631 | 0.309 | 95.803 | 1000 | −9.6 | 76 | −1.5 | 1742.12 | 20 | 19.035 | 0.038 |
| S | 0.578 | 90.181 | 15.548 | 35,010.120 | 0.336 | 61.367 | 1000 | −10.9 | 76 | −10.3 | 4797.91 | 75 | 53.118 | 0.079 |
| S | 0.294 | 57.452 | 11.751 | 28,825.243 | 0.231 | 49.281 | 514 | −29.6 | 66 | −5.3 | 3699.32 | 85 | 51.639 | 0.063 |
| X3 | X4 | |||||||||||||
| X | X | X | X | X | X | |||||||||
| ID | X | X | X | X | X | X | X | X | X | X | X | X | ||
| S | 10.051 | 2.141 | 3.618 | 10 | 47.67 | 4.09 | 412.279 | 43 | 0.258 | 50 | 0.909 | 70.573 | ||
| S | 478.128 | 0.900 | 1.815 | 18 | 43.92 | 3.35 | 2291.546 | 34 | 0.147 | 40 | 0.722 | 79.830 | ||
| S | 187.240 | 0.983 | 2.199 | 64 | 40.73 | 5.24 | 2319.330 | 10 | 0.014 | 25 | 0.999 | 82.060 | ||
| S | 187.240 | 0.983 | 2.199 | 64 | 40.73 | 5.24 | 2319.330 | 10 | 0.014 | 25 | 0.999 | 82.060 | ||
| S | 187.240 | 0.983 | 2.199 | 64 | 40.73 | 5.24 | 2319.330 | 10 | 0.014 | 25 | 0.999 | 82.060 | ||
| S | 187.240 | 0.983 | 2.199 | 64 | 40.73 | 5.24 | 2319.330 | 10 | 0.014 | 25 | 0.999 | 82.060 | ||
| S | 187.240 | 0.983 | 2.199 | 64 | 40.73 | 5.24 | 2319.330 | 10 | 0.014 | 25 | 0.999 | 82.060 | ||
| S | 154.398 | 1.327 | 2.509 | 18 | 48.35 | 5.02 | 3175.880 | 55 | 0.087 | 15 | 0.732 | 71.373 | ||
| S | 1.193 | 1.269 | 10 | 42.94 | 3.25 | 3793.298 | 80 | 0.010 | 50 | 0.710 | 70.573 | |||
| S | 214.108 | 1.922 | 3.410 | 22 | 45.11 | 4.85 | 880.147 | 33 | 0.160 | 25 | 0.877 | 71.373 | ||
| S | 227.819 | 1.702 | 3.416 | 67 | 44.74 | 5.58 | 831.802 | 4 | 0.207 | 40 | 0.973 | 77.010 | ||
| S | 227.819 | 1.702 | 3.416 | 67 | 44.74 | 5.58 | 831.802 | 4 | 0.207 | 25 | 0.973 | 77.010 | ||
| S | 64.102 | 0.893 | 1.764 | 7 | 34.19 | 4.7 | 4685.871 | 100 | −0.038 | 15 | 0.459 | 49.974 | ||
| S | 204.923 | 1.665 | 1.951 | 15 | 41.99 | 6.29 | 149.407 | 44 | 0.280 | 37 | 0.818 | 69.550 | ||
| S | 102.352 | 1.156 | 1.689 | 3 | 41.78 | 4.53 | 1175.259 | 78 | 0.053 | 27 | 0.568 | 66.754 | ||
| X | X | X | X | X | X | X | X | ||
|---|---|---|---|---|---|---|---|---|---|
| S | 0.009 | 0.108 | 0.0313 | 0.8517 | S | 0 | 1 | 0 | 0 |
| S | 0 | 1 | 0 | 0 | S | 0 | 1 | 0 | 0 |
| S | 0.0076 | 0.688 | 0.1179 | 0.1866 | S | 0 | 1 | 0 | 0 |
| S | 0.0056 | 0.7856 | 0.0809 | 0.1279 | S | 0 | 1 | 0 | 0 |
| S | 0 | 1 | 0 | 0 | S | 0 | 0.5 | 0 | 0.5 |
| S | 0.0084 | 0.6555 | 0.1302 | 0.206 | S | 0 | 0.5 | 0 | 0.5 |
| S | 0.0167 | 0.3552 | 0.2432 | 0.3849 | S | 0.0136 | 0.9248 | 0.0185 | 0.0431 |
| S | 0.0028 | 0.9751 | 0.0122 | 0.0098 | Avg. | 0.0043 | 0.7661 | 0.0423 | 0.1873 |
| Ranking | Proxy Characteristic Town | ||||||||||||||
|---|---|---|---|---|---|---|---|---|---|---|---|---|---|---|---|
| S | S | S | S | S | S | S | S | S | S | S | S | S | S | S | |
| 1 | S | ● | S | ● | ● | S | S | S | ● | ● | ● | ● | ● | ● | ● |
| 2 | ❍ | S | ❍ | S | S | ❍ | S | ❍ | S | S | S | S | S | S | S |
| 3 | S | S | S | S | S | S | S | S | S | S | S | S | S | S | S |
| 4 | S | S | S | S | S | S | S | S | S | S | S | S | S | S | S |
| 5 | S | S | S | S | S | S | ❍ | S | S | S | S | S | S | S | S |
| 6 | S | S | S | S | S | S | S | S | S | S | S | S | S | S | S |
| 7 | S | S | S | S | S | S | S | S | S | S | S | S | S | S | S |
| 8 | S | S | S | S | S | S | S | S | S | S | S | S | S | S | S |
| 9 | S | S | S | S | S | S | S | S | S | S | S | S | S | S | S |
| 10 | S | S | S | S | S | S | S | S | S | S | S | S | S | S | S |
| 11 | S | S | S | S | S | S | S | S | S | S | S | S | S | S | S |
| 12 | S | S | S | S | S | S | S | S | S | S | S | S | S | S | S |
| 13 | S | S | S | S | S | S | S | S | S | S | S | S | S | S | S |
| 14 | S | S | S | S | S | S | S | S | S | S | S | S | S | S | S |
| 15 | S | S | S | S | S | S | S | S | S | S | S | S | S | S | S |
Disclaimer/Publisher’s Note: The statements, opinions and data contained in all publications are solely those of the individual author(s) and contributor(s) and not of MDPI and/or the editor(s). MDPI and/or the editor(s) disclaim responsibility for any injury to people or property resulting from any ideas, methods, instructions or products referred to in the content. |
© 2023 by the authors. Licensee MDPI, Basel, Switzerland. This article is an open access article distributed under the terms and conditions of the Creative Commons Attribution (CC BY) license (https://creativecommons.org/licenses/by/4.0/).
Share and Cite
Huang, S.; Yang, K.; Wang, P.; Yang, Q.; Li, L. A Comprehensive Evaluation on the Performances of China’s Information Technology Characteristic Towns Utilizing the Advantage-Oriented Competitive Evaluation (ACE) Method. Sustainability 2023, 15, 15220. https://doi.org/10.3390/su152115220
Huang S, Yang K, Wang P, Yang Q, Li L. A Comprehensive Evaluation on the Performances of China’s Information Technology Characteristic Towns Utilizing the Advantage-Oriented Competitive Evaluation (ACE) Method. Sustainability. 2023; 15(21):15220. https://doi.org/10.3390/su152115220
Chicago/Turabian StyleHuang, Shitong, Kai Yang, Ping Wang, Qing Yang, and Luyun Li. 2023. "A Comprehensive Evaluation on the Performances of China’s Information Technology Characteristic Towns Utilizing the Advantage-Oriented Competitive Evaluation (ACE) Method" Sustainability 15, no. 21: 15220. https://doi.org/10.3390/su152115220
APA StyleHuang, S., Yang, K., Wang, P., Yang, Q., & Li, L. (2023). A Comprehensive Evaluation on the Performances of China’s Information Technology Characteristic Towns Utilizing the Advantage-Oriented Competitive Evaluation (ACE) Method. Sustainability, 15(21), 15220. https://doi.org/10.3390/su152115220