1. Introduction
Ships, as the transport means with the largest single load and the most types of goods, have always played an important role in international transport. However, with the development of maritime transportation, ship transportation accidents occur occasionally, which seriously limit the sustainable development of the ship transportation industry [
1,
2]. Ship fires are the biggest safety issue in the shipping industry. According to data from the International Maritime Organization (2019), in the reported 1400 accidents from 2000 to 2017, 270 were related to fires and explosions, accounting for 19.2% of reported accidents. Engine room fires account for over 75% of all ship fires [
3]. Toxic smoke and high temperatures are the main hazards in fire accidents. This study on smoke dispersion and temperature distribution in ship engine room fires can provide a theoretical reference for accident prevention and emergency rescue, and it is beneficial for the sustainable development of the maritime transportation industry.
The problem of fire in the engine room of ships has been an important topic of great concern to researchers at home and abroad. With the advancement of ship development, the risk factors leading to ship fires increase daily. As the core component of a ship, the engine room has a crucial position in the whole ship hull [
4]. A fire in the cabin is usually extremely serious and difficult to extinguish, causing incalculable damage [
5,
6]. In a 2018 study, Til Baalisampang systematically analyzed accidents in the maritime industry that occurred between 1990 and 2015, revealing that ship engine room fire accidents are often the result of a combination of complex factors [
7,
8]. The problem of fires in the engine rooms of ships needs further in-depth study.
This paper aims to adopt the fire dynamics solver buoyantReactingFOAM in the software OpenFOAM-10 to conduct numerical studies on a ship engine room fire. The following sections of this paper are structured as follows:
Section 2 is a literature review and mainly introduces the previous studies with numerical simulations of ship engine rooms and gives the main contributions of this paper directly.
Section 3 mainly introduces the theory of the fire dynamics simulation based on buoyantReactingFOAM and the whole process of the simulation.
Section 4 validates the applicability of buoyantReactingFOAM in simulating a ship-engine-room-scale fire by comparing it with the experimental data of a room fire with a similar scale as the ship engine room fire.
Section 5 introduces the simulation settings of the ship engine room fire in this paper.
Section 6 analyzes the smoke dispersion and temperature distribution of the ship engine room fire and its influence factors.
Section 7 gives the main conclusion of this paper.
2. Literature Review
At present, the studies on ship engine room fires mainly include two aspects: the experimental study and the numerical study. In terms of the earlier experimental research on ship engine room fires, James McNay [
9] reviewed accident investigation recommendations, fire safety techniques, and the research literature and established that the effect of mechanical ventilation in the cabin on smoke dispersion and temperature distribution is designed to address the systemic causes of fires, promising more cost-effective safety measures. Wu et al. [
10] researched mass burning rates and flue gas temperatures under mechanical vents by conducting large-scale experiments on a nacelle platform. Wang [
11] observed through experimental studies that the temperature rise distribution of closed ship cabin fires is different from that of open fires, and the experimental results showed that the vertical temperature gradient is smaller. Simultaneously, due to the relatively poor ventilation conditions in a ship’s engine room, the oxygen consumption of multiple power machines usually leads to a low oxygen content. The initial oxygen concentration will affect the development mechanism of an engine room fire. Wang [
12] conducted experiments by constructing a reduced model to reveal that the reduction in the initial oxygen concentration in an engine room fire leads to an increase in the residual fuel, and at the same time increases the extended extinguishing time. In 2021, Wang [
13] verified through experimental studies that a low-pressure water mist containing a 20 percent mass fraction of potassium chloride at a pressure of 0.6 MPa was the most effective in suppressing heptane pool fires, and a nonlinear flame extinguishing time expression was developed based on the mass loss rate, potassium chloride concentration, and injection pressure.
For the complex process of fire accidents in the engine room of ships, the research methodology of experimental studies has significant advantages in simulating real fire scenarios, and its controllability and realism can provide researchers with the opportunity to directly observe and quantify fire phenomena. However, even though experimental research can provide valuable data and information, its application is relatively rare, mainly due to several constraints. High cost, complexity, and risk factors have limited the widespread use of experimental research, resulting in relatively few experimental studies in the fire field. In contrast, numerical simulation studies show obvious superiority. Numerical simulation overcomes many of the constraints of experimental research, such as cost and hazard, while providing greater flexibility and control. This enables researchers to simulate fire scenarios under different conditions in a virtual environment to investigate fire evolution mechanisms and properties. In recent years, numerical simulation studies have made significant progress in the field of ship cabin fires, concentrating on analyses using a variety of tools and methods. These numerical simulation studies have focused on key processes, such as fire propagation, heat transfer, and gas diffusion, thus providing an important basis for fire prevention and control.
Many researchers have conducted numerical simulation studies on ship engine room fires from different views. Lech Murawski, et al. [
14] carried out a modeling study of the thermal conductivity of the nacelle and fuselage in a ship’s nacelle fire and derived the existence of a special threshold temperature in the fire. Meanwhile, Zhou et al. [
15] analyzed the current status and outlook of the application of various fire numerical simulation techniques by reviewing the research progress of fire safety risk assessment models and other means for the study of temperature distribution, smoke flow, and other characteristics of cabin fires under different conditions. He [
16] investigated the fire-induced gas flow in ceiling-ventilated compartments based on the FDS procedure and found that, regardless of the boundary resistance, the airflow from the ceiling vents was controlled by the fire plume, creating a distinct circulation in the cubicle that was fundamentally different from that of the doorway airflow. Yang et al. [
17,
18,
19,
20] made use of tools such as OpenFOAM and FDS to simulate combustion environments and address fires faced in pools, such as natural gas pools, hydrogen pools, and petrol pools, as well as in nacelles fueled by ammonia and liquefied natural gas with large variances. Li [
21] combined expert comprehensive assessment and fuzzy fault tree analysis methods; this study proposed a risk assessment method for ship power systems in the case of an engine room fire, exploring the system failure probability and the importance of basic events, and established a fire safety risk assessment model, and the results emphasized the high fire risk of the main engine fuel system, as well as the fuel leakage from the diesel supply tanks and the heavy fuel tanks, as the main risk source.
From the ship compartment as a whole to the local area, using the FDS program to process the data, etc., is a common approach for the numerical analysis of ship fires. In the paper published by Huang in 2020 [
22], the Fire Dynamics Simulator (FDS) was adopted to simulate the process of fire in a general interior under various fire scenarios, and the shading decreased with the distance from the fire source at a height of 3.0 m above the fire source in the early stage of the fire. Jiang [
23] performed a numerical simulation of a cruise ship cabin employing FDS-6 fire simulation software. The carbon monoxide concentration, temperature change, and smoke diffusion distribution of the fire when the fire source is set in the cabin and the detector is installed in different positions in the corridor from the fire source were studied, which provides a theoretical basis for the effective control of fire spread and the evacuation of people. The results provide basic simulation parameters for the initial stage of a fire, and this study provides strong support to further deepen our understanding of the problem of fire in the engine rooms of ships.
Since the interior of the cabin is a confined space when a cabin fire occurs, Xie et al. [
24] used a combination of numerical analyses and modeling experiments to validate the accuracy of a Computational Fluid Dynamics (CFD) model for the diffusion of light gases in an indoor thermal environment. The model was then applied to simulate smoke and hazardous gas diffusion from a pool fire combustion process in a full-size ship cabin. Xie [
25] also modeled, calculated, and comprehensively analyzed the effects of various factors, such as leakage volume, cabin temperature, ventilation conditions, and leakage location, on the distribution of harmful gas concentrations. Xie’s study laid the foundation for an accurate spatio-temporal gas diffusion concentration distribution modeling methodology in a cabin environment. Combined with the diffusion concentration distribution, Wang et al. [
26] computationally simulated the fire and smoke plume evolution in ventilated compartments under different air curtain jet velocities, revealing the conclusion that with an increase in the air curtain jet velocity, the internal temperature slightly increases and the high-temperature zone expands, while the internal temperature tends to become uniform. Su et al. [
27] numerically calculated and characterized three low-roof cabin fires using large eddy numerical simulation to derive the external combustion phenomenon of fire development by analyzing the temperature, smoke velocity, and heat flow density. It was revealed that during external combustion, fuel escape decreases with an increase in roof height, while the temperature above the windows increases with an increase in roof height. This greatly increases the difficulty of escape and search and rescue.
The interaction between fire simulation and ship structural analysis is considered assuming that all other parameters remain constant. Woo [
28] adopted numerical and experimental validation of the two-way fluid-solid coupling (FSI) method for predicting the nonlinear structural response of H-beams to propane burner fires, showed that the two-way FSI method can accurately predict the nonlinear structural response of H-beams to propane burner fires, and suggested appropriate time increments for two-way FSI analyses. Wang [
29] further examined the smoke plume entrainment and filling behavior in closed ship cabin fires, proposed a corresponding theoretical model, applied the particle swarm optimization coupled smoke filling model for inverse analysis, and established a sealed cabin fire model suitable for engineering safety design from a practical point of view. Lan [
30] conducted a full-scale numerical survey of ship cabin fires using a fire dynamics simulator, and the results showed that higher ventilation speeds are conducive to the rapid cooling of ship cabins. All the above studies investigated the effect of vent layout and wind speed on flame behavior, smoke stratification, and dispersion. Wang [
31] simulated a fire in the cabin of a ship through FDS, extracted the time-varying temperature field information, used it as an input variable into the ANSYS structural mechanical behavior simulator to carry out the thermo-mechanical coupling calculations, and probed into the mechanical response characteristics of the cabin structure under different fire locations; the results showed that the structural stress distribution was not uniform under the different fire locations, and the maximum temperature stress was 76 MPa at the height of the fire source of 2 m. Cylindrical obstacles such as weighing columns can lead to collapse and fire spread after burning. Numerical analyses allow us to obtain the temperature changes in different materials during combustion and to understand their effects on the outside world [
32,
33,
34,
35]. The importance of avoiding potential human injury and property damage from cabin fires is significant, and it follows that the realization of unmanned improvements to the intricate duct wiring in the nacelle [
36] and an optimized engine structure [
37,
38,
39] can also minimize the risk of human casualties. In summary, conducting numerical analyses combined with systematic tools provides in-depth analyses of the cabin fire problem, examining the factors of fire spread, temperature distribution, and hazardous gas diffusion from different perspectives, and providing new insights and guidance for research and practice in the field of ship safety.
To sum up, many researchers have used numerical simulation methods to study ship engine room fires, mainly focusing on the following three aspects: (a) combining fire numerical simulation methods with risk assessment methods to evaluate the risk of ship engine room fires; (b) using numerical simulation methods to study the temperature distribution and smoke dispersion after a fire occurs in the engine room, as well as the influence of various facilities in the engine room on the distribution patterns of smoke and temperature; (c) analyzing the interaction between fire and a ship’s structure using numerical methods combined with structural simulation methods. In addition, in terms of simulation tools, previous researchers have mostly used FDS for simulation research on cabin fires.
In recent years, OpenFOAM has been more and more frequently applied in the numerical study of fires. It provides a new tool for the fire simulation study, but the OpenFOAM-10 software has most often been used for relatively small-scale fires, and its applicability in simulating the ship-engine-room-scale fire needs to be further verified. In addition, the previous studies on fire in the ship engine room paid less attention to the smoke dispersion and the temperature distribution in the control room and near the escape exit.
Based on the above descriptions, this paper aims to use the fire dynamic solver buoyantReactingFOAM in the OpenFOAM framework to study the smoke dispersion and temperature distribution in ship engine room fires, with a focus on the control room and the escape exit. The main contributions of this paper are as follows: (a) The applicability of the fire dynamics solver buoyantReactingFOAM in simulating ship-engine-room-scale fires is validated by comparing with the experimental data. (b) The smoke dispersion and temperature distribution characteristics in space and time in a ship engine room fire caused by fuel oil leakage are studied in a case study based on buoyantReactingFOAM. (c) The impact of the mechanical ventilation, fire area, and fire position on the smoke dispersion and the temperature distribution in the ship engine room during the fire are considered in the numerical case study, with a focus on the control room and the escape exit.
4. Validation of buoyantReactingFOAM in Simulating a Ship-Engine-Room-Scale Fire
OpenFOAM is typically applied to the simulation of small-scale fires; therefore, its applicability in simulating ship-scale fires needs to be verified. In this section, a room fire experiment that has the same scale as the ship engine fire is selected to validate the applicability of buoyantReactingFOAM. The validation is conducted by using buoyantReactingFOAM to reproduce the firing process and comparing the simulation result with experimental data. The experiment was performed by Li, Ying Zhen, and Tommy Hertzberg in 2014 [
40,
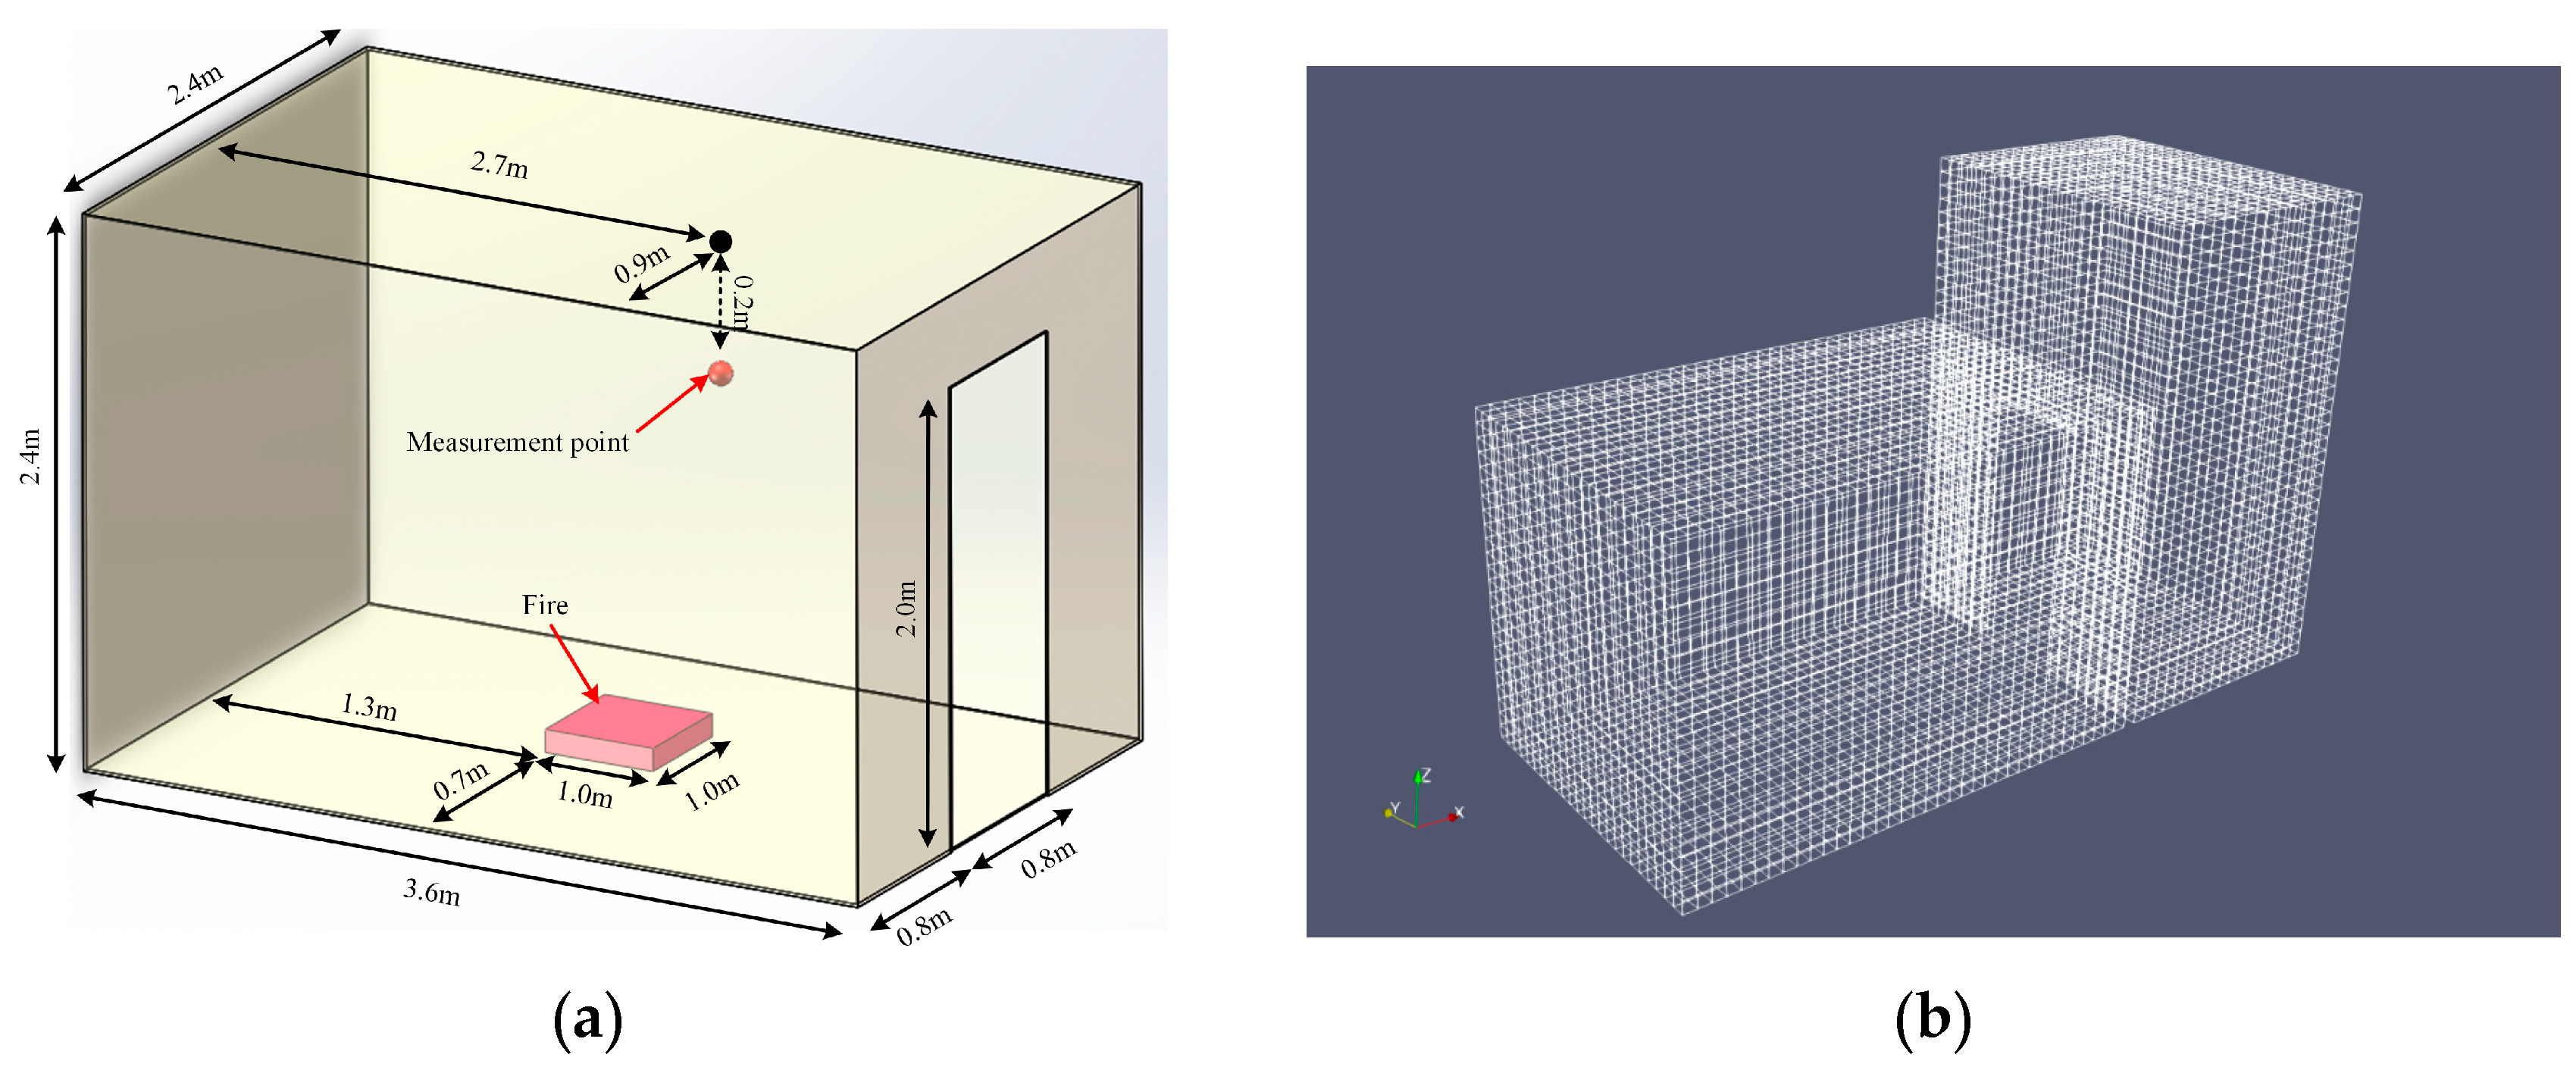
41]. The room is a cubic structure, and its geometric schematic diagram and the measurement point position are shown in
Figure 1a. According to the geometric data of the room, the OpenFOAM mesh was created as shown in
Figure 1b. It should be noted that there is an additional section in the OpenFOAM mesh compared to the original room; its purpose is to show the smoke and the temperature near but out of the door in the simulation.
A pool fire is located in the center of the house, with a fire source size of 1 m × 1 m, and the fuel is propane(C
3H
8). The concentration of the propane is set as 60%. The velocity of the propane is set as 0.01 m/s. The combustion reaction of the propane in the simulation is shown as follows:
The initial temperature is set as 300 K, which is 26.85 °C, close to room temperature. In the initial state, the gas component is set as air in the whole computational domain. For the velocity boundary conditions, the fire area uses the “fixedValue” boundary whose value is set as 0.01 m/s, the ground uses the “noSlip” boundary, and the other boundaries use the “pressureInletOutletVelocity” boundary. For the pressure boundary conditions, they all use the “calculated” boundary. For the temperature boundary conditions, the fire area uses the “fixedValue” boundary, whose value is set as 300 K, the ground uses the “zeroGradient” boundary, and the other boundaries use the “inletOutlet” boundary. For the C3H8 boundaries, the fire area uses the “fixedValue” boundary, whose value is set as 0.6, the ground uses the “zeroGradient” boundary, and the other boundaries use the “inletOutlet” boundary. For the O2 boundaries, the fire area uses the “fixedValue” boundary, whose value is set as 0, the ground uses the “zeroGradient” boundary, and the other boundaries use the “inletOutlet” boundary. For the N2 boundaries, all the boundaries use the “calculated” boundary.
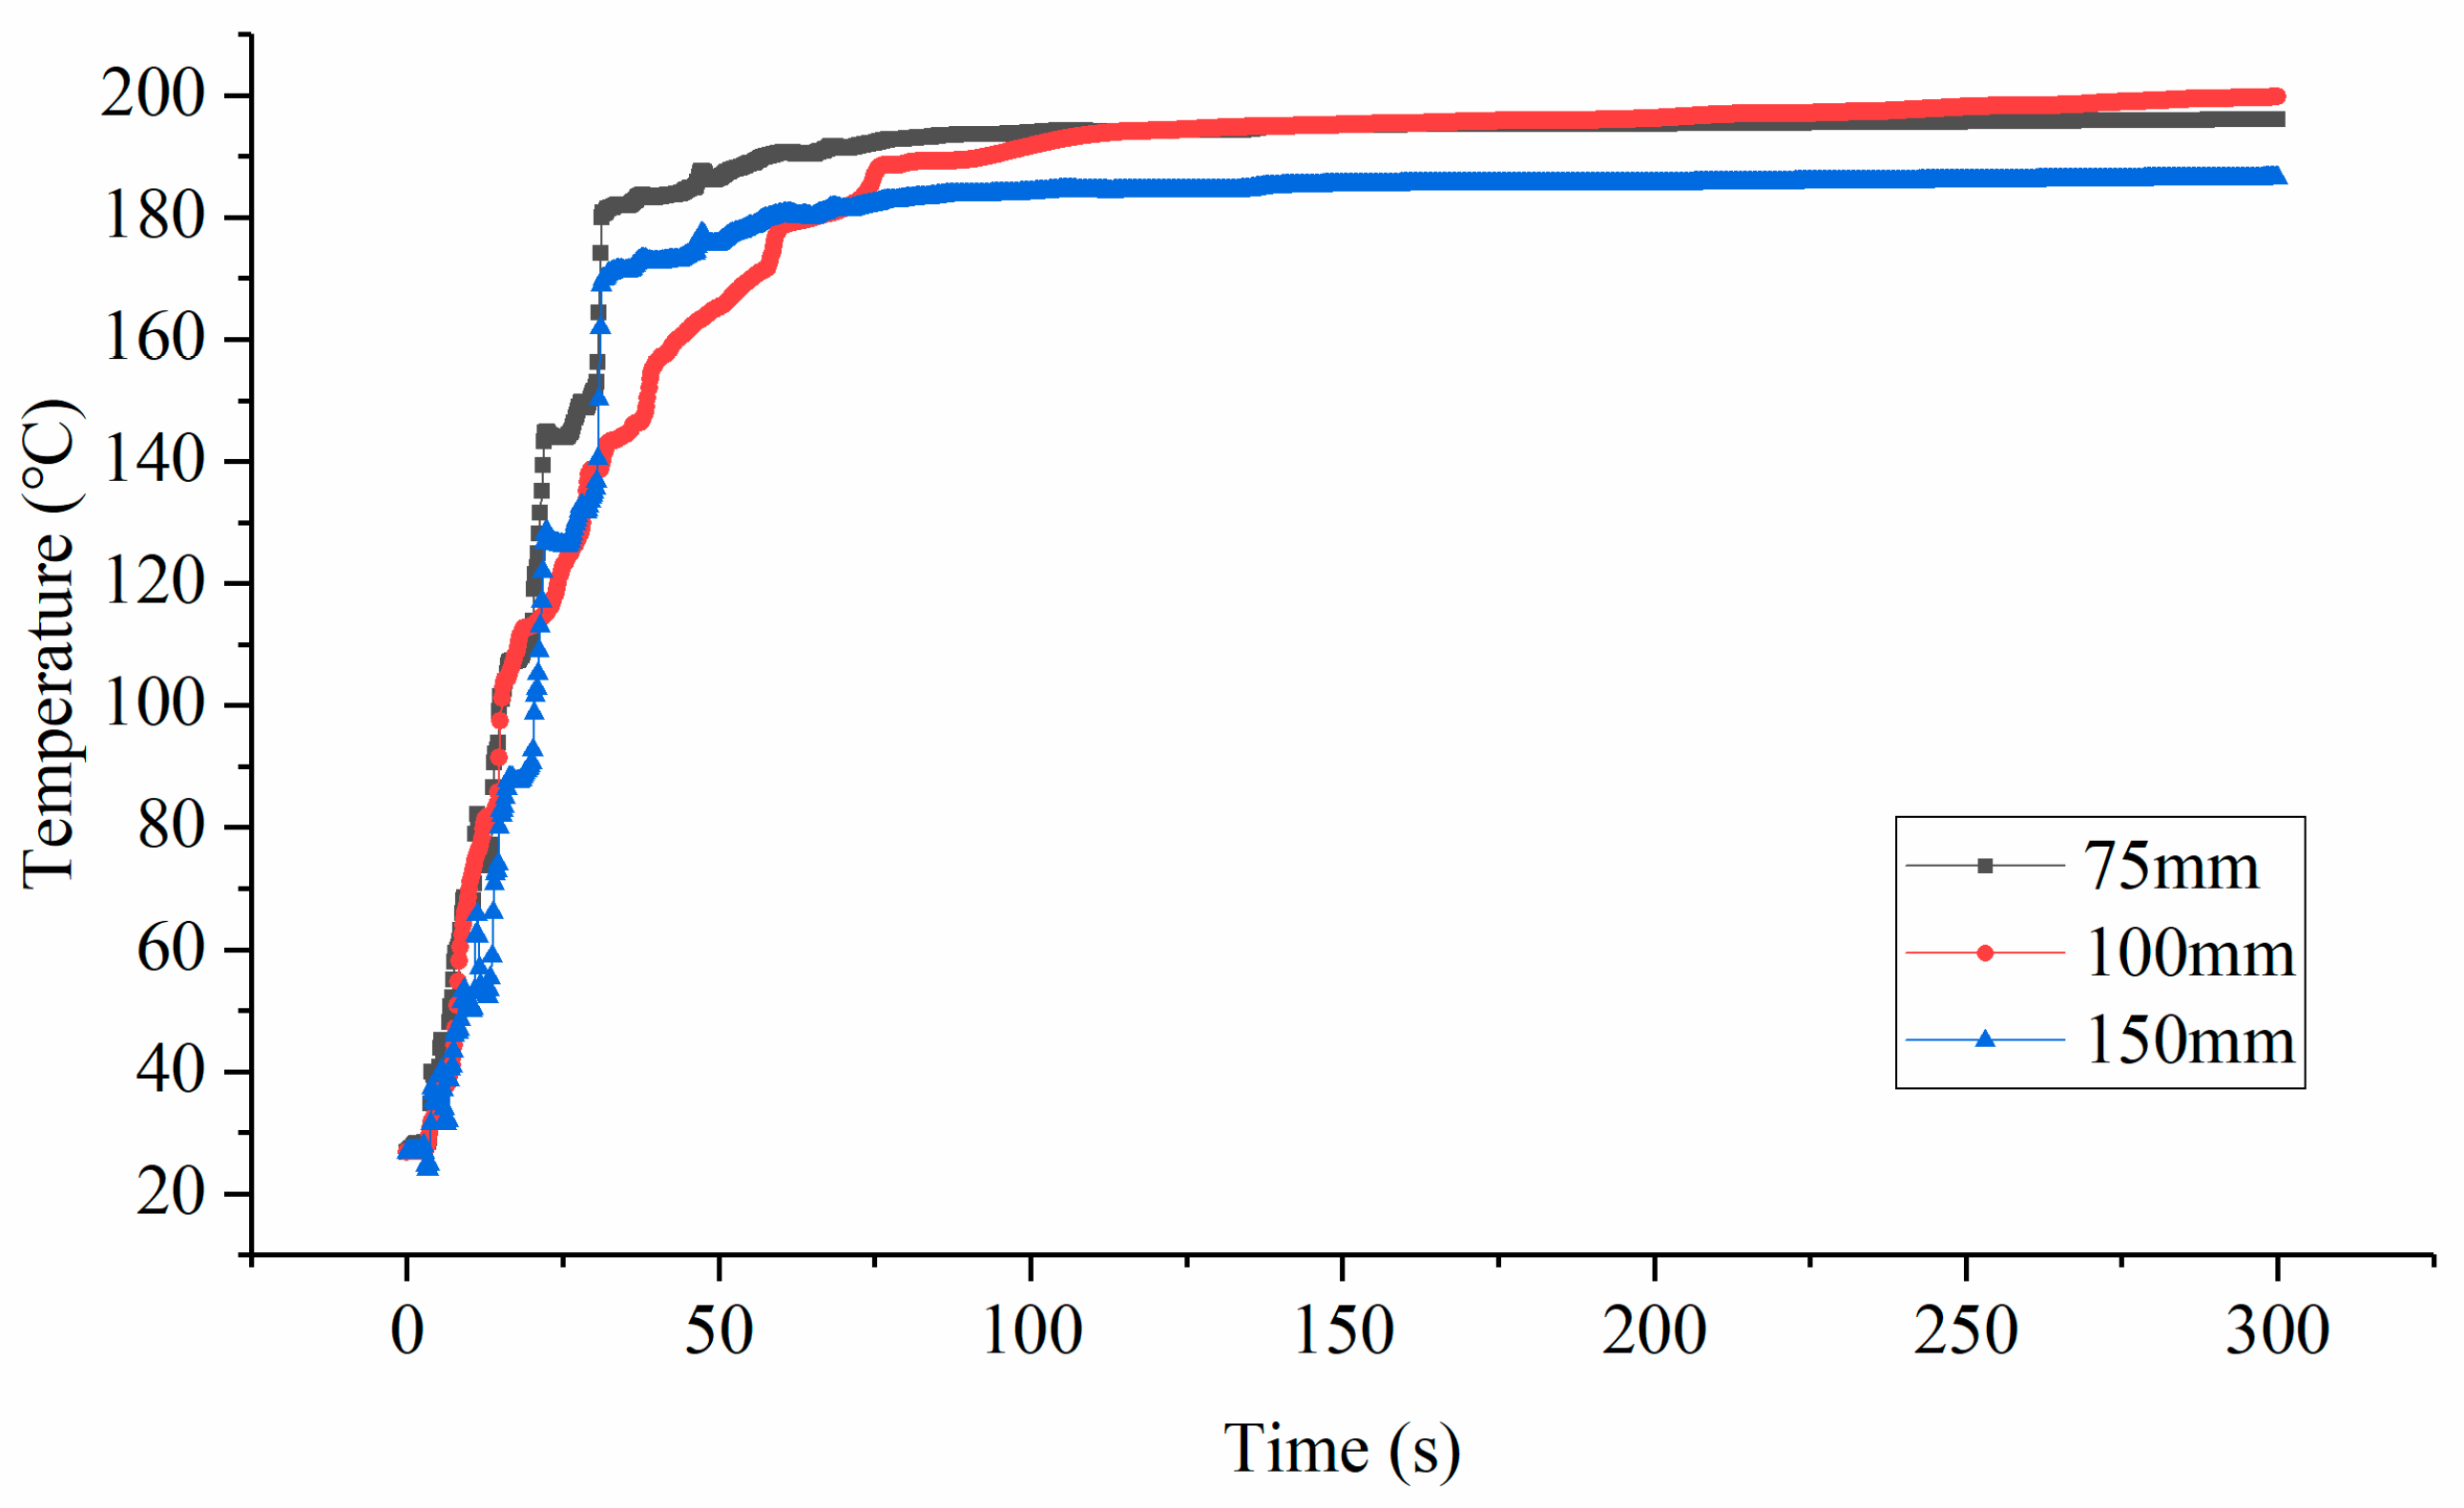
This validation simulation conducted a fire simulation experiment for a total of 300 s, with a time step of 0.1 s. To avoid errors from the mesh resolution, a mesh sensitivity analysis is conducted. Three kinds of mesh resolutions, 75 mm, 100 mm, and 150 mm, are analyzed in the simulation. The simulated temperature curves of the measurement point under the three kinds of mesh resolution are shown in
Figure 2. It can be seen that the mesh resolutions of 75 mm and 100 mm obtained close temperature curves in the simulation, while the mesh resolution of 150 mm had a little more difference from the others. To simultaneously ensure mesh independence and save computational resources, the mesh resolution of 100 mm was selected in the following simulation.
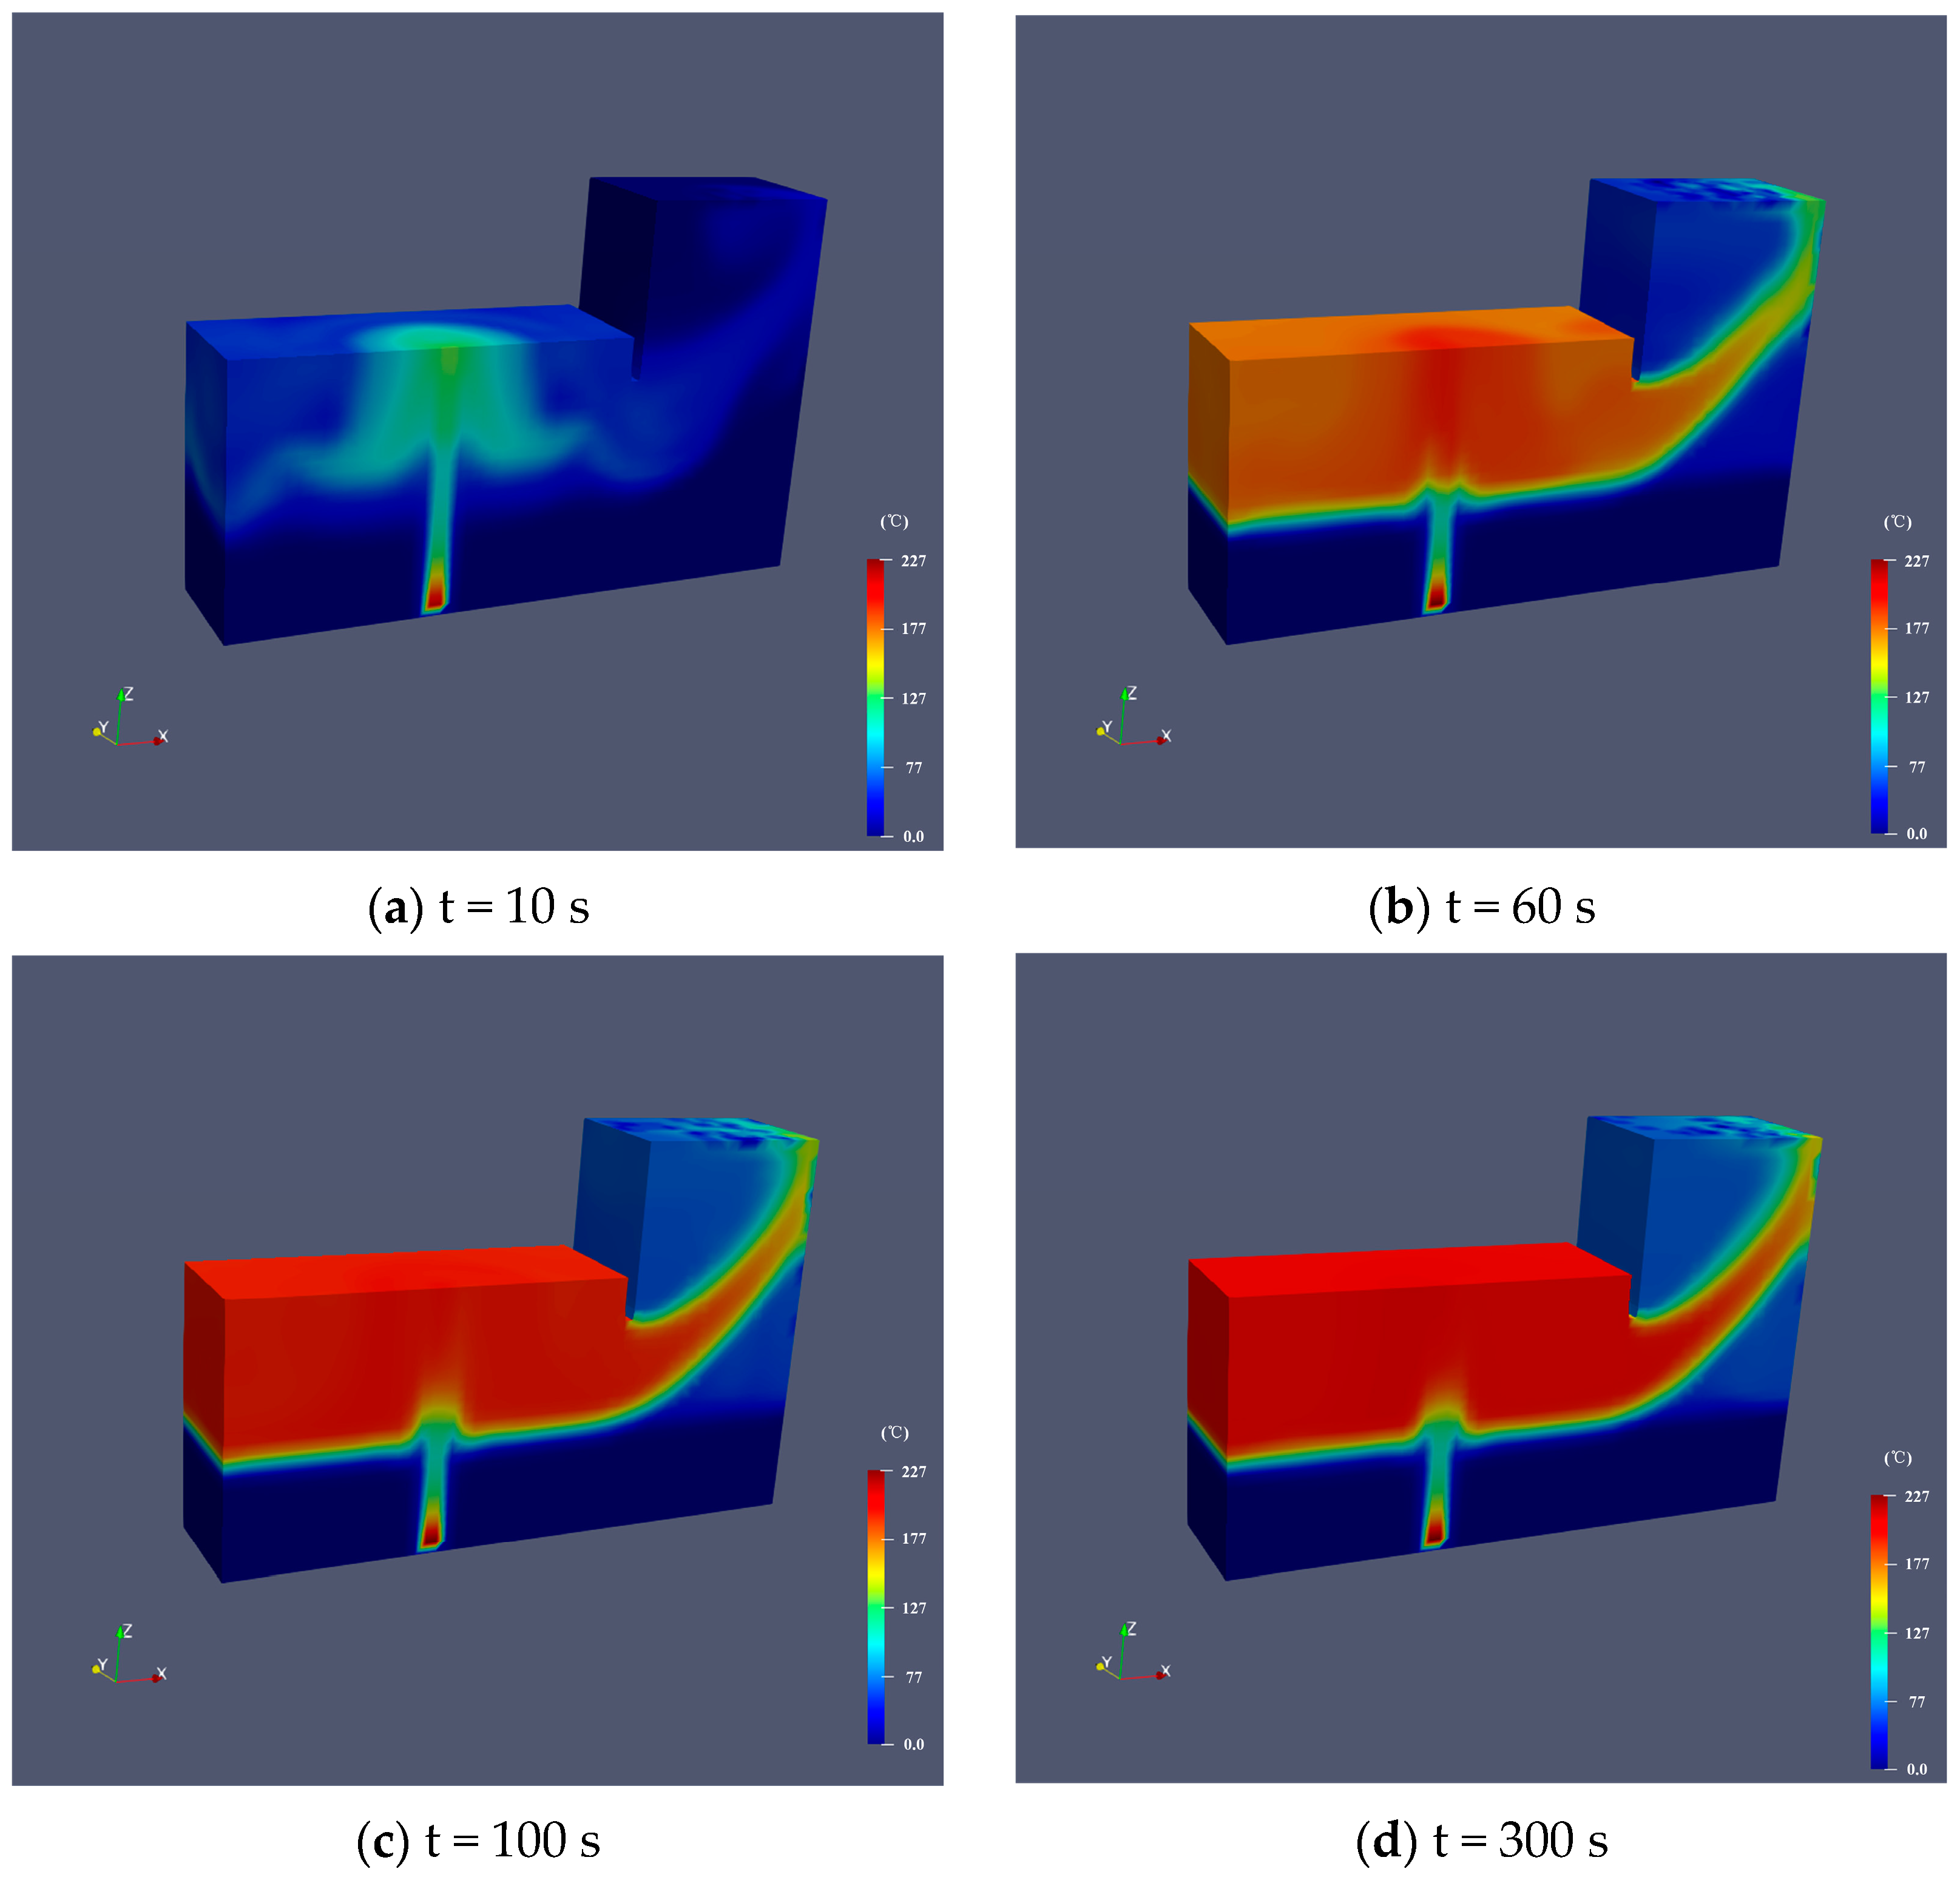
The simulated temperature distributions in the room at different times are shown in
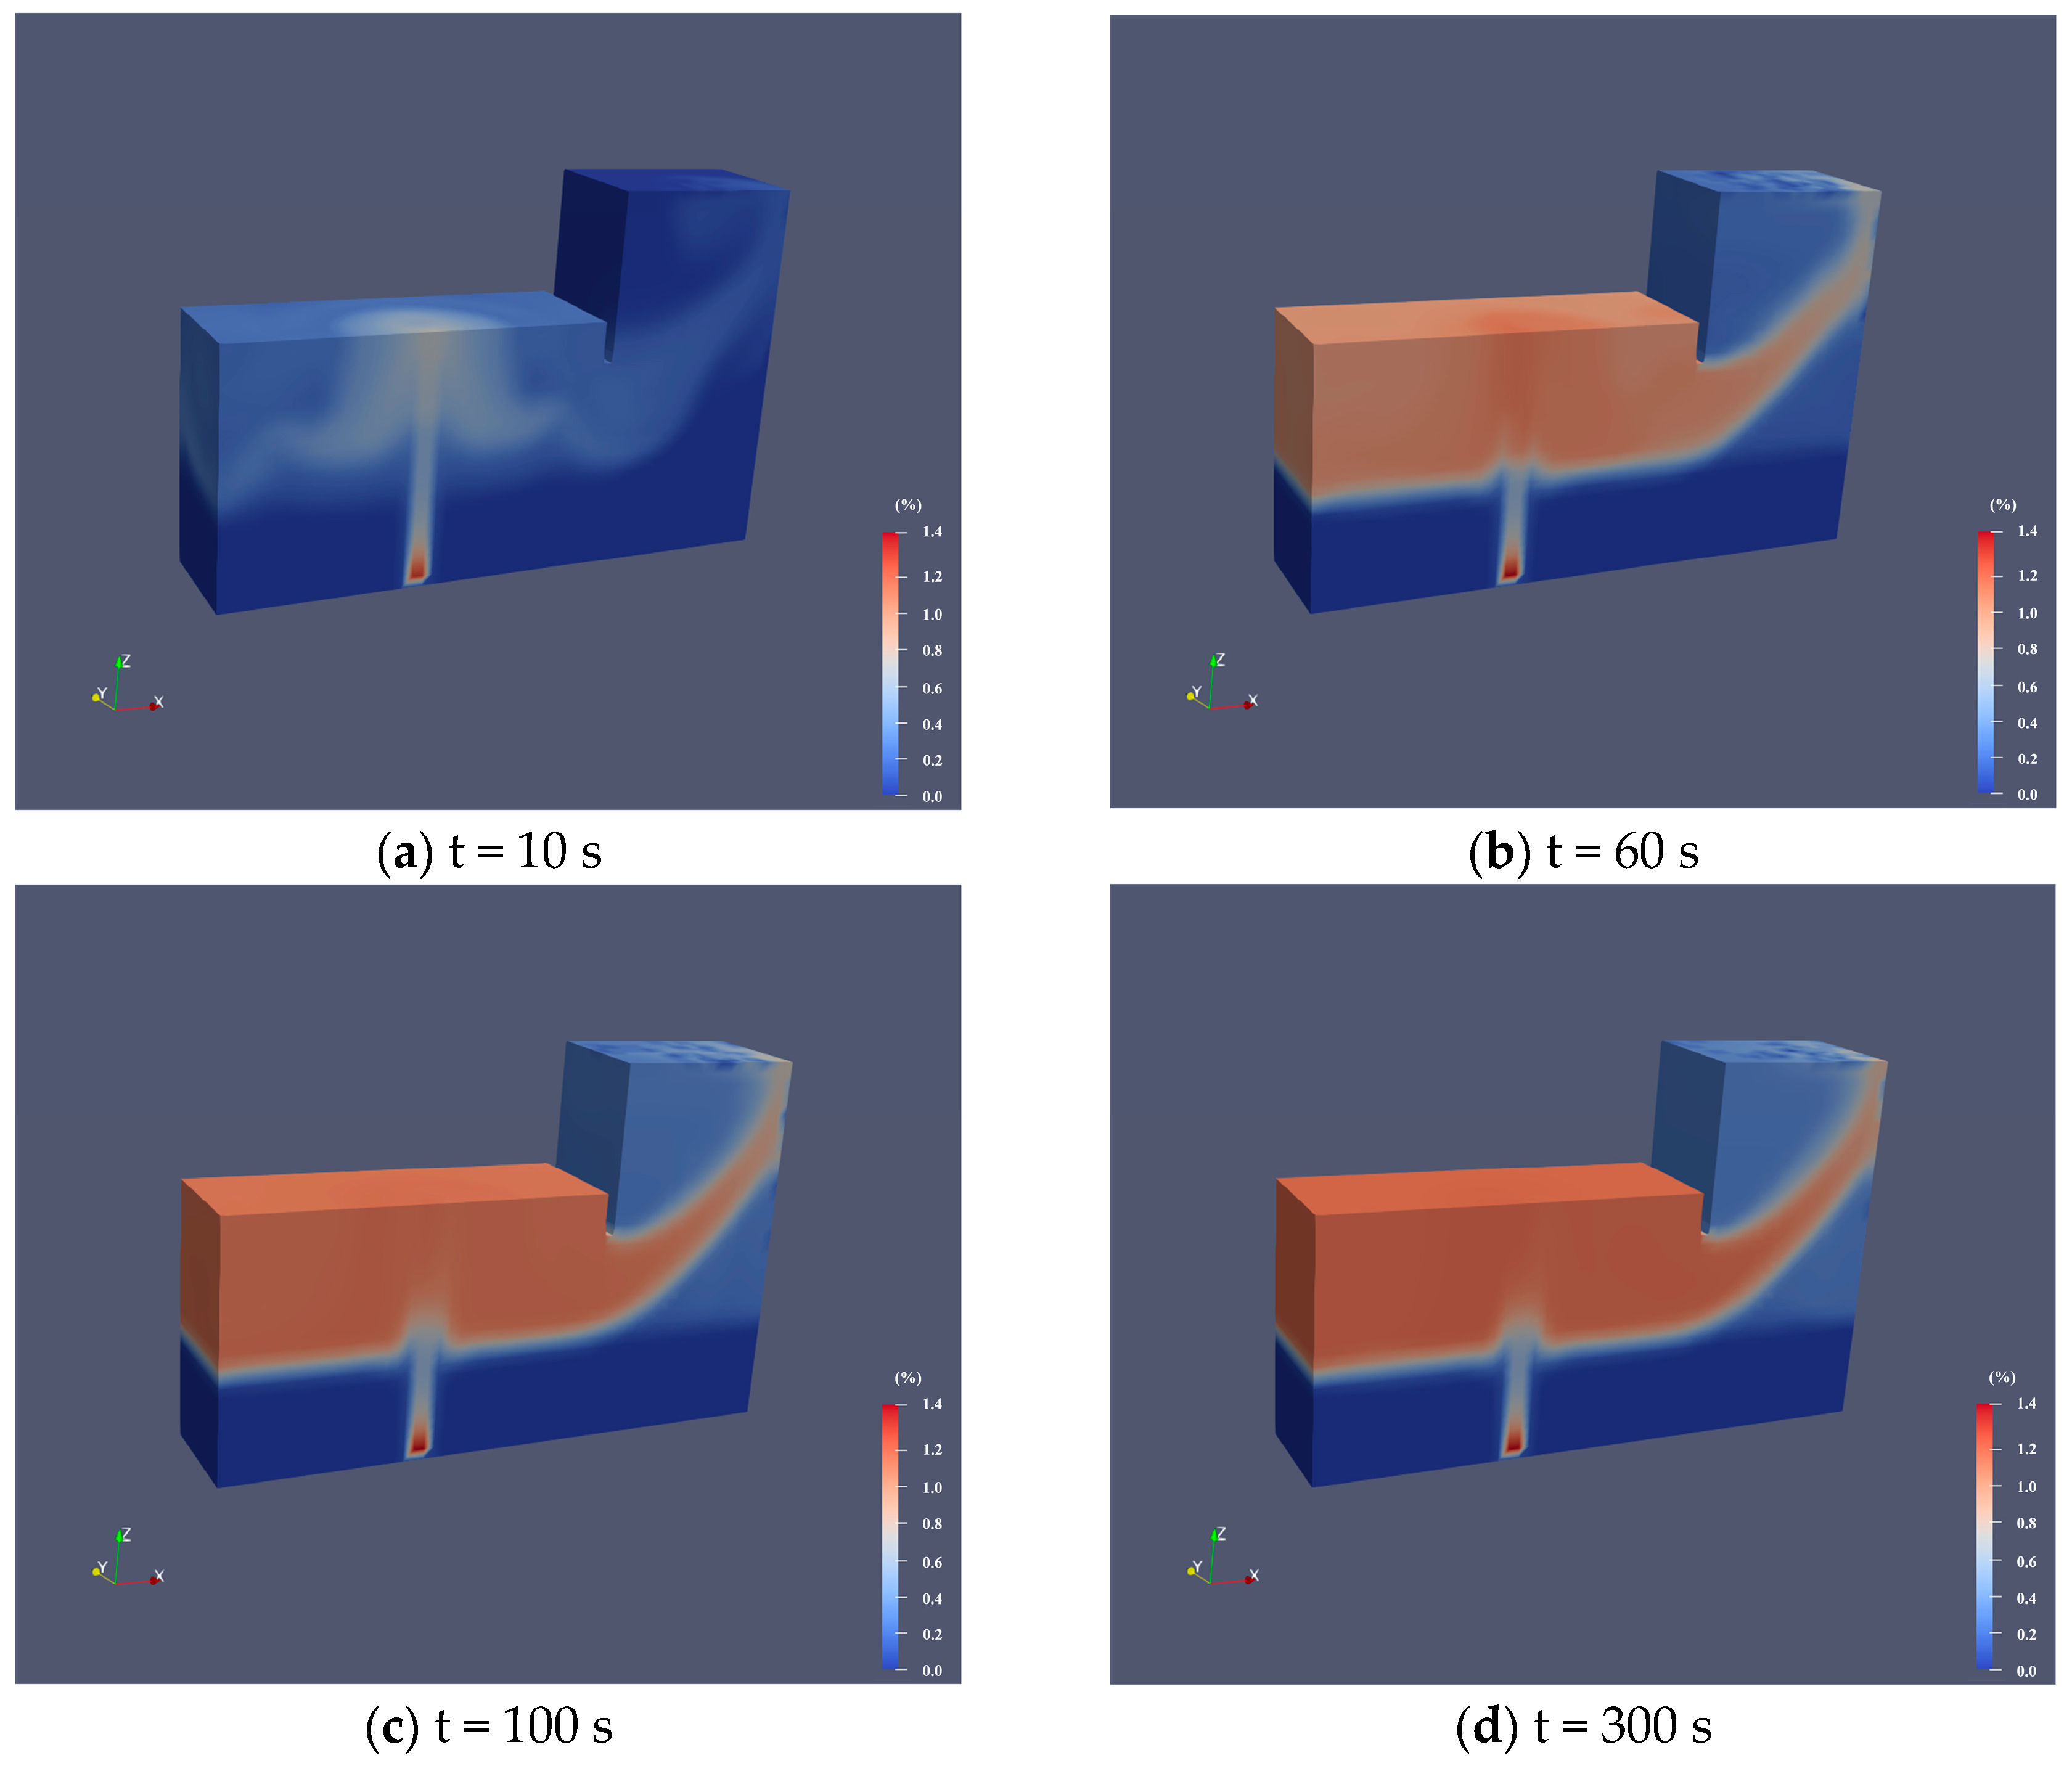
Figure 3. It can be seen that the flames quickly raise the temperature of the top of the room after ignition, and the high-temperature region expands over time from the top to the bottom of the room. The high-temperature air flows out of the room through the door and it also makes the high-temperature region stop expanding with time. The concentration distributions of carbon dioxide at different times are shown in
Figure 4. It can be seen that the concentration distributions of carbon dioxide share similar characteristics with the temperature distributions.
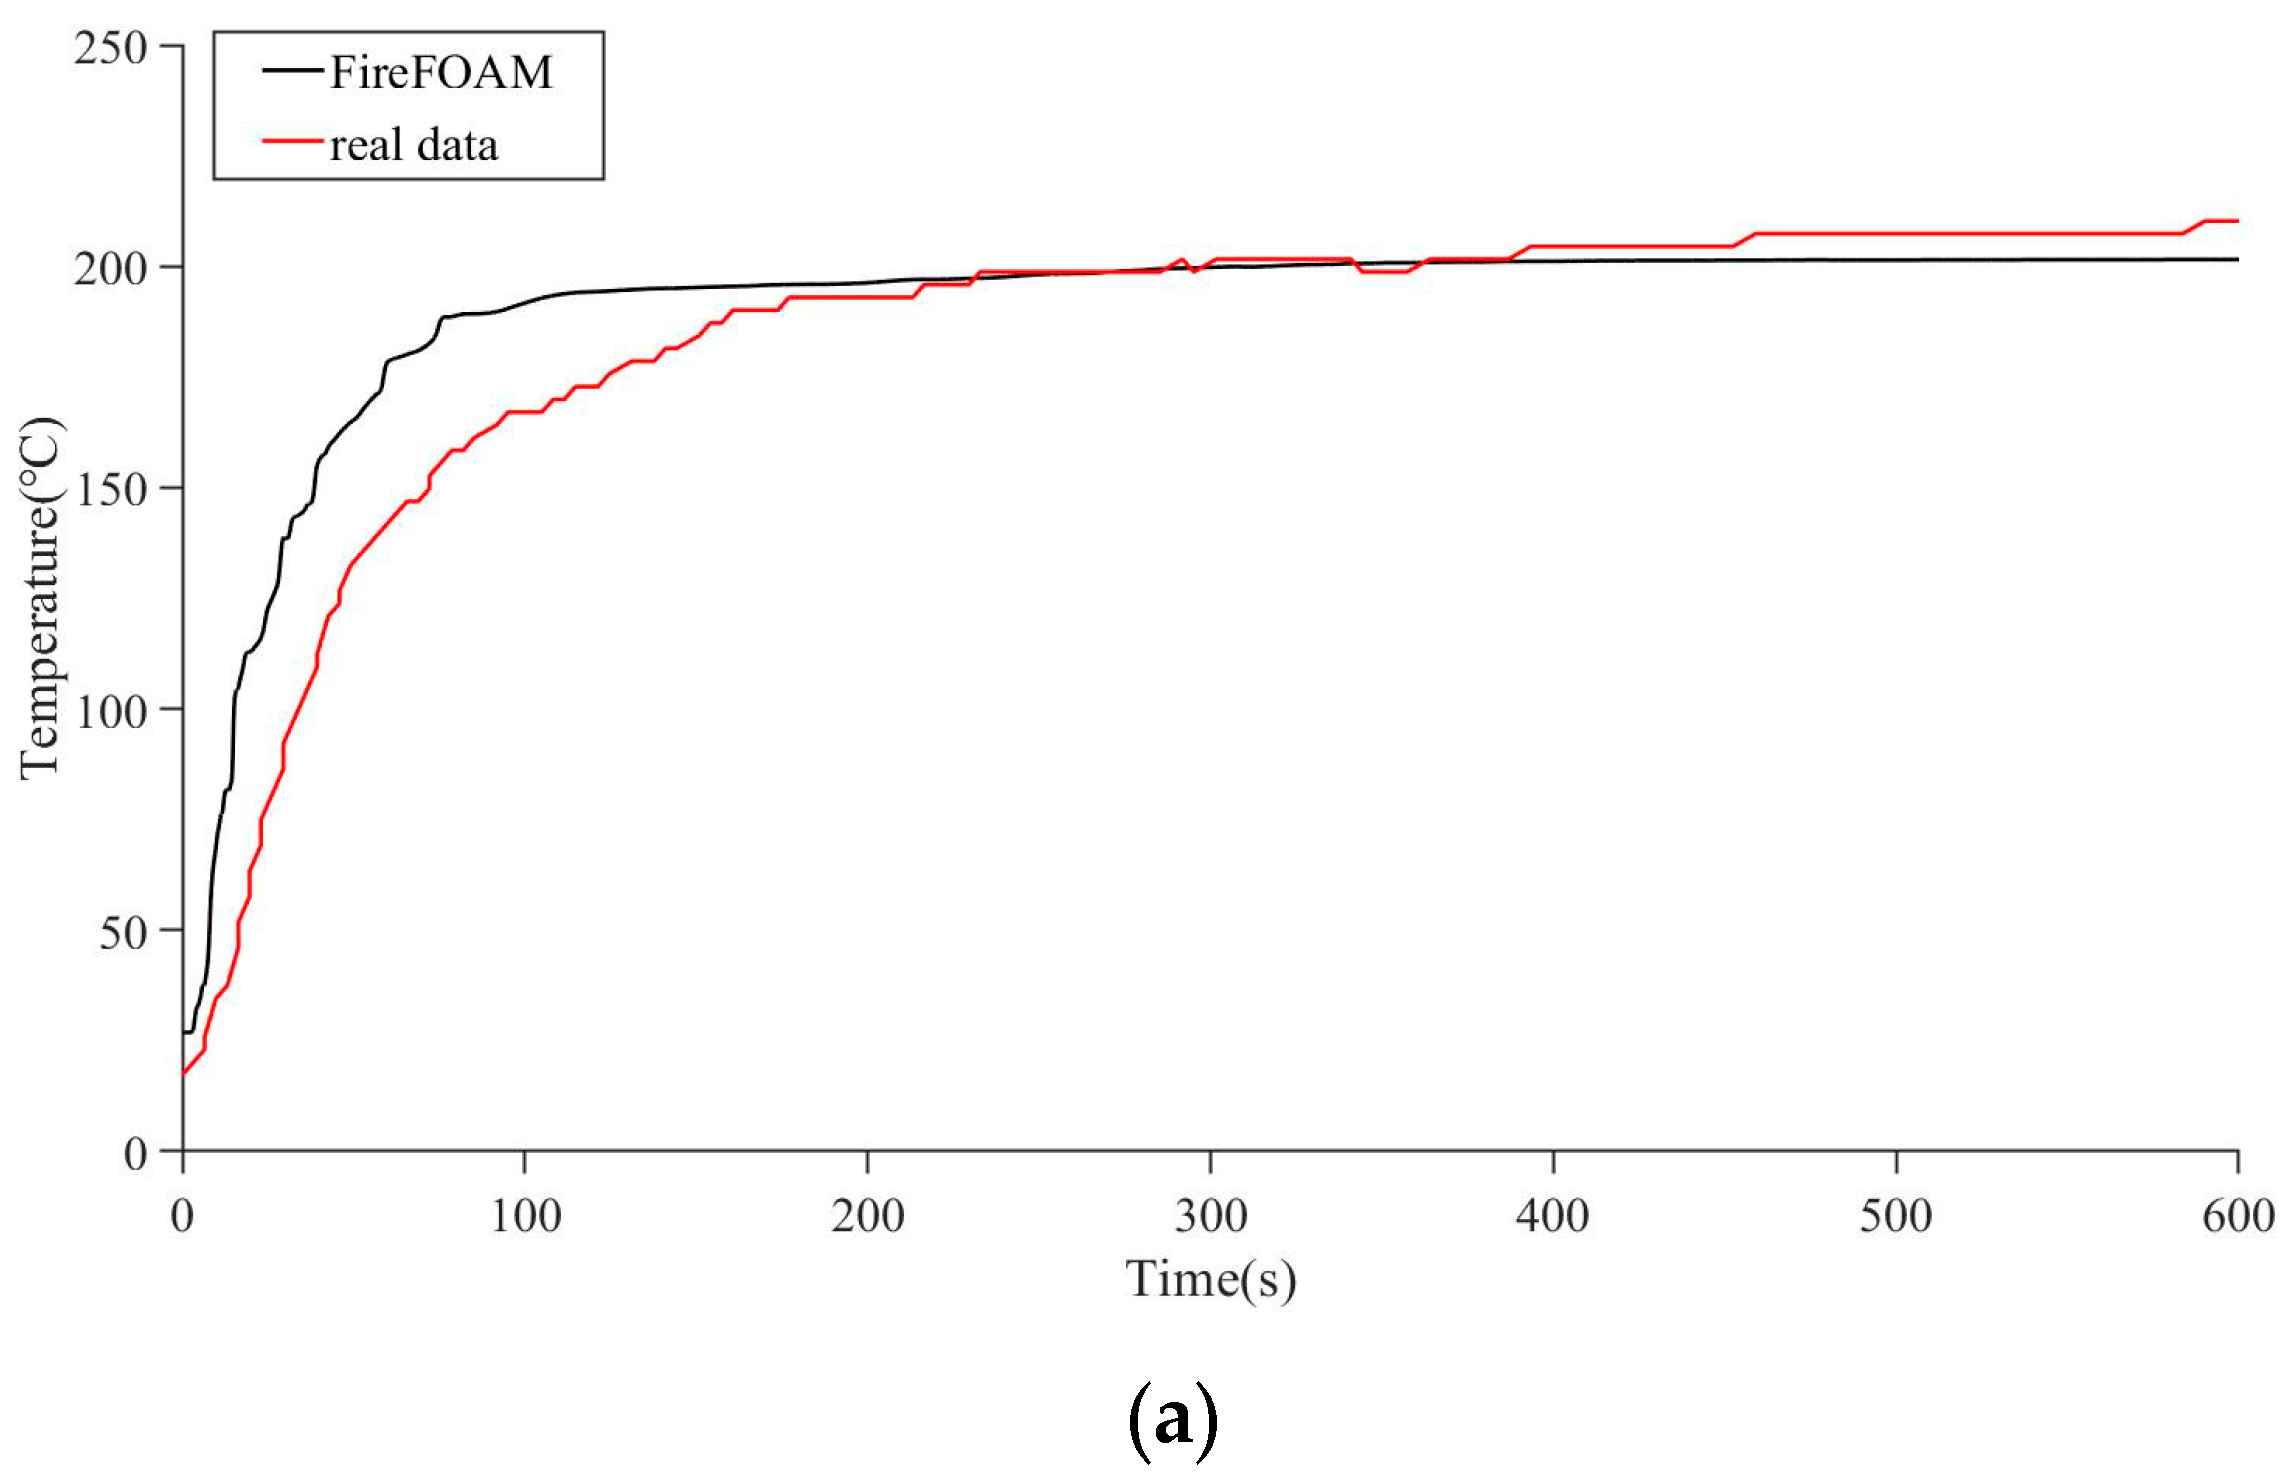
The simulated and measured temperature curves of the measurement point in the room are shown in
Figure 5a. It can be seen that both the simulated and measured temperature curves show that the temperature at the measurement point increases quickly to 140 °C in the first minute, and the increasing rate slows after the first minute; after 200 s, the temperature at the measurement point stabilizes at 200 °C.
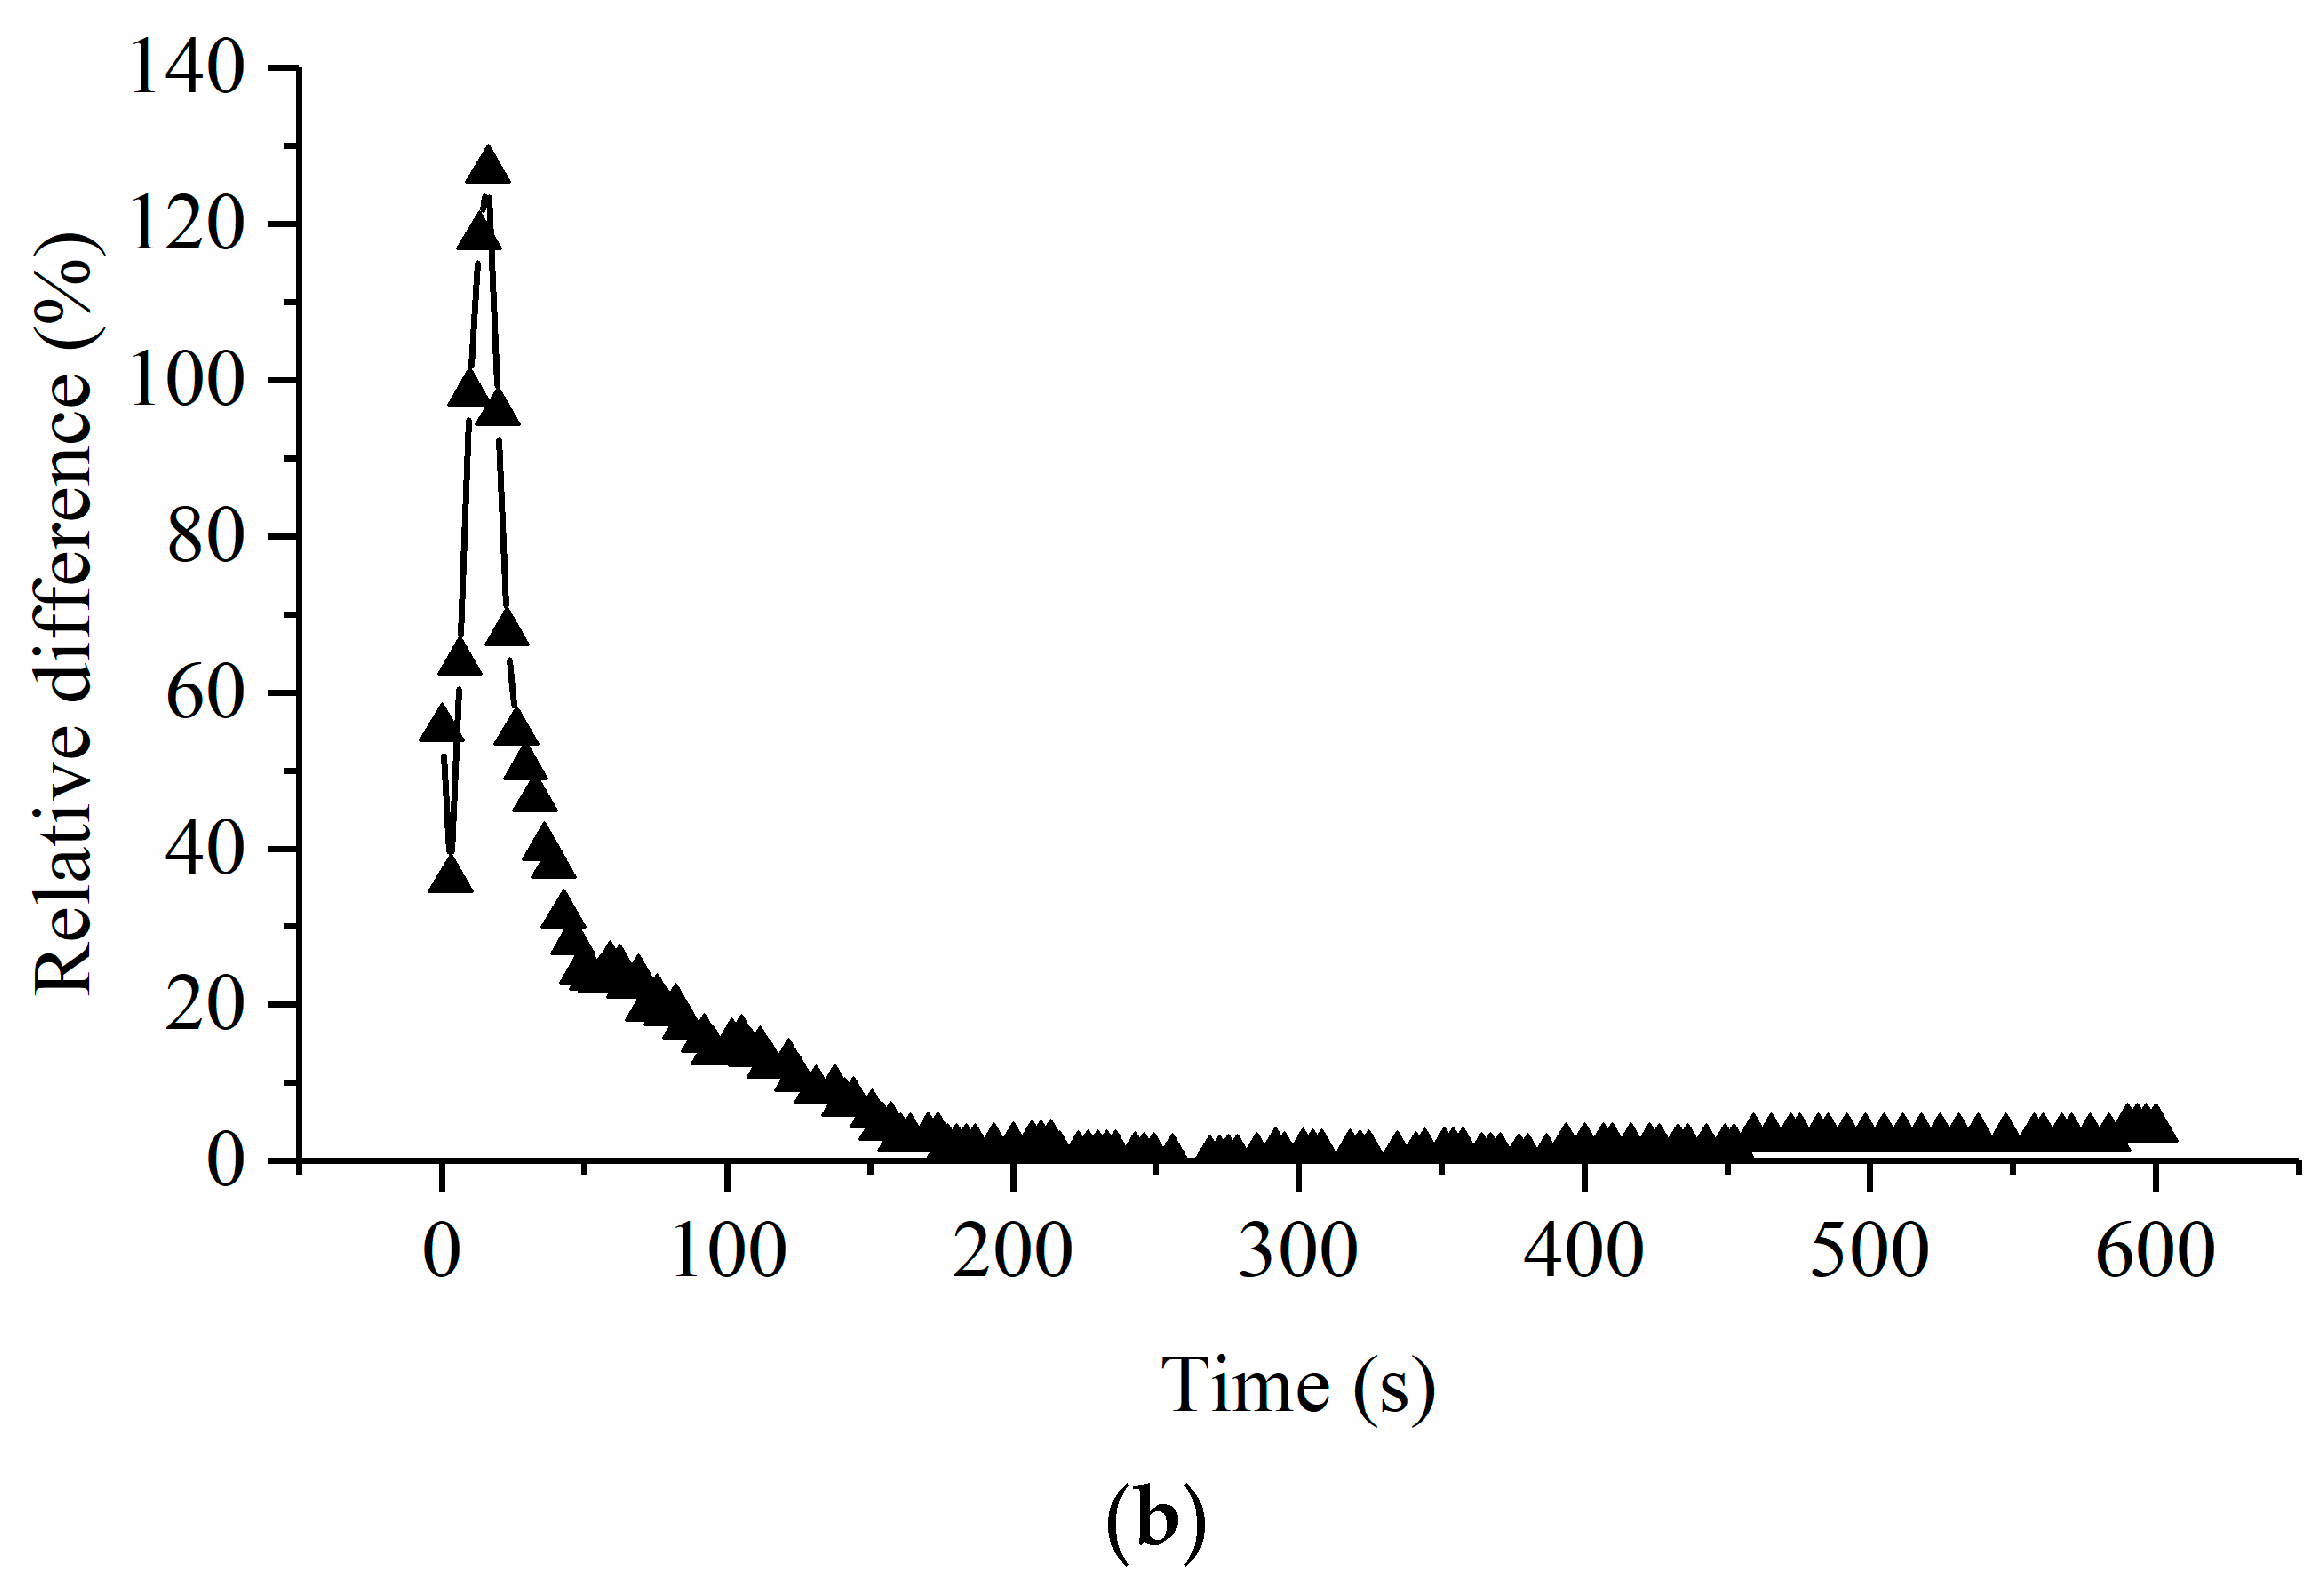
Figure 5b gives the relative difference between the simulated and measured data. It can be seen that from 0 s to 80 s, the relative difference is more than 20%, from 80 s to 160 s, the relative difference is between 20 and 5%, and from 160 s to the end, the relative difference is less than 5%. It can also be seen from
Figure 5 that from 0 s to 160 s, the temperature is in the increasing stage, and especially between 0 s and 80 s, the increasing rate of the temperature is larger. By comparing the figure of relative difference and
Figure 5a, we find that the larger increasing rate of the temperature caused the larger relative difference between the simulated data and the measured data. After analysis, we think the reason for the above situation is the response time of the temperature sensor. As we know, all temperature sensors have a response time, which makes the measured data have a delay from the true temperature when the temperature increasing rate is large, but the simulated data do not have this delay. Therefore, we think that it is reasonable that the simulated data have this difference from the measured data. Excluding this factor, it can be considered that the simulated data agree well with the experimental data.
5. Simulation Condition Settings of a Ship Engine Room Fire
Among the currently popular types of ships, the engine room structure is mostly very complex, usually consisting of 4–5 layers and having multiple internal functions, including but not limited to functional compartments, such as the main engine room, auxiliary engine room, control room, and electrical work room. However, some functional compartments have relatively little correlation with the ship engine room fire studied in this paper. Therefore, some functional compartments will be simplified in subsequent models and these parts will be removed.
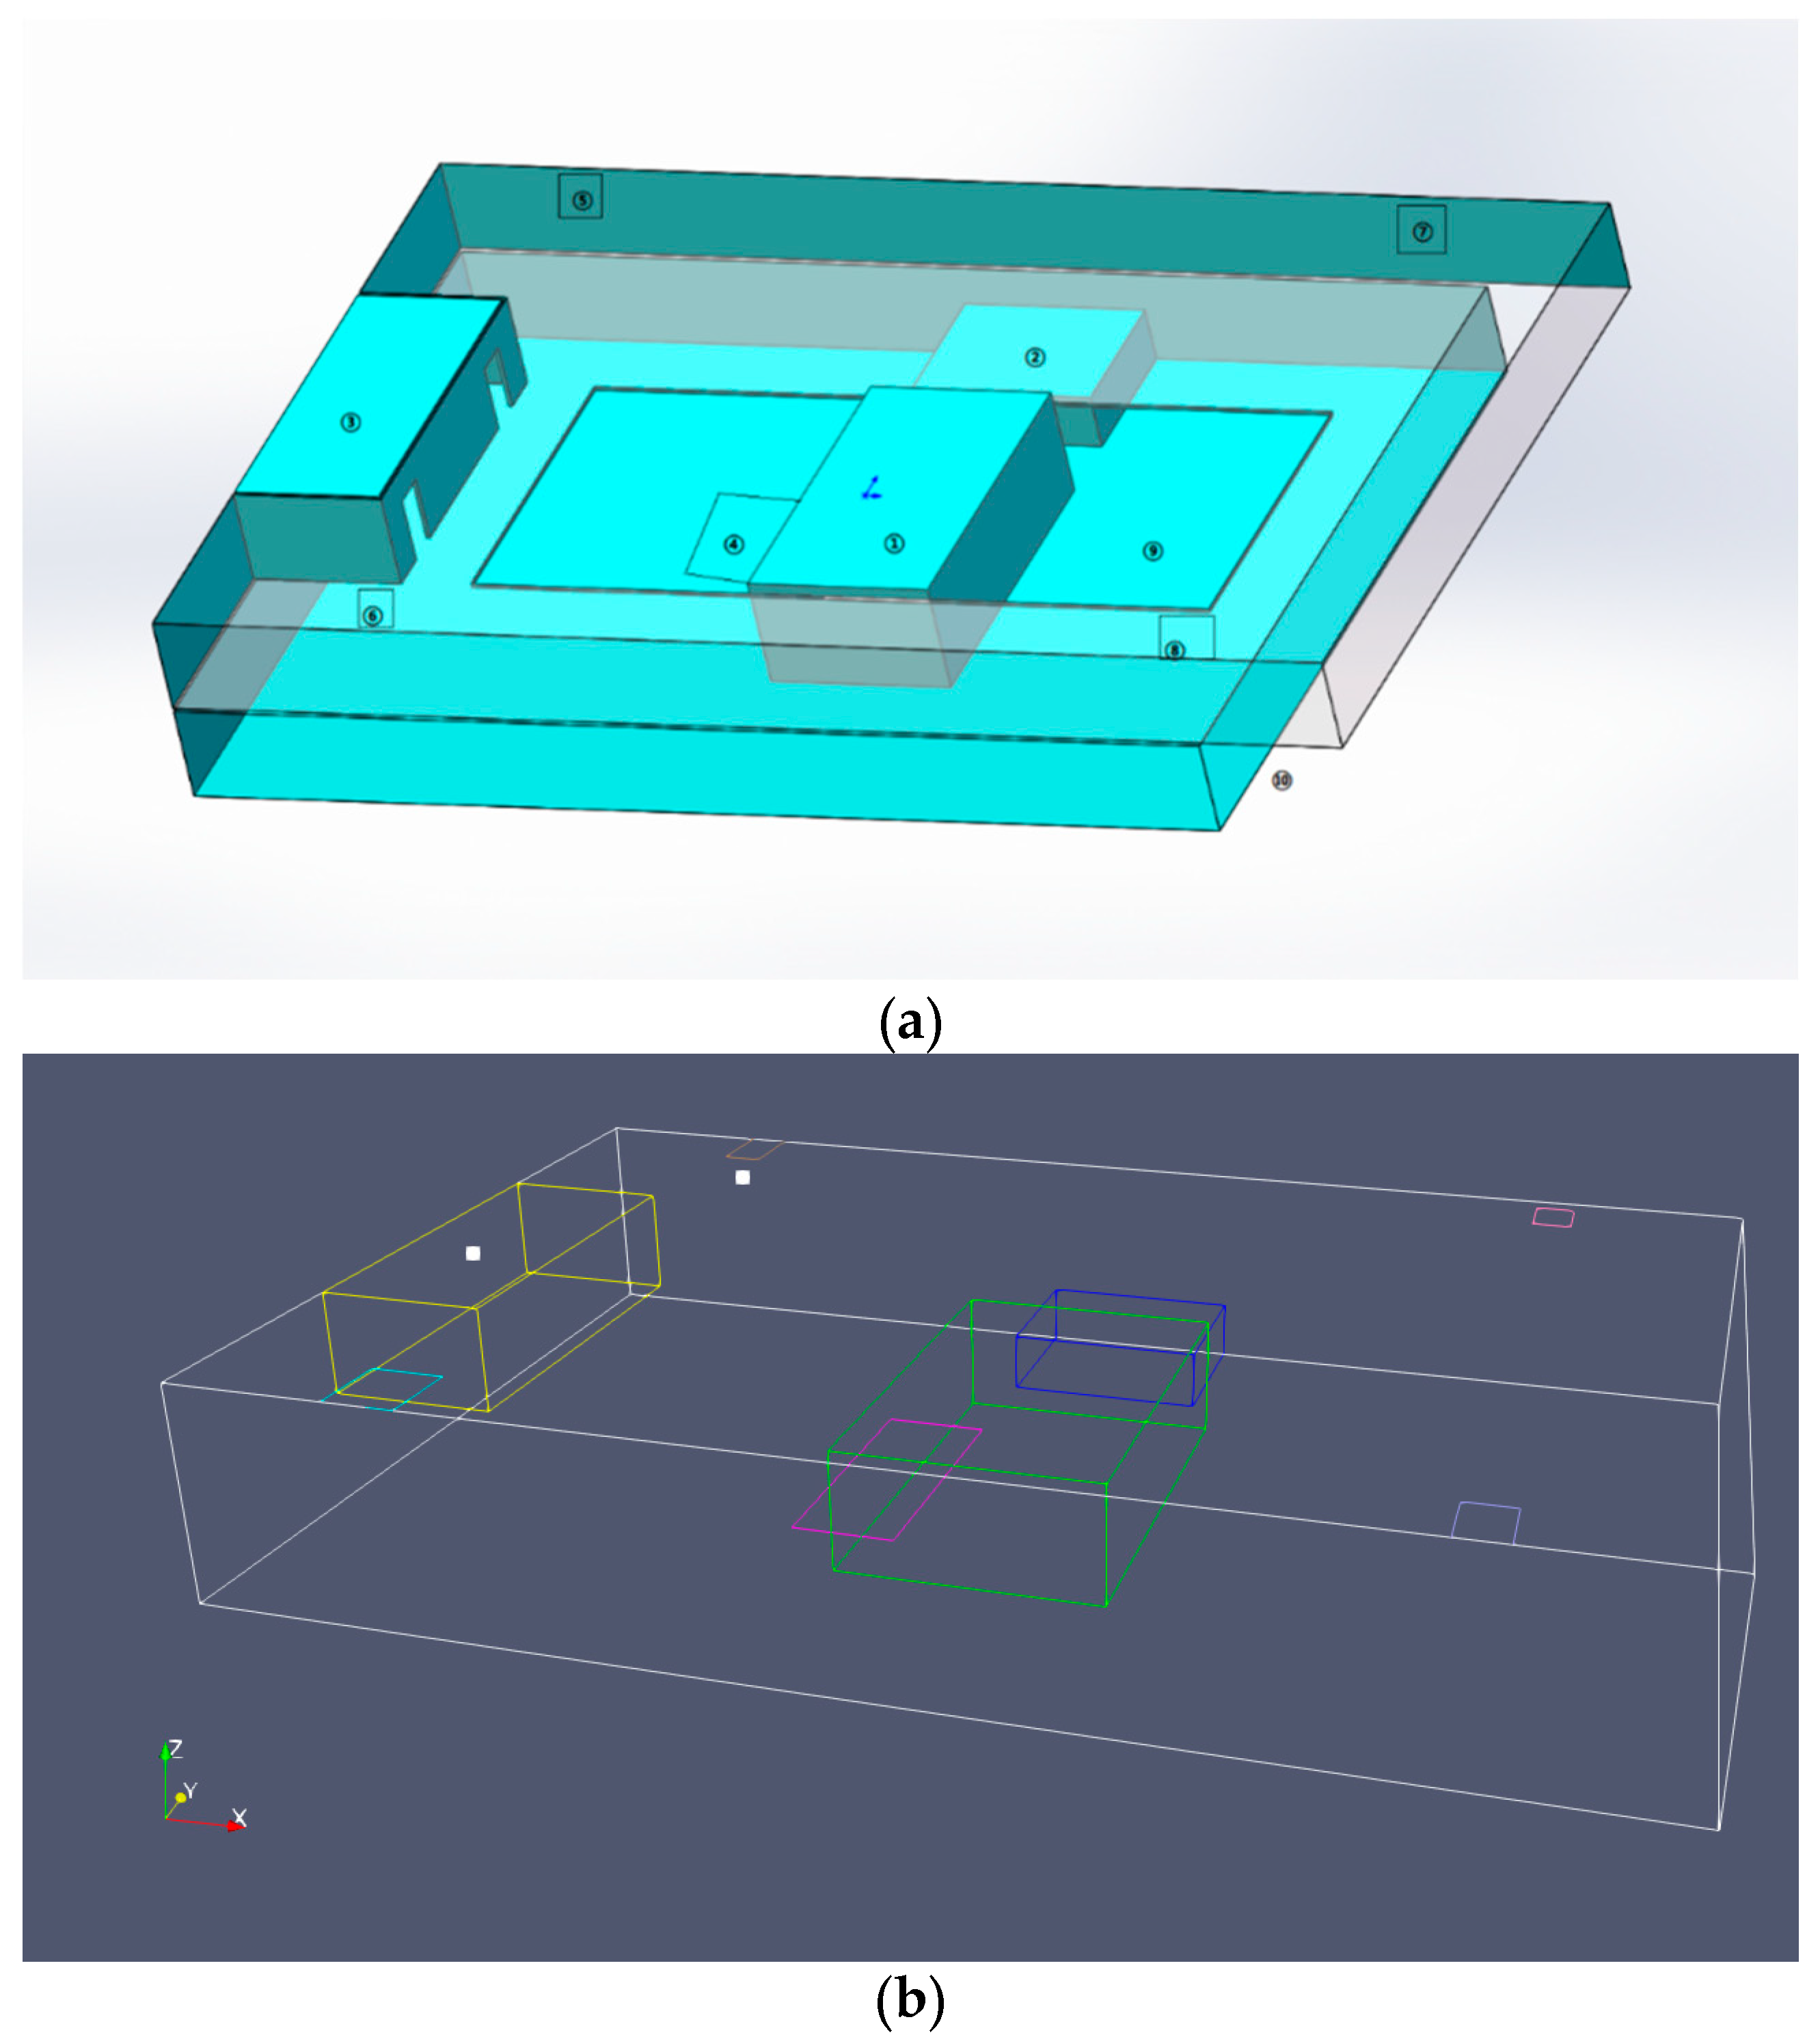
After comparing the drawings of different types of ship engine rooms through various methods, such as a literature review and on-site investigation, this paper has decided to construct a “universal” ship engine room model, as shown in
Figure 6a. The meaning of the numbers in
Figure 6a is shown in
Table 1. The model consists of five modules: control room, oil storage tank, main engine, auxiliary engine, and ventilation port. It is divided into two layers, with a total length of 32.5 m, a total width of 21 m, and a total height of 5.3 m. The upper and lower layers are each 2.6 m high, and the middle connecting layer is 0.1 m high. The control room is 9 m long and 4 m wide, equipped with two doors, with a width of 1 m and a height of 1.8 m. The doors in the control room are set in a normally open state. The oil tank is located on the starboard side of the lower level of the engine room, and is 21 m long and 4 m wide. The main engine is located in the central part of the entire engine room, with a length of 9 m, a width of 6 m, and a height of 3 m. The auxiliary engines are located directly in front of the main engine and close to the cabin wall. There are usually three normal auxiliary engines. To simplify the modeling, this model combines the three auxiliary engines and constructs an auxiliary engine block, with a total length of 4 m, a width of 5 m, and a height of 1.5 m, which is 2 m away from the main engine. In the engine room structure, there is a hollow structure between the upper and lower layers, and a 6 m wide circular passage is installed in the upper engine room. This model also sets up four ventilation windows to simulate the ventilation inside the cabin; the ventilation windows are set at the ceiling of the upper level of the cabin, and they are 1 m × 1 m in size and distributed in the four corners of the cabin. Furthermore, the ventilation volume can be adjusted. The two vents on the starboard side are the air inlet, and the two vents on the port side are the air outlet.
The transferability of the simulation in this paper to real fires induced by liquid fuel leakage in ship engine rooms mainly includes the following aspects: (a) The fires induced by liquid fuel leakage can be approximated as pool fires, the basic theories used in the simulation, including Navier–Stokes equations in fluid mechanics, combustion chemical reactions, component transport equations, and smoke particle motion equations, can describe pool fire fires, and the applicability validation section of this paper also uses experimental results to verify this issue. (b) The fuel used in this simulation is n-heptane, and its combustion characteristics are similar to those of actual ship diesel. (c) The geometric model used in the simulation is a reasonable simplification of the geometric shape of a real ship’s engine room. Of course, there are still some differences between the simulation and a real fire. They will be introduced in
Section 7, which discusses the limitations of this study and further investigation directions.
The positions of the temperature and smoke monitor points are shown in
Figure 6b. The first monitor point is located in the upper part of the control room, approximately 0.2 m from the ceiling, horizontally located in the center of the room. The main purpose of setting this monitor point is to monitor the distribution of smoke generated by flames and the temperature changes in the control room in the simulation. The second monitor is located on the port side of the engine room, near the control room, with a height of approximately 1.75 m. Its purpose is to detect the temperature and the smoke near the escape exit. The reason why we use these two sensors is that we want to pay more attention to the smoke concentration and the temperature in the control room and the escape exit and compare the influence degree of different factors on the smoke concentration and the temperature in the above positions. These two positions are more important than other positions as there are more workers in the control room than other positions, and the temperature and the smoke concentration at the escape exit are critical for people to escape from a ship engine room fire. The temperature distribution and smoke dispersion at other positions can be obtained from the cloud picture.
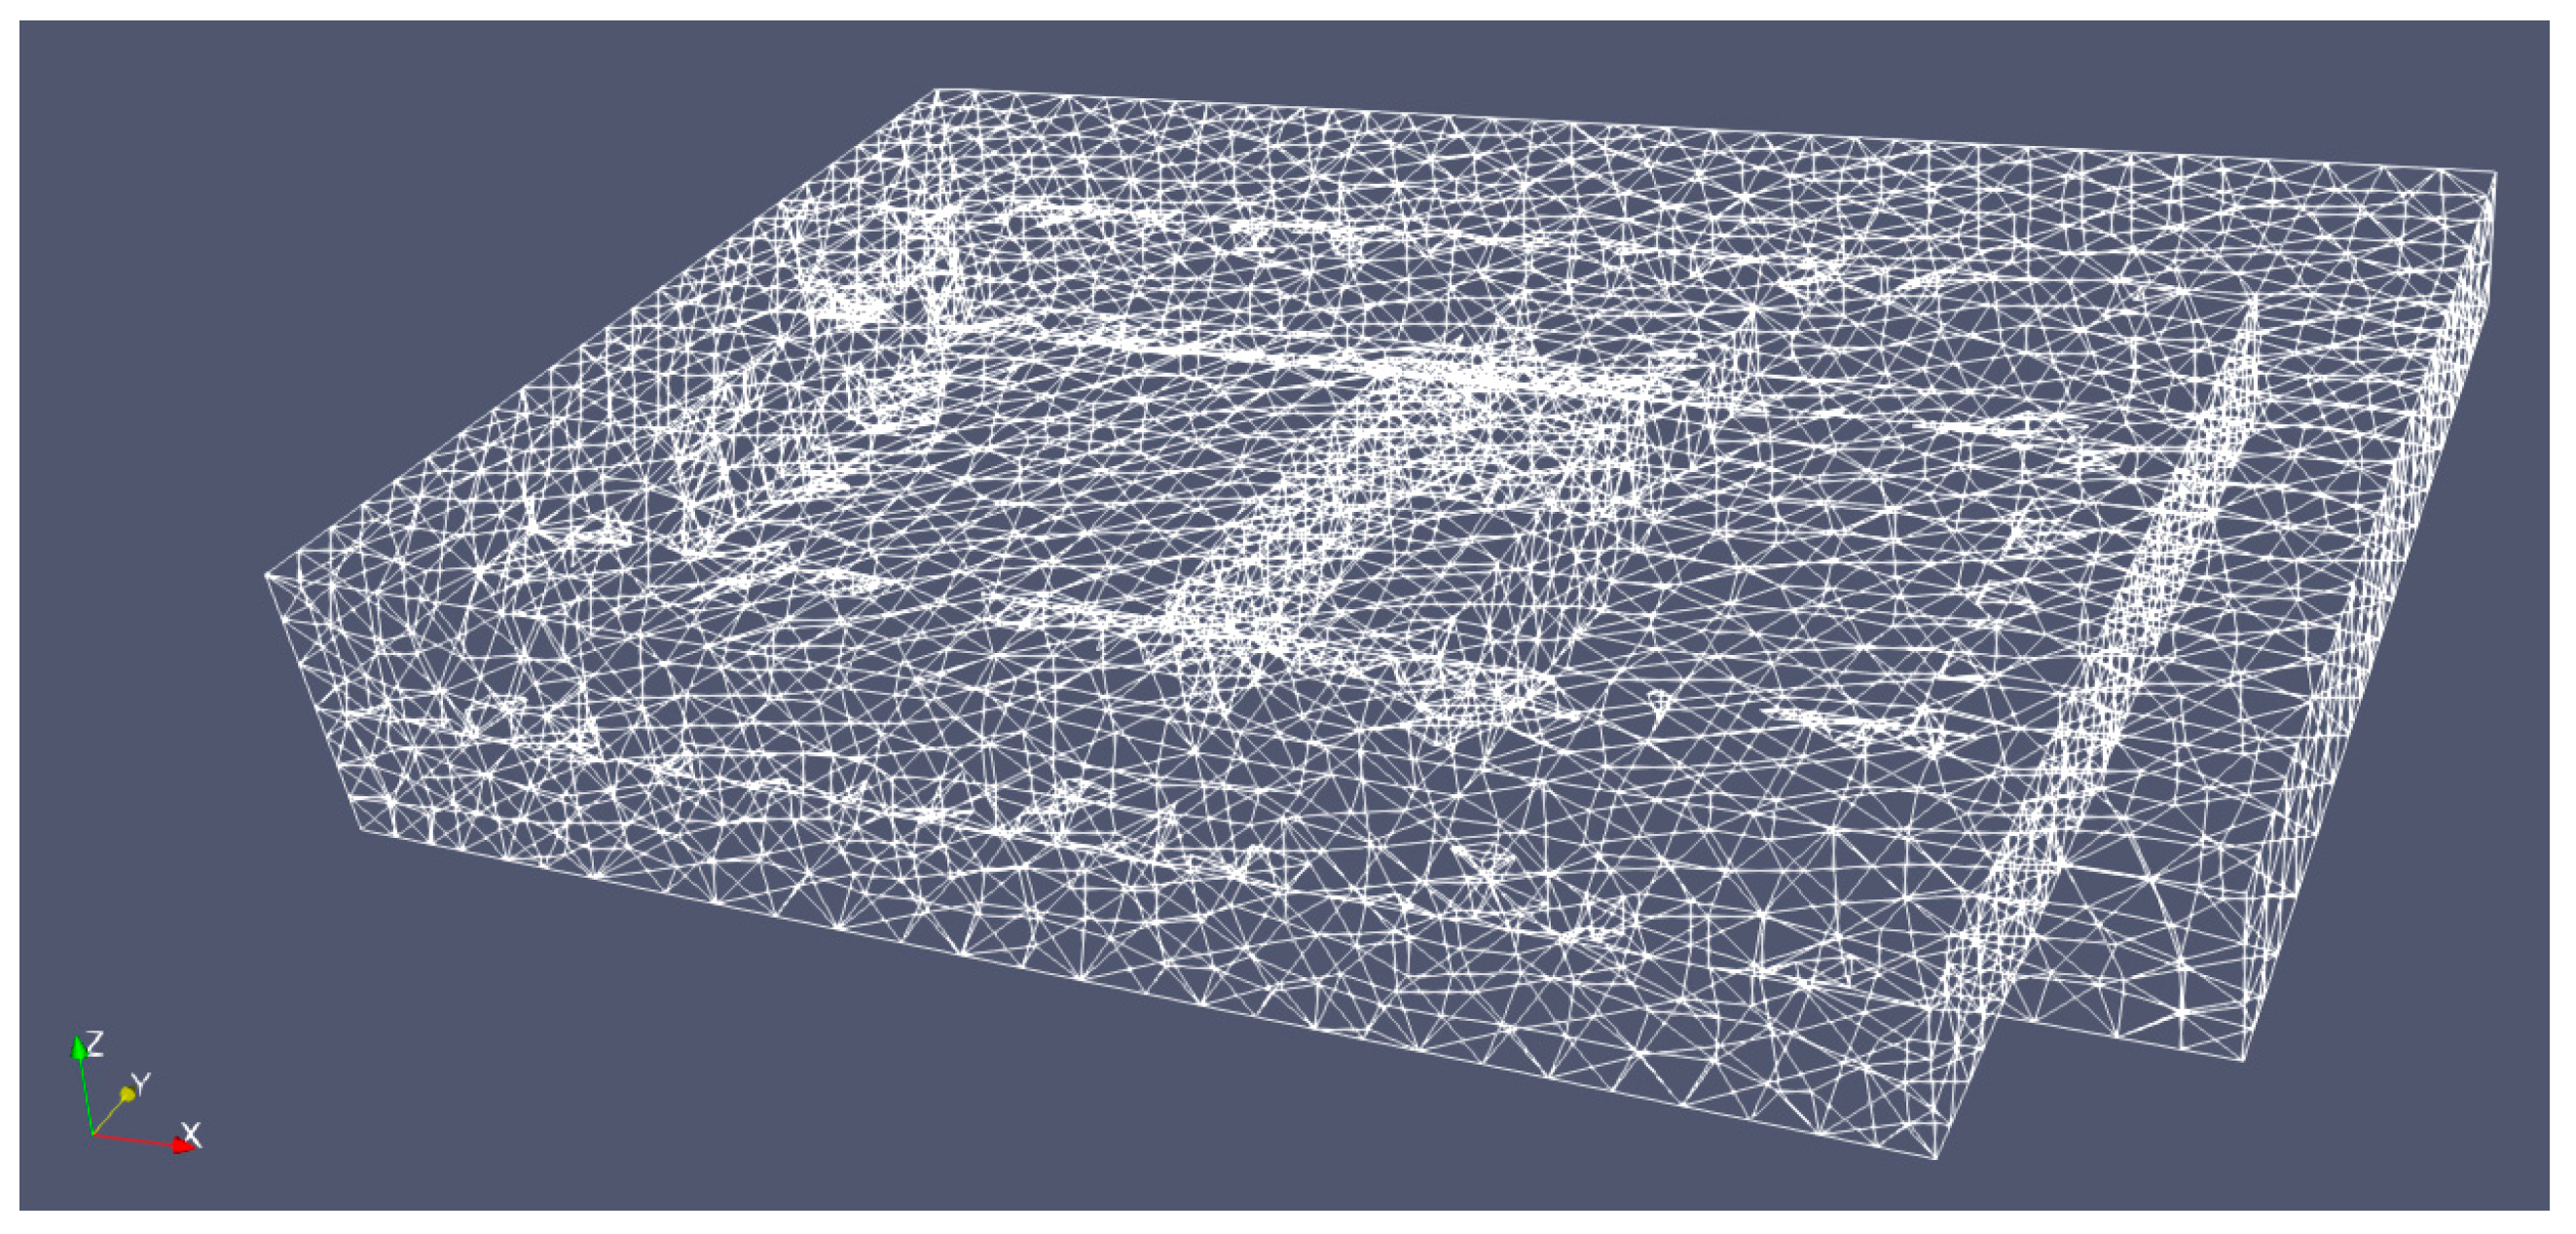
Based on the above geometric conditions, the unstructured mesh is created (shown in
Figure 7). In this mesh, there are a total of 42,197 cells and 87,249 faces. As shown in
Figure 7, a relatively disorderly mesh appeared in the part where some blocks were spliced as a supplement. This is because the model automatically filled in the holes in the topology during topology checking, resulting in the generation of a portion of unstructured mesh with relatively irregular structures. However, this mesh does not affect the numerical result in subsequent numerical simulations.
6. Results and Discussion
In ship engines, a fire caused by engine room oil leakage is one of the most frequent types of fires; therefore, a pool fire caused by oil leakage is selected in the simulation. Based on the above simulation conditions, three factors that can affect the smoke dispersion and the temperature distribution are considered in the simulation, and they are the ventilation situation, the pool fire area, and the pool fire position, respectively.
In this section, three kinds of ventilation situations are simulated. The first ventilation situation is that the engine room cannot be ventilated. This situation may happen when the fire causes the entire ship to lose power and the ventilation fans stop working. The second and the third situations are that the air velocities of the vents stay at 2 m/s and 3 m/s, respectively. In these simulations, the fire area is set as 12 m2 and the fire position is set as the side of the main engine near the control room.
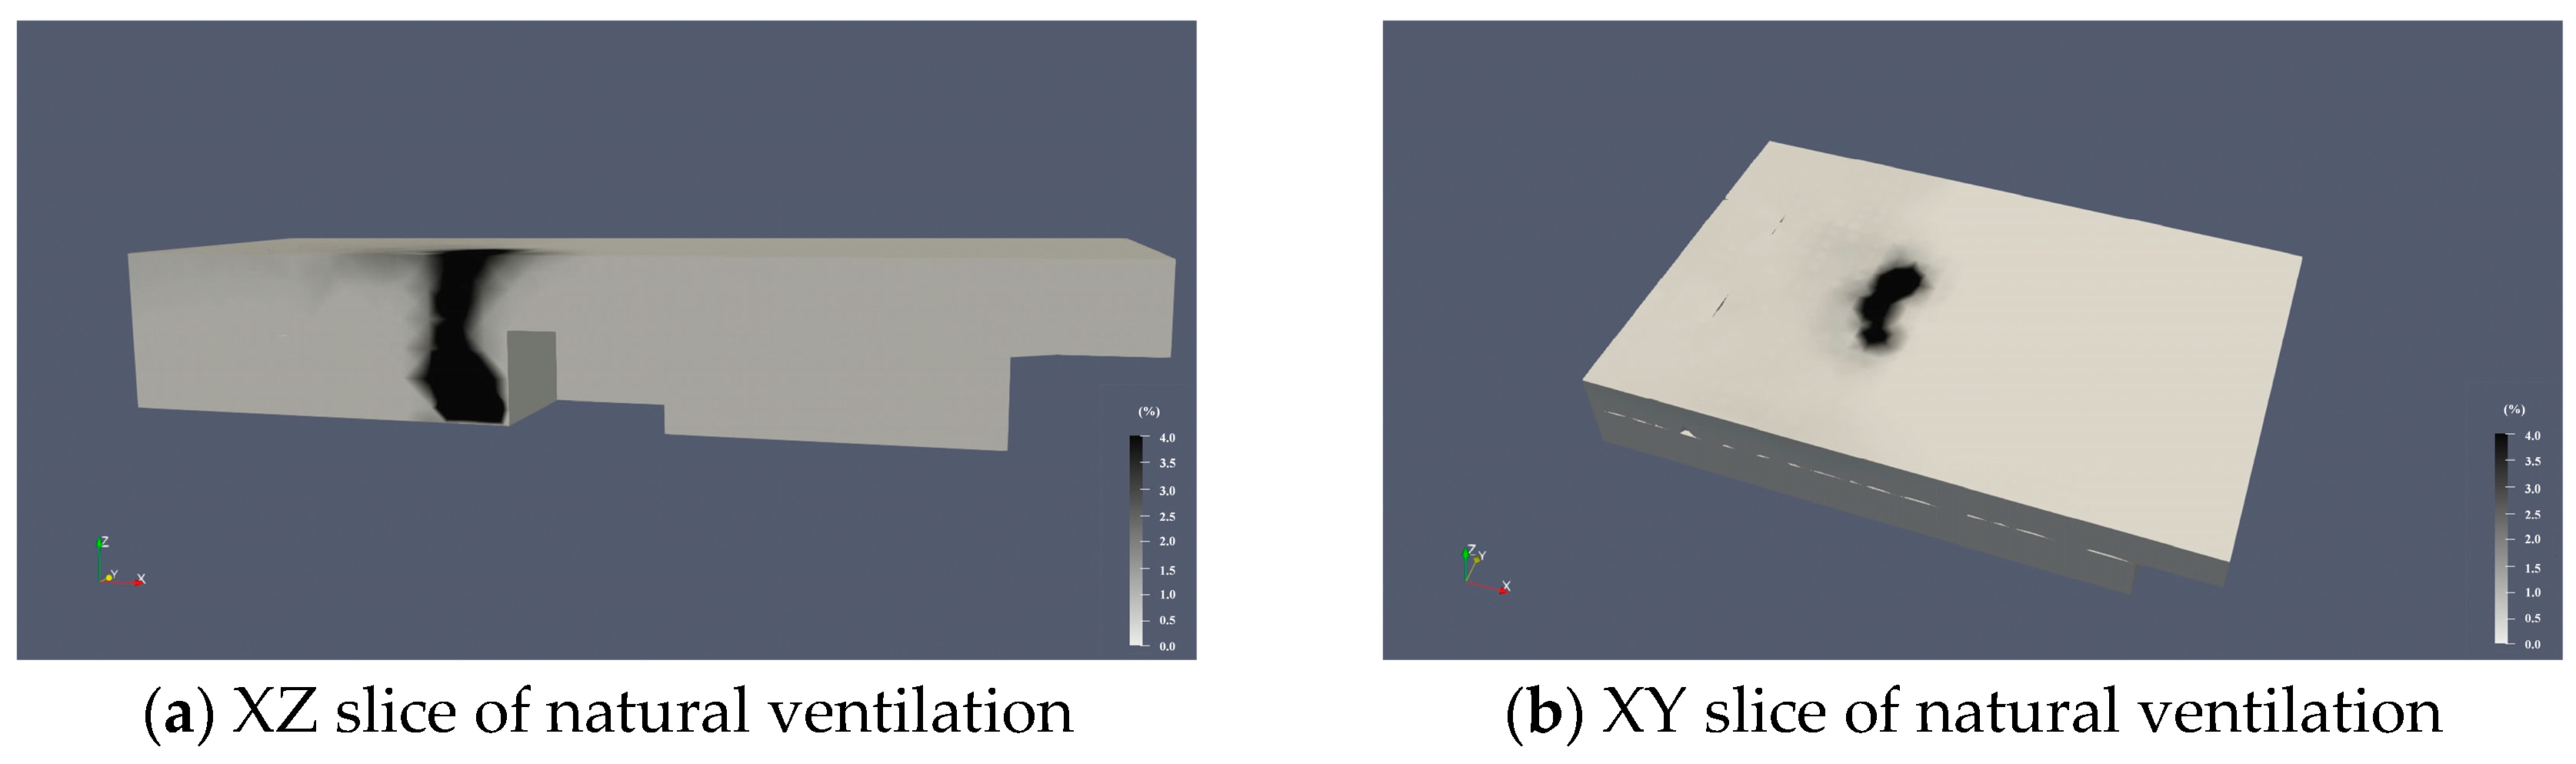
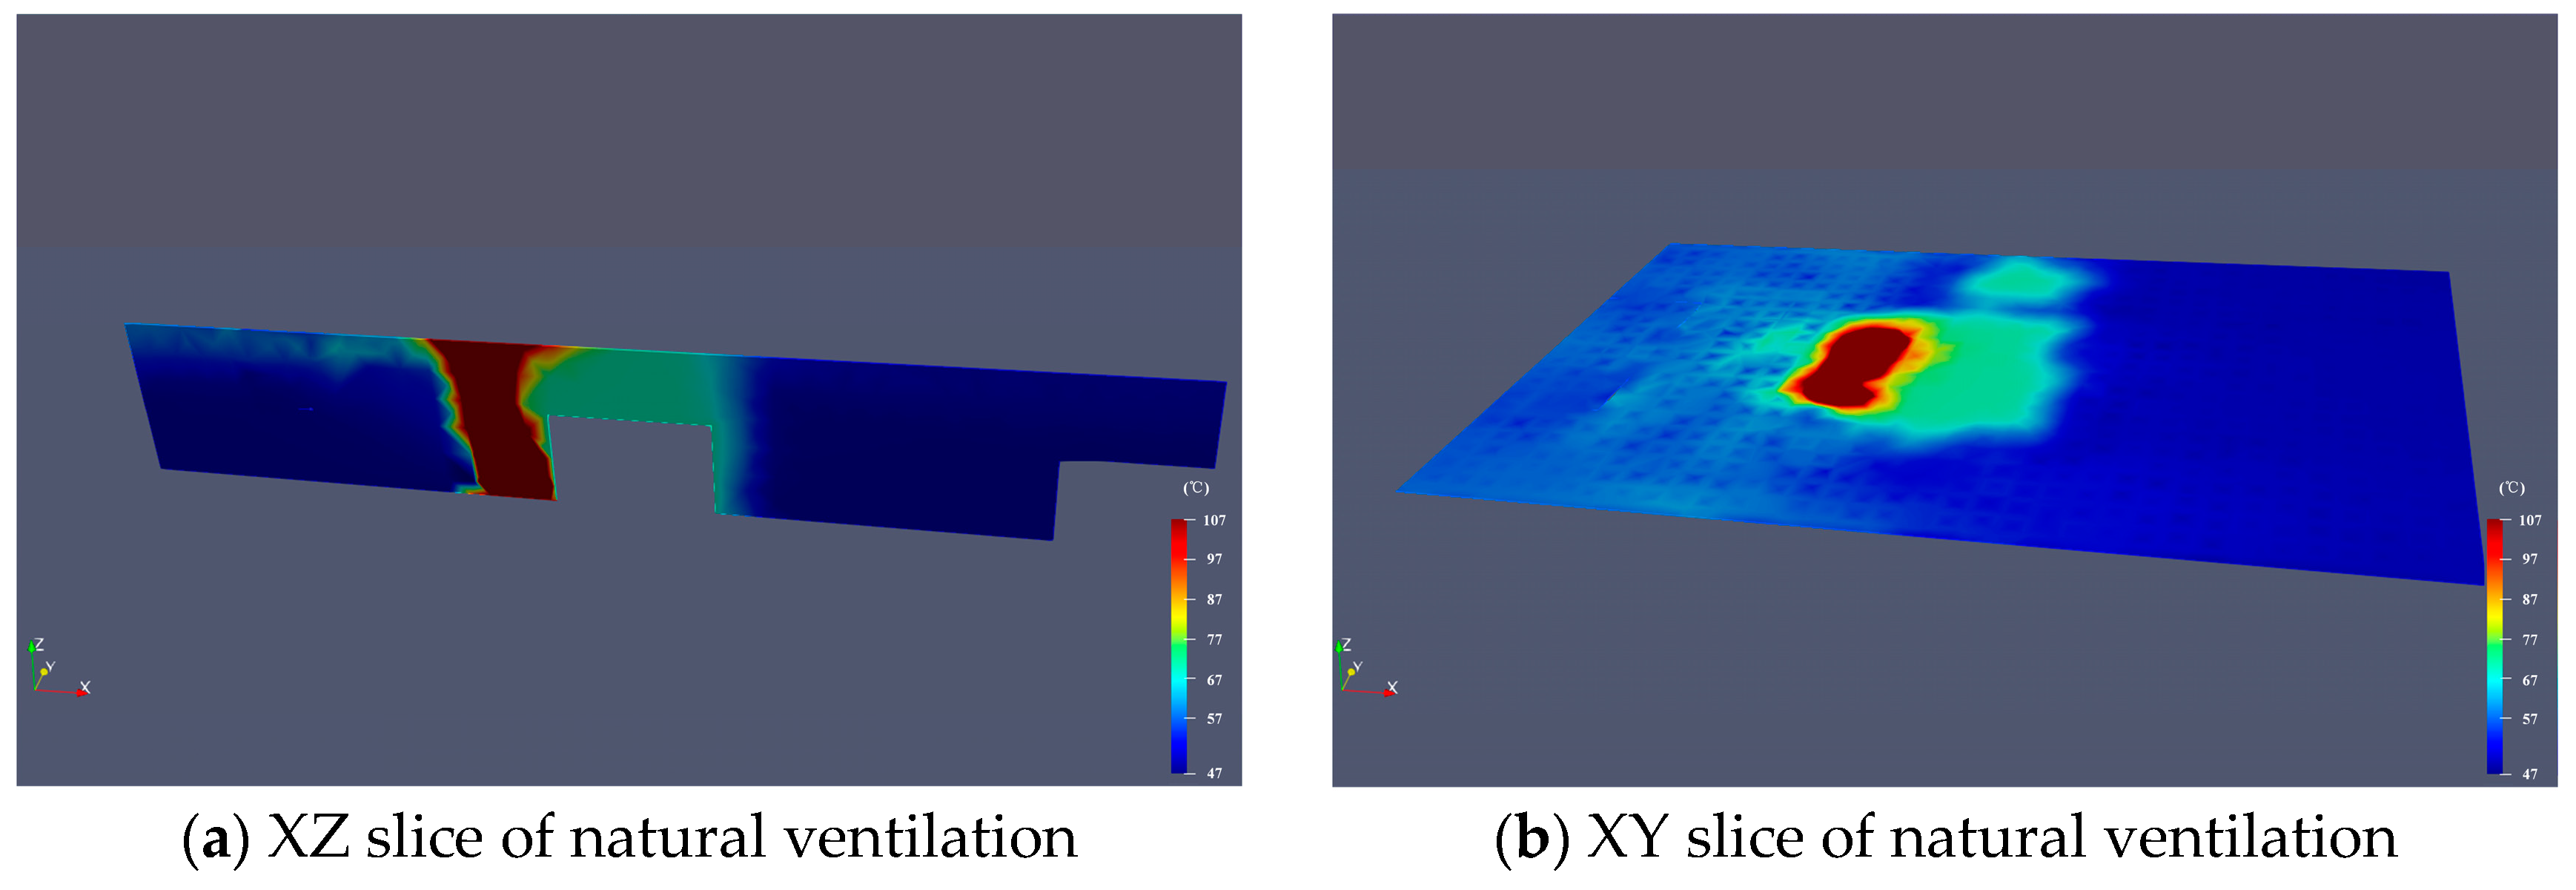
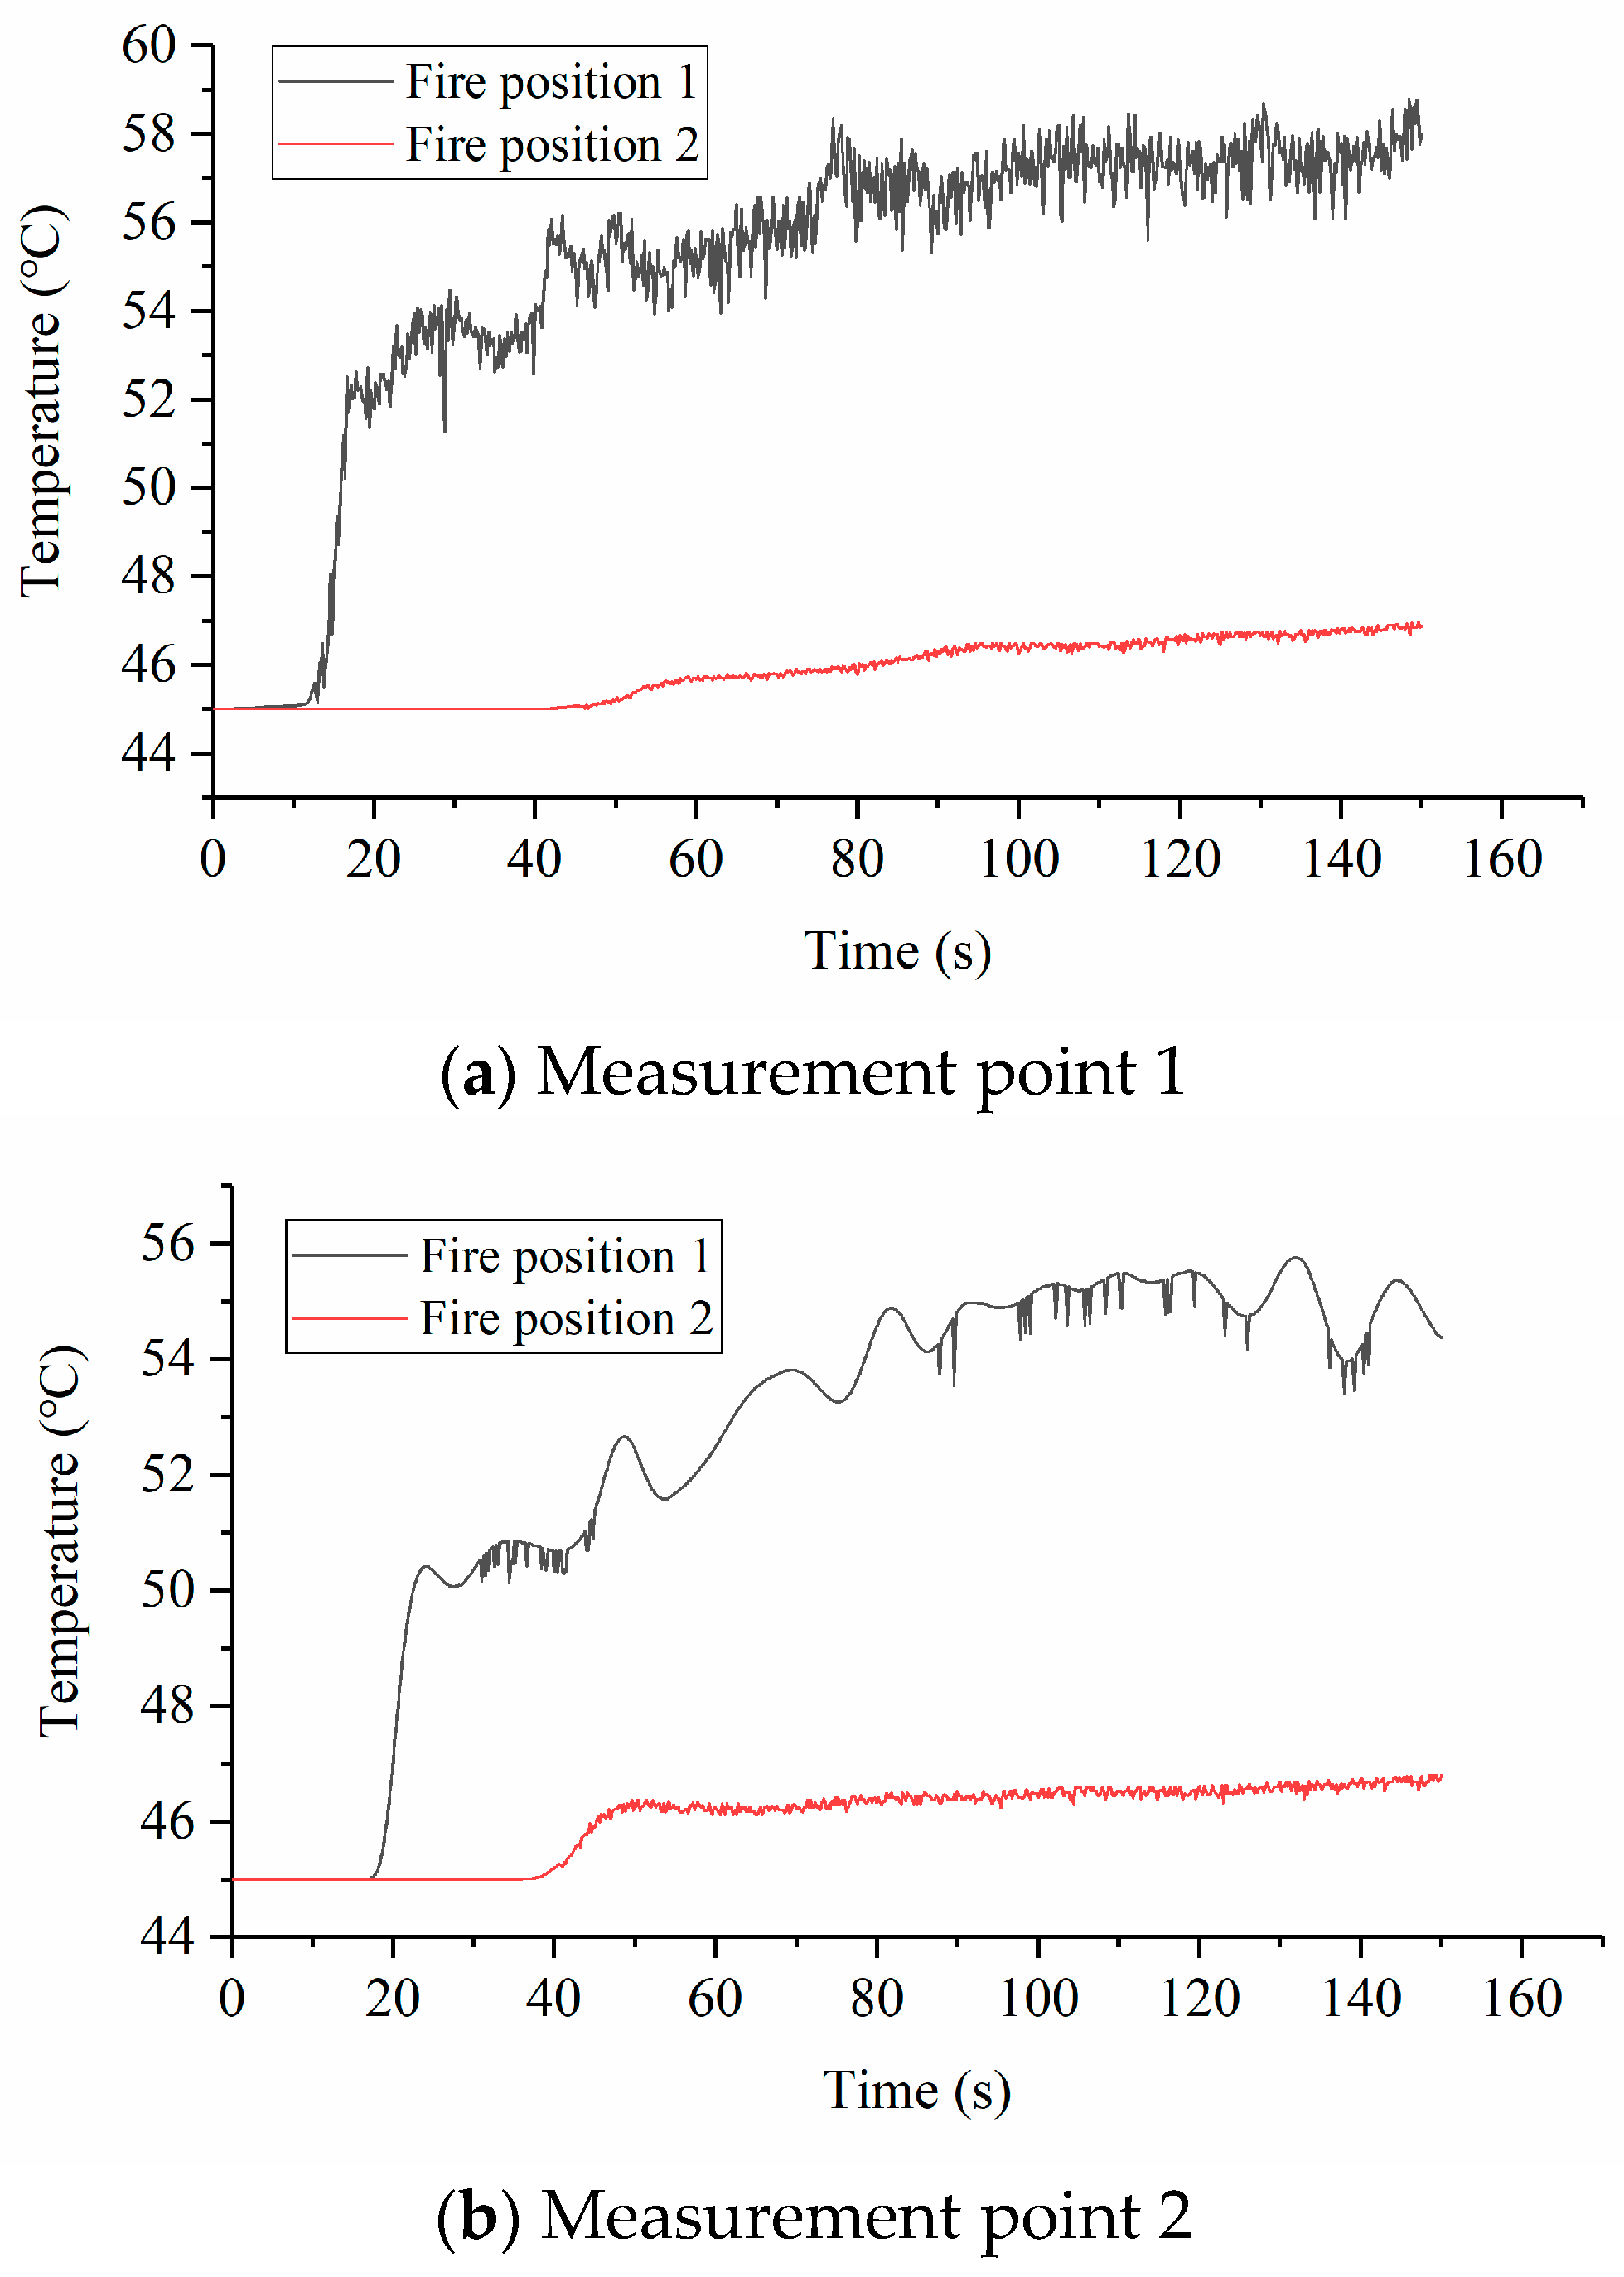
The simulated temperature slices of the natural ventilation are shown in
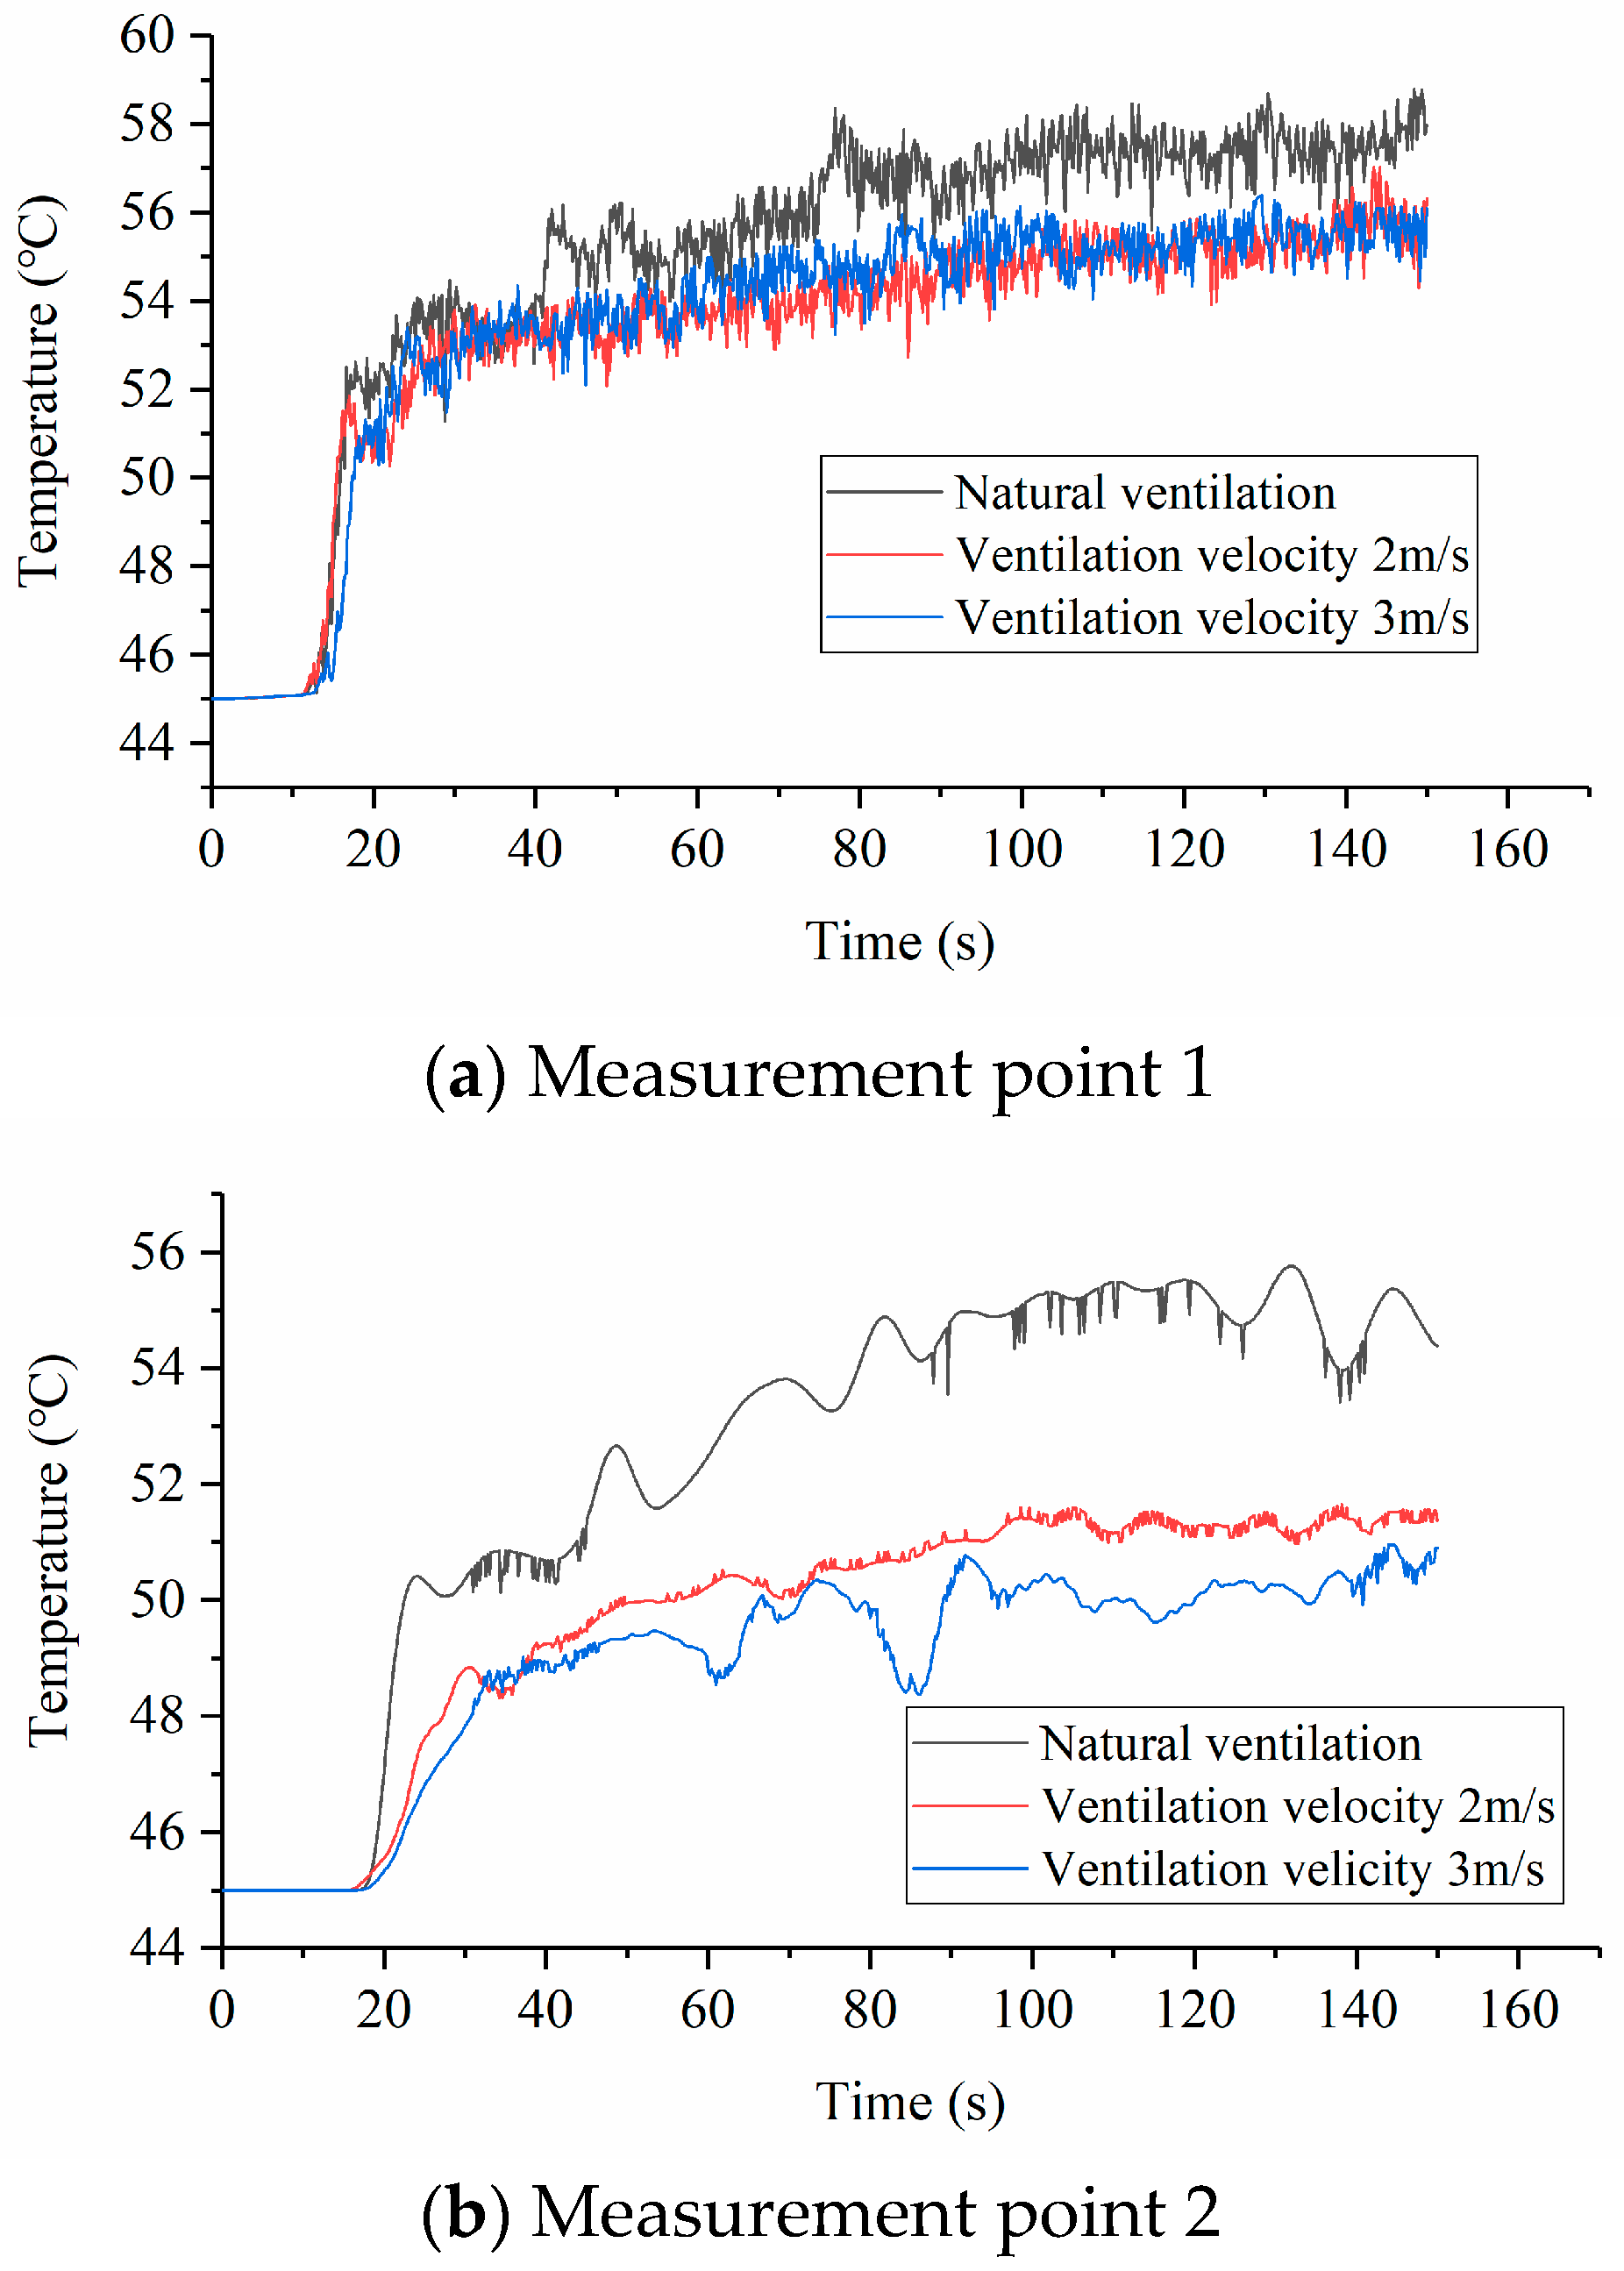
Figure 8. The simulated temperature curves of measurement points 1 and 2 are shown in
Figure 9a,b. It can be seen that in all ventilation situations, the high temperature spreads quickly after ignition. About 10 s after the ignition, the control room begins to heat up. About 20 s after the ignition, the escape exit begins to heat up quickly. After about 5 s of rapid heating, the heating rate slows down. Finally, for the first situation, the temperature in the control room is maintained at 58 °C, and the temperature at the escape exit is maintained at around 55 °C. For the second and third situations, the temperature in the control room is maintained at 56 °C, and the temperature at the escape exit is maintained at around 51 °C. This shows that ventilation can reduce the temperature in the control room and the escape exit; however, when the air velocity at the vent exceeds 2 m/s, continuing to increase the air velocity at the vent does not produce better results for decreasing the temperature in the control room and the escape exit during a fire.
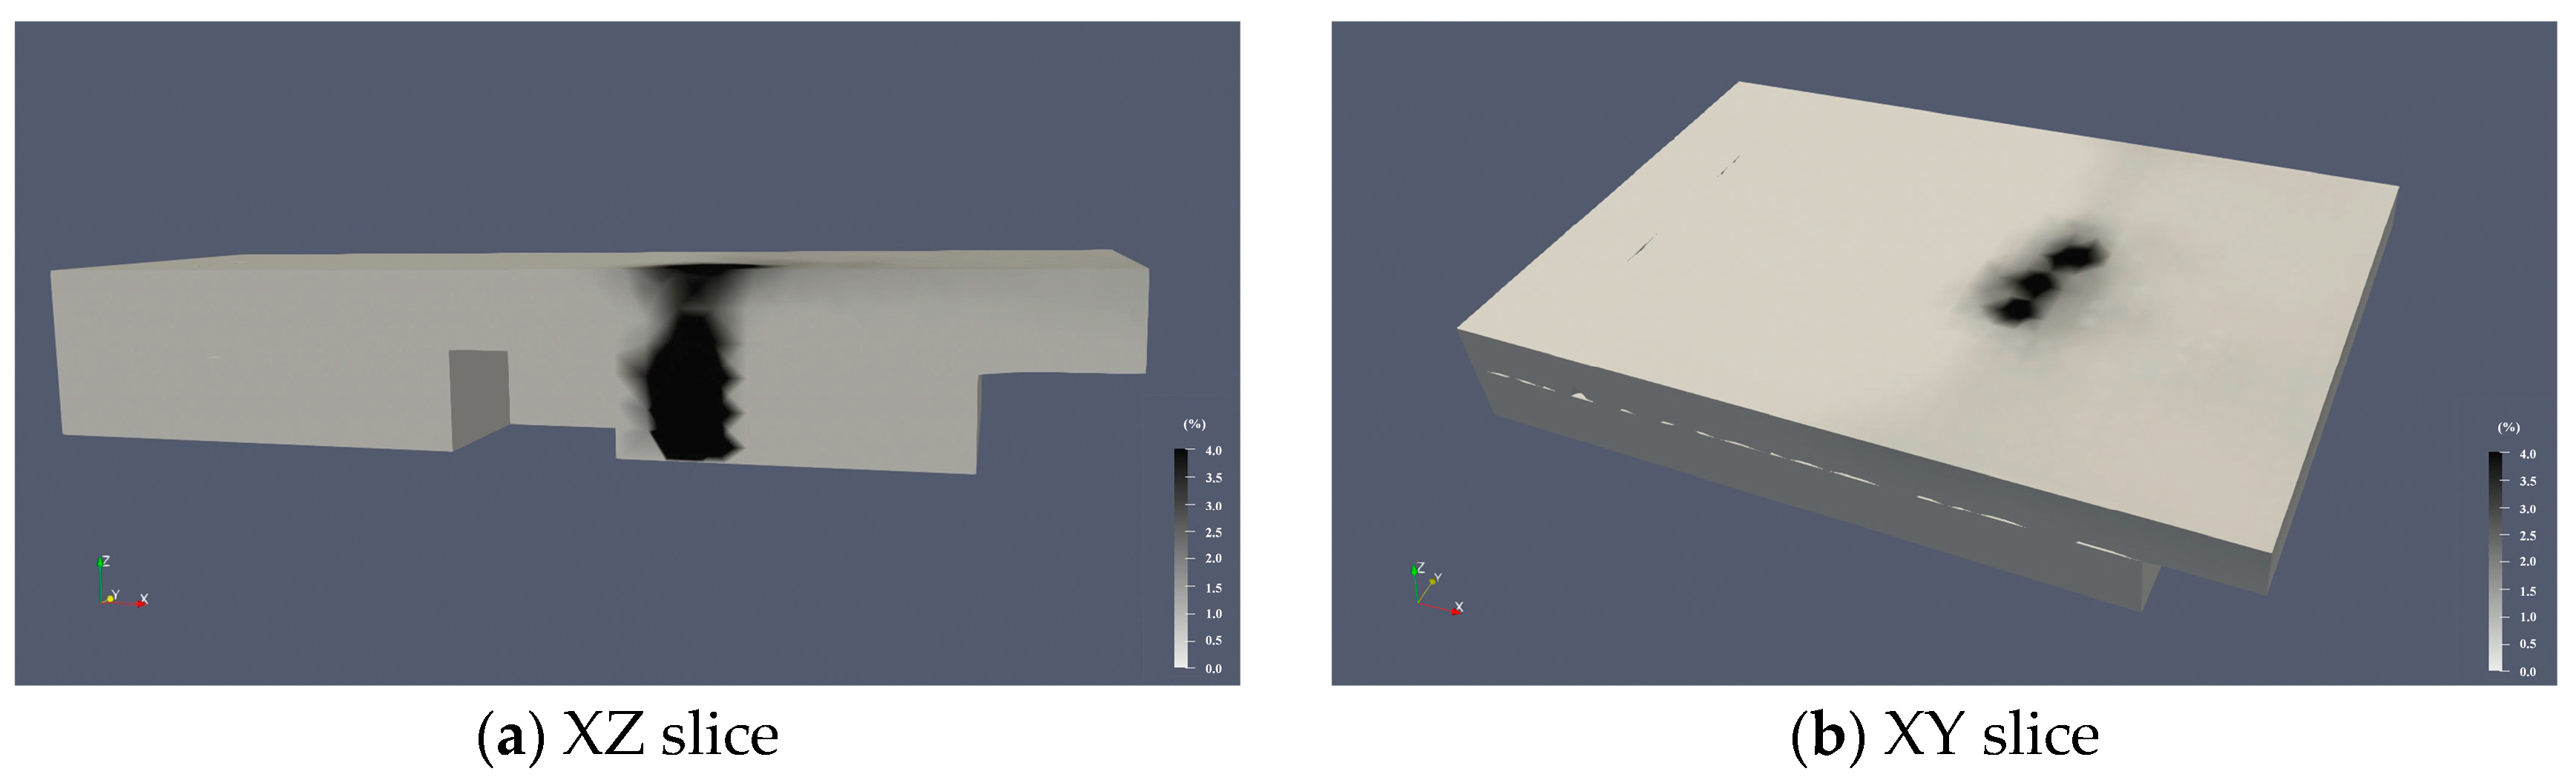
The simulated smoke concentration slices of natural ventilation are shown in
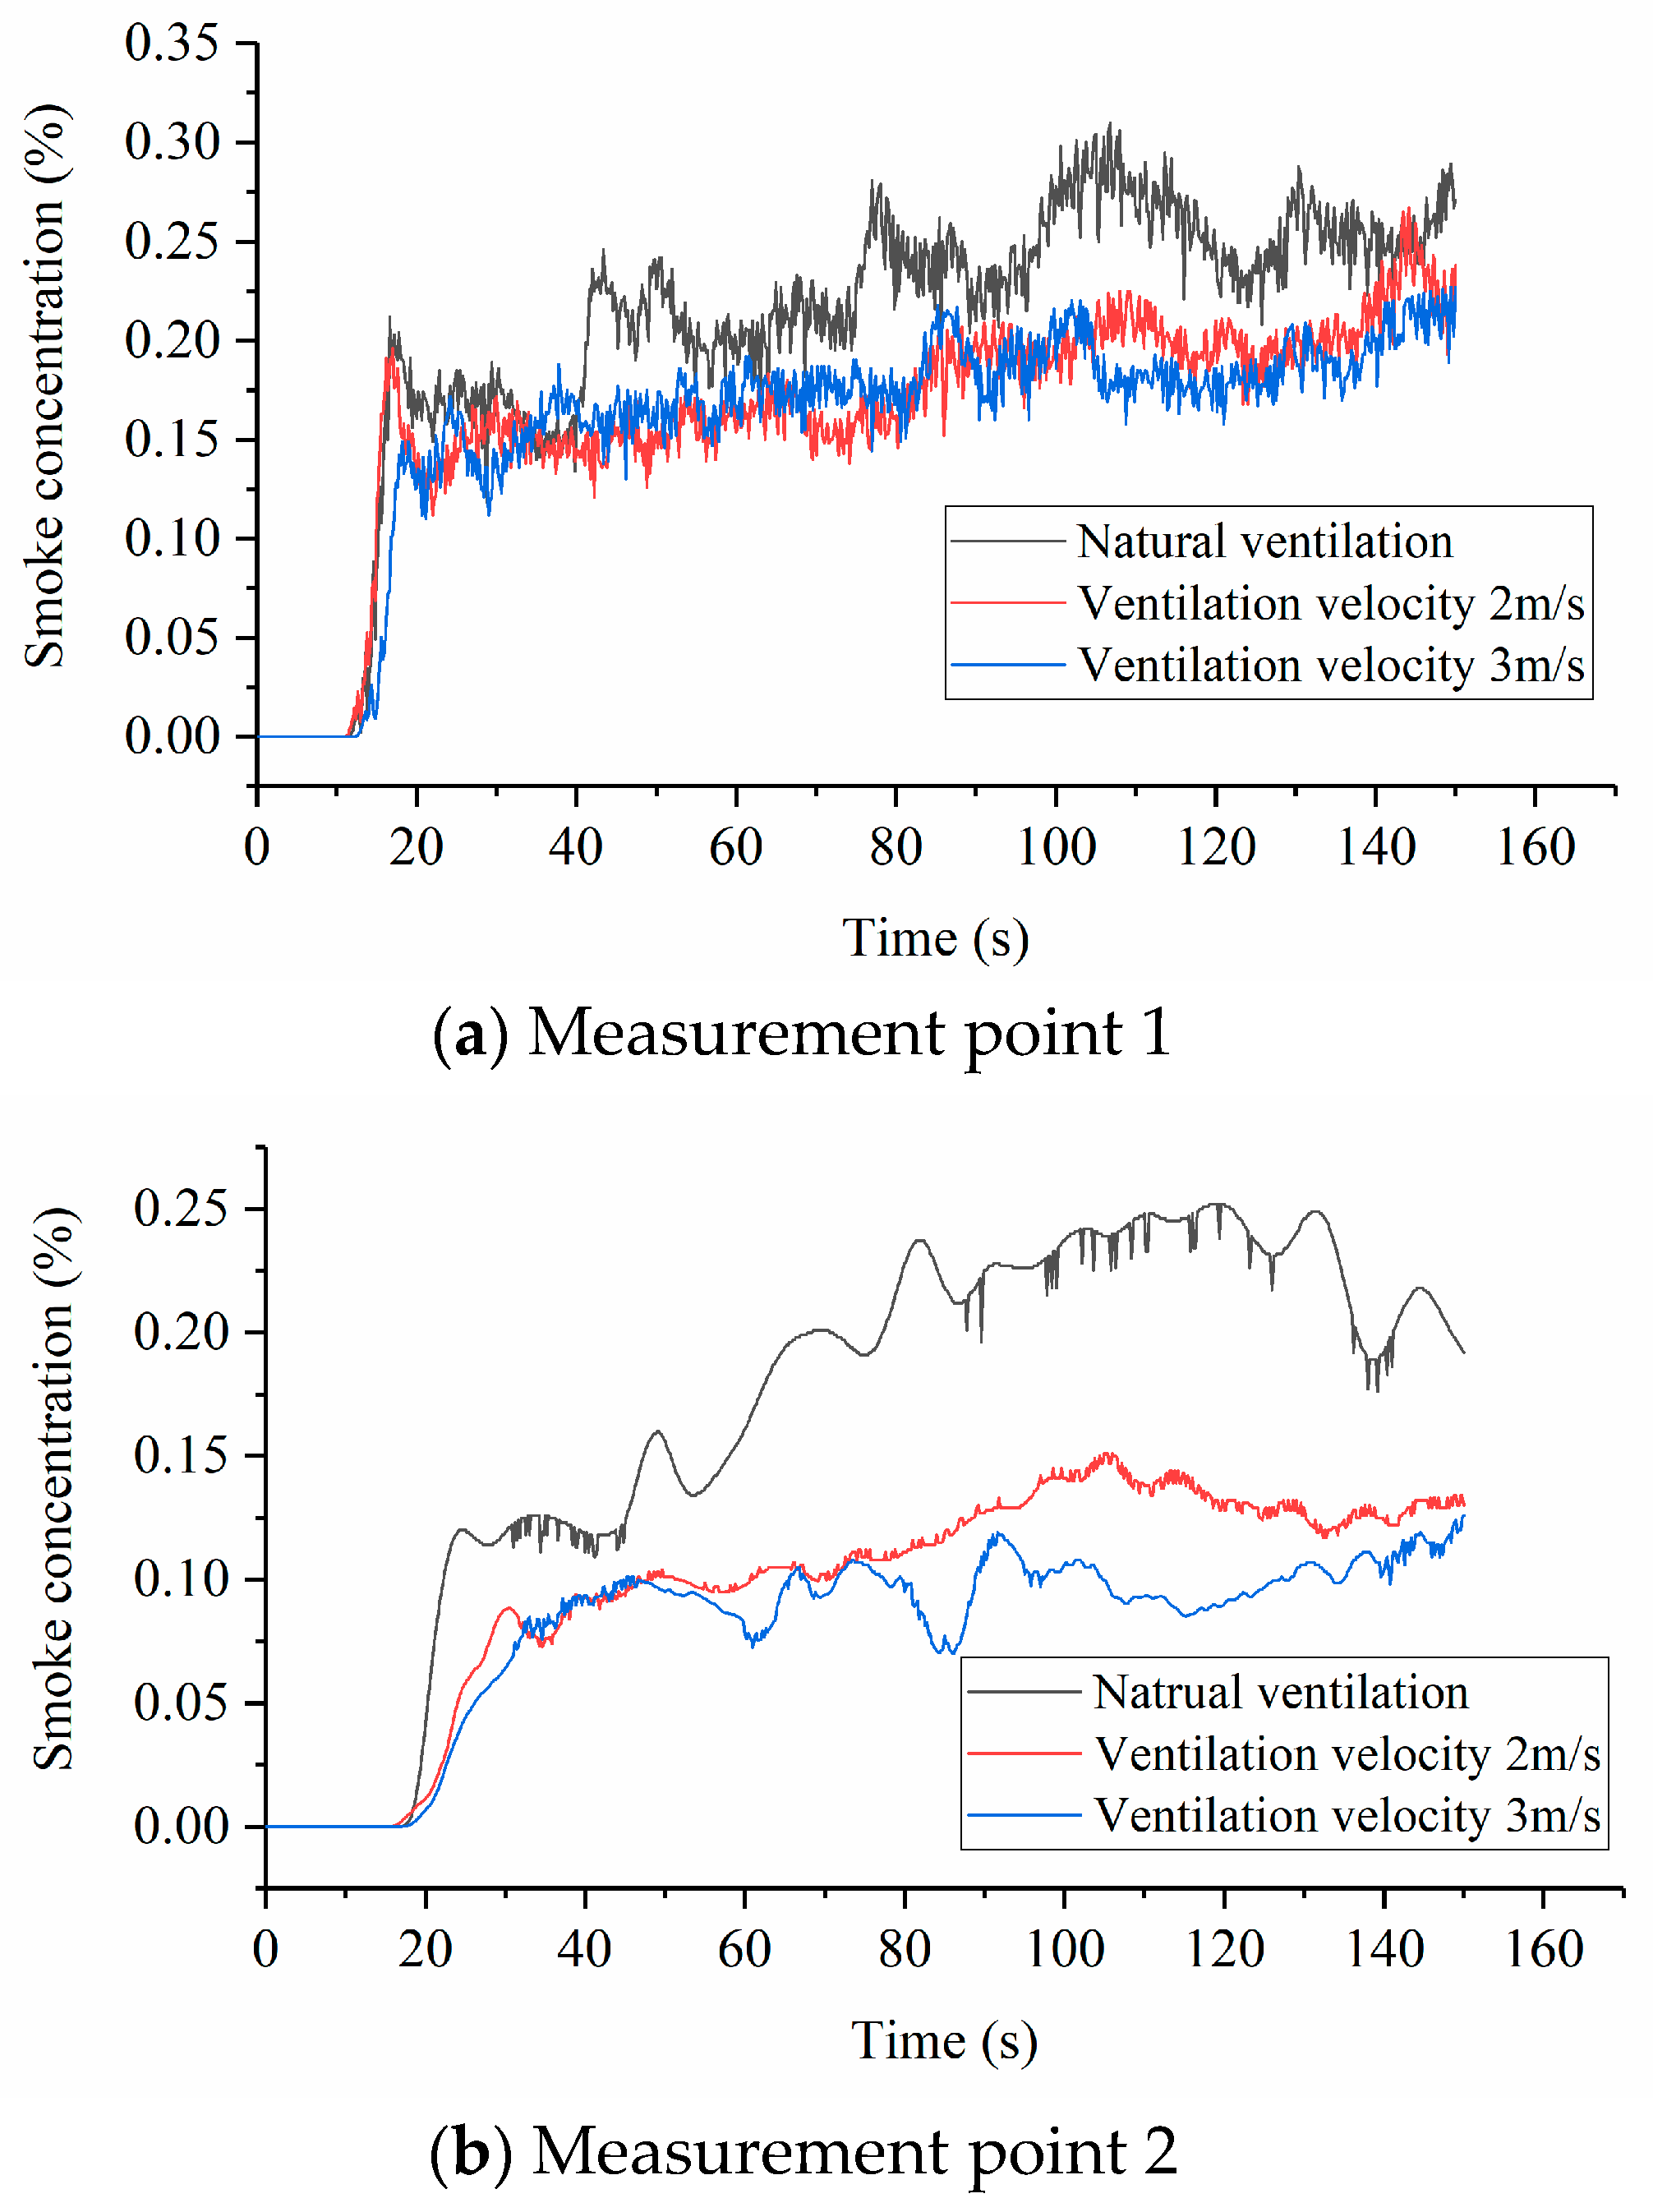
Figure 10. The simulated smoke concentration curves of measurement points 1 and 2 are shown in
Figure 11a,b. It can be seen that the smoke shares a similar spreading characteristic with the temperature after ignition, and the smoke concentration and the temperature at the measurement point change basically at the same time, but the smoke concentration has a larger fluctuation than the temperature. For the first situation, the smoke concentration in the control room is maintained at 0.275%, and the smoke concentration at the escape exit is maintained at around 0.225%. For the second and third situations, the smoke concentration in the control room is maintained at 0.225%, and the smoke concentration at the escape exit is maintained at around 0.125% and 0.11%, respectively. This shows that ventilation can reduce the smoke concertation in the engine room effectively in case of a fire, and increasing the air velocity at the vent can reduce the smoke concentration at the escape exit, although it does not produce the same result in the control room. The smoke concentration in the control room does not change much with the increase in air velocity.
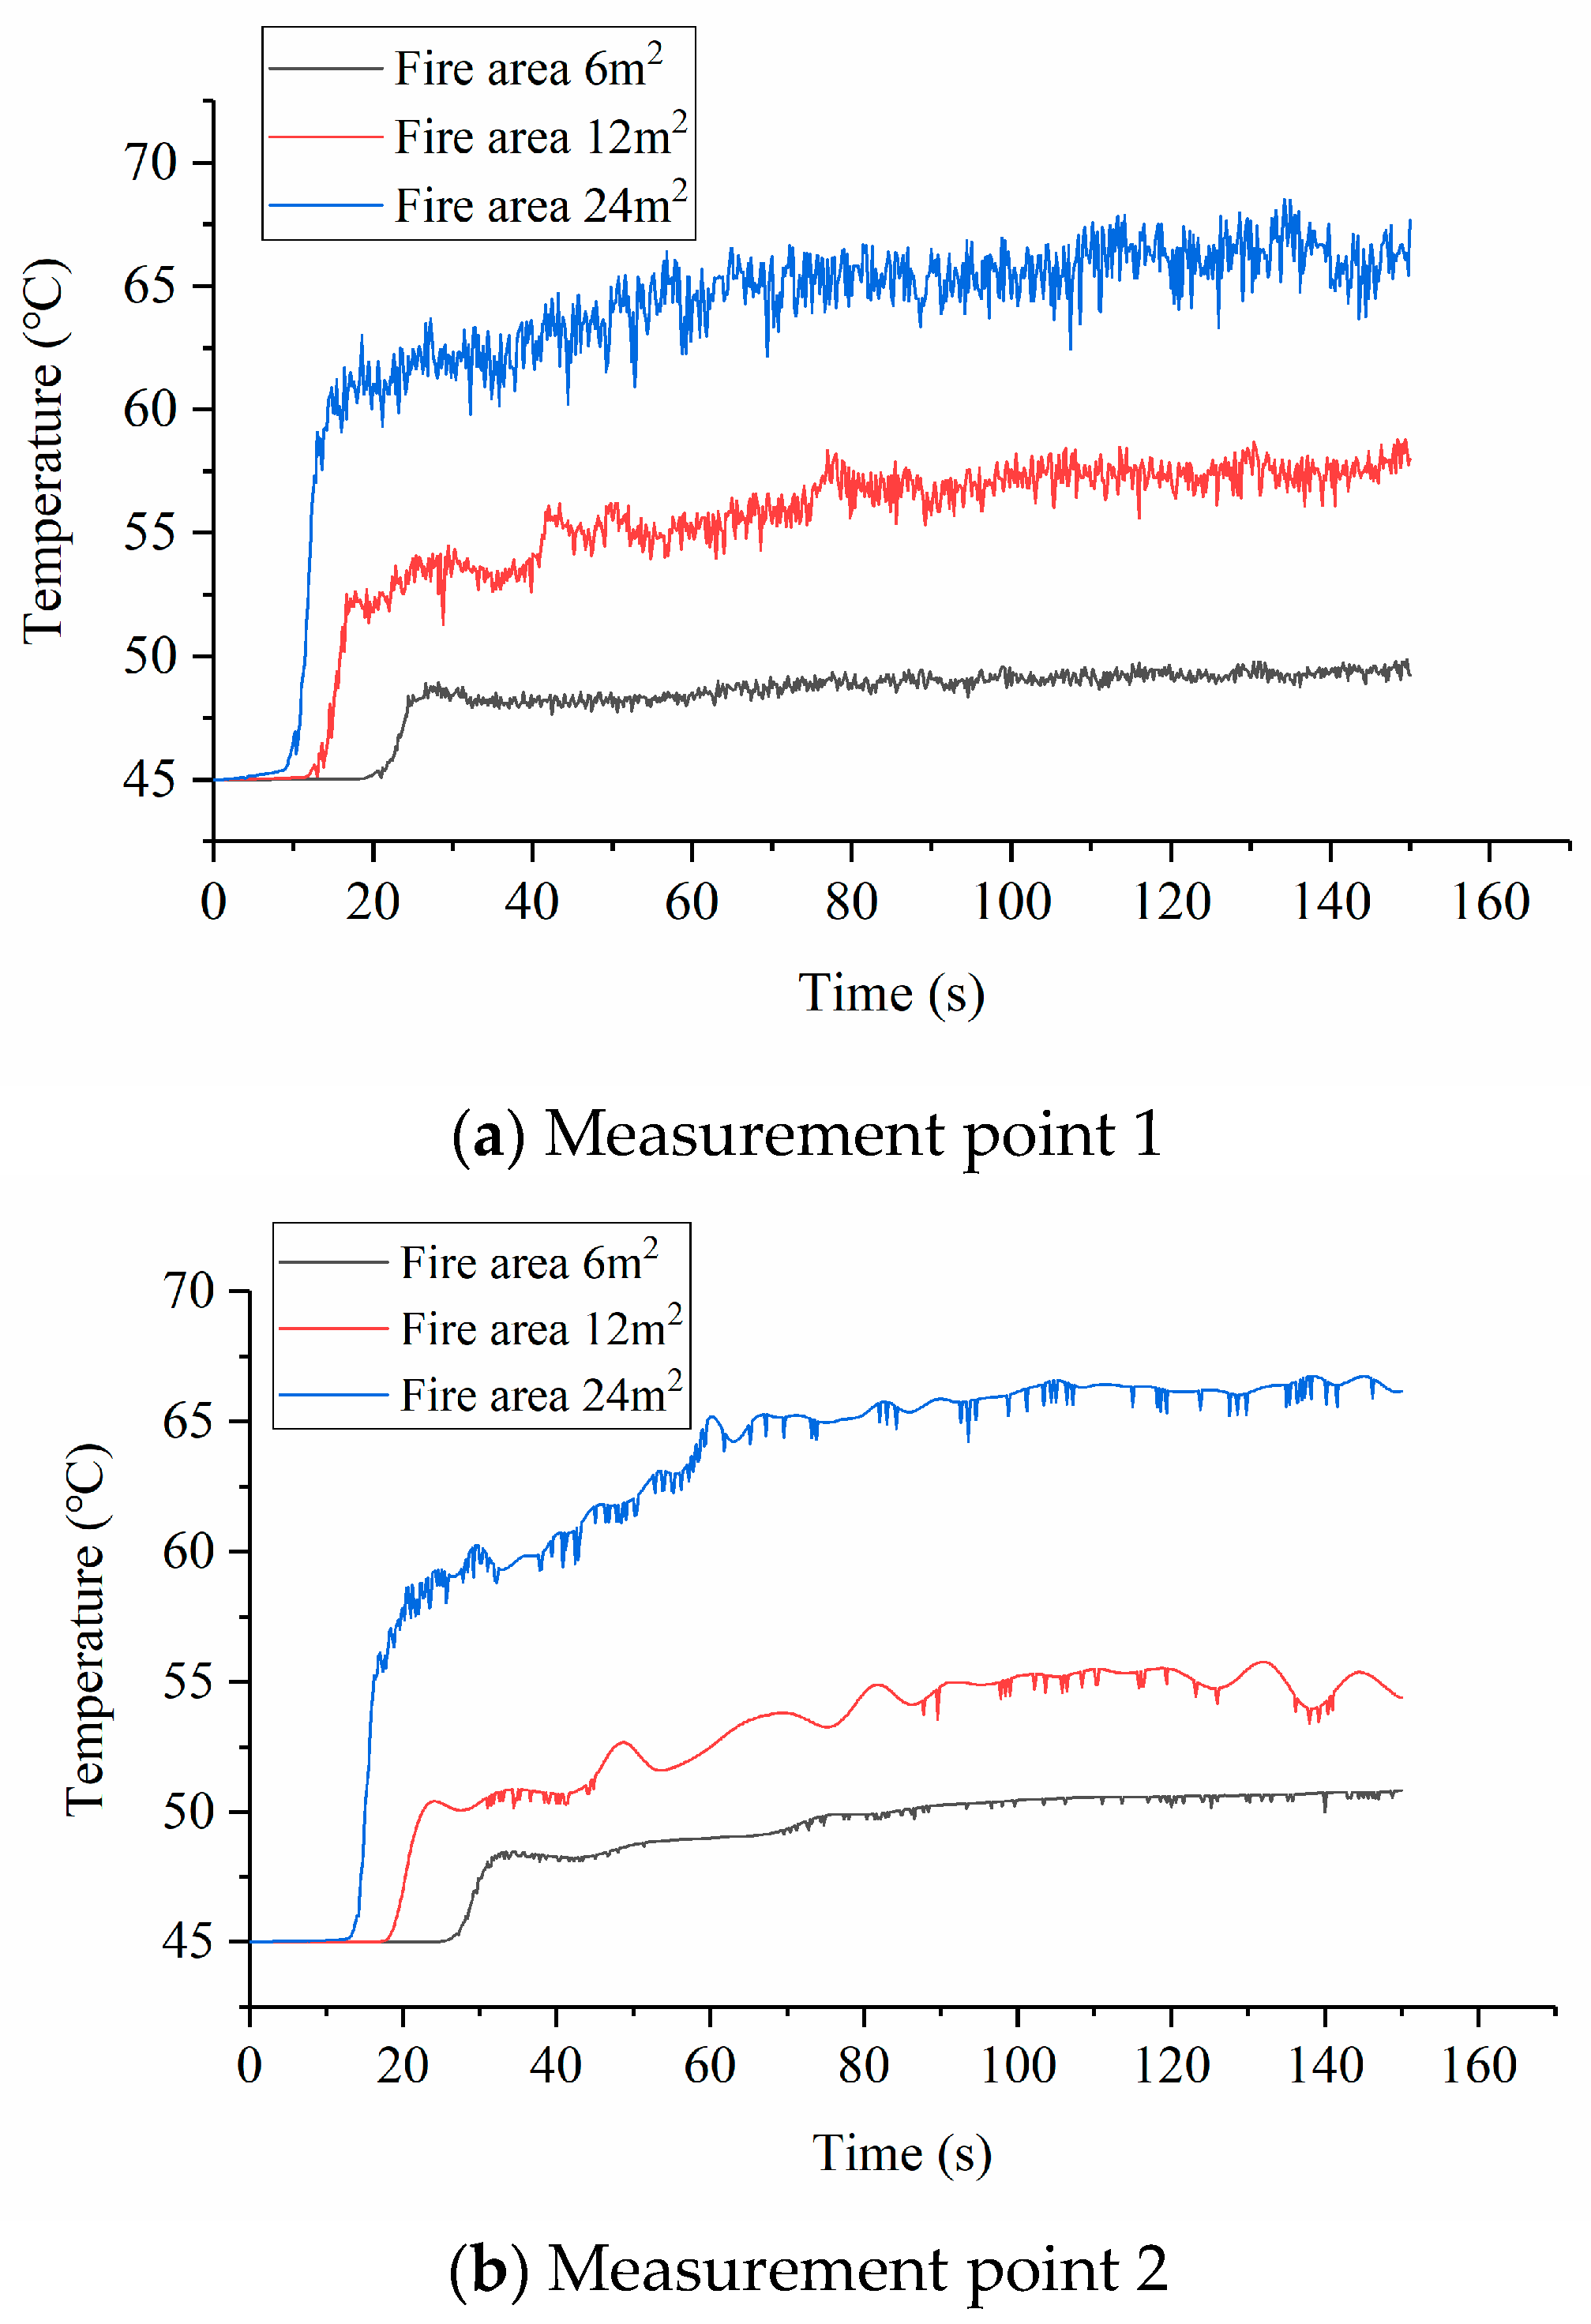
Three sizes of the pool fire area are simulated to study the effect of the pool fire area on the smoke dispersion and the temperature distribution, and they are 6 m2, 12 m2, and 24 m2, respectively. In these simulations, the ventilation situation is set as natural ventilation, and the fire position is set as the side of the main engine near the control room.
The simulated temperature curves at measurement points 1 and 2 are shown in
Figure 12a,b. It can be seen that when the fire area is 6 m
2, the temperature of the two measurement points begins to change at 20 s and 25 s. After experiencing a rapid heating period of about 5–10 s, the heating rate slows down. Finally, the temperature of measurement point 1 reaches around 52 °C, and the temperature of measurement point 2 reaches around 53 °C. In the temperature slices, it can be observed that compared to the fire area of 12 m
2, its spread speed is slower, the aggregation ability of temperature and smoke is weaker, and the overall temperature of the engine room is lower. When the fire area is 24 m
2, the temperature of the two measurement points begins to change at 10 s and 15 s. After experiencing a sharp heating period of about 5 s, the heating rate slows down, and finally, measurement points 1 and 2 stabilize at a similar temperature and stop increasing after about 67 °C. Compared to a fire area of 12 m
2, the spread speed is faster, the temperature and smoke accumulation ability are stronger, and the overall temperature of the engine room is higher.
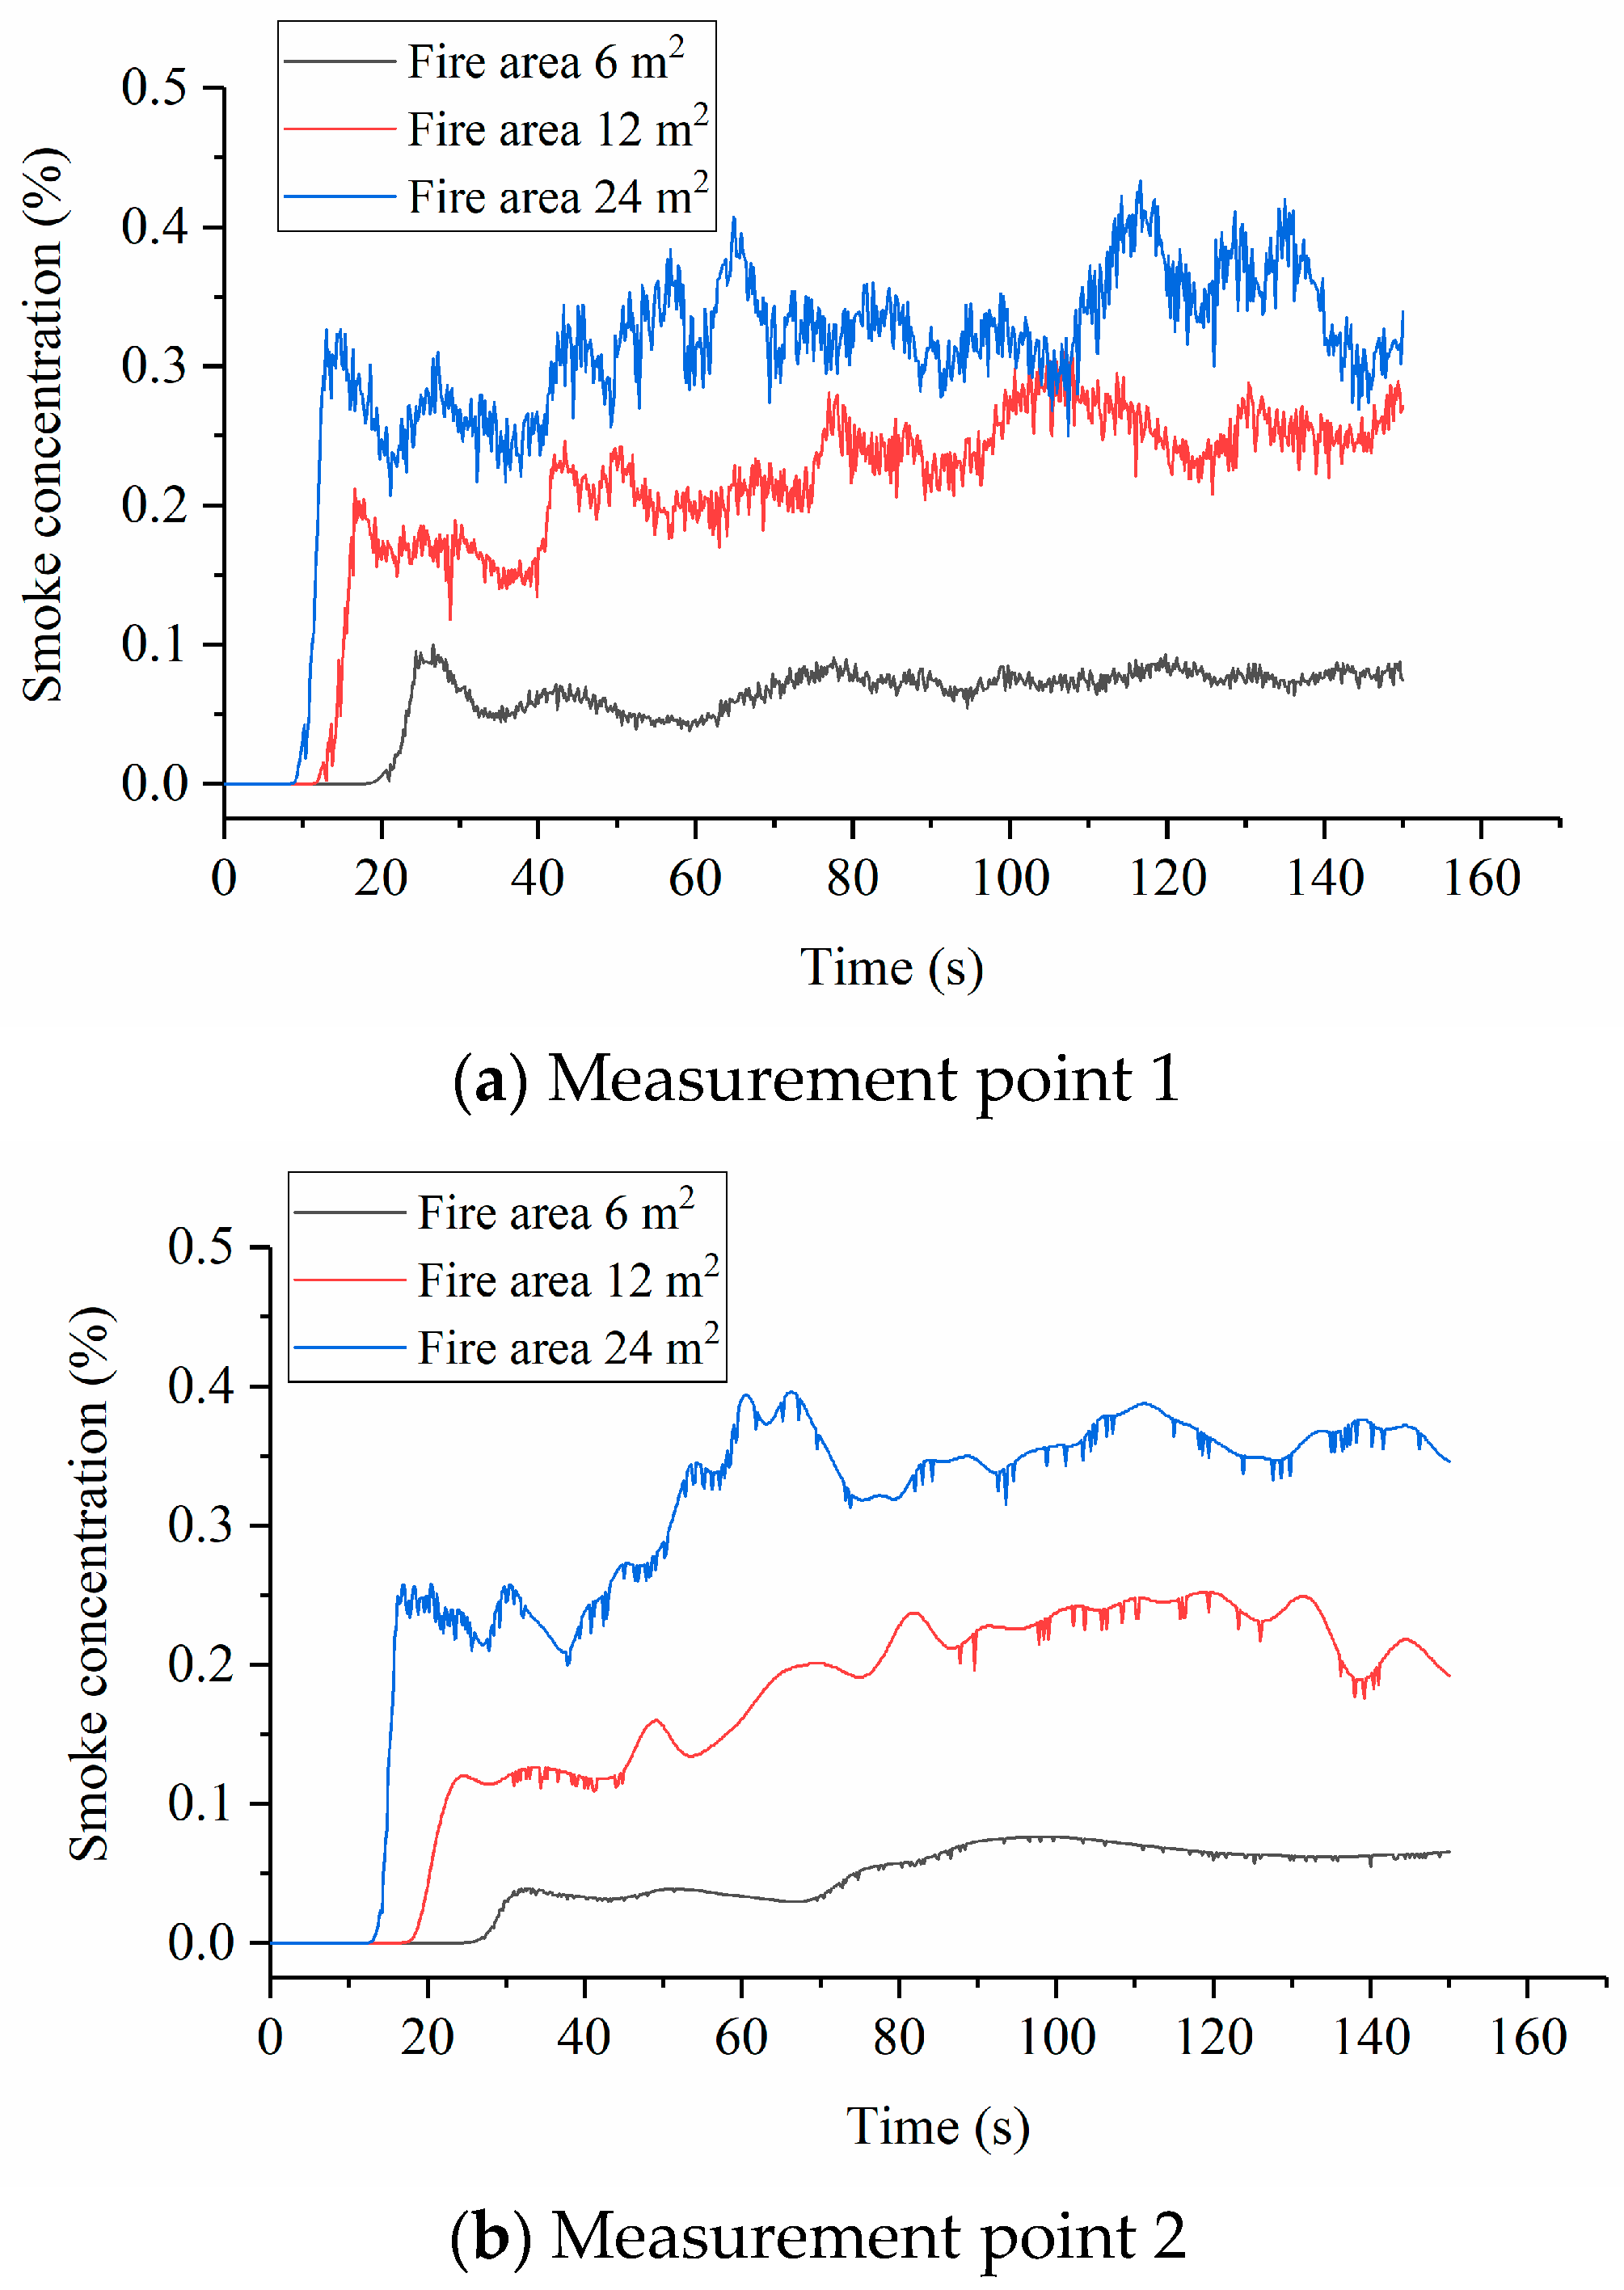
The simulated smoke concentration curves at measurement points 1 and 2 are shown in
Figure 13a,b. It can be seen that the changing trend of concentration is the same as that of temperature, but the smoke concentration at measurement point 1 reaches its peak after a sharp increase, which is followed by a sharp decrease. The smoke concentration of measurement point 2 has two stages of increase, the first from 25 s to about 30 s and the second from about 70 s to 100 s, and then decreases. When the fire area is 6 m
2, the smoke concentration of measurement point 1 stabilizes at around 0.08% and that of measurement point 2 stabilizes at around 0.065%. When the fire area is 24 m
2, the smoke concentration of measurement point 1 stabilizes at around 0.325% and that of measurement point 2 stabilizes at around 0.35%.
Comparing the temperature and smoke concentration curves of different fire areas shows that a larger fire area causes a higher temperature and smoke concentration in the control room and the escape exit during the fire. Under normal conditions, a larger diesel leakage area makes a larger fire area, but to reduce the harm of the fire caused by the leaked diesel, some measures can be taken to separate the leaked diesel and make the fire area less than the leakage area.
In this section, another pool fire position is considered in the simulation. The new fire is located on the starboard side of the main engine, near the main engine on the side near the oil storage tank. The ventilation situation is set as natural ventilation and the fire area is set as 12 m
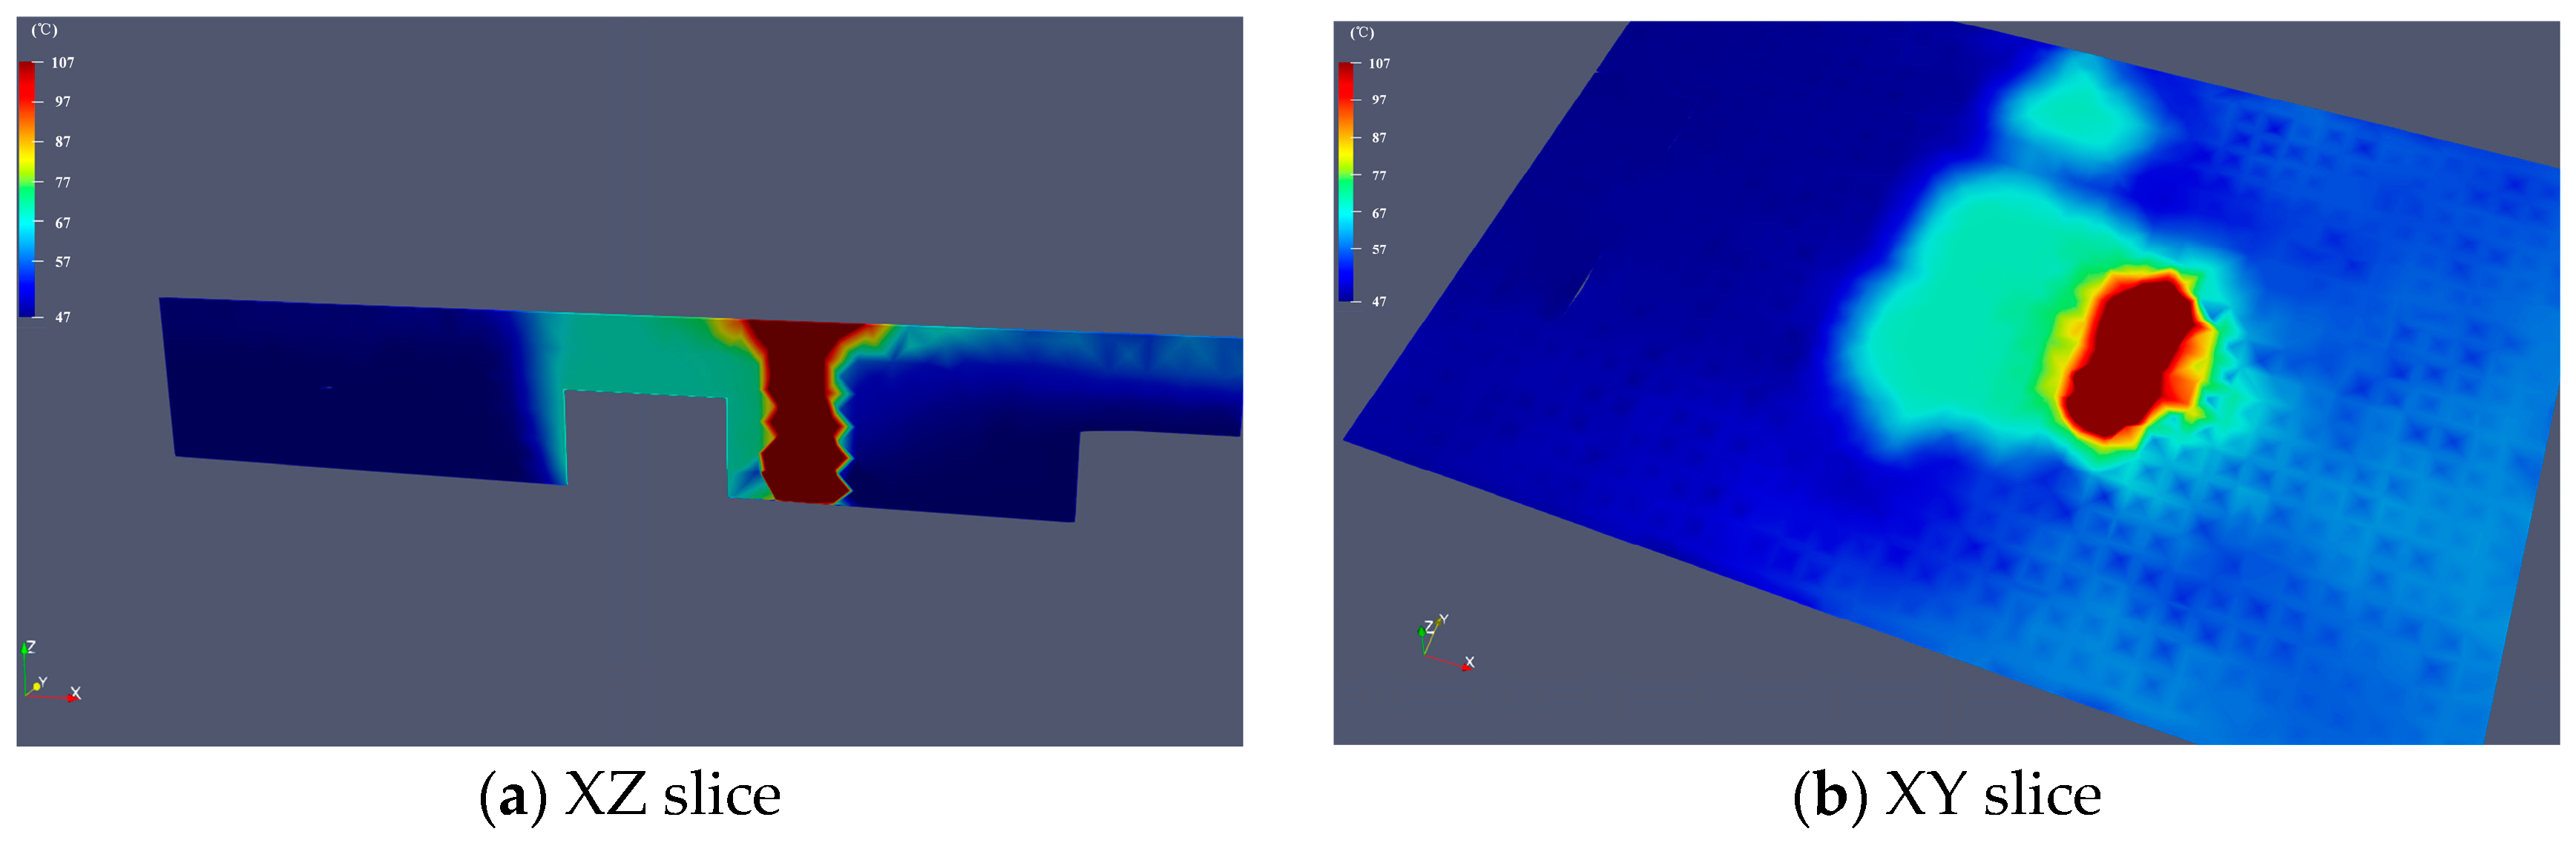
2 in this simulation. The simulated temperature slices of the new fire position are shown in
Figure 14. The temperature curves at measurement points 1 and 2 are shown in
Figure 15a,b. It can be seen that the difference between the two measurement points is relatively small, with similar starting heating times and intense heating stages, but different heating rates. Measurement point 2 heats faster than measurement point 1, and ultimately both remain stable at about 47 °C.
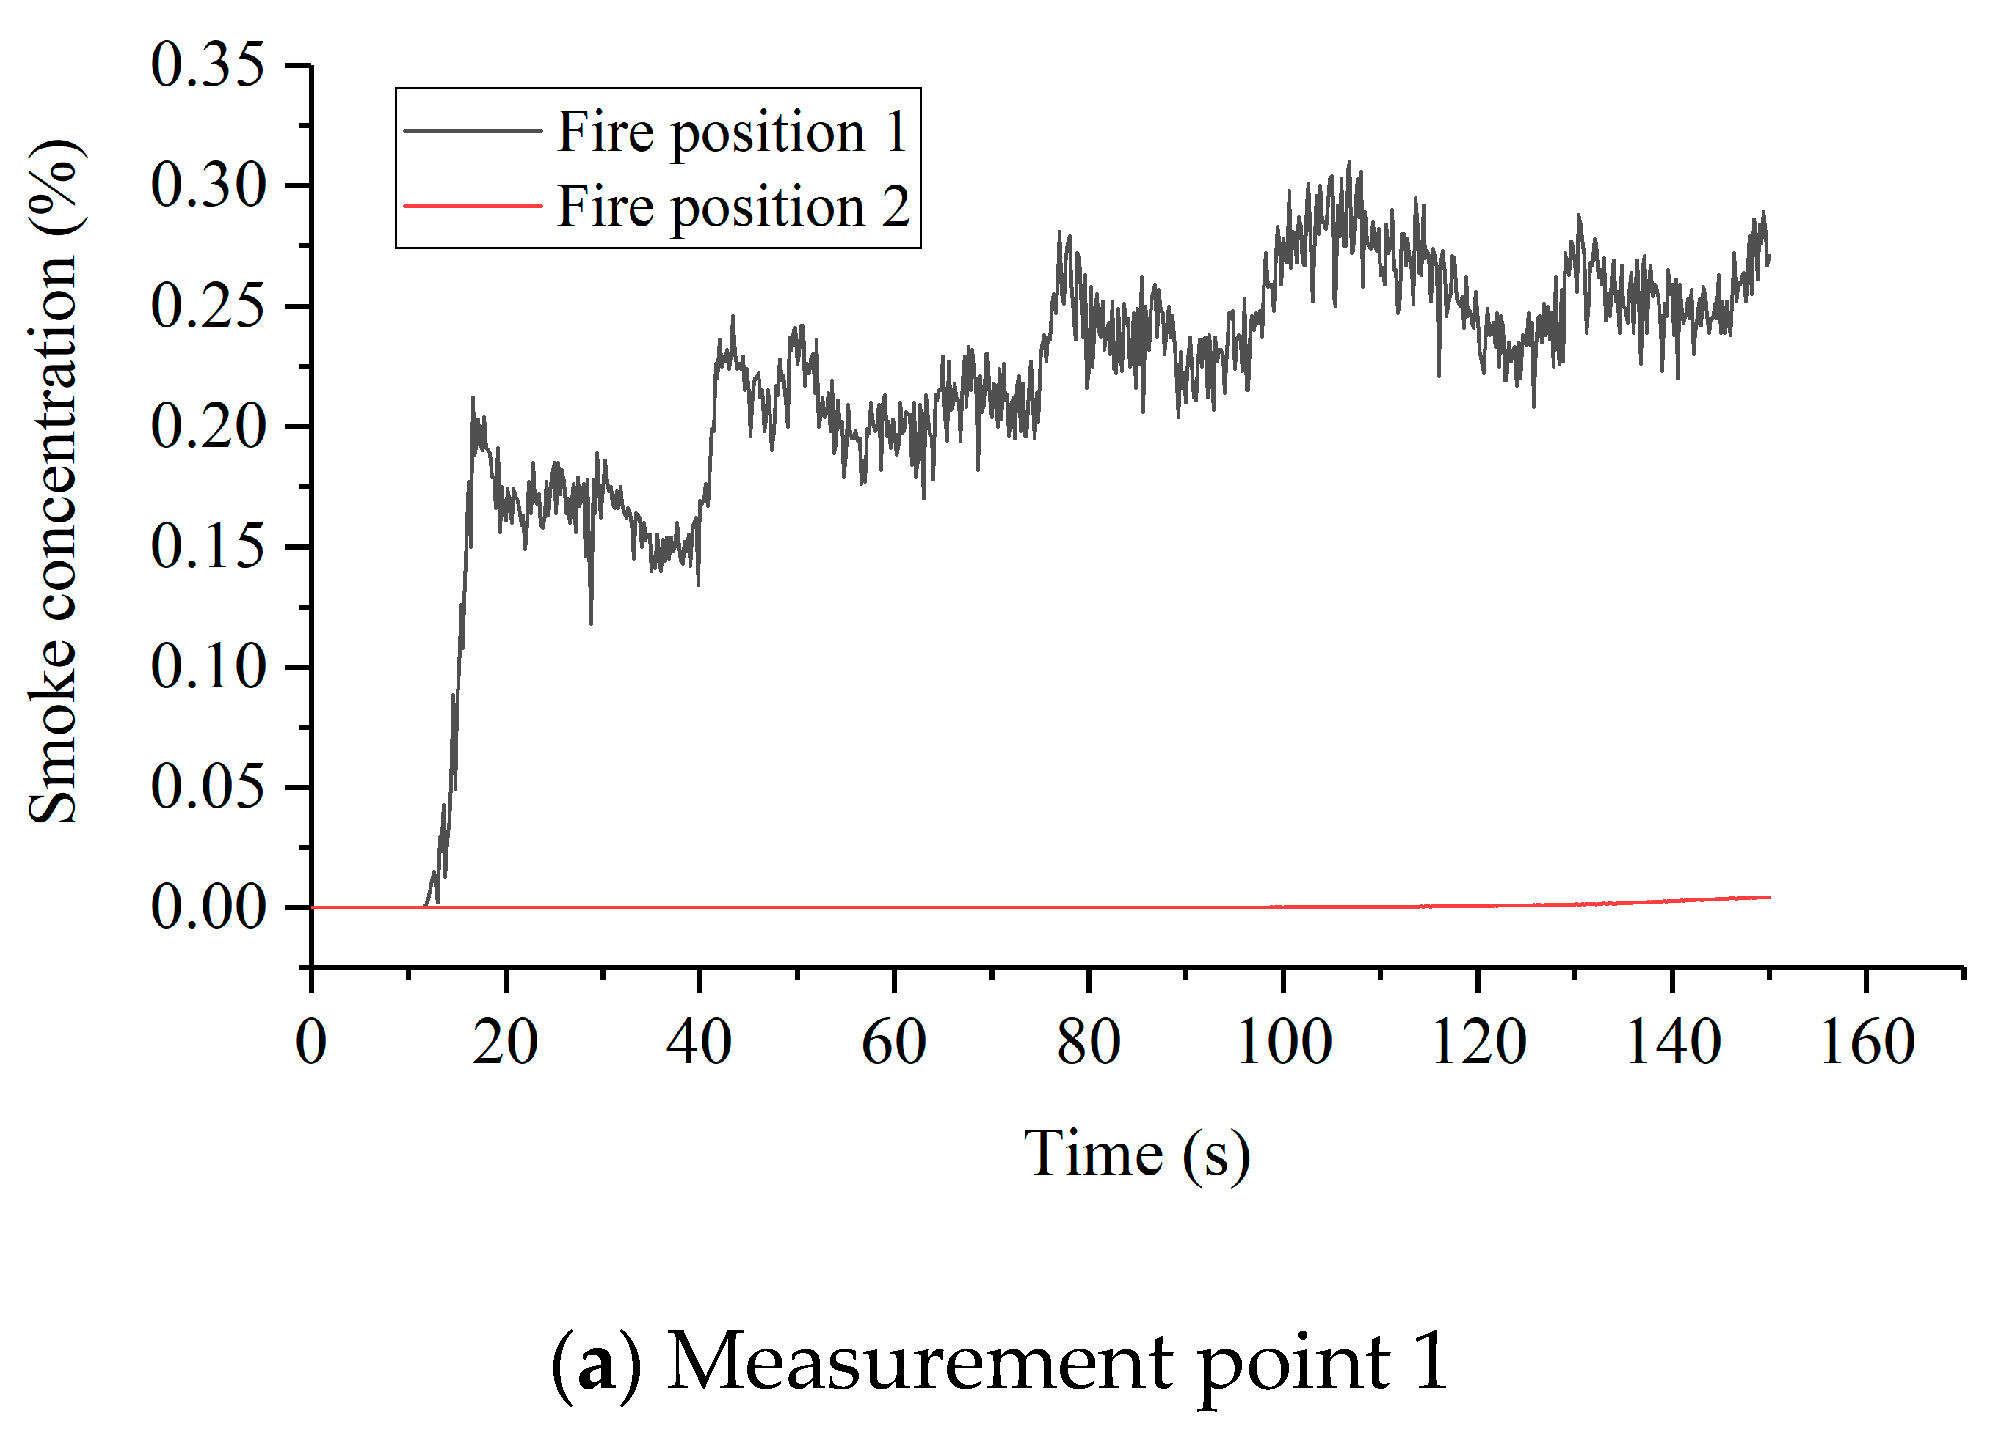
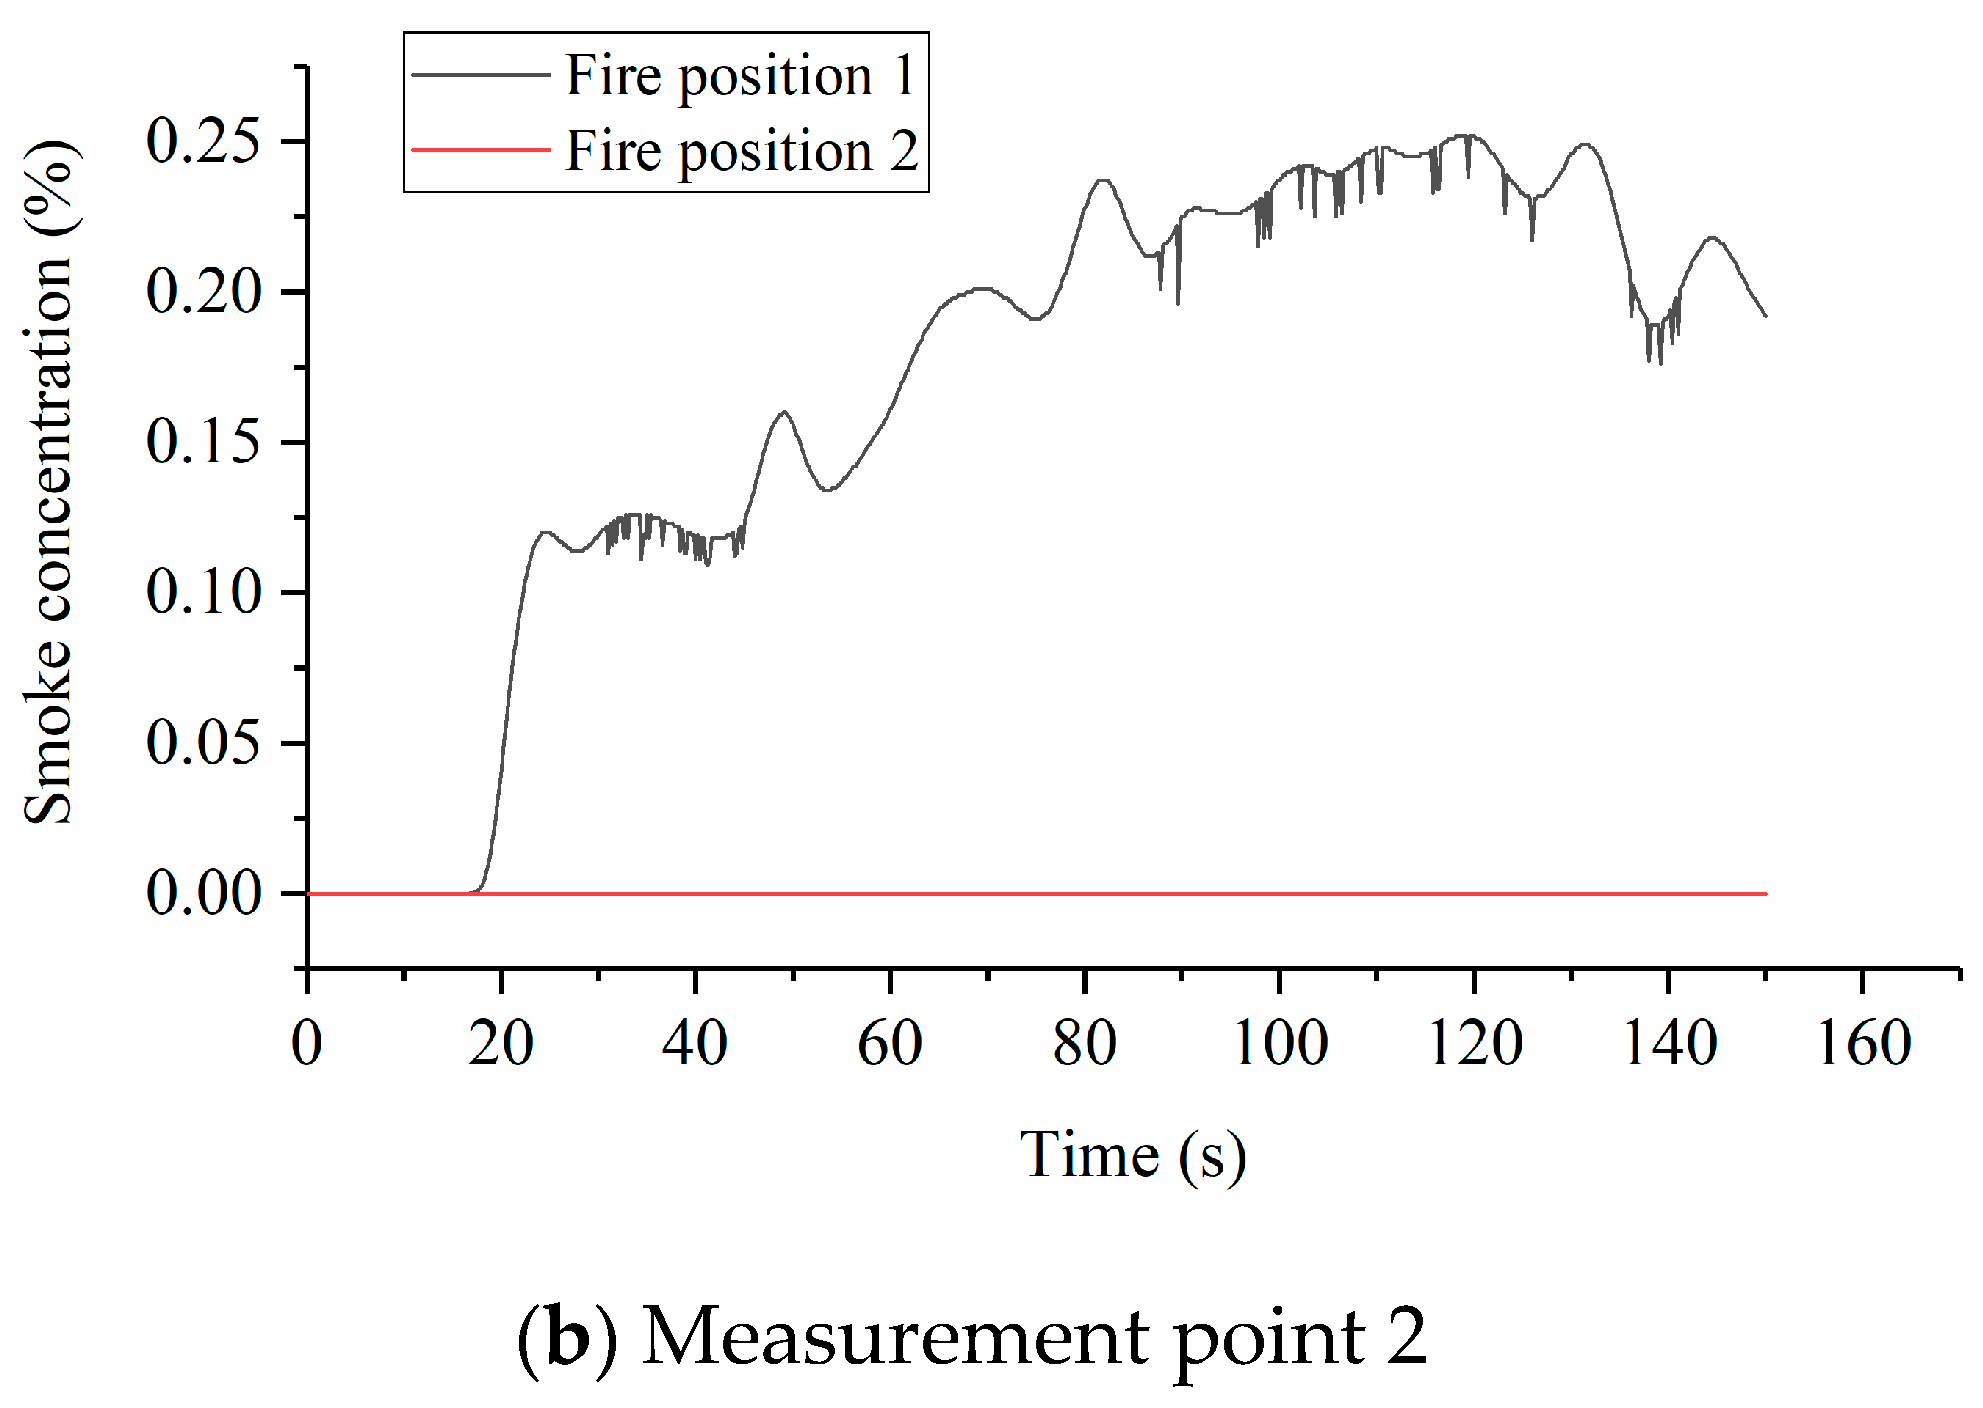
The simulated smoke concentration slices of the new fire position are shown in
Figure 16. The smoke concentration curves of different fire positions at measurement points 1 and 2 are shown in
Figure 17a,b. It can be seen that there is a significant difference in the smoke concentrations between the two measurement points. There is almost no smoke present at measurement point 2, and the smoke concentration of measurement point 1 begins to increase after about 80 s. Observing from the slices, it can be found that after changing the location of the fire, the spread of smoke and temperature was more inclined towards the area far away from the control room, while the concentration of smoke and temperature was lower in some parts of the control room.
Based on the above factor analysis and the comparison of data curves, it can be seen that for the control room, the influence of the fire position on the temperature distribution and the smoke dispersion is larger than the ventilation situation and the fire area, and the influence of the fire area is larger than the ventilation air velocity. The control room is a relatively enclosed space relative to the engine room as a whole, and it is far from the vents; therefore, the ventilation cannot have a significant impact on the airflow in the control room. This is the reason why the ventilation air velocity has a minimal influence on the temperature and smoke concentration in the control room compared to the other factors. The change in the fire area is the change of the fire scale, so its influence on the temperature and the smoke dispersion in the control room is linear, but the fire position affects the distance between the control room and the fire, so its change may cause a nonlinear influence on the temperature and the smoke dispersion. Furthermore, the scale of the engine room is not much larger than the fire scale, which means the distance between the fire and the control room will not be very large no matter where the fire is positioned. On the premise of this small distance, the changing of the fire position affects the temperature and the smoke dispersion intensely.
For the temperature and the smoke concentration near the escape exit, the fire position is also the biggest influencing factor, and the next is the fire area; the influence of the ventilation air velocity is the least. But, compared to the control room, the influence degree of the ventilation air velocity in the escape exit is larger than that in the control room. The reason for this situation is that the escape exit is located directly below one of the vents, and the airflow has a greater impact on the temperature and smoke concentration compared to the control room. The escape exit is closer to the location of the fire in space, and the inhibition effect on the heat transfer and the smoke dispersion is less than that of the control room.
In terms of overall temperature and smoke dispersion in the engine room, the highest temperatures and highest concentrations of smoke always gather at the top of the entire engine room. The dispersion modes of the highest temperatures and the highest smoke concentrations are similar in all kinds of conditions. They all spread faster towards the edge of the side where the ignition source is located, but slower towards the edge of the other side. The spread rate of the high temperature and high smoke concentration increases with an increase in the fire area. Ventilation air velocity only affects the temperature and smoke dispersion at the ventilation outlet. As the ventilation air velocity increases, the aggregation degree of smoke and temperature decreases. The fire position affects the spread trend of temperature and smoke in the entire engine room.
The smoke dispersion and temperature distribution in ship engine room fires are studied based on OpenFOAM in this paper. However, there are still the following limitations in this study: (a) In reality, the physical process of a fire caused by liquid fuel is the combustion of the fuel accompanied by its flow. This simulation did not consider the flow process of the fuel on the ground, which may result in some errors between the simulation results and the actual fire process. (b) Fires caused by fuel leakage in ship engine rooms may lead to explosions during the development process. The numerical simulation model in this paper cannot yet simulate fuel explosions. (c) In this simulation, the automatic fire extinguishing system in the ship’s engine room was not considered, and the automatic fire extinguishing system can also have a significant impact on temperature and the smoke diffusion process.
7. Conclusions
The applicability of the fire dynamics solver buoyantReactingFOAM in simulating ship-engine-room-scale fires is validated by comparing it with the experimental data. The simulation results agree well with the experimental data, even though there are some differences between them in the initial stage. These differences are reasonable because of the response time of the temperature sensor in the experiment. The increasing rate of temperature in the initial stage of the fire is very large, which makes the measured data have a delay from the true temperature. When the increasing rate of temperature reduces, the differences vanish.
The highest temperatures and highest concentrations of smoke always gather at the top of the engine room. The dispersion modes of the highest temperatures and the highest smoke concentrations are similar in all kinds of conditions. They all spread faster towards the edge of the side where the ignition source is located, but slower towards the edge of the other side.
For both the control room and near the escape exit, among the factors of fire position, fire area, and the ventilation situation, the fire position affects the temperature distribution and the smoke dispersion most significantly, followed by the fire area, while the ventilation situation has the least influence on these factors. But, compared to the control room, the influence degree of the ventilation air velocity in the escape exit is larger than that in the control room.
The fire position affects the spread trend of temperature and smoke in the entire engine room. With an increase in the fire area, the spread rate of high temperature and high smoke concentration increases. With an increase in the ventilation air velocity, the aggregation degree of smoke and temperature decreases, but its decreasing range is very small when the ventilation air velocity is larger than 2 m/s.
The simulation in this paper focuses on the engine room of large bulk carriers, but different types of ships also have significant differences in engine room structures due to their different functions, which are reflected in the size of the engine room, as well as the relative positions of the main engine, auxiliary engines, control rooms, and escape exits. In addition, since ships are custom-made products, the engine room structure of ships of the same type may not be the same. The simulation results in this paper cannot be directly applied to other types of ships, but they can still provide a reference for the research of most ship engine room fires, as ship engine rooms are mostly multi-layer structures, including the main engine, auxiliary engines, control rooms, and escape exits, and the leakage of onboard fuel is also an important cause of engine room fires. In addition, the buoyantReactingFOAM solver provides a useful tool to study ship engine room fires; different geometric models can be established based on different kinds of ship engine rooms, and this solver can be used to study their fire development processes.


