Article

Long-Term Geospatial Observations of the Drang Drung and Pensilungpa Glaciers, North Western Himalaya, India, from 1976 to 2020

by
Avtar Singh Jasrotia
1,2,*,
Suhail Ahmad
1,
Praveen Kumar Thakur
3,
Qamer Ridwan
4,
Zishan Ahmad Wani
5,
Saad Abdurahamn M. Alamri
6,
Sazada Siddiqui
6 and
Mahmoud Moustafa
6
1
Department of Remote Sensing and GIS, University of Jammu, Jammu 180006, India
2
Department of Geology, University of Jammu, Jammu 180006, India
3
Water Resources Division, Indian Institute of Remote Sensing, 4-Kalidas Road, Dehradun 248001, India
4
Applied Ecology Lab, Department of Botany, Baba Ghulam Shah Badshah University, Rajouri 185234, Jammu and Kashmir, India
5
Conservation Ecology Lab, Department of Botany, Baba Ghulam Shah Badshah University, Rajouri 185234, Jammu and Kashmir, India
6
Department of Biology, College of Science, King Khalid University, Abha 61413, Saudi Arabia
*
Author to whom correspondence should be addressed.
Sustainability 2023, 15(20), 15067; https://doi.org/10.3390/su152015067
Submission received: 20 September 2023 / Revised: 5 October 2023 / Accepted: 11 October 2023 / Published: 19 October 2023
(This article belongs to the Section Sustainability in Geographic Science)

Abstract

:
Drang Drung and Pensilungpa are neighbouring glaciers in the western Himalayas, sharing the same meteorological conditions and climate zone. The Drang Drung glacier is a clean glacier, whereas the Pensilungpa glacier is notable for its considerable accumulation of debris. The present study explores the topographical features of the Drang Drung and Pensilungpa glaciers and investigates how topography affects their response to climate change. Additionally, a comparison is made between these glaciers with others in the basin to assess their representativeness of the region. The study utilized Landsat Imagery and ASTER GDEM data from 1976 to 2020. The results revealed that the mean accumulation area ratio (AAR) for Drang Drung and Pensilungpa was 54% and 49%, respectively, during this period. Drang Drung has lost 8.16 km2 (10.73%) of its area, while Pensilungpa has lost 2.25 km2 (9.84%) of its area. The debris cover of Pensilungpa increased from 1.86 km2 in 1976 to 2.32 km2 in 2020, whereas the debris cover area of Drang Drung has increased comparatively more, from 4.01 km2 to 4.76 km2. Within the same time frame, the snowline altitude (SLA) shifted upward by an average of 104 m and 88 m for Drang Drung Pensilungpa, respectively. Further, our findings revealed a substantial connection between the size of glaciers and the speed at which their area is diminishing. The mean slope was identified as a key factor in influencing the rate at which the area is lost, and the retreat rates of the glaciers. The reduction in glacial area, increased debris coverage, and changes in SLA are key indicators of ice volume loss under prevailing climatic conditions. The present study recommends that long-term field-based data and the incorporation of multi-temporal satellite imagery are crucial to mitigate uncertainties in detecting changes in Himalayan glaciers. These approaches would contribute to a more accurate understanding of glacial changes, and would aid in forecasting future scenarios considering ongoing global warming trends.

1. Introduction

The Himalayan glaciers host one of the most extensive ice concentrations outside the polar region, covering an area of 40,000 km2 in the entire Himalayas, including Karakor [1]. The Himalayan meltwater streams provide water for irrigation, hydropower, drinking, sanitation, and manufacturing, supporting 750 million people and the economies of the neighbouring nations [2]. Due to the ongoing impact of climate change, glaciers could undergo changes in their annual mass balance, length (measured by shifts in snout positions), area coverage, and volume. The majority of glaciated basins in the Himalayas are situated in remote regions, which hinders the collection of field data for many of these glacial parameters, particularly mass balance. Such scenarios typically interpret changes in the length and area of glaciers as a reaction to climate change [3,4]. The use of multispectral and multitemporal optical satellite data for glacier mapping and monitoring, particularly their retreat, is well established [5,6]. Therefore, using remote satellite imagery in conjunction with field-based glacier monitoring and research is ideal. However, care must be taken when interpreting the right signals from these indicators, because the quantity of debris that covers glaciers can greatly affect how they respond [7]. Furthermore, it is crucial to take into account the response time of glaciers when connecting their fluctuations to climate change.
Researcher have examined changes in glaciers while taking a variety of factors, including glacier area, length, snout elevation, glacier slope, aspect, and altitudinal range, in account, and also applying spatial correlation [8,9,10,11]. According to these findings, smaller, steeper glaciers have shrunk more quickly than larger, softer glaciers. Additionally, certain studies are dedicated to examining the influence of debris cover on glacier variations, encompassing frontal shifts, changes in area coverage, and alterations in volume [12,13,14]. According to these studies, glaciers with debris cover experienced minor frontal changes and a real shrinkage, whereas clean glaciers experienced higher retreat rates (8–19 ma−1) and areal shrinkage (13–15%). O’Neal et al. [15] have identified shifts in the area’s extent, and assessed its spatial correlations with the North Cascades glaciers.
If climatic change is the primary driving factor behind glacier changes, the controlling factors affecting those changes include glacier topographical characteristics. In addition to the variation in glacier recessional rates, glacial terrain has a significant impact on glacier dynamics [16]. A glacier’s hypsometry (relationship between area and height), which regulates the amount of solid-to-liquid precipitation in a basin, is another important factor, and is crucial for how the terminus reacts to changes in ELA [17]. Moreover, it has been demonstrated that glaciers with different hypsometry at their termini respond differently to similar climatic influences, underscoring the essential role of geometry in governing glacier behaviour. This aspect warrants thorough consideration when evaluating glacier variations in the context of ongoing climate change [18]. Fountain et al. [19] investigated representativeness of benchmark glaciers and attempted to comprehend the diversity in the response of two glaciers by analysing their topographic and hypsometric characteristics to assess their climatic response through the examination of their accumulation area ratios (AAR). Glacier mass balance serves as the direct and unaltered response of the glacier to climate change, and the accumulation area ratio (AAR) can serve as a proxy for mass balance [20]. Consequently, by assessing the variation in the AAR value, we can infer the variability in climatic factors such as temperature and precipitation. Thus, it is important to estimate and monitor key glacier parameters to better understand how glaciers behave differently when covered in various degrees of debris. The present study focuses on the monitoring of two adjacent glaciers in Ladakh (the Drang Drung and Pensilungpa glaciers), India, and investigates how topography affects their response to climate change, India. The study investigates several key parameters like length, area, accumulation area ratio (AAR) and snow line altitude (SLA) along with debris cover area. Additionally, a comparison is made between these glaciers with other glaciers in the basin to assess their representativeness for the region. The present study highlights the pattern of glacier retreat and the importance of topographical influence on glacier health, both of which play a critical role in ensuring the sustainability of the basin.

2. Materials and Methods

2.1. Study Area

The present research focused on the Drang Drung and Pensilungpa glaciers in India’s Greater Himalayan Zanskar region, Ladakh. Zanskar is a high-altitude, cold, arid area with 250 mm of yearly precipitation that is located on the Great Himalayan Mountain range’s northeastern flank [21]. The Pensi-La pass (4454 m a.s.l) is home to the Drang Drung (30°46′ N and 76°18′ E) and Pensilungpa glaciers (33°49′ N and 76°17′ E), which are situated in the SE and SW directions, respectively (Figure 1). The Doda River originates at an elevation of 4121 m a.s.l and follows a southeastward course, deriving its waters from the Drang Drung glacier. It serves as the largest tributary of the Zanskar River, which in turn is a tributary of the Indus River. The Doda River collects meltwater from a total of 697 glaciers, encompassing approximately 1080 km2 of glacierized terrain. Among these glaciers, the most prominent is the Drang Drung Glacier, which stretches for 23 km in a northeast-facing direction and covers an area of about 72 km2. With an average slope of around 6°, the Drang Drung Glacier belongs to the composite valley-type glacier category. Its accumulation zone exhibits a wide and gradual slope, while the ablation zone is comparatively narrower. The glacier is marked by well-preserved lateral and recessional moraines, serving as evidence of its changing behaviour and previous extent.
The Suru River, which is a tributary of the Indus River, starts its journey from the Pensilungpa Glacier, situated at an elevation of 4670 m a.s.l. The Suru Basin, sustained by 252 glaciers spanning an area of 481 km2 accounts for approximately 11% of the entire basin area [22]. The Pensilungpa glacier, with a length of 8 km and a surface area of 16 km2 (including its tributary glaciers), is a significant contributor to the glaciated region. Approximately 17% of the glaciated region is characterized by layers of varying debris thickness constituting around 30% of the ablation area. The Pensilungpa glacier descends from the southwest with an average slope of 8°, and reaches its end at an elevation of approximately 4670 m a.s.l while flowing northward. There are notable features such as crevasses, ice cliffs, and small supraglacial ponds within the glacier’s ablation zone.

2.2. Field Data

To validate the results obtained from remote sensing, fieldwork was conducted on the glaciers from June to October in 2019 and 2020. A Differential Global Positioning System (DGPS) was utilized to collect field-based data (Figure 2). As part of the study, the glaciers’ morphology was measured, which included determining the exact point locations of debris thickness. The Leica DGPS CS10/15 system offers high accuracy in mountainous terrain, with horizontal and vertical precision reaching < ±1 cm.

2.3. Remote Sensing Datasets

The main data sets used were ASTER Global Digital Elevation Model (GDEM) (version 2), SRTM Digital Elevation Model (DEM) (V3), and multi temporal satellite data from Landsat’s Multispectral Scanner (MSS), Thematic Mapper (TM), Enhanced TM Plus (ETM+), and Operational Land Imager (OLI) sensors for different years (1976, 1980, 1990, 2000, 2010, 2015, 2020) (Table 1). Surface reflectance data from the sensors for August and September were acquired from Earth Explorer (http://earthexplorer.usgs.gov/) (accessed on 15 November 2022). These months were specifically chosen as they represent the peak ablation period in the study area, with minimal seasonal snow cover, fully revealing the snout and the permanent snow cover. To ensure accurate observations, preference was given to cloud-free landscapes, as clouds can obscure glaciers, and their shadows may obscure the distinction between snow lines and glacier boundaries. Comprehensive specifications for each Landsat sensors are accessible at: http://landsat.gsfc.nasa.gov/about/technical.html (accessed on 20 November 2022).
The utilization of sensors aboard Landsat satellites has been extensive in various measurements, including the mapping of glacier facies [23], glacier monitoring [24,25], the monitoring of snow line elevation [26], and assessing glacier dynamics [27,28].
Here, Snowline Altitude (SLA) values and snout elevation were retrieved mainly from ASTER GDEM, the source of elevation data. The NASA (National Aeronautics and Space Administration) of the United States and the Ministry of Economy, Trade, and Industry of Japan both issued this model (http://www.jspacesystems.or.jp/ersdac/GDEM/E/index.html (accessed on 20 November 2022)). Over the period from 2000 to 2020, several ASTER images were merged to generate ASTER GDEM data with a vertical accuracy of 17 m (p < 0.05) and a horizontal resolution of 30 m covering the study area, similar to the spatial resolution of the satellite data utilized in the study [29]. ASTER GDEM has additionally been used effectively in numerous earlier studies for SLA extraction and other cryosphere studies [30].

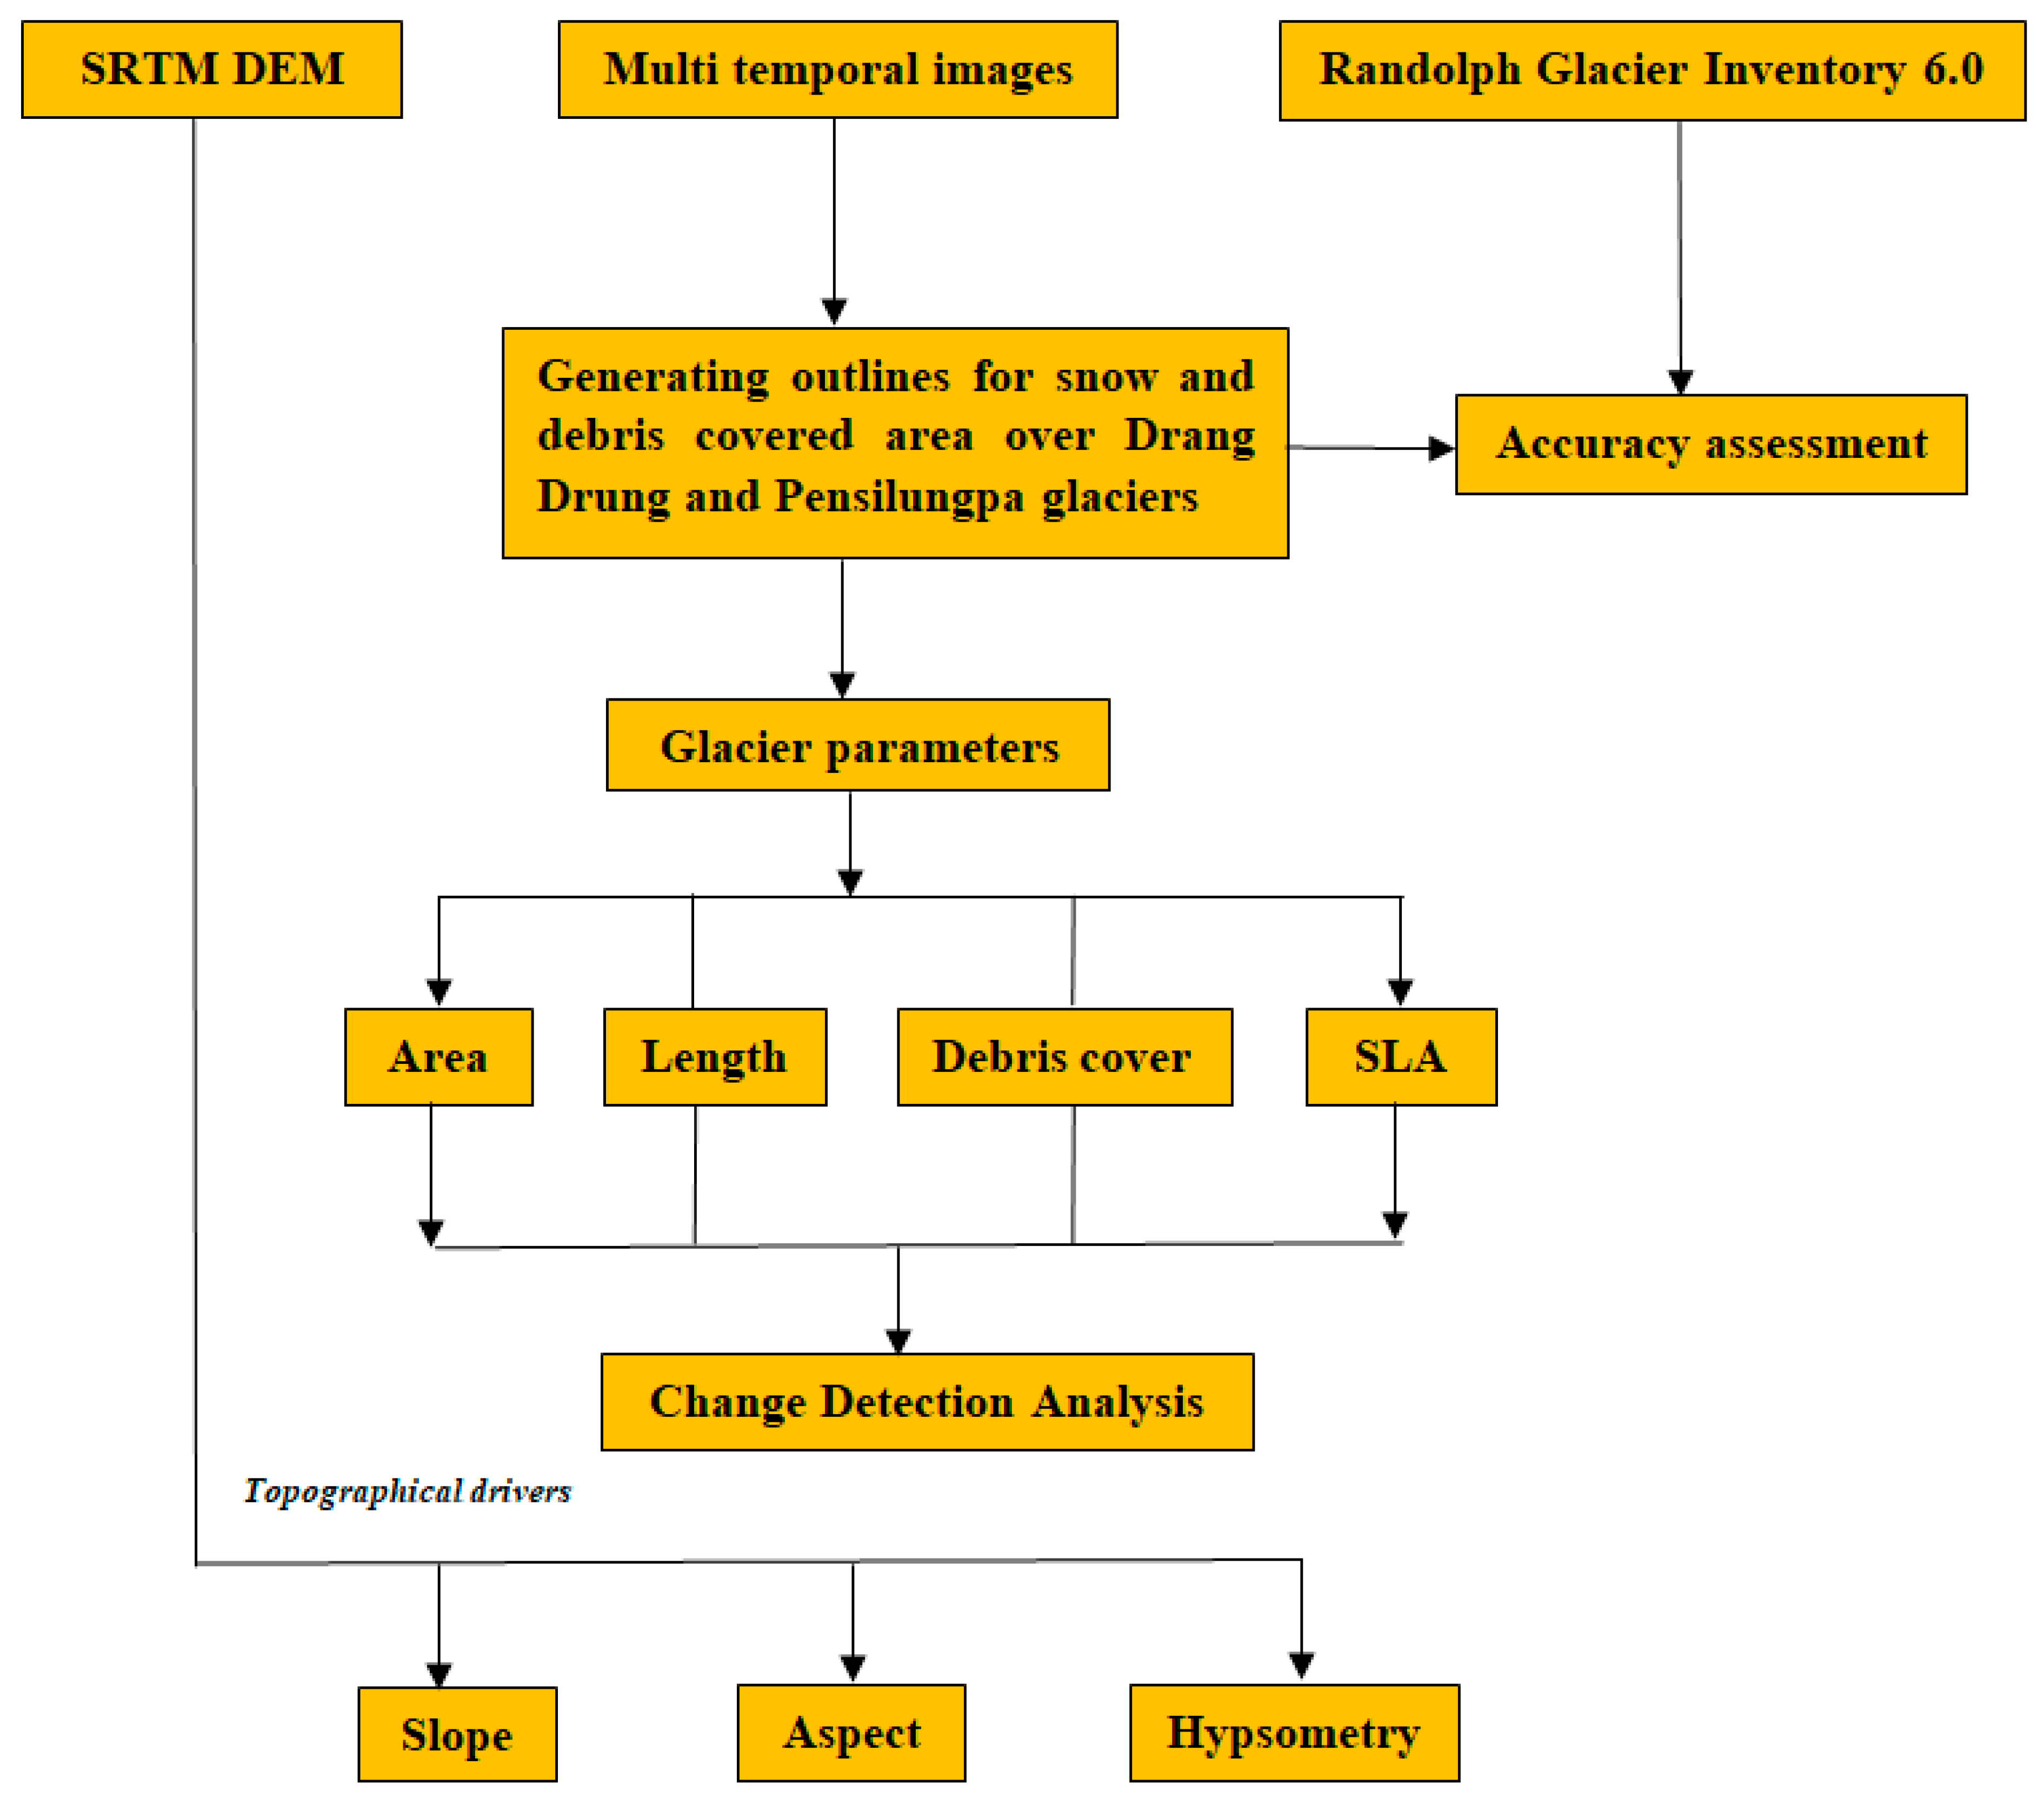
2.4. Methodology Adopted

Several established remote sensing techniques were used to extract the studied glacier parameters, including area, length, debris cover, and SLA. Firstly, all the satellite images utilized in the study were co-registered using the Landsat 8 image of the year 2020 as a base image. Based on the variance between the glacier ice and the environment, the glacier boundaries were identified, and the digitization process was carried out manually to produce precise and accurate results [31]. Digitization was facilitated through the use of different false-colour composites (FCCs) [4]. The upper glacier boundary is determined based on the study period, considering that minimal changes are anticipated in this region [22]. The glacier snout positions are extremely important, and were meticulously marked, taking into account features like ice cliffs, snout walls, and the source of the stream [14,25]. To calculate the shift in glacier area between 1976 and 2020, the boundaries of glaciers for different times were compared. The debris cover area of the glaciers was manually delineated for various years using FCCs satellite images. The topographic features (e.g., mean slope, aspect, hypsometry AAR) were extracted directly from the glacier polygons [32].
The change in glacier length or glacier retreat is measured using an accepted technique wherein strips are drawn parallel to the central flow lines at 50 m intervals. The change is calculated by averaging these strips [33,34]. The equilibrium line altitude is thought to be equivalent to the snowline altitude (SLA) for the peak ablation period [35]. The average altitude of the digitized snowlines was determined from the ASTER GDEM by creating a one-pixel buffer around them [35]. The variation in snowline altitude (SLA) was calculated using two methods: (a) directly comparing temporal SLAs, and (b) averaging the SLA variation between successive mapping years [36]. Figure 3 shows the framework of the methodology adopted in the present study.

2.5. Uncertainty Estimation

Uncertainties may have been included during the extraction of a few selected factors, because the research uses temporal data from numerous sources [37,38]. Quantification of errors is therefore required to confirm the validity and importance of the findings [4]. By using the buffer technique, ambiguity in the area estimation was identified [11]. Because only one side can be impacted by the shift, the buffer size was set to be half of the expected shift brought on by mis-registration (<1 pixel). The area uncertainty for the Drang Drung glacier varies from ±1.22% to ±2.66%, with an average of ±1.94%. For the Pensilungpa glacier, the area uncertainty ranges from ±1.13% to ±3.43%, with an average of ±2.28%. This uncertainty in area measurement is influenced by both the sensor resolution and the co-registration error, which collectively contribute to the positional uncertainty or the length-related uncertainty [39]. The estimation of uncertainty ‘U’ in length is based on the equation proposed by Hall et al. [39].
U n c e r t a i n t y = x 2 + y 2 + E
Table 2 displays the uncertainties added to the length change estimation for various periods. The uncertainty arising from the debris cover was assessed based on the glacier boundaries for different study periods. The debris cover was defined within these glacier boundaries to quantify the uncertainties accurately. The uncertainties in SLA are quantified as ±10 m in the vertical direction, which is equivalent to the vertical accuracy of the DEM, and ±15 m in the horizontal direction, corresponding to the buffer size employed (0.03 ± 1.8%).

3. Results

3.1. Area Changes

During the span of research from 1976 to 2020, the Drang Drung and Pensilungpa glaciers experienced a reduction in their areas. Specifically, the Drang Drung glacier lost 8.16 km2, which represents a decrease of 10.73%, The coefficient of variation for this loss was 4.47. On the other hand, the Pensilungpa glacier saw a reduction of 2.25 km2, accounting for a 9.84% decrease with a coefficient of variation of 5.47. Consequently, the findings unequivocally demonstrate that the area loss of the Drang Drung glacier is higher than that of the Pensilungpa glacier, and during the time of the investigation, both glaciers steadily lost area. On the decadal time scale, a substantial fluctuation is seen. The glaciers experienced maximum area loss (Drang Drung: 10.14%; Pensilungpa: 10.39%) during the period 1976–2000. Overall, the findings show a very diverse trend in area loss in both glaciers over the course of the study (Figure 4).

3.2. Length Changes

Throughout the research period, both glaciers receded at varying speeds (1976–2020). The Drang Drung and Pensilungpa glaciers retreated by 812.36 m and 206.70 m during the period of 44 years (1976–2020). The Drang Drung glacier exhibited significantly greater terminus retreat compared to the Pensilungpa glacier. Both glaciers displayed continuous retreat over the decades, but the rates of retreat showed considerable fluctuations throughout all the observed timeframes. The maximum and minimum retreat of the Drang Drung glacier was estimated to be 325.39 m (2010–2015) and 65 m (2015–2020), respectively. The highest retreat (109.26 m) in the Pensilungpa glacier occurred during 2000–2010, and the minimum 45.50 m during 2015–2020 (Figure 5).

3.3. Debris Cover Change

The ablation zones of both the Drang Drung and Pensilungpa glaciers are covered with debris cover. The debris cover of the Pensilungpa glacier was 1.86 km2 in 1980, and now it has been extensively covered with debris, reaching 2.32 km2 in 2020. Initially, the Drang Drung glacier had 4.01 km2 of debris cover in 1976, which increased to 4.76 km2 in 2020. The maximum (0.83 ± 0.04%) and minimum (0.26 ± 0.05%) changes in debris cover were observed during the 1976–2000 and 2015–2020 periods for the Drang Drung glacier. In a similar vein, the shift in debris cover of Pensilungpa glacier is at its maximum during the time period 1976–1990 (1.68 ± 0.15%), and its minimum in the period 1990–2000 (0.16 ± 0.06%).

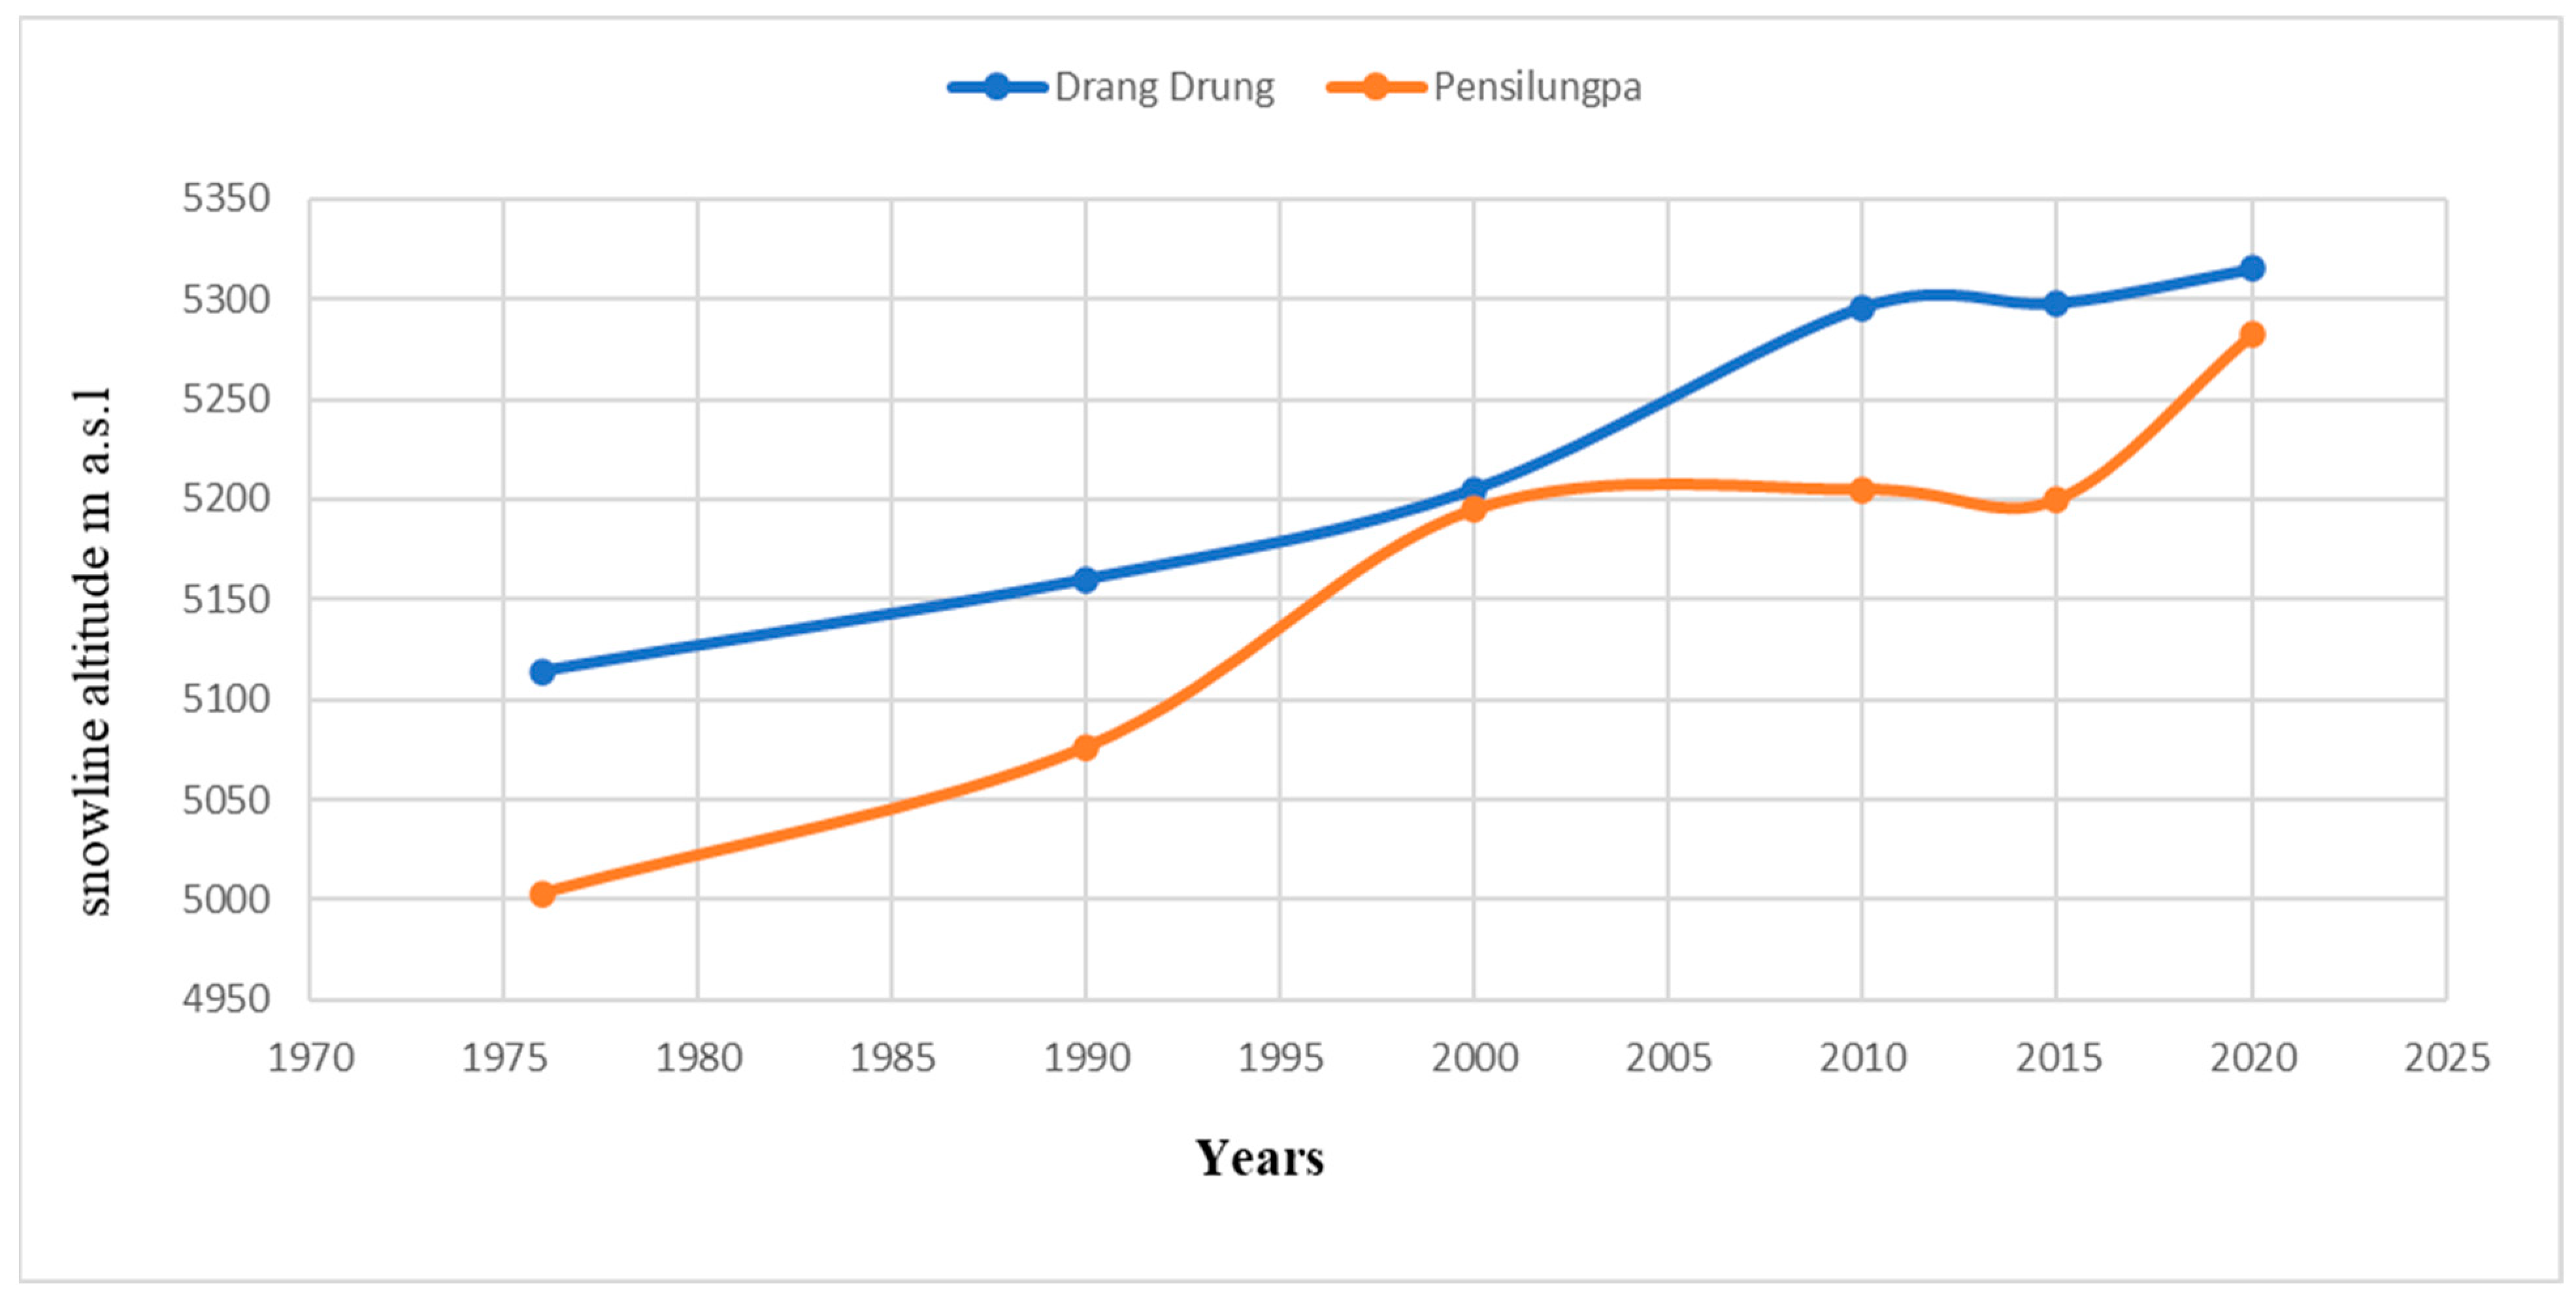
3.4. Snow Line Altitude/AAR

Both glaciers exhibited a consistent increase in SLA, indicating reduced mass input into the glacier system, subsequently leading to a reduction in glacier area. The Drang Drung glacier experienced a slightly greater magnitude of SLA upshift compared to the Pensilungpa glacier. The temporal SLAs for both the Drang Drung and Pensilungpa glaciers were mapped for 1976, 1990, 2000, 2010, 2015 and 2020 (Figure 6). The Drang Drung glacier shows the maximum increase in SLA values of about 104 m from 1976 to 2020, followed by the Pensilungpa glacier at 88 m. The increase observed in SLA is probably a result of various environmental variables, including local temperature, precipitation, elevation, and humidity [40]. Considering these, it seems that the elevation in SLA can be linked to the warming of the regional climate. Further, the AAR of the Drang Drung and Pensilungpa glaciers is estimated at 54.21% and 49.77%, respectively. This indicates that the Drang Drung glacier possesses a substantial accumulation zone, enabling it to effectively retain its mass, whereas the Pensilungpa glacier has a smaller accumulation area, resulting in inadequate maintenance of its mass.

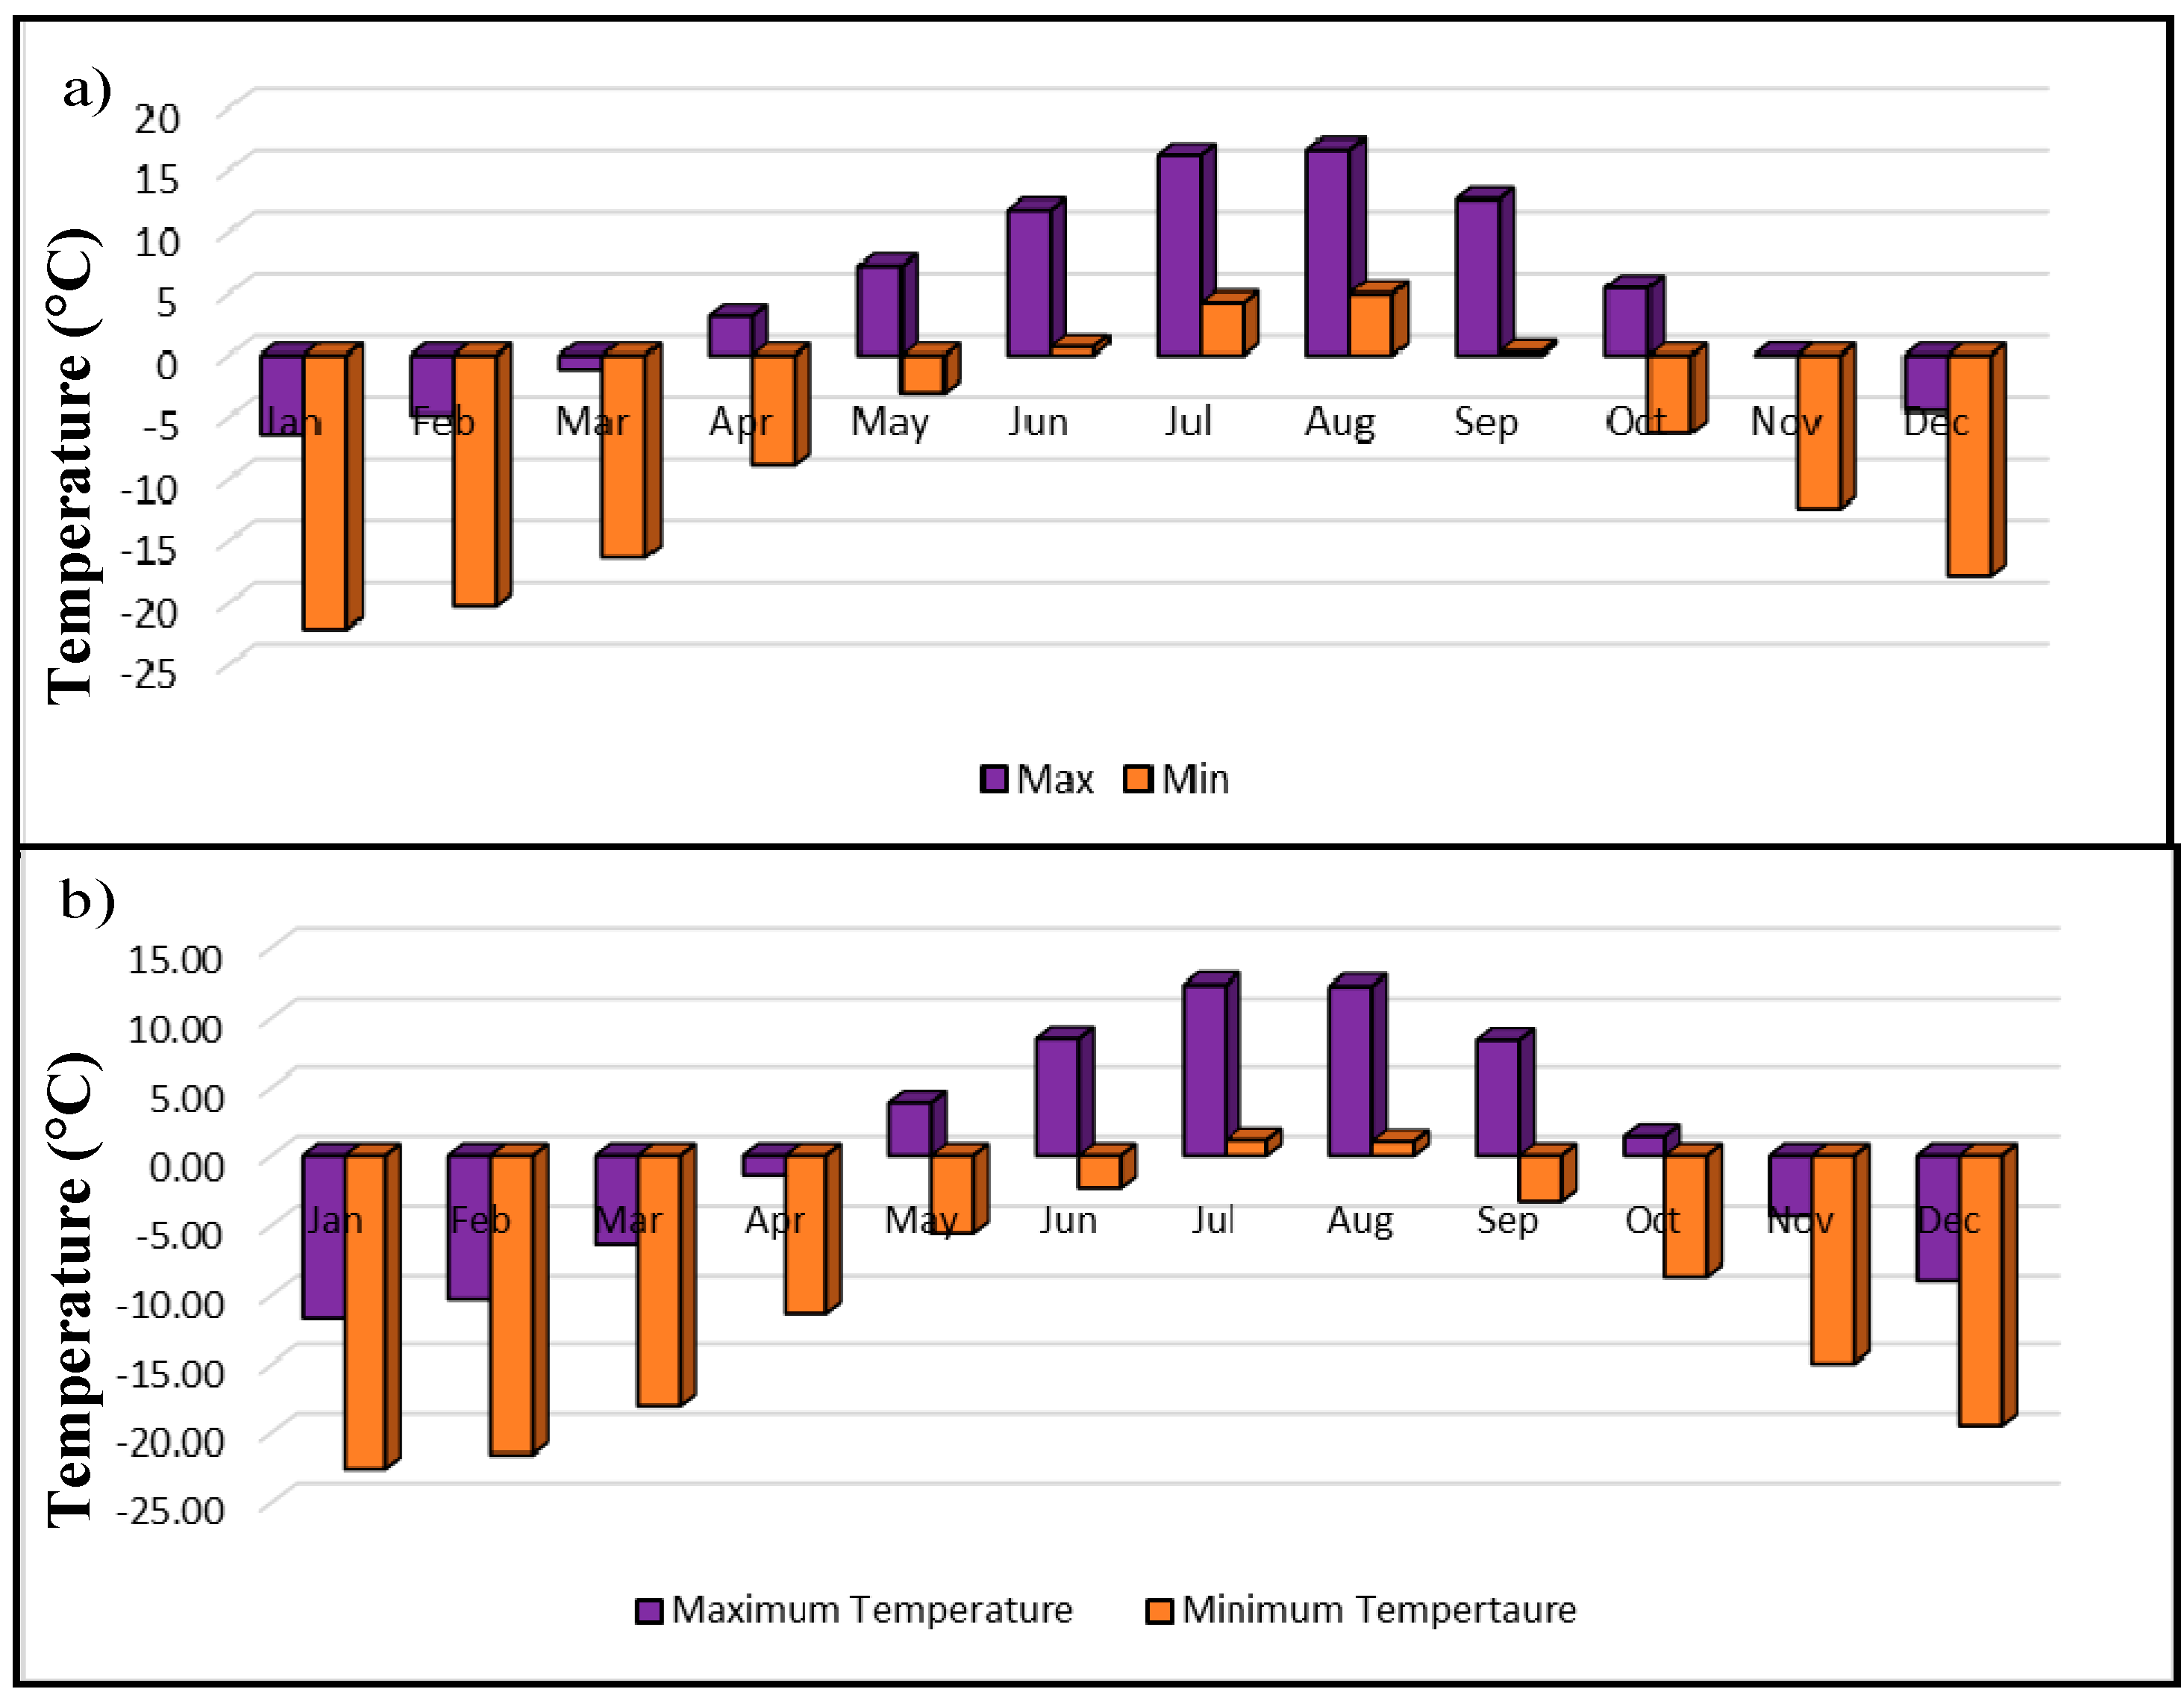
3.5. Impact of Climate on Glacier Changes

Numerous studies on the Himalayan glaciers show that the recent changes in the glacier parameters are primarily due to climate change [6,11]. Based on the glacier retreat rates, the warming rate for the second half of the 20th century has a wide range, and is similar to the world average [41,42]. It is challenging to comprehend the regional variations in the glaciers’ reaction, though [43]. It is crucial to consider meteorological factors like weather and precipitation when evaluating how climate change will affect glaciers. The climate of the study area is influenced by both the Westerly circulations and Indian Summer Monsoon, resulting in hot temperatures during summer and extremely dry and cold conditions during winter [44,45]. The climatic data analysis from the observed data, CRU TS4, POWER LARC (NASA) dataset reveals that the temperature rose during the years 1976–2020, while the region’s precipitation varied over the same time period (Figure 7 and Figure 8). The progression of the coefficient of variation (CV) across three datasets—CRU, NASA LARC—and the observed data reveal the year-round temperature variations. January exhibits relatively stable conditions at −9.83, while February and March display increased variability at −12.30 and −22.70. April stands out with a peak CV at −48.14, and May introduces substantial diversity at 179.91, which extends into June and July (27.15 and 16.88). August maintains variability at 21.11, and September continues to show diverse patterns at 34.90. October stands out with an unusual stabilization at −90.81, while November and December exhibit some degree of stability at −22.52 and −15.09, respectively. The Drang Drung and Pensilungpa glacier’s negative health for the study period is indicated by a rise in temperature and variations in precipitation (1976–2020). The shift in temperature and precipitation is illustrated in Figure 9. The rise in temperature has been recognized as a key contributing factor to the reduction in snowfall and the accelerated melting of glaciers in the Indian Himalayan region [13,45]. Both glaciers are situated in comparable and similar climatic regions; the recession pattern was very diverse. This could be because topographic variables and the characteristics of the debris layer probably have a big impact on glacier variations [46,47]. As a result, a systematic evaluation of the effects of various topographic variables, including slope, aspect, AAR, hypsometry and debris cover, on observed glacier changes has been carried out in the current study.

3.6. Mean Slope

Slope is one of the crucial topographic components affecting how glaciers react to climate change, particularly their ability to advance or recede [18]. Glaciers on steeper slopes experience a faster rate of retreat and deglaciation compared to glaciers with gentler slopes. The slope of the Pensilungpa glacier is (20.10°), which is close to the Drang Drung glacier (18.83°). The Drang Drung glacier’s accumulation area with a slope >25°constitutes 54% of its total accumulation area, while its ablation area with a slope <8°accounts for 31% of its total ablation area. Similarly, the accumulation area of the Pensilungpa glacier with a slope >25° comprises 49% of its total accumulation area, while its ablation area with a slope <8°makes up 36% of its total ablation area. The comparison reveals that the Drang Drung glacier has a larger area, with higher slopes in its accumulation zone compared to the Pensilungpa glacier. On the other hand, the Pensilungpa glacier exhibits a greater area, with lesser slopes in its ablation zone than the Drang Drung glacier (Figure 10).

3.7. Aspect

Aspect is a crucial topographic factor that determines the quantity of solar energy received by the glaciers and also governs the influence of slope on snowfall and its distribution. Both the glaciers (Drang Drung and Pensilungpa) are North East-oriented glaciers (Figure 11). According to previous studies, compared to the glaciers facing north and east, south-facing glaciers deglaciate more [33]. The North East-facing Drang Drung glacier is more deglaciated (0.007 km2/yr) compared to the Pensilungpa glacier (0.004 km2/yr). The retreat is a localized event that is mostly impacted by local slope and other terminus settings (such as an ice wall or debris cover), hence the impact of aspect on the terminus retreat was determined to be minor.

3.8. Hypsometry

The hypsometric analysis of the glaciers reveals a noticeable difference in the area–elevation distribution between the Drang Drung and Pensilungpa glaciers. It was found that the Pensilungpa glacier was roughly equally distributed above and below its median elevation, indicating an equidimensional to slightly bottom-heavy glacier. The Drang Drung glacier, on the other hand, was found to be a high-up glacier, with a majority of the area above the glacier’s median elevation (Figure 12). Previous research on hypsometry has suggested that glaciers whose maximum area lies above the median elevation are more responsive to changes in the snowline compared to bottom-heavy or equidimensional glaciers. A top-heavy glacier’s accumulation and ablation areas will undergo significant changes, with even a slight increase in ELA, whereas a bottom-heavy or equidimensional glacier will be less impacted by such changes [48]. According to these studies, the same observations are likely to apply to both the Drang Drung and Pensilungpa glaciers. Hypsometrically, it can be inferred that the Drang Drung glacier is more susceptible to changes in ELA compared to the Pensilungpa glacier.

4. Discussion

Understanding the response of Himalayan glaciers to climate change is a complex task due to the difficult topography and lack of regular long-term field measurements. The diverse and scattered patterns of relative changes observed within individual mountain ranges suggest that local factors play a crucial role in regulating glacier behaviour. These factors can include variations in local climate history, as well as differences in the glaciers’ intrinsic sensitivity to climatic changes, which can be influenced by factors such as slope, aspect, elevation, hypsometry, and the presence of debris cover [36,49,50]. Studies conducted in the Himalayan region, such as those by Bolch et al. [1] and Kumar et al. [51] have shown similar trends. They have found that smaller glaciers are losing mass at a faster rate compared to larger glaciers. For instance, the Drang Drung and Pensilungpa glaciers share the same meteorological conditions and flow in the same direction (NNE) [52], and were once connected according to geomorphological data. However, they have now dispersed in various directions.
Previous studies conducted by Kamp et al. [21] and Pandey et al. [53] have also examined the length and area variations of glaciers in the region. However, the findings from these studies, along with the research mentioned earlier, exhibit significant differences. The variation in results is substantial, to the extent that Kamp et al. [21] reported Pensilungpa as the most rapidly retreating glacier in the area, with a retreat of approximately 1800 m between 1975 and 2006. In contrast, Pandey et al. [53] found a much lower retreat of around 510 m over a similar timeframe from 1975 to 2007. Additionally, Pandey et al. [53] observed that Pensilungpa had actually advanced at a rate of approximately 11.76 m per year from 1975 to 1992. In the present study, it was observed that Pensilungpa consistently retreated from 1976 to 2020, with a reduction in length of 206 ± 99.58 m over this period. In addition to satellite observations, the DGPS survey of the frontal zone of the Drang Drung and Pensilungpa glacier depicts a higher retreat of the snout of 16.62 ± 0.5 m and 7.39 ± 0.2 m during 2019–2020, respectively.
Inconsistencies also arise when considering the areal estimates of the glaciers. For instance, according to Pandey et al. [53], Pensilungpa experienced a loss of approximately 0.07 km2 per year between 2001 and 2007, but subsequently showed an increase in area of about 0.16 km2 per year during the same period. These variations in real estimates using the same datasets indicate the presence of inconsistencies. Furthermore, the area of Pensilungpa has been shrinking since 1976, with the peak rate of deglaciation occurring between 1980 and 2000, as indicated in the current study.
Regarding the Drang Drung glacier, Pandey et al. [53], Bolch [31], and Kamp et al. [21] suggest a steadily increasing retreat, which aligns with the outcomes of the current study. However, the retreat rates reported vary significantly. In distinction to these investigations, Bahuguna et al. [54] found that Drang Drung was almost balanced between 2 February 2000 and November 2010. The current study reveals that Drang Drung declined in length by 812 ± 99.58 m between 1976 and 2020. Additionally, it is suggested that the recent increase in the retreat rates of the Drang Drung glacier could be attributed to the creation of proglacial lakes near its snout.
In a previous study by Mehta et al. [52], it was indicated that the retreat rate of Drang Drung was 624 ± 547 m, and that of Pensilungpa was 270 ± 27 m, with respective rates of 12 ± 11 and 5.6 ± 0.5 m per year between 1971 and 2019.
In addition to the aforementioned studies, we also contrasted our findings with a study conducted in the Zanskar basin by Shukla and Qadir [14]. According to their findings, Pensilungpa consistently receded from 1977 to 2013, with a reduction in length of 298 ± 106.44 m over this period. In our study, we observed a consistent retreat in Pensilungpa from 1976 to 2020, with a reduction in length of 206 ± 99.58 m over the same duration. Although there is a slight difference in the estimated retreat values, the general trend of continuous retreat aligns between the two studies. Regarding Drang Drung, Shukla and Qadir, [14] reported a reduction in length of 691 ± 106.44 m between 1977 and 2013, with 47% of this retreat occurring between 2000 and 2013, corresponding to a retreat rate of approximately 25 m per year. In our study, we found that Drang Drung reduced in length by 812 ± 99.58 m between 1976 and 2020. The comparison reveals that the retreat estimations from both studies are in good agreement, highlighting the significant retreat of Drang Drung over the analyzed period.
Despite similarities in topographical features between Drang Drung and Pensilungpa glaciers, their morphological characteristics differ [53]. Drang Drung experienced a faster rate of length and area loss compared to Pensilungpa, approximately four times faster. Both glaciers are situated in the same grid and show indications of increased winter temperature and summer precipitation since 1976, based on CRU-TS 4 meteorological data (1976–2020). However, the discrepancy in glacier retreat cannot be fully explained by climate data [53].
To understand the influences on glacier changes, we calculated various topographical characteristics such as slope, aspect, hypsometry, and size for both glaciers. The average slope of Pensilungpa is 8°, while Drang Drung has a slightly gentler slope of 6°, and both face the northeast (NE) direction. The median altitude of Pensilungpa is around 5210 m a.s.l, while Drang Drung sits at around 5150 m a.s.l. The slope is considered an important topographic factor that affects the response of glaciers to climate change, including their retreat or advance [18,54]. Glaciers on steeper slopes exhibit a higher rate of retreat and deglaciation compared to glaciers on more gradual slopes. According to Mehta et al. [52], there are no significant differences in topographic and climatic conditions between Pensilungpa and Drang Drung. Thus, they suggest that the differences in glacier behaviour in the Suru and Doda River basins cannot be solely attributed to variances in incoming solar radiation influenced by aspects and slopes. However, our research findings demonstrate that glacial dynamics are significantly influenced by various local topographical factors, such as glacier size, slope, aspect, hypsometry, and debris cover.

5. Conclusions

Our research reveals that both the Drang Drung and Pensilungpa glaciers, situated in close proximity, experienced a reduction in area and length between 1976 and 2020. The SLA of Drang Drung shifted 104 m upward between 1976 and 2020, while the SLA of Pensilungpa shifted 88 m in the same period. Comparatively, the Drang Drung glacier exhibited a faster rate of retreat than Pensilungpa glacier. Over the study period, the Drang Drung glacier decreased in length by approximately 812.36 m, while Pensilungpa glacier reduced in length by around 206.70 m. In terms of area loss, the Drang Drung and Pensilungpa glaciers experienced a decrease of approximately 10.73% and 9.84%, respectively. Our findings suggest that local topographical factors, including hypsometry, size, slope, aspect, and debris cover, exert a significant influence on the dynamics of these glaciers, in addition to the effects of global warming. While climate change remains a major driver of glacial retreat, the specific topographic characteristics and morphology of each glacier also contribute to their behaviour. Glacier retreat in the Zanskar Himalaya is primarily driven by two factors: temperature increase and reduced precipitation. Rising temperatures lead to the melting of glaciers, while a decrease in precipitation fails to offset the mass loss caused by melting. Furthermore, the research findings indicate that even with an increase in precipitation, it is insufficient to compensate for the glacier mass loss resulting from higher temperatures. This highlights the role of climate warming in driving glacier retreat in the study area. The rate at which glaciers retreat is influenced by various factors, not only including climate change, but also the topographic setting and morphology of the glacier.
To mitigate uncertainties in detecting changes in Himalayan glaciers, long-term field-based data and the incorporation of multi-temporal satellite imagery are crucial. These approaches would contribute to a more accurate understanding of glacial changes and aid in forecasting future scenarios in the context of ongoing global warming trends.

Author Contributions

Conceptualization, A.S.J. and P.K.T.; methodology, S.A.; software, S.A.; validation, S.A.; formal analysis, S.A.; investigation, S.A. and A.S.J.; resources, S.A. and A.S.J.; data curation, S.A. and A.S.J.; writing—original draft preparation, A.S.J., S.A. and P.K.T.; writing—review and editing, A.S.J., S.A., P.K.T., Q.R., Z.A.W., S.A.M.A., S.S. and M.M.; visualization, A.S.J., S.A. and P.K.T.; supervision, A.S.J. and P.K.T.; project administration, A.S.J. and P.K.T.; funding acquisition, S.S. All authors have read and agreed to the published version of the manuscript.

Funding

The authors extend their appreciation to the Deanship of Scientific Research at King Khalid University for funding this work through a Large Group Research Project under grant number RGP2/90/44.

Institutional Review Board Statement

Not applicable.

Informed Consent Statement

Not applicable.

Data Availability Statement

Not applicable.

Acknowledgments

The authors extend their appreciation to the Deanship of Scientific Research at King Khalid University for funding this work through a Large Group Research Project under grant number RGP2/90/44. The authors are highly thankful to USGS for providing Landsat data at no cost, and to the India Meteorological Department, Pune (India), for providing air temperature data to carry out the present research work. The authors sincerely acknowledge the Rashtriya Uchchatar Shiksha Abhiyan (RUSA)—Phase 2.0.

Conflicts of Interest

The authors declare no conflict of interest.

References

  1. Bolch, T.; Kulkarni, A.; Kääb, A.; Huggel, C.; Paul, F.; Cogley, J.G.; Frey, H.; Kargel, J.S.; Fujita, K.; Scheel, M.; et al. The state and fate of Himalayan glaciers. Science 2012, 336, 310–314. [Google Scholar] [CrossRef] [PubMed]
  2. Pritchard, H.D. Asia’s glaciers area regionally important buffer against drought. Nature 2017, 545, 169–174. [Google Scholar] [CrossRef] [PubMed]
  3. Mehta, M.; Dobhal, D.P.; Bisht, M.P.S. Change of Tipra glacier in the Garhwal Himalaya, India, between 1962 and 2008. Prog. Phys. Geogr. Earth Environ. 2011, 35, 721–738. [Google Scholar] [CrossRef]
  4. Shukla, A.; Ali, I.; Hasan, N.; Romshoo, S.A. Dimensional changes in the Kolahoi glacier from 1857 to 2014. Environ. Monit. Assess. 2016, 189, 5. [Google Scholar] [CrossRef] [PubMed]
  5. Kulkarni, A.V.; Rathore, B.P.; Singh, S.K.; Bahuguna, I.M. Understanding changes in the Himalayan cryosphere using remote sensing techniques. Int. J. Remote Sens. 2011, 32, 601–615. [Google Scholar] [CrossRef]
  6. Kulkarni, A.V.; Karyakarte, Y. Observed changes in Himalayan glaciers. Curr. Sci. 2014, 106, 237–244. [Google Scholar]
  7. Scherler, D.; Bookhagen, B.; Strecker, M.R. Hill slope-glacier coupling: The interplay of topography and glacial dynamics in High Asia. J. Geophys. Res. Earth Surf. 2011, 116, F2. [Google Scholar] [CrossRef]
  8. Stokes, C.R.; Popovnin, V.; Aleynikov, A.; Gurney, S.D.; Shahgedanova, M. Recent glacier retreat in the Caucasus Mountains, Russia, and associated increase in supra glacial debris cover and supra-/proglacial lake development. Ann. Glaciol. 2007, 46, 195–203. [Google Scholar] [CrossRef]
  9. Venkatesh, T.N.; Kulkarni, A.V.; Srinivasan, J. Relative effect of slope and equilibrium line altitude on the retreat of Himalayan glaciers. Cryosphere 2012, 6, 301–311. [Google Scholar] [CrossRef]
  10. Pandey, P.; Kulkarni, A.V.; Venkataraman, G. Remote sensing study of snowline altitude at the end of melting season, Chandra-Bhagabasin, Himachal Pradesh, 1980–2007. GeocartoInt 2013, 28, 311–322. [Google Scholar] [CrossRef]
  11. Chand, P.; Sharma, M.C. Glacier changes in the Ravi basin, North-Western Himalaya (India) during the last four decades (1971–2010/13). Glob. Planet. Chang. 2015, 135, 133–147. [Google Scholar] [CrossRef]
  12. Scherler, D.; Bookhagen, B.; Strecker, M.R. Spatially variable response of Himalayan glaciers to climate change affected by debris cover. Nat. Geosci. 2011, 4, 156–159. [Google Scholar] [CrossRef]
  13. Dobhal, D.P.; Mehta, M.; Srivastava, D. Influence of debris cover on terminus retreat and mass changes of Chorabari Glacier, Garhwal region, central Himalaya, India. J. Glaciol. 2013, 59, 961–971. [Google Scholar] [CrossRef]
  14. Shukla, A.; Qadir, J. Differential response of glaciers with varying debris cover extent: Evidence from changing glacier parameters. Int. J. Remote Sens. 2016, 37, 2453–2479. [Google Scholar] [CrossRef]
  15. O’Neal, M.A.; Hanson, B.; Carisio, S.; Satinsky, A. Detecting recent changes in the areal extent of North Cascades glaciers, USA. Quat. Res. 2015, 84, 151–158. [Google Scholar] [CrossRef]
  16. Davies, B.J.; Carrivick, J.L.; Glasser, N.F.; Hambrey, M.J.; Smellie, J.S. A new glacier inventory for 2009 reveals spatial and temporal variability in glacier response to atmospheric warming in the northern Antarctic Peninsula, 1988–2009. Cryosphere Discuss. 2011, 5, 3541–3595. [Google Scholar] [CrossRef]
  17. Furbish, D.J.; Andrews, J.T. The use of hypsometry to indicate long-term stability and response of valley glaciers to changes in mass transfer. J. Glaciol. 1984, 30, 199–211. [Google Scholar] [CrossRef]
  18. Jiskoot, H.; Curran, C.J.; Tessler, D.L.; Shenton, L.R. Changes in Clemenceau Ice field and Chaba Group glaciers, Canada, related to hypsometry, tributary detachment, length–slope and area–aspect relations. Ann. Glaciol. 2009, 50, 133–143. [Google Scholar] [CrossRef]
  19. Fountain, A.G.; Hoffman, M.J.; Granshaw, F.; Riedel, J. The “benchmarkglacier” concept—Does it work? Lessons from the North Cascade Range, USA. Ann. Glaciol. 2009, 50, 163–168. [Google Scholar] [CrossRef]
  20. Raman, A.; Kulkarni, A.V.; Prasad, V. Glacier mass balance estimation in Garhwal Himalaya using improved accumulation area ratio method. Environ. Monit. Assess. 2022, 194, 583. [Google Scholar] [CrossRef]
  21. Kamp, U.; Byrne, M.; Bolch, T. Glacier fluctuations between 1975 and 2008 in the Greater Himalaya Range of Zanskar, southern Ladakh. J. Mt. Sci. 2011, 8, 374–389. [Google Scholar] [CrossRef]
  22. Shukla, A.; Garg, P.K. Evolution of a debris-covered glacier in the western Himalaya during the last four decades (1971–2016): A multiparametric assessment using remote sensing and field observations. Geomorphology. 2019, 341, 1–14. [Google Scholar] [CrossRef]
  23. Bhambri, R.; Bolch, T.; Chaujar, R.K.; Kulshreshtha, S.C. Glacier changes in the Garhwal Himalaya, India, from 1968 to 2006 based on remote sensing. J. Glaciol. 2011, 57, 543–556. [Google Scholar] [CrossRef]
  24. Hanshaw, M.N.; Bookhagen, B. Glacial areas, lake areas, and snowlines from 1975 to 2012: Status of the Cordillera Vilcanota, including the Quelccaya Ice Cap, northerncentral Andes, Peru. Cryosphere 2014, 8, 359–376. [Google Scholar] [CrossRef]
  25. Racoviteanu, A.E.; Arnaud, Y.; Williams, M.W.; Manley, W.F. Spatial patterns in glacier characteristics and area changes from 1962 to 2006 in the Kanchenjunga–Sikkimarea, eastern Himalaya. Cryosphere 2015, 9, 505–523. [Google Scholar] [CrossRef]
  26. McFadden, E.M.; Ramage, J.; Rodbell, D.T. Landsat TM and ETM+ derived snow-line altitudes in the Cordillera Huayhuashand Cordillera Raura, Peru, 1986–2005. Cryosphere 2011, 5, 419–430. [Google Scholar] [CrossRef]
  27. Berthier, E.; Arnaud, Y.; Kumar, R.; Ahmad, S.; Wagnon, P.; Chevallier, P. Remote sensing estimates of glacier mass balances in the Himachal Pradesh (Western Himalaya, India). Remote Sens. Environ. 2007, 108, 327–338. [Google Scholar] [CrossRef]
  28. Kääb, A.; Berthier, E.; Nuth, C.; Gardelle, J.; Arnaud, Y. Contrasting patterns of early twenty- first- century glacier mass change in the Himalayas. Nature 2012, 488, 7412. [Google Scholar] [CrossRef]
  29. Tachikawa, T.; Kaku, M.; Iwasaki, A.; Gesch, D.; Oimoen, M.; Zhang, Z.; Danielson, J.; Krieger, T.; Curtis, B.; Haase, J. ASTER Global Digital Elevation Model Version 2-Summary of Validation Results. 31 August 2011. Available online: https://lpdaac.usgs.gov/documents/220/Summary_GDEM2_validation_report_final.pdf (accessed on 20 November 2022).
  30. Nagai, H.; Fujita, K.; Nuimura, T.; Sakai, A. Southwest–facing slopes control the formation of debris- covered glaciers in the Bhutan Himalaya. Cryosphere 2013, 7, 1303–1314. [Google Scholar] [CrossRef]
  31. Bolch, T.; Menounos, B.; Wheate, R. Landsat- based inventory of glaciers in western Canada, 1985–2005. Remote Sens. Environ. 2010, 114, 127–137. [Google Scholar] [CrossRef]
  32. DeBeer, C.M.; Sharp, M.J. Topographic influences on recent changes of very small glaciers in the Monashee Mountains, British Columbia, Canada. J. Glaciol. 2009, 55, 691–700. [Google Scholar] [CrossRef]
  33. Bhambri, R.; Bolch, T.; Chaujar, R.K. Frontal recession of Gangotri Glacier, Garhwal Himalayas, from 1965 to 2006, measured through high-resolution remote sensing data. Curr. Sci. 2012, 102, 489–494. [Google Scholar]
  34. Bhattacharya, A.; Bolch, T.; Mukherjee, K.; Pieczonka, T.; Kropáček, J.; Buchroithner, M.F. Overall recession and mass budget of Gangotri Glacier, Garhwal Himalayas, from 1965 to 2015 using remote sensing data. J. Glaciol. 2016, 62, 1115–1133. [Google Scholar] [CrossRef]
  35. Rabatel, A.; Francou, B.; Soruco, A.; Gomez, J.; Cáceres, B.; Ceballos, J.L.; Basantes, R.; Vuille, M.; Sicart, J.-E.; Huggel, C. Current state of glaciers in the tropical Andes: A multi –century perspective on glacier evolution and climate change. Cryosphere 2013, 7, 81–102. [Google Scholar] [CrossRef]
  36. Garg, P.K.; Yadav, J.S.; Rai, S.K.; Shukla, A. Mass balance and morphological evolution of the Dokriani Glacier, central Himalaya, India during 1999–2014. Geosci. Front. 2022, 13, 101290. [Google Scholar] [CrossRef]
  37. Paul, F.; Huggel, C.; Kääb, A. Combining satellite multispectral image data and a digital elevation model for mapping debris- covered glaciers. Remote Sens. Environ. 2004, 89, 510–518. [Google Scholar] [CrossRef]
  38. Racoviteanu, A.E.; Arnaud, Y.; Williams, M.W.; Ordoñez, J. Decadal changes in glacier parameters in the Cordillera Blanca, Peru, derived from remote sensing. J. Glaciol. 2008, 54, 499–510. [Google Scholar] [CrossRef]
  39. Hall, D.K.; Bayr, K.J.; Schöner, W.; Bindschadler, R.A.; Chien, J.Y.L. Consideration of the errors inherent in mapping historical glacier positions in Austria from the ground and space (1893–2001). Remote Sens. Environ. 2003, 86, 566–577. [Google Scholar] [CrossRef]
  40. Guo, Z.N.; Wanga, N.M.; Kehrwald, R.; Mao, H.; Wua, Y.; Jiang, W.X. Temporal and Spatial Changes in Western Himalayan Firn Line Altitudes from 1998 to 2009. Glob. Planet. Chang. 2014, 118, 97–105. [Google Scholar] [CrossRef]
  41. Banerjee, A.; Azam, M.F. Temperature reconstruction from glacier length fluctuations in the Himalayas. Ann. Glaciol. 2016, 57, 189–198. [Google Scholar] [CrossRef]
  42. Banerjee, A.; Shankar, R. On the response of Himalayan glaciers to climate change. J. Glaciol. 2013, 59, 480–490. [Google Scholar] [CrossRef]
  43. Fujita, K.; Nuimura, T. Spatially heterogeneous wastage of Himalayan glaciers. Proc. Natl. Acad. Sci. USA 2011, 108, 14011–14014. [Google Scholar] [CrossRef] [PubMed]
  44. Kumar, V.; Mehta, M.; Shukla, A.; Kumar, A.; Garg, S. Late Quaternary glacial advances and equilibrium –line altitude changes in a semi-arid region, Suru Basin, western Himalaya. Quat. Sci. Rev. 2021, 267, 107100. [Google Scholar] [CrossRef]
  45. Mehta, M.; Kumar, V.; Garg, S.; Shukla, A. Little ice age glacier extent and temporal changes in annual mass balance (2016–2019) of Pensilungpa Glacier, Zanskar Himalaya. Reg. Environ. Chang. 2021, 21, 38. [Google Scholar] [CrossRef]
  46. Brun, F.; Wagnon, P.; Berthier, E.; Jomelli, V.; Maharjan, S.B.; Shrestha, F.; Kraaijenbrink, P.D.A. Heterogeneous influence of glacier morphology on the mass balance variability in High Mountain Asia. J. Geophys. Res. Earth Surf. 2019, 124, 1331–1345. [Google Scholar] [CrossRef]
  47. Rounce, D.R.; King, O.; McCarthy, M.; Shean, D.E.; Salerno, F. Quantifying debris thickness of debris- covered glaciers in the Everest region of Nepal through inversion of a sub debris melt model. J. Geophys. Res. Earth Surf. 2018, 123, 1094–1115. [Google Scholar] [CrossRef]
  48. Brocklehurst, S.; Whipple, K. Hypsometry of glaciated landscapes. Earth Surf. Process. Landf. 2004, 29, 907926. [Google Scholar] [CrossRef]
  49. Harrison, W.D.; Elsberg, D.H.; Echelmeyer, K.A.; Krimmel, R.M. On the characterization of glacier response by a single time-scale. J. Glaciol. 2001, 47, 659–664. [Google Scholar] [CrossRef]
  50. Kraaijenbrink, P.; Meijer, S.W.; Shea, J.M.; Pellicciotti, F.; DeJong, S.M.D.; Immerzeel, W.W. Seasonal surface velocities of a Himalayan glacier derived by automated correlation of unmanned aerial vehicle imagery. Ann. Glaciol. 2016, 57, 103–113. [Google Scholar] [CrossRef]
  51. Kumar, V.; Mehta, M.; Mishra, A.; Trivedi, A. Temporal fluctuations and frontal area change of Bangni and Dunagiri glaciers from 1962 to 2013, Dhauliganga Basin, central Himalaya, India. Geomorphology 2017, 284, 88–98. [Google Scholar] [CrossRef]
  52. Mehta, M.; Kumar, V.; Kunmar, P.; Sain, K. Response of the thick and thin debris- covered glaciers between 1971 and 2019 in Ladakh Himalaya, India—A case study from Pensilungpa and Durung-Drung glaciers. Sustainability 2023, 15, 5. [Google Scholar] [CrossRef]
  53. Pandey, A.C.; Ghosh, S.; Nathawat, M.S. Evaluating patterns of temporal glacier changes in Greater Himalayan Range, Jammu & Kashmir, India. Geocarto Int. 2011, 26, 321–338. [Google Scholar]
  54. Bahuguna, I.; Rathore, B.; Brahmbhatt, R.; Sharma, M.; Dhar, S.; Randhawa, S.; Kumar, K.; Romshoo, S.; Shah, R.; Ganjoo, R. Are the Himalayan glaciers retreating? Curr. Sci. 2014, 106, 1008–1013. [Google Scholar]
Figure 1. Map showing the geographical location of the study area. (a) Map of India; (b) map of the union territories of Jammu and Kashmir and Ladakh; (c) An overlaid view of the Landsat OLI image from 2017, with a specific focus on the Drang Drung and Pensilungpa glaciers, marked for the year 2020 and showing accumulation zone (ACZ), ablation zone (ABZ), and debris cover; it also highlights the presence of two prominent rivers, the Suru and Doda rivers of Zanskar Valley, Ladakh, India.
Sustainability 15 15067 g001
Figure 2. Field photographs showing (a) the snout of the Drang Drung glacier; (b) the lateral moraines (right lateral moraine: RLM, left lateral moraine: LLM), ablation zone (ABZ) of the Drang Drung glacier; (c) the snout position of the Pensilungpa glacier; (d) the lateral moraines (right lateral moraine: RLM, left lateral moraine (LLM), ablation zone (ABZ), debris-covered ablation zone (DCABZ) and (e) DGPS monitoring of the front of the Drang Drung glacier in the Zanskar Valley of Ladakh, India.
Sustainability 15 15067 g002
Figure 3. Framework of the methodology adopted in the present study.
Sustainability 15 15067 g003
Figure 4. Boundaries of the Drang Drung and Pensilungpa glaciers over various years (1976–2020), depicting the areas abandoned by the glaciers over time.
Sustainability 15 15067 g004
Figure 5. The fluctuation pattern of the terminus is depicted on the Landsat 8 OLI satellite image (2020) of the (a) Drang Drung and (b) Pensilungpa glaciers in North Western Himalaya.
Sustainability 15 15067 g005
Figure 6. SLA of the Drang Drung and Pensilungpa glaciers for different time periods, 1976–2020. The figure shows a definite upward trend throughout the study period.
Sustainability 15 15067 g006
Figure 7. The variation in temperature: (a) observed data; (b) NASA LARC POWER for the period 1976−2020.
Sustainability 15 15067 g007
Figure 8. The variation in temperature for the period 1990−2020 between NASA POWER LARC, CRU TS4, and observed data.
Sustainability 15 15067 g008
Figure 9. Variations in temperature and precipitation during the period 1976−2020: (a) increase in temperature between 1976 and 2020; (b) variation in precipitation for the period 1976–2020.
Sustainability 15 15067 g009
Figure 10. Slope maps: (a) Drang Drung glacier; (b) Pensilungpa glacier.
Sustainability 15 15067 g010
Figure 11. Aspect maps: (a) Drang Drung glacier; (b) Pensilungpa glacier.
Sustainability 15 15067 g011
Figure 12. Hypsometric curves of the Drang Drung and Pensilungpa glaciers. The plots are between the normalized area (A*) and normalized elevation (Z*) of the Drang Drung and Pensilungpa glaciers.
Sustainability 15 15067 g012
Table 1. Details of satellite remote sensing datasets used in the current study.
DataDate/Year of AcquisitionScene/IDSpatial Resolution
Landsat 211/09/1976LM21590361976255FAK0360 m
Landsat 520/09/1990LT51480371990263ISP0030 m
Landsat 708/09/2000LE71480372000248SGS0030 m
Landsat 521/09/2010LT51480372010264KHC0030 m
Landsat 808/09/2015LC81480372015252LGN0130 m
Landsat 819/09/2020LC81480372020263LGN0030 m
Aster GDEM2016astgtmv003_n35e13530 m
SRTM DEMFebruary 2000n33_e076_1arc_v330 m
Table 2. Estimated errors of uncertainty for the glaciers’ length changes throughout various time period.
PeriodError
1976–1990±19.83
1990–2000±54.09
2000–2010±36.28
2010–2015±35.15
2015–2020±47.38
Disclaimer/Publisher’s Note: The statements, opinions and data contained in all publications are solely those of the individual author(s) and contributor(s) and not of MDPI and/or the editor(s). MDPI and/or the editor(s) disclaim responsibility for any injury to people or property resulting from any ideas, methods, instructions or products referred to in the content.

