Article

Digital Transformation of Agricultural Products Purchasing: From the Perspective of Short Videos Live-Streaming

School of Economics and Management, Beijing Forestry University, Beijing 100083, China
*
Author to whom correspondence should be addressed.
Sustainability 2023, 15(20), 14948; https://doi.org/10.3390/su152014948
Submission received: 13 August 2023 / Revised: 14 October 2023 / Accepted: 15 October 2023 / Published: 17 October 2023
(This article belongs to the Special Issue Industry 4.0, Digitization and Opportunities for Sustainability)

Abstract

:
In the current competitive market situation, live streaming has become an essential part of the digital transformation of agriculture. In this study, we empirically examine the influence of short video live streaming on the purchase of agricultural products. A regression model was developed using SPSS 23 software. The final results of this study show that short video live streaming has a significant effect on the sales of agricultural products. Consumer cognition and emotion show mediation in the impact between the Key Opinion Leaders (KOL) of charisma, content richness, and interactive evaluation on the purchase of agricultural products. This study explores the path of the impact of short video live streaming on the purchasing of agricultural products. It is beneficial to help agriculture-related practitioners develop new marketing paths, reduce the waste of agricultural products, and improve the economic income of related practitioners.

1. Introduction

Digitization has spawned live streaming, which in turn has facilitated digitization. Sales of agricultural goods have increased with the arrival of the 5G era [1]. The competition between different e-commerce platforms has grown increasingly fierce in the e-commerce sector. The convenience of shopping and the variety of purchasable products are becoming increasingly popular among consumers [2]. With the development of technology, E-commerce platforms’ purchasing experiences have steadily fallen short of consumers’ needs for ease and variety. Live streaming has been aided by technological improvement and the emergence of the Internet [3]. Even though live streaming is a relatively new phenomenon, it has already had a significant economic impact and a positive incentive effect on the sales of agricultural products [4]. The combination of two different factors—live streaming and agricultural products—has had a catalytic effect, tapping the potential of the agricultural market, effectively alleviating the difficulty of selling, assisting industrial development, and boosting farmers’ income [5]. It is also a significant innovation in the sale of agricultural products.
Live streaming demands both a high level of professionalism and a large investment, and many individual businesses (including those of farmers) lack both. Individual businesses (including those of farmers) find it challenging to implement this strategy in order to boost sales of agricultural products. However, the popularity of short video platforms has drawn more users—more than just celebrities and weblebrities—to live streaming. Additionally, it might draw more individual businesses (including farmers’ businesses). This is because there is no financial pressure, and the operating technique for live streaming of short video platforms is not complicated. The format is very practical for use by individual businesses, especially by farmers. Many agricultural products were unsalable during the COVID-19 outbreak, adversely affecting farmers’ interests [6]. To alleviate the situation, different vegetable warehouses or sheds were quickly transformed into live streaming rooms to address the issue of sluggish sales, and different KOL (Key Opinion Leaders), including celebrities, weblebrities, officials, and individual businesses, took part in live streaming with products on short video platforms (Tik Tok and Kuai Shou, etc.) [7].
The sectors and the categories that instant commerce has already entered are growing, adding more users and quickening the delivery of goods to consumers’ homes. Live streaming agricultural products on short video platforms is already a very distinctive sales strategy that can significantly expand and increase the market potential for agricultural products [8]. The short video platforms are also incredibly convenient, offering both a wide user base and promising business prospects. This activity is becoming essential to the establishment of a modern agricultural industrial system that can successfully encourage the sustainable growth of both the agricultural economy and the local economy [5,9].
Live streaming agricultural products using short video platforms is an option to boost the sales of agricultural products as well as the financial gains of players in the agriculture industry. As a result, local and regional economies can grow more sustainably. Due to the accessibility and simplicity of the short video platforms, celebrities, weblebrities, officials, and individual businesses (including farmers), can all engage in short video live streaming with agricultural commodities on a social level. Additionally, collaboration between various KOL (Key Opinion Leaders) categories happens frequently. We believe that there may be a chance for a beneficial impact on lowering occupational prejudice.
This paper takes agricultural products as the research object and builds a regression model to explore the impact of short video live streaming on agricultural product sales. It is conducive to increasing the purchase of agricultural products and the economic income of relevant employees, effectively alleviating the stagnation of agricultural product marketing, and broadening the marketing channels of agricultural products. To a certain extent, the waste of agricultural products is reduced, which is beneficial to further sustainable development.
This study focuses on the impact of short video live streaming on agricultural product sales. We propose the research hypotheses through the relevant literature in Section 2. Section 3 builds a regression model based on the assumptions. To further analyze the mediating effect, Section 4 analyzes and interprets the mediating variables. Section 5 discusses the implications. Section 6 concludes the research.

2. Literature Review and Research Hypotheses

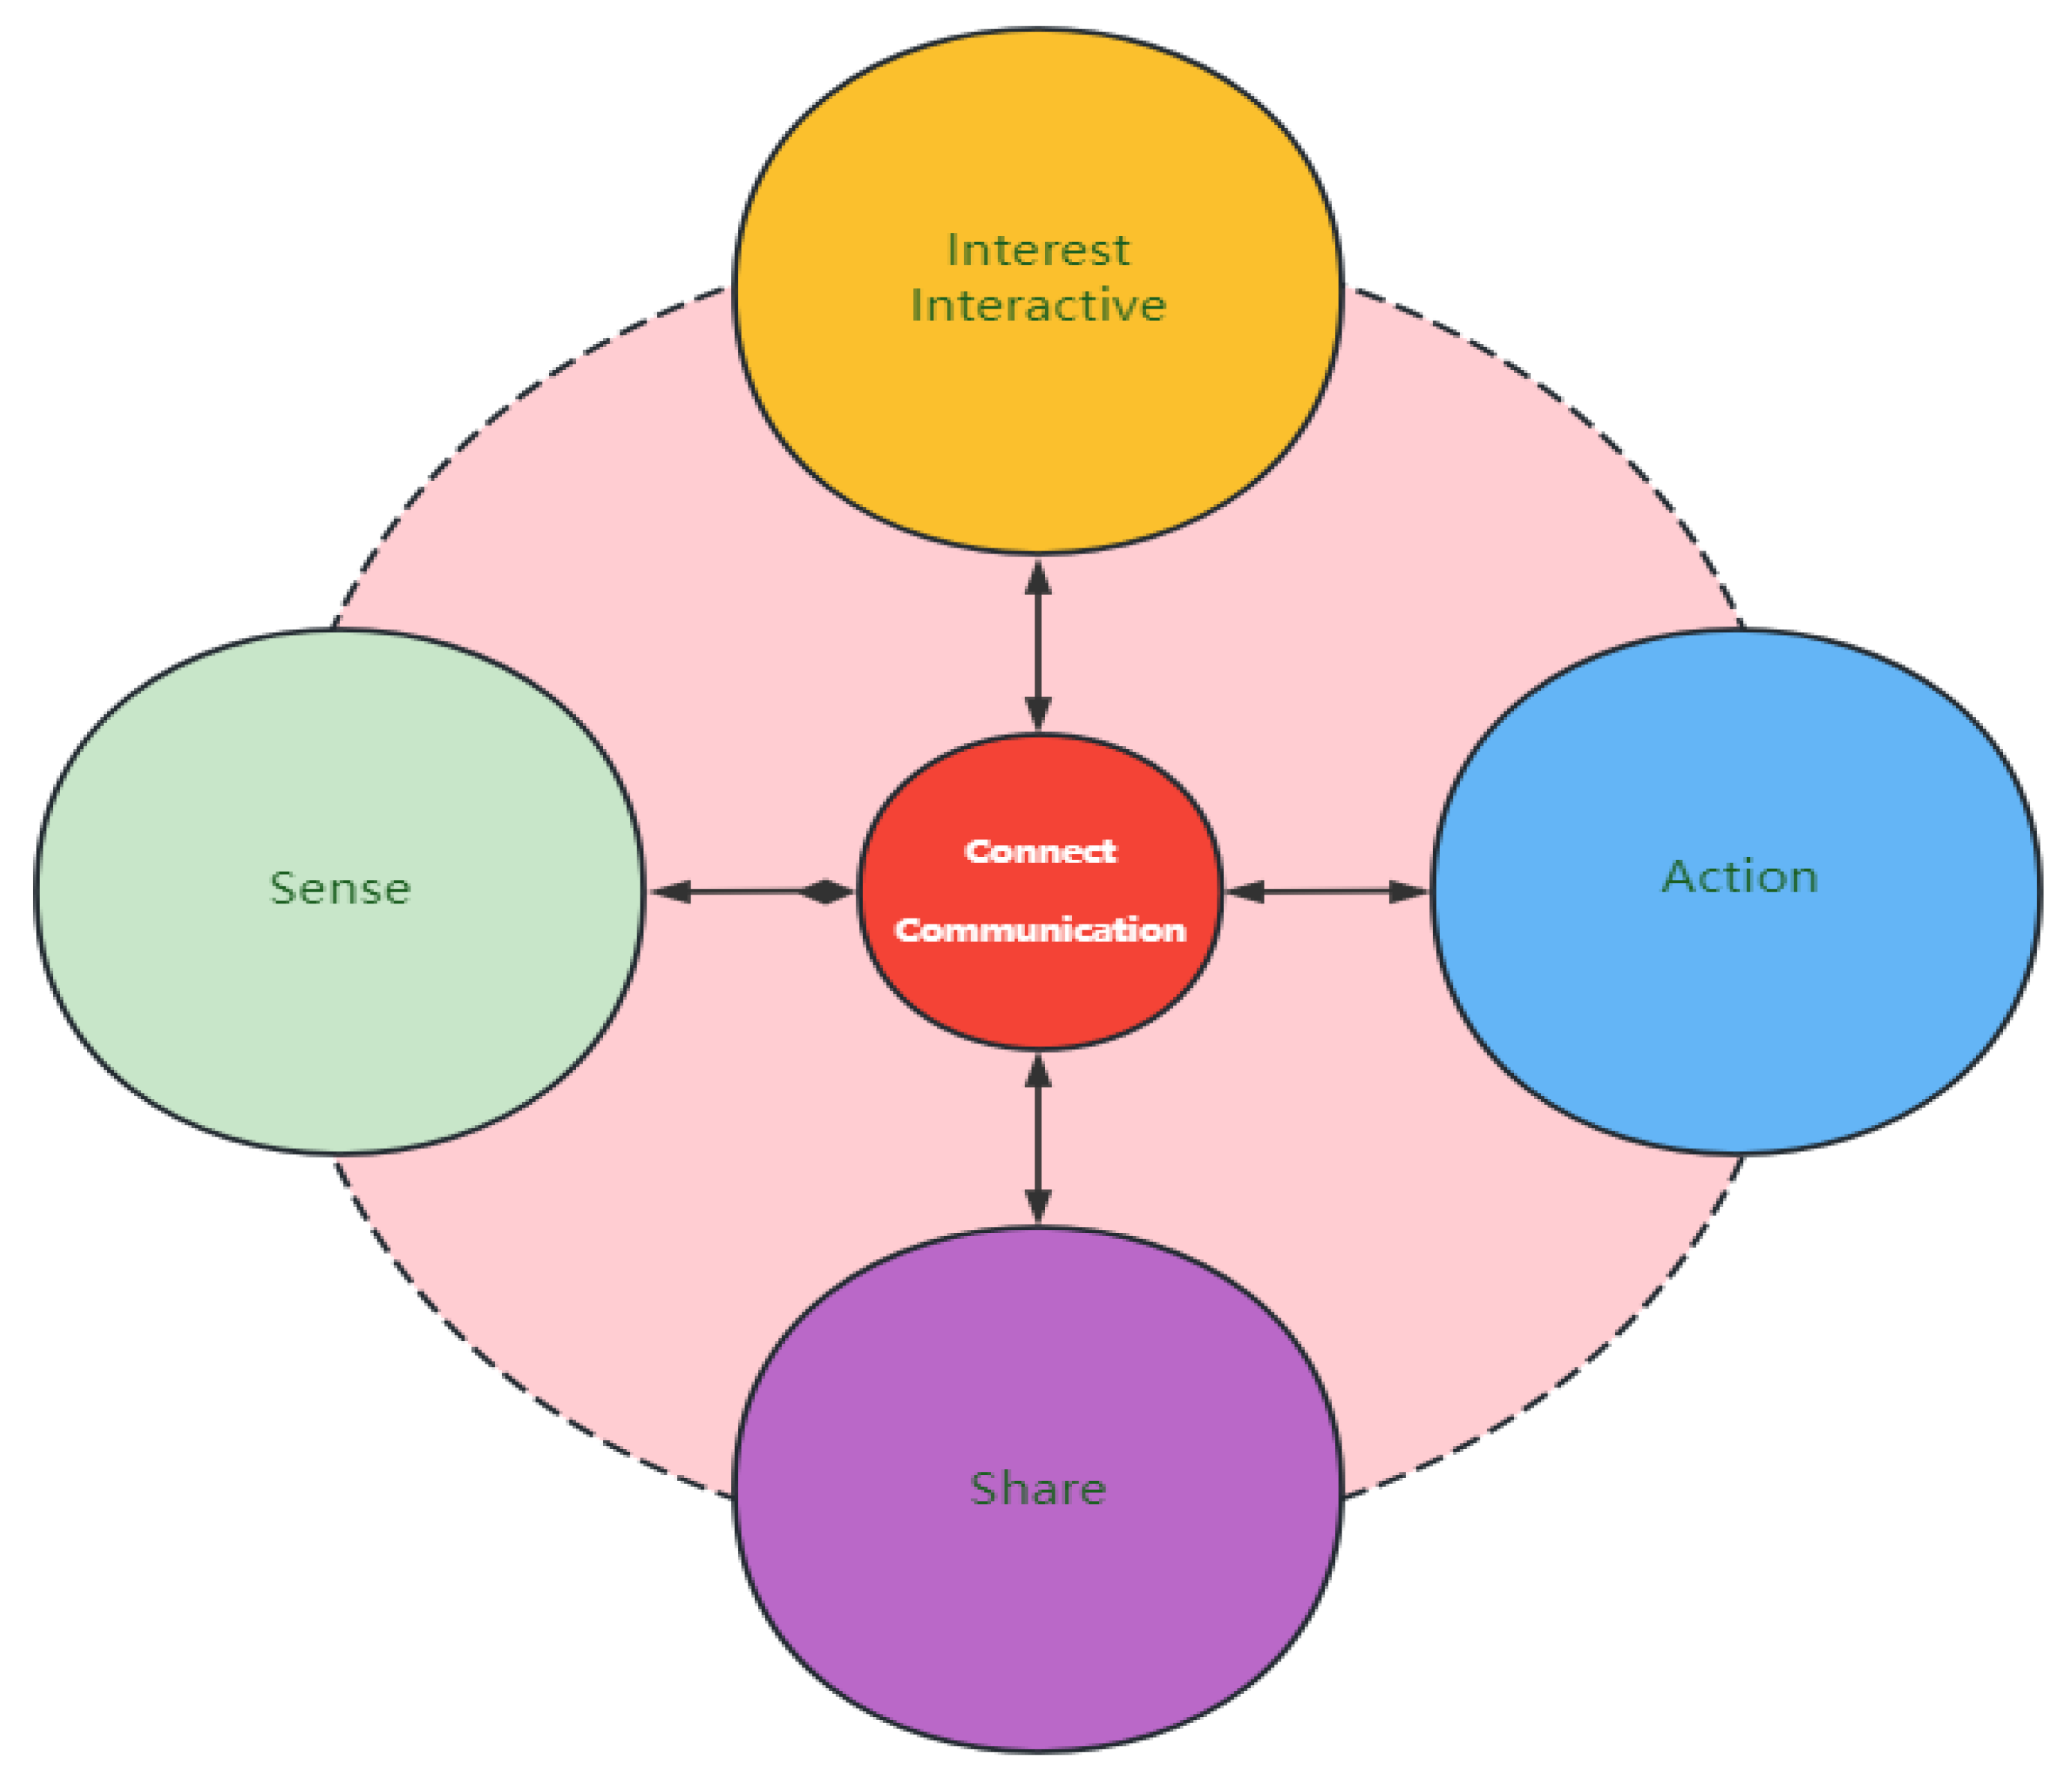
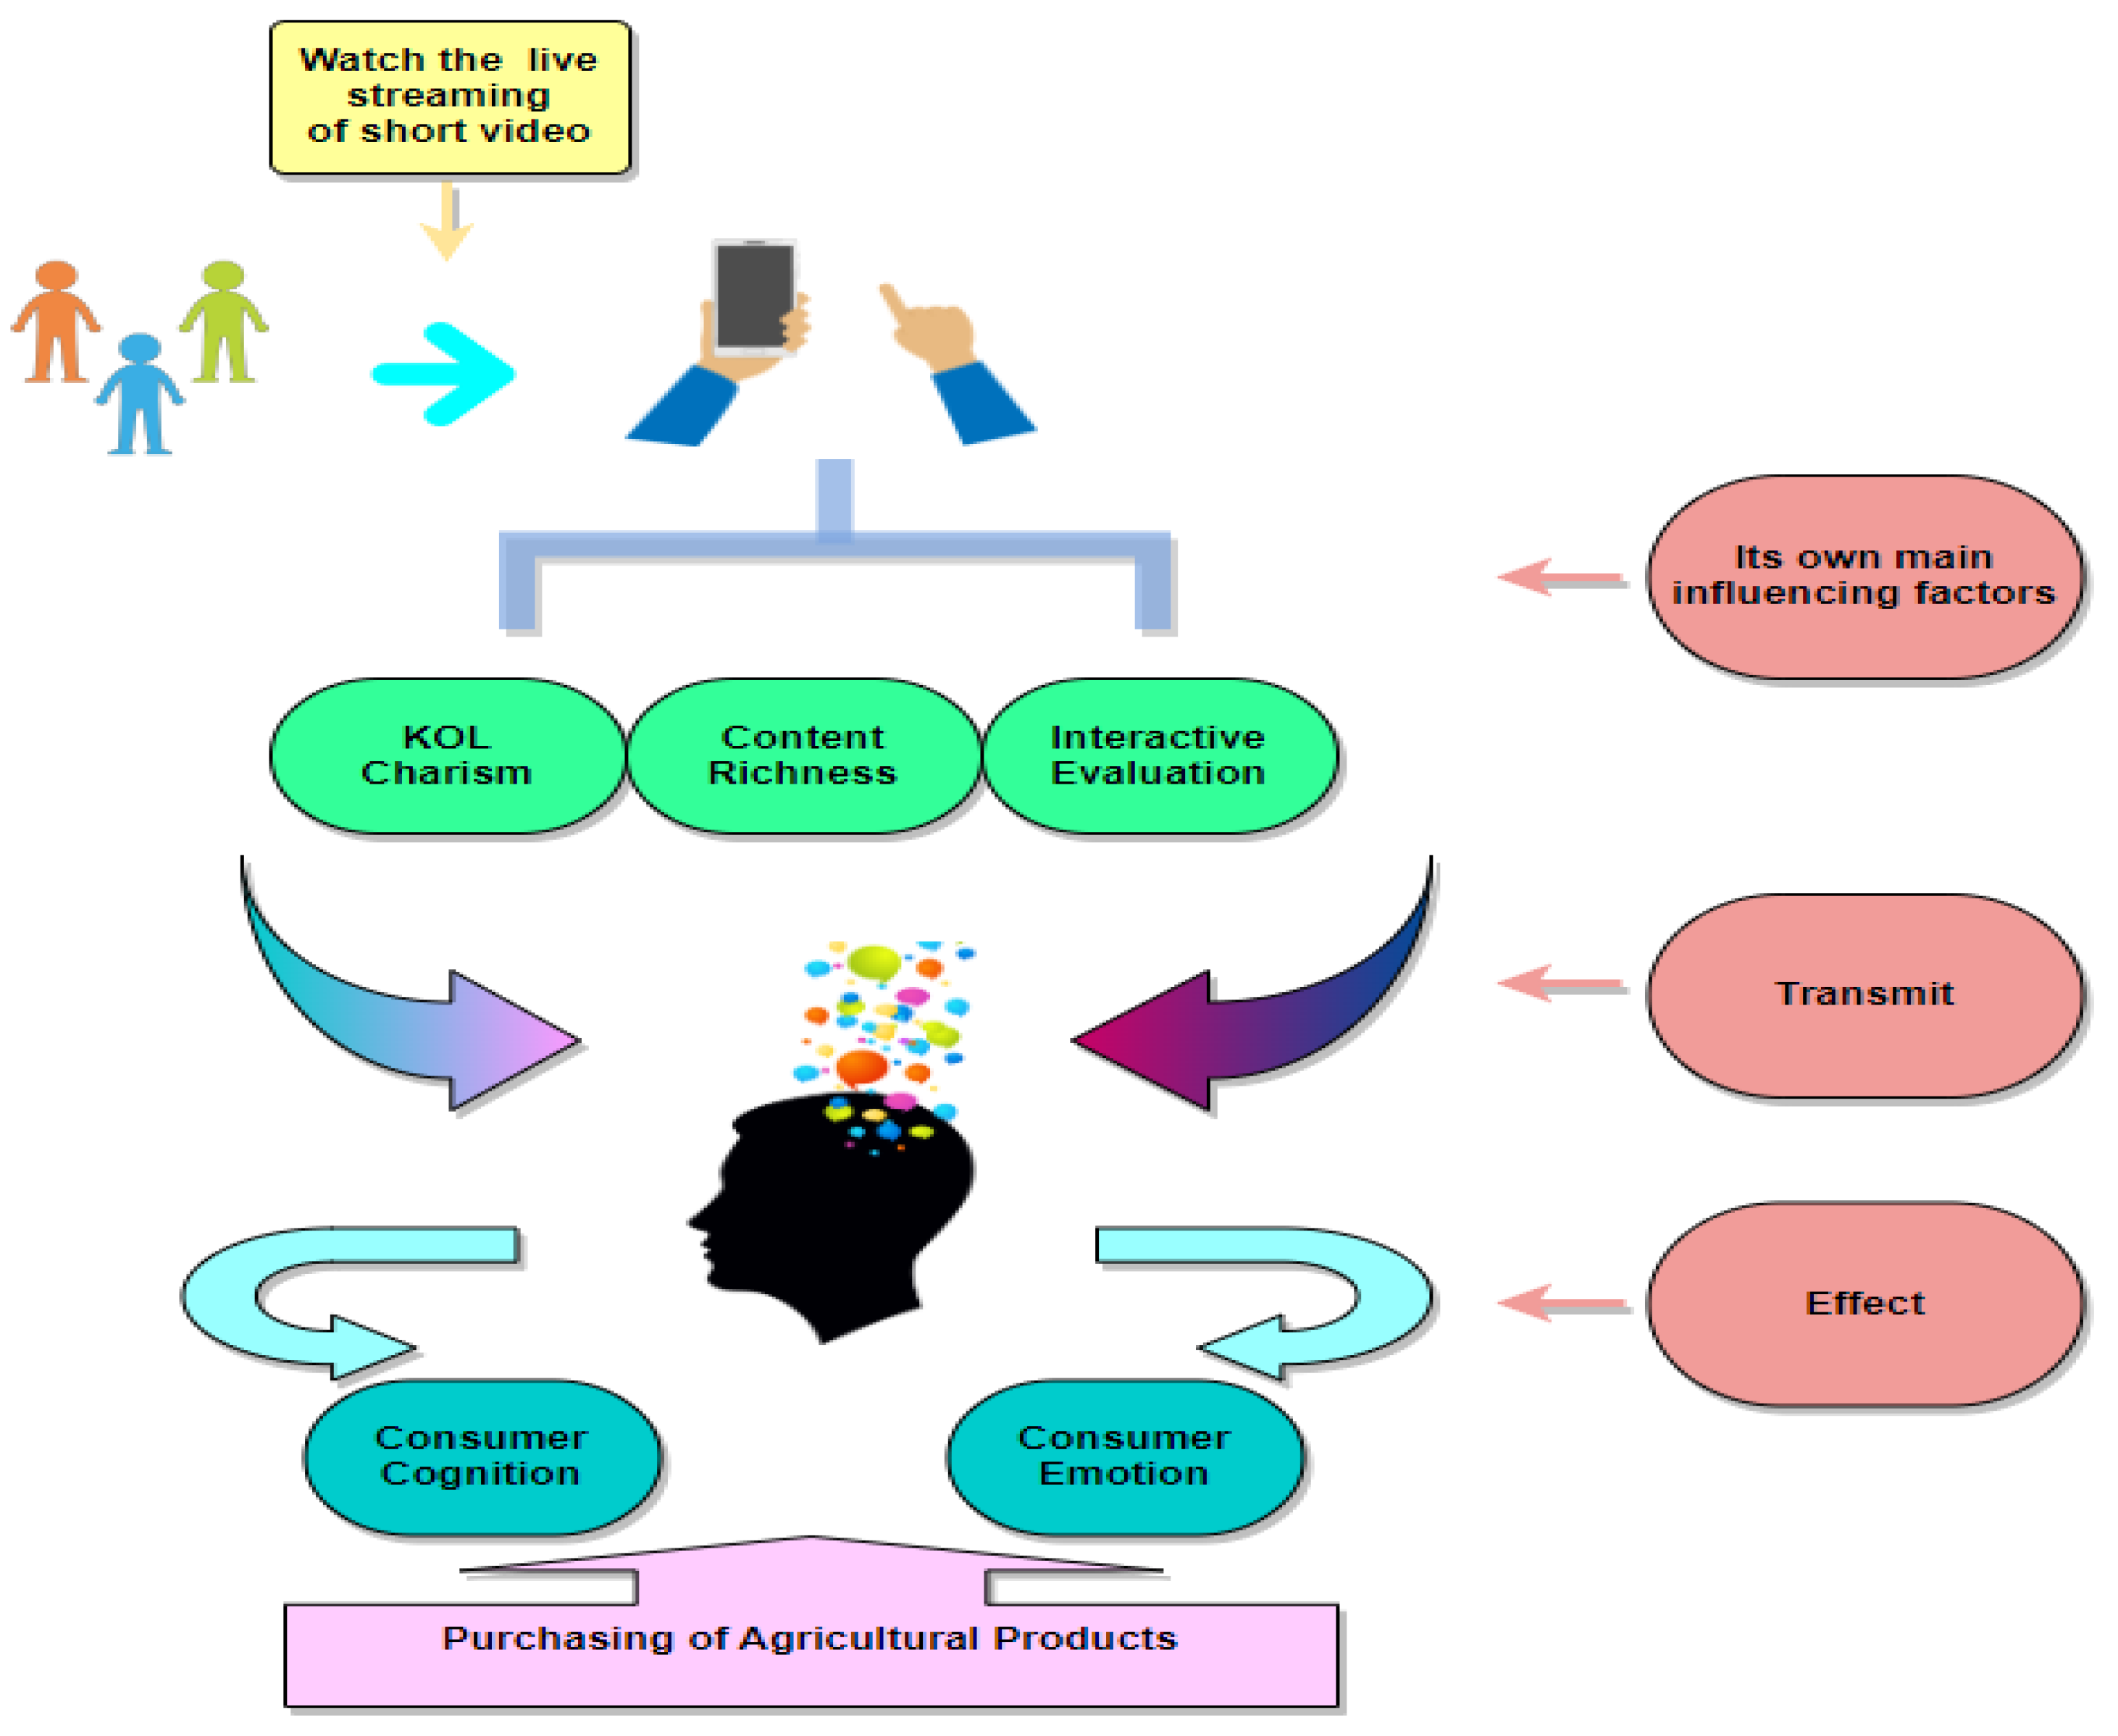
2.1. Short Video Live-Streaming and Purchasing of Agricultural Products

Businesses can live stream their products on short video platforms like TikTok, Kuai Shou, and Huo Shan to give customers a more intuitive experience of the items, against the backdrop of the 5G era [10,11,12]. Consumer viewing time is influenced by the content’s quality [13]. Low-quality content not only loses consumer attention, but also leads to consumer resistance. High-quality live streaming material can provide consumers with sufficient understanding from both the sensory and the psychological perspectives to allow consumers and retailers to have a closer relationship. That relationship can increase customers’ engagement and interest as well as retailers’ sales success rate [14,15]. However, there are many different kinds of anchors, or KOL (Key Opinion Leaders), on short video platforms. Celebrities, weblebrities, officials, and individual businesses including farmers are now live streaming, with officials rising to prominence following the COVID-19 epidemic [16]. Every kind of KOL has its distinctive charm and appeal that can appeal to various customer groups and can raise their readiness to purchase goods [17,18,19]. Additionally, when choosing KOL for live streaming, the KOL’s influence and the number of fans should also be taken into account. This is because there is a fan economy for KOL [20]. The KOL engages with viewers and offers ways to enhance the quality of live streaming content when they live stream with products to guarantee a steady increase in viewing [13,21]. Customer perception of the product is improved, and customer goodwill grows because of active online interaction between the KOL and the consumers [22]. In the form of a bullet screen, consumers can also converse with one another online [23]. Through the bullet screen, consumers who have already made purchases pass along information on the product’s benefits and drawbacks, whether they believe that it is worthwhile to acquire it, etc., to consumers who have not yet made a purchase.
The influence of short video live banding on the purchase of agricultural products is seen mostly through interaction, curiosity, and content, when combined with the unique scenario of a short video platform’s live streaming. The general business strategy of the retailer and the KOL’s function to control the live streaming with products makes up most of the short-video platform’s content. The content and the KOL of the short video platform‘s live streaming are what ultimately spark interest. On the other side, interaction combines KOL engagement generally and merchant interaction specifically. Because the three factors have overlapping effects on purchasing agricultural products, we have chosen to construct a thorough classification. We separate the three components—the content, the interaction, and the KOL—as well. The term “content” describes the overall richness of short video live streaming. The interaction aspect is to explain a certain level of interaction between consumers, KOL, and merchants as a whole. We believe that interaction and content richness mirror the role of the KOL, although these two factors have not been shown to reflect the role of KOL categories as much [5,17,18]. Therefore, we divide contemporary Chinese KOL into the following primary groups: celebrities, weblebrities, officials, and individual businesses (including farmers). This makes it possible to more easily identify the charismatic function of KOL categories. The SICAS behavioral consumption model for “the digital 2.0 + mobile Internet era” was suggested in the China Internet Blue Book. It has been argued that the current SICAS model is not traditional broadcast advertising and marketing, but is driven by connected conversations [24,25]. The consumption path of consumers in the SICAS model is shown in Figure 1. We consider that KOL charisma, content richness, and interactive evaluation for live streaming on short video platforms comprise the majority of the independent variables. The hypothesis is as follows:
H1. 
Short video live streaming has a positive impact on the purchasing of agricultural products.

2.2. The Mediation of Cognition and Emotion

A novel method of selling agricultural products that offers customers an engaging and tailored online buying experience is short-video live streaming with produce [26]. Consumers’ attitudes shift when they watch live streamed goods on short video platforms [5,7,27]. Changes in consumer attitudes are mainly attributed to cognitive and affective variables, or rather, attitudes are constituted by affect and cognition [28,29]. By live-streaming agricultural products, consumers can deepen their impressions and better understand the products, which in turn improves consumer perception [3,30,31]. A linear link also exists between variables, including product brand, service quality, and consumer perception [27,32]. Then when it comes to emotions, the complexity of live streaming affects consumer emotions as well [33]. Consumers who opt to watch live streaming will experience emotional shifts according to the charm or the face value of the KOL, as well as whether the content of live streaming is pertinent to their own positive emotions or satisfaction [34,35]. Additionally, the bullet screen contact in short video live streaming is more practical and promotes consumer goodwill [14,36]. Buying impulses can be sparked by consumer perceptions and emotions and buying intentions can also be influenced by these factors [37,38,39,40]. This is somewhat similar to the Taobao platform’s live streaming. But the difference in platform attributes will ultimately produce different results [41].
Figure 1 illustrates the influence path, which includes both the cognitive and the emotional aspects. Whether by content, interaction, or by KOL charisma, live streaming on short video platforms affects consumers’ emotions and cognition; this results in consumers’ purchase of agricultural products. Several authors [14] have pointed out that live streaming can influence consumers’ psychology to achieve growth of business orders. Consumer cognition does have mediation in live streaming the purchase of agricultural products [5]. Additionally, as mentioned above, consumers’ emotions are influenced by live streaming content and by KOL charisma, and these emotions in turn influence purchasing behavior, to some extent. Therefore, we introduce two factors (emotion and cognition) into the influence of live streaming on short video platforms regarding the purchase of agricultural products. The hypothesis is as follows:
H2. 
There is the mediation of consumer cognition in the influence of short video live streaming on the purchase of agricultural products.
H3. 
There is the mediation of consumer emotion in the influence of short video live streaming on the purchase of agricultural products.
Based on the above analysis and the proposed hypotheses, the model is established in Figure 2:
It should be noted that the independent variables selected are KOL charisma, content richness, and interaction evaluation of short-video live banding. For the convenience of processing, H1 categorizes these three independent variables as short video live streaming. The empirical analysis is still conducted with the three independent variables mentioned above. The abbreviations and the interpretations of the variables are shown in Table 1.

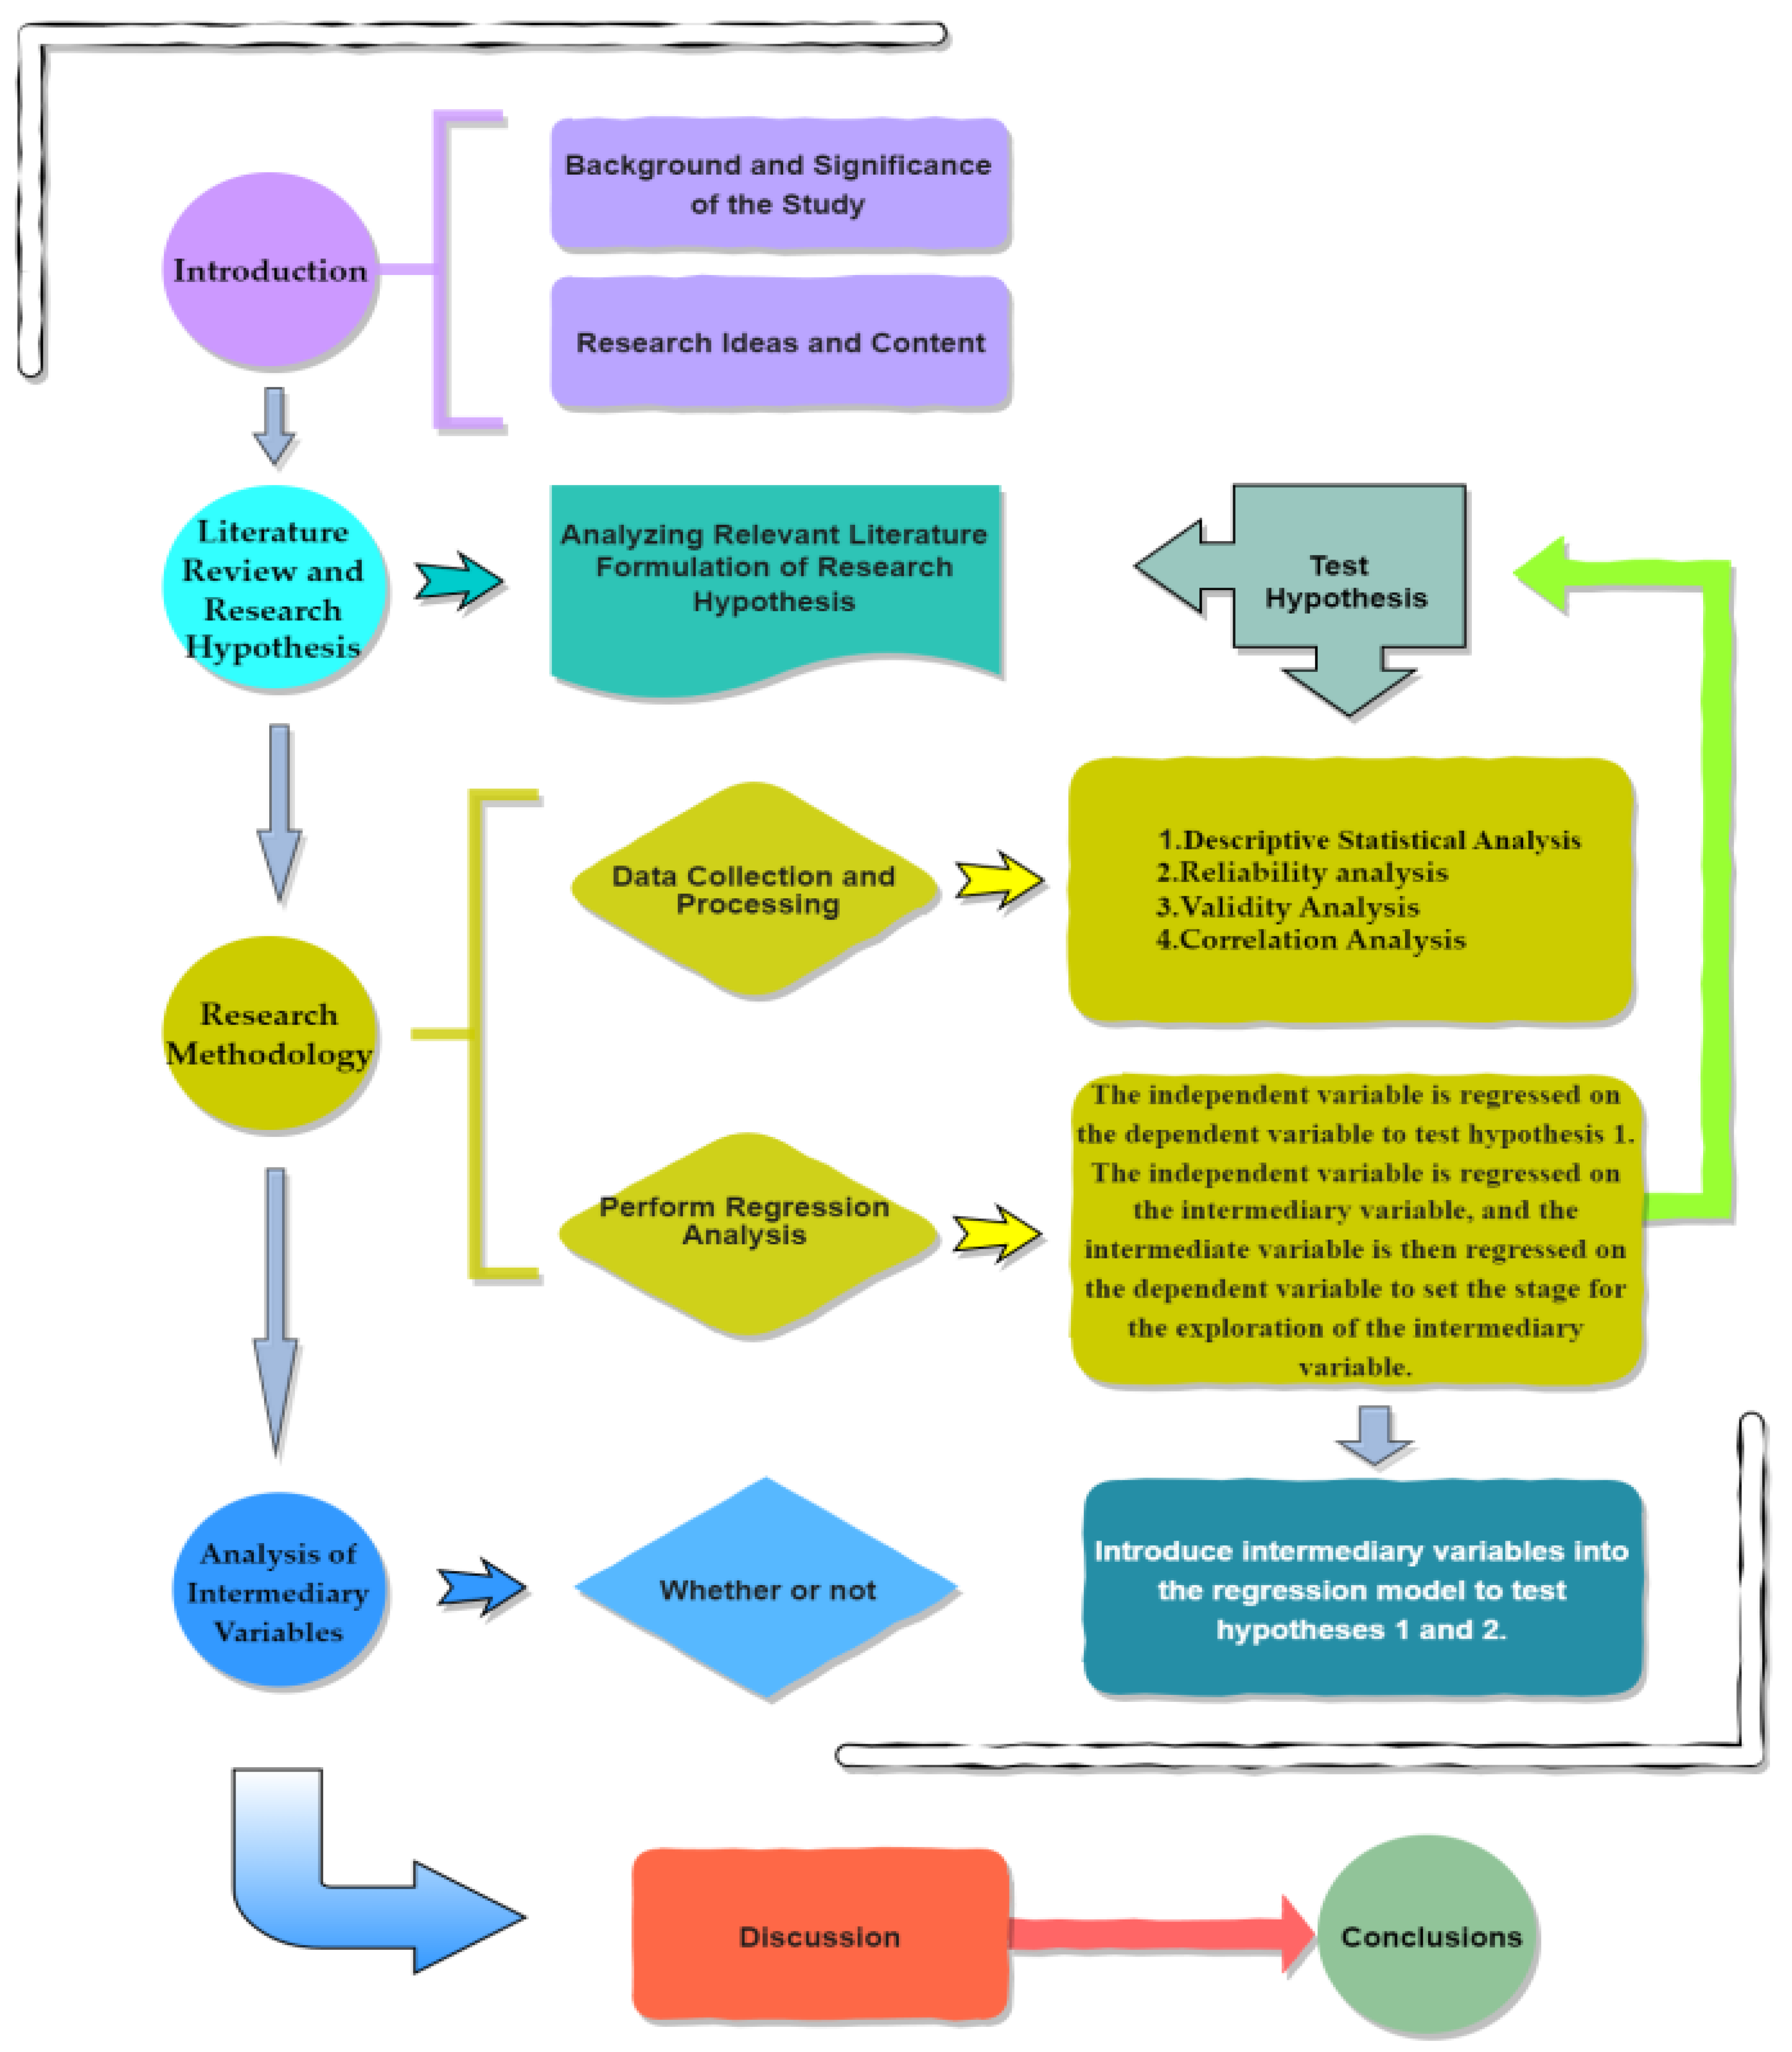
3. Research Methodology

3.1. Research Framework

The main lines of thought and processes of this study are specifically represented in Figure 3.

3.2. Data Collection and Description

3.2.1. Study Area

The agricultural resources in Nanyang City, which is in central China, are abundant. Nanyang City is situated in the region of China between the subtropical and temperate climates. This region has a continental monsoon humid semi-humid climate, which is ideal for crop growth. Notably, 76.47% of Nanyang City’s total land area is comprised of agricultural land. The most populated agricultural city in China’s Henan Province, Nanyang City, benefits from a large labor pool that makes it easier for the city to develop its agricultural industry.
The use of live streaming in Nanyang City has successfully increased the number of jobs and has added several live streaming training organizations while meeting the present demand for agricultural product internet marketing in a short amount of time. Since then, short video live streaming of agricultural products has been the norm in Nanyang City, due to the qualities of short video live streaming.

3.2.2. Data Sources

A questionnaire is suggested to collect the data for this study’s empirical analysis. To ensure that appropriate analytical results can be achieved, the questionnaire must be properly and reasonably developed [5]. Consequently, an appropriate set of fixed measuring indicators was established through the analysis of the pertinent theoretical literature. Short video live streaming with agricultural products (independent variable), consumer cognition and emotion (intermediary variable), and purchasing of agricultural products (dependent variable) were the three parts under which the questionnaire’s range of study questions was examined.
Consider people in Nanyang City who acquire agricultural items through short video live streaming. The questionnaire was made available through platforms including WeChat, QQ, short video platforms, and offline, based on the utilization of the fragmented reading function. A total of 715 questionnaires were gathered; 600 of them were valid, 115 were deemed invalid, and the questionnaire’s effectiveness rate was 83.9%.

3.2.3. Descriptive Statistical Analysis

The basic situation of the data was obtained from the distributed questionnaires, as well as the basic information situation of the respondents which was analyzed. The following Table 2 shows:
In this study, 600 valid questionnaires were gathered, of which 296 (or 49%) of those came from men. There were questionnaires from 304 women, at 51% of the total, so the number of men to women was roughly equal.
There were 254 participants in the study who were between the ages of 18 and 30, at 42.3% of the total.
People in the age range of 18 to 30 comprise the majority of those who purchase agricultural products through the live streaming of short video platforms.
Most of the research subjects had earned bachelor’s degrees. The size of the percentage with degrees demonstrates that the research participants have a sober understanding of short video live streaming.
Many of the research subjects reported that they are employed by businesses and a majority of them are students; this indicates that business employees have a more consistent source of income and greater purchasing power. The size of the group of school students comes next; while they do not have the consistent income of firm employees, they do have some spare income, free time, and a greater level of passion for agricultural goods.
The group with a monthly income of less than 4000 yuan likes short-video live streaming with agricultural products, according to the monthly incomes of the survey respondents.
When it comes to their preferred short video app, respondents who buy live-brought goods seem to favor TikTok.

3.3. Reliability Analysis

According to Table 3 below, the reliability analysis of the sample overall shows the following: Cronbach’s Alpha is 0.948 wherein the value is above 0.9 which indicates a very high level of reliability of the sample overall.

3.4. Validity Analysis

3.4.1. Validity Analysis and Factor Analysis of Independent Variables

The independent variables include KOL Charisma (KC), Content Richness (CR), and Interactive Evaluation (IE). Validity analysis and factor analysis were conducted for these three dimensions. Table 4 shows that the significance of the Bartlett Test of Sphericity is 0.000, which is less than 0.01 and is adequate for factor analysis, and that the value of KMO is 0.950. The principal components were then used to test KOL Charisma (KC), Content Richness (CR), and Interactive Evaluation (IE).
According to Table 5, where the cumulative variance contribution rate is larger than 65% and the commonality values for all study items are higher than 0.4, it is possible to effectively extract the data from the study items. Also indicating the validity of the data is the KMO value of 0.95, which is higher than 0.6. Furthermore, the variance explained that values for the three components were 54.336%, 61.108%, and 67.247%, respectively, and the cumulative variance explained values (Rotated) was 67.847% > 60%. This means that the information content of the study items can be extracted effectively.

3.4.2. Validity Analysis and Factor Analysis of Intermediary Variables

The intermediary variables include consumer cognition and consumer sentiment, and validity analysis and factor analysis were conducted for these two dimensions.
As can be seen from Table 6, the value of KMO is 0.894 and the significance of the Bartlett Test of Sphericity is 0.000 which is less than 0.01 and is suitable for factor analysis. Next, the principal component analysis was adopted to test consumer cognition and consumer emotion.
Table 7 shows that the cumulative variance contribution rate was larger than 65% and the commonality values for all study items are higher than 0.4, so it is possible to effectively extract the data from the study items. Also indicating the validity of the data is the KMO value of 0.95, which is higher than 0.6. Furthermore, the variance explained values for the three components were 58.026% and 67.847%, respectively, and the cumulative variance explained values (Rotated) was 67.847% > 60%. This means that the information content of the study items can be extracted effectively.

3.4.3. Validity Analysis of Dependent Variables

The dependent variable is mainly the consumer purchases of agricultural products, for which a validity analysis was performed. The research assumption serves as the basis for the dependent variable. In equations like regression analysis, the dependent variable is thought to be impacted and predicted. Depending on how it is structured, factor analysis may or may not be necessary for the dependent variable. Factor analysis is required if the dependent variable has a multidimensional rather than a unidimensional structure, or if the multi-factor structure has a more precise and unambiguous meaning than the single structure. It is as though having just one total intelligence score makes sense for intelligence as a dependent variable, but segmenting it into distinct structures like operational intelligence, verbal intelligence, and social intelligence, and then having other factors predict each one separately may make more sense than having just one total intelligence score. This is due to the possibility that the factors may only affect parts of these factors or that they may have various effects. Therefore, validity analysis was conducted only for the dependent variable.
As can be seen from Table 8, the value of KMO is 0.699 and the significance of the Bartlett Test of Sphericity is 0.000, which is less than 0.01.

3.5. Correlation Analysis

In this study, the Pearson correlation coefficient was adopted to analyze the dependence between variables. The following correlation analysis will be performed by SPSS software.
Table 9 shows that Interactive Evaluation (IE) on the Purchasing of Agricultural Products (AP) has a Pearson correlation coefficient of 0.699, which is greater than 0.5. It means that, at the significant level of 0.01, there is a moderate correlation between these two variables. The remaining variables have Pearson correlation coefficients larger than 0.7 which denotes a strong positive correlation between the variables.

3.6. Regression Analysis

3.6.1. Regression Analysis of Short Video Live-Streaming on Purchasing of Agricultural Products

The data is subsequently examined in this section using SPSS software to perform multiple linear regression. After inputting the regression equation, the stepwise entry approach was utilized to look at the outcomes of the independent variables. The relationship between the variables was examined in this manner.
Panel 1 of Table 10 shows that the modified coefficient of determination R2 is 0.636 and that the complex correlation coefficient R is 0.799. This shows that 63.6% of the variation in Purchasing of Agricultural Products (AP) can be explained by the three independent variables. The F is 349.541, with a probability of significance of 0.000, which is less than 0.01. This suggests that both the linear link and the regression effect are highly significant. The DW value is 2.030, which is close to 2, indicating that the data are acceptable and that there is no autocorrelation issue.
Panel 2 shows that the tolerance is more than 0.1 and that all the independent variables’ VIF values are fewer than 10. This shows that the independent variables do not have a multicollinearity issue. The unstandardized coefficients are, respectively, 0.327, 0.357, and 0.222. Content Richness (CR) has the biggest impact on independent variables. Therefore, the hypothesis of H1 holds. The regression equation:
A P = α 0 + α 1 K C + α 2 C R + α 3 I E + ε

3.6.2. Regression Analysis of Short Video Live-Streaming on Consumer Cognition and Emotion

(1)
Short video live-streaming and consumer cognition
By using KOL Charisma (KC), Content Richness (CR), and Interactive Evaluation (IE) as independent variables, and Consumer Cognition (CC) as the dependent variable, multiple linear regression was carried out.
Panel 1 of Table 11 shows that the modified coefficient of determination R2 is 0.644 and the complex correlation coefficient R is 0.803. This shows that 64.4% of the variation in Consumer Cognition (CC) can be explained by three independent variables. The F is 361.655 with a probability of significance of 0.000 and less than 0.01. This suggests that both the linear link and the regression effect are highly significant. The DW value is 2.017, which is close to 2, indicating that the data are acceptable and that there is no autocorrelation issue.
Panel 2 shows that the tolerance is more than 0.1 and that all the independent variables’ VIF values are fewer than 10. This shows that the independent variables do not have a multicollinearity issue. The unstandardized coefficients are, respectively, 0.329, 0.238, and 0.342. Interactive Evaluation (IE) shows the biggest impact on Consumer Cognition (CC).
(2)
Short video live-streaming and consumer emotion
Panel 1 of Table 12 shows that the modified coefficient of determination R2 is 0.679 and the complex correlation coefficient R is 0.825. This shows that 67.9% of the variation in Consumer Emotion (CE) can be explained by three independent variables. The F is 423.123 with a probability of significance of 0.000 and less than 0.01. This suggests that both the linear link and the regression effect are highly significant. The DW value is 1.996, which is close to 2, indicating that the data are acceptable and that there is no autocorrelation issue.
Panel 2 shows that the tolerance is more than 0.1 and that all the independent variables’ VIF values are fewer than 10. This shows that the independent variables do not have a multicollinearity issue. The unstandardized coefficients are, respectively, 0.331, 0.267, and 0.322. KOL Charisma (KC) has the biggest impact on Consumer Emotion (CE).

3.6.3. Regression Analysis of Consumer Cognition and Emotion on Purchasing of Agricultural Products

Consumer perception and consumer emotion were included in the independent variables, and purchasing of agricultural products was included in the dependent variables and was subjected to multiple linear regression.
Panel 1 of Table 13 shows that the modified coefficient of determination R2 is 0.614 and the complex correlation coefficient R is 0.784. This shows that 61.4% of the variation in Consumer Emotion (CE) can be explained by three independent variables. The F is 476.787 with a probability of significance of 0.000, which is less than 0.01. This suggests that both the linear link and the regression effect are highly significant. The DW value is 1.829, which is close to 2, indicating that the data are acceptable and that there is no autocorrelation issue.
As can be seen in Panel 2 of Table 13, the VIF values of both variables are less than 10 and the tolerances are greater than 0.1; this indicates that there is no multicollinearity problem between the variables. The unstandardized coefficients of Consumer Cognition (CC) and Consumer Emotion (CE) are 0.422 and 0.425, respectively.

4. Analysis of Intermediary Variables

We know that there is a significant effect association between KOL Charisma (KC), Content Richness (CR), and Interactive Evaluation (IE) on Purchasing of Agricultural Products (AP) due to the prior regression study. The relationships between KOL Charisma (KC), Content Richness (CR), and Interactive Evaluation (IE) on Consumer Cognition (CC) and Consumer Emotion (CE) are significant. There is a significant effect relationship between Consumer Cognition (CC) and Consumer Emotion (CE) on Purchasing of Agricultural Products (AP). Therefore, in this study, Consumer Cognition (CC) and Consumer Emotion (CE) were introduced into the regression model for testing through SPSS software.

4.1. Consumer Cognition

From Table 14, the regression coefficient of KOL Charisma (KC) changed from 0.327 to 0.239. The regression coefficient of Content Richness (CR) changed from 0.357 to 0.293, and the regression coefficient of Interactive Evaluation (IE) changed from 0.222 to 0.130. Thus, it can be proved that Consumer Cognition (CC) plays a partial mediation in the regression relationship between live streaming on short video platforms (KC, CR, and IE) and Purchasing of Agricultural Products (AP). Hypothesis H2 is valid. The regression equation:
A P c c = β 0 + β 1 K C + β 2 C R + β 3 I E + β 4 C C + ε

4.2. Consumer Emotion

From Table 15, the regression coefficient of KOL Charisma (KC) changed from 0.327 to 0.247. The regression coefficient of Content Richness (CR) changed from 0.357 to 0.292, and the regression coefficient of Interactive Evaluation (IE) changed from 0.222 to 0.144. Thus, it can be proved that Consumer Emotion (CE) plays a partial mediation in the regression relationship between live streaming on short video platforms (KC, CR, and IE) and Purchasing of Agricultural Products (AP). Hypothesis H3 is valid. The regression equation:
A P c e = ω 0 + ω 1 K C + ω 2 C R + ω 3 I E + ω 4 C E + ε

5. Discussion

5.1. Live-Streaming on Short Video Platforms

Short video platforms’ primary feature is social which also includes features like visibility, interactivity, authenticity, entertainment, and convenience. Short videos draw a diverse audience of users and traffic because of their original content strategy. They adopt advertising, live streaming, and audience rewards to gain benefits. “Short video + live streaming” as a new format, with its short time, concise content, rapid dissemination, strong interactivity, and other characteristics, has become an important way to sell agricultural products. Additionally, it enables individual merchants, farmers, and others to directly live stream on a cellphone, with undeniable simplicity.
Compared with [41] Taobao’s e-commerce live streaming study, it can be found that short video platforms are not as complicated to operate as e-commerce platforms; both individual merchants and farmers can livestream directly through their mobile phones to promote their agricultural products. Farmers and individual merchants will find this more convenient which will directly ease the strain on both human and physical capital. Additionally, the bar for its cultural requirements is greatly decreased which is suitable for farmers and independent retailers. Due to the unique qualities of agricultural products, some companies or large organizations live stream production bases of agricultural products directly to consumers through a short video platform. This allows consumers to comprehend the required agricultural products from the source. In addition, short video live streaming might provide viewers with a more intuitive experience on a consumer level. Customers are given enough information to establish a closer relationship with the merchant to increase their involvement and interest, both sensory and mental [27,31,34].

5.2. Model Analysis

Short video live streaming showed a strong positive impact on the Purchasing of Agricultural Products (AP), as demonstrated by the model and regression analysis, supporting hypothesis H1. The degree of influence was Content Richness (CR) > KOL Charisma (KC) > Interactive Evaluation (IE), in that order. While there are similarities with the study of [17], there are also differences. They mainly focus on the different impacts of the KOL study while the impact of KOL in live streaming is classified. We think that, on short video platforms, live streaming is influenced by a variety of factors in addition to KOL, such as how quickly the whole content can draw viewers. For instance, due to the short video platform’s immediacy, users may decide to leave if the live stream does not quickly cause their interest. It is clear from the regression analysis that Content Richness (CR) has the greatest proportion of impact on the Purchasing of Agricultural Products (AP).
When watching live streaming on short video platforms, consumers are impacted by the content, the KOL charisma, and an interactive evaluation of the live streaming. The process of its influence also shows a shift in the attitude with which consumers view the product [14]. We discovered some similarities to the study of [5] in the process of examining the impact of short video live streaming on the purchasing of agricultural products. However, the factors that we introduced were based on consumer attitudes, and we categorized attitudes into cognitive and affective. We did not intentionally introduce willingness because willingness is also generated. After all, short live video banding has a positive impact on consumers’ cognition and emotion.
For instance, KOLs introduce agricultural products from all angles so that people can learn more about their nutritional worth, pricing, and beauty. This alters consumers’ cognition of the products, among other things. On the one hand, consumer attitudes affect their purchasing decisions. Before purchasing a good or service, consumers will develop certain attitudes such as dislike, trust, or distrust. Customers are more inclined to purchase a good or service if they have a positive attitude toward it. Conversely, if customers have a bad opinion of a good or service, they might decide not to purchase it. On the other hand, consumers purchasing agricultural products will impact perceptions in turn. After purchasing a certain product or service, consumers form attitudes based on their consumer experience and how they feel after using it. They are more likely to develop a favorable opinion of the brand and the product and remain devoted clients if they have a positive attitude experience and feeling about the product or service. Conversely, if customers have an unfavorable experience with the product or service and have negative feelings about it, they may develop negative attitudes toward the brand and the product, and they may cease using it.
We conclude that consumer cognition and emotion are intertwined and mutually affect customer brand loyalty and purchasing decisions. This is supported by the regression results of our H2 and H3 hypotheses, which show that the cognitive and affective variables have a sizable beneficial impact on the purchasing of agricultural products.

6. Conclusions

In short, due to the influence of digitalization, agricultural products can change the current traditional marketing mode through live streaming. The live streaming provided by the short video platform is more convenient and the audience is wider. To fully understand the impact of short video live streaming, we chose Nanyang City as the study area. The analysis method includes field research, making questionnaires, and building regression models. The model’s construction introduces the customer’s cognition and emotion. The final results show that the live streaming of short video platforms has a significant positive impact on the sale of agricultural products. Consumer cognition and consumer emotion play a mediating role. The consumption path of the model was identified. Sellers can vigorously develop the short video platform to live carry agricultural products as a way to expand sales channels and increase income. And, through this development, effectively target the two aspects of consumer cognition and consumer emotion to ensure that its sales effect is significant. However, during this study, we did not make a comprehensive analysis of the country because we were doing a pilot study. And we did not introduce factors such as financial resources and logistics costs in our analysis. In our future research, we will take a more sophisticated approach to introduce and analyze these factors. Finally, this study also provides a basis for future research on the virtual economy. It can further explore the application of the short video live streaming model in other fields, providing more reference and inspiration for economic development in the digital era.

Author Contributions

Conceptualization, B.Z., X.L. and W.Z.; Methodology, X.L.; Software, B.Z. and X.L.; Validation, L.W. and D.X.; Formal analysis, W.Z.; Investigation, L.W. and D.X.; Data curation, B.Z.; Writing—original draft, B.Z. and X.L.; Writing—review & editing, B.Z. and W.Z.; Supervision, W.Z. All authors have read and agreed to the published version of the manuscript.

Funding

This research received no external funding.

Institutional Review Board Statement

Not applicable.

Informed Consent Statement

Informed consent was obtained from all subjects involved in the study.

Data Availability Statement

Not applicable.

Conflicts of Interest

The authors declare no conflict of interest.

References

  1. Tang, Y.; Dananjayan, S.; Hou, C.; Guo, Q.; Luo, S.; He, Y. A survey on the 5G network and its impact on agriculture: Challenges and opportunities. Comput. Electron. Agric. 2021, 180, 105895. [Google Scholar] [CrossRef]
  2. Wong, K.X.; Wang, Y.; Wang, R.; Wang, M.; Oh, Z.J.; Lok, Y.H. Shopee: How Does E-commerce Platforms Affect Consumer Behavior during the COVID-19 Pandemic in Malaysia? Int. J. Account. Financ. Asia Pasific. 2023, 6, 38–52. [Google Scholar] [CrossRef]
  3. Chen, T.; Tong, C.; Bai, Y.; Yang, J.; Cong, G.; Cong, T. Analysis of the Public Opinion Evolution on the Normative Policies for the Live Streaming E-Commerce Industry Based on Online Comment Mining under COVID-19 Epidemic in China. Mathematics 2022, 10, 3387. [Google Scholar] [CrossRef]
  4. Zhou, G.J. Research on the Development Countermeasures of “Agricultural Products + Live Broadcast” E-Commerce Model. Asian J. Econ. Bus. Account. 2022, 22, 75–85. [Google Scholar] [CrossRef]
  5. Zheng, S.; Lyu, X.; Wang, J.; Wachenheim, C. Enhancing Sales of Green Agricultural Products through Live Streaming in China: What Affects Purchase Intention? Sustainability 2023, 15, 5858. [Google Scholar] [CrossRef]
  6. Workie, E.; Mackolil, J.; Nyika, J.; Ramadas, S. Deciphering the impact of COVID-19 pandemic on food security, agriculture, and livelihoods: A review of the evidence from developing countries. Curr. Res. Environ. Sustain. 2020, 2, 100014. [Google Scholar] [CrossRef]
  7. Yu, Z.; Zhang, K. The Determinants of Purchase Intention on Agricultural Products via Public-Interest Live Streaming for Farmers during COVID-19 Pandemic. Sustainability 2022, 14, 13921. [Google Scholar] [CrossRef]
  8. Li, X.; Guo, M.; Huang, D. The role of scarcity promotion and cause-related events in impulse purchase in the agricultural product live stream. Sci. Rep. 2023, 13, 3800. [Google Scholar] [CrossRef]
  9. Wang, Z.; Li, J.; Chen, P. Factors influencing Chinese flower and seedling family farms’ intention to use live streaming as a sustainable marketing method: An application of extended theory of planned behavior. Environ. Dev. Sustain. 2022, 24, 4299–4322. [Google Scholar] [CrossRef]
  10. Jiang, S.; Wang, Z.; Sun, Z.; Ruan, J. Determinants of Buying Produce on Short-Video Platforms: The Impact of Social Network and Resource Endowment—Evidence from China. Agriculture 2022, 12, 1700. [Google Scholar] [CrossRef]
  11. Lv, X.; Zhang, R.; Su, Y.; Yang, Y. Exploring how live streaming affects immediate buying behavior and continuous watching intention: A multigroup analysis. J. Travel Tour. Mark. 2022, 39, 109–135. [Google Scholar] [CrossRef]
  12. Li, L.; Kang, K.; Feng, Y.; Zhao, A. Factors affecting online consumers’ cultural presence and cultural immersion experiences in live streaming shopping. J. Mark. Anal. 2022, 1–14. [Google Scholar] [CrossRef]
  13. Yang, J.; Zeng, Y.; Liu, X.; Li, Z. Nudging interactive cocreation behaviors in live-streaming travel commerce: The visualization of real-time danmaku. J. Hosp. Tour. Manag. 2022, 52, 184–197. [Google Scholar] [CrossRef]
  14. Wang, B.; Xie, F.; Kandampully, J.; Wang, J. Increase hedonic products purchase intention through livestreaming: The mediating effects of mental imagery quality and customer trust. J. Retail. Consum. Serv. 2022, 69, 103109. [Google Scholar] [CrossRef]
  15. Huang, T.Y.; Chen, W.K.; Chen, C.W.; Silalahi, A.D.K. Understanding how product reviews on YouTube affect consumers’ purchase behaviors in Indonesia: An exploration using the stimulus-organism-response paradigm. Hum. Behav. Emerg. Technol. 2022, 2022, 4976980. [Google Scholar] [CrossRef]
  16. Liu, Z. The impact of the legitimacy of livestream shopping on consumers’ willingness to buy. In Proceedings of the 2022 7th International Conference on Social Sciences and Economic Development (ICSSED 2022), Durham, UK, 29 April 2022; Atlantis Press: Amsterdam, The Netherlands, 2022; pp. 432–440. [Google Scholar] [CrossRef]
  17. Zheng, S.; Chen, J.; Liao, J.; Hu, H.L. What motivates users’ viewing and purchasing behavior motivations in live streaming: A stream-streamer-viewer perspective. J. Retail. Consum. Serv. 2023, 72, 103240. [Google Scholar] [CrossRef]
  18. Zhou, Y.; Huang, W. The influence of network anchor traits on shopping intentions in a live streaming marketing context: The mediating role of value perception and the moderating role of consumer involvement. Econ. Anal. Policy 2023, 78, 332–342. [Google Scholar] [CrossRef]
  19. Liu, L.; Aremu, E.O.; Yoo, D. Brand marketing strategy of live streaming in mobile era: A case study of Tmall platform. J. East Asia Manag. 2020, 1, 65–87. [Google Scholar] [CrossRef]
  20. Jiang, X.; Guangkuo, G.; Xuezheng, Y. Evolutionary game analysis on live streaming commerce considering brand awareness and anchor influence. Kybernetes, 2022; ahead-of-print. [Google Scholar] [CrossRef]
  21. Bründl, S.; Matt, C.; Hess, T.; Engert, S. How Synchronous Participation Affects the Willingness to Subscribe to Social Live Streaming Services: The Role of Co-Interactive Behavior on Twitch. Eur. J. Inf. Syst. 2022, 32, 1–18. [Google Scholar] [CrossRef]
  22. Ma, X.; Zou, X.; Lv, J. Why do consumers hesitate to purchase in live streaming? A perspective of interaction between participants. Electron. Commer. Res. Appl. 2022, 55, 101193. [Google Scholar] [CrossRef]
  23. Zheng, S.; Wu, M.; Liao, J. The impact of destination live streaming on viewers’ travel intention. Curr. Issues Tour. 2023, 26, 184–198. [Google Scholar] [CrossRef]
  24. Marchegiani, L. Digital Transformation and Knowledge Management; Routledge: Britain, UK, 2021; pp. 10–40. [Google Scholar]
  25. He, X. High Reputation Companies’ Social Media Performance in the Context of Chinese Digital Market: Based on Sina Weibo and WeChat Platforms. Doctoral Dissertation, Universitat Pompeu Fabra, Barcelona, Spain, 2017. Available online: http://hdl.handle.net/10803/458524 (accessed on 12 August 2023).
  26. Guo, H.; Sun, X.; Pan, C.; Xu, S.; Yan, N. The Sustainability of Fresh Agricultural Produce Live Broadcast Development: Influence on Consumer Purchase Intentions Based on Live Broadcast Characteristics. Sustainability 2022, 14, 7159. [Google Scholar] [CrossRef]
  27. Xiao, Q.; Wan, S.; Zhang, X.; Siponen, M.; Qu, L.; Li, X. How consumers’ perceptions differ towards the design features of mobile live streaming shopping platform: A mixed-method investigation of respondents from Taobao Live. J. Retail. Consum. Serv. 2022, 69, 103098. [Google Scholar] [CrossRef]
  28. Ho, C.I.; Liu, Y.; Chen, M.C. Antecedents and consequences of consumers’ attitudes toward live streaming shopping: An application of the stimulus–organism–response paradigm. Cogent Bus. Manag. 2022, 9, 2145673. [Google Scholar] [CrossRef]
  29. Zhu, B.; Xu, P.; Wang, K. A Multi-group Analysis of Gender Difference in Consumer Buying Intention of Agricultural Products via Live Streaming. Res. World Agric. Econ. 2023, 4, 25–35. [Google Scholar] [CrossRef]
  30. Dong, X.; Zhao, H.; Li, T. The Role of Live-Streaming E-Commerce on Consumers’ Purchasing Intention regarding Green Agricultural Products. Sustainability 2022, 14, 4374. [Google Scholar] [CrossRef]
  31. Li, S.; Dou, Q.; Yu, Z. The influence mechanism of quasi-site creativity stimulation on consumers’ impulse buying in e-commerce live streaming. Multimed. Tools Appl. 2023, 82, 37407–37430. [Google Scholar] [CrossRef]
  32. Wang, Y.; Lu, Z.; Cao, P.; Chu, J.; Wang, H.; Wattenhofer, R. How live streaming changes shopping decisions in E-commerce: A study of live streaming commerce. Comput. Support. Coop. Work. (CSCW) 2022, 31, 701–729. [Google Scholar] [CrossRef]
  33. Tong, X.; Chen, Y.; Zhou, S.; Yang, S. How background visual complexity influences purchase intention in live streaming: The mediating role of emotion and the moderating role of gender. J. Retail. Consum. Serv. 2022, 67, 103031. [Google Scholar] [CrossRef]
  34. Dang-Van, T.; Vo-Thanh, T.; Vu, T.T.; Wang, J.; Nguyen, N. Do consumers stick with good-looking broadcasters? The mediating and moderating mechanisms of motivation and emotion. J. Bus. Res. 2023, 156, 113483. [Google Scholar] [CrossRef]
  35. Steinert, S.; Dennis, M.J. Emotions and digital well-being: On social media’s emotional affordances. Philos. Technol. 2022, 35, 36. [Google Scholar] [CrossRef] [PubMed]
  36. Xu, X. A growing or depreciating love? Linking time with customer satisfaction through online reviews. Inf. Manag. 2022, 59, 103605. [Google Scholar] [CrossRef]
  37. Yan, M.; Kwok, A.P.K.; Chan, A.H.S.; Zhuang, Y.S.; Wen, K.; Zhang, K.C. An empirical investigation of the impact of influencer live-streaming ads in e-commerce platforms on consumers’ buying impulse. Internet Res. 2022; ahead-of-print. [Google Scholar] [CrossRef]
  38. Bawack, R.E.; Bonhoure, E.; Kamdjoug, J.R.K.; Giannakis, M. How social media live streams affect online buyers: A uses and gratifications perspective. Int. J. Inf. Manag. 2023, 70, 102621. [Google Scholar] [CrossRef]
  39. Lin, S.C.; Tseng, H.T.; Shirazi, F.; Hajli, N.; Tsai, P.T. Exploring factors influencing impulse buying in live streaming shopping: A stimulus-organism-response (SOR) perspective. Asia Pac. J. Mark. Logist. 2022; ahead-of-print. [Google Scholar] [CrossRef]
  40. Narisara, T. The Intention Purchase Toward Fashion Product from Live Streaming Channel. Doctoral Dissertation, Mahidol University, Salaya, Thailand, 2022. Available online: https://archive.cm.mahidol.ac.th/handle/123456789/4631 (accessed on 12 August 2023).
  41. Jing, G. Research on the Development Strategy of the Livestreaming E-commerce Industry under the Epidemic: Taking Taobao as an Example. Highlights Bus. Econ. Manag. 2023, 5, 48–54. [Google Scholar] [CrossRef]
Figure 1. Consumption path.
Sustainability 15 14948 g001
Figure 2. Model of the impact.
Sustainability 15 14948 g002
Figure 3. Research Framework.
Sustainability 15 14948 g003
Table 1. Variable table.
NumberIndicatorAbbreviationIndicator Definition
Independent VariableKOL CharismaKCThe KOL includes celebrities, weblebrities, officials, and individual businesses (including farmers) in the short video live streaming. Customers will have varying tastes for the type and style of KOL.
Content RichnessCRThe marketing content created in the short video live streaming, such as any fun language around the product, etc.
Interactive EvaluationIEInteraction between KOLs and customers, as well as the bullet screen of relevant comments on the product by consumers, both old and new.
Intermediary variableConsumer CognitionCCThe degree of consumer cognition of products, services, etc. through short video live streaming.
Consumer EmotionCEThe impact of short video live streaming on consumer emotions in the process with goods.
Dependent variablePurchasing of Agricultural ProductsAPWhether consumers will buy produce.
Table 2. Descriptive statistical analysis.
Population Basic CharacteristicsFrequencyFrequency Rate
GenderMale29649%
Female30451%
Age18–30 years old25442.3%
31–40 years old19332.2%
41–50 years old11619.3%
Over 50 years old376.1%
EducationHigh school/vocational school and below9315.5%
Junior college17028.3%
Bachelor’s degree28848%
Master’s degree and above498.2%
OccupationCurrent students17728.5%
Corporate employees24140.2%
Private professionals8113.5%
Government workers6611%
Other occupations355.8%
Monthly IncomeLess than 4000 yuan25342.2%
4001–6000 yuan8814.7%
6001–8000 yuan8814.7%
8001–10,000 yuan6510.8%
Above 10,000 yuan10617.7%
Favorite Short Video AppTik Tok40367.2%
Kuai Shou9515.8%
Wei Shi233.8%
Huo Shan6410.7%
Other152.5%
Table 3. Results of the overall reliability analysis of the sample.
CRONBACH’S ALPHA NUMBER OF ITEMS
0.94819
Table 4. Results of KMO sample measures and Bartlett test of sphericity for independent variables.
KMO0.950
Bartlett Test of SphericityApproximate Cardinality2817.226521
Degree of Freedom45
Significance0.000
Table 5. Total variance explained.
Initial EigenvalueExtracted Load Sum of SquaresRotated Load Sum of Squares
TotalVariance % CumulativeCumulative %TotalVariance % CumulativeCumulative %TotalVariance % CumulativeCumulative %
5.43454.33654.3365.43454.33654.3362.46324.62624.626
0.6776.77161.1080.6776.77161.1082.30123.00847.634
0.6146.14067.2470.6146.14067.2471.96119.61467.247
0.5765.75873.005
0.5465.45578.461
0.5105.10483.565
0.4794.79288.357
0.4724.71993.076
0.4594.59197.667
0.2332.333100.000
Table 6. Results of KMO sample measures and Bartlett test of sphericity for Intermediary variables.
KMO0.894
Bartlett Test of SphericityApproximate Cardinality1315.715353
Degree of Freedom15
Significance0.000
Table 7. Total variance explained.
Initial EigenvalueExtracted Load Sum of SquaresRotated Load Sum of Squares
TotalVariance % CumulativeCumulative %TotalVariance % CumulativeCumulative %TotalVariance % CumulativeCumulative %
3.48258.02658.0263.48258.02658.0262.19836.63936.639
0.5899.82167.8470.5899.82167.8471.87231.20867.847
0.5338.88876.735
0.4868.10784.842
0.4597.65492.497
0.4507.503100.000
Table 8. Results of KMO sample measures and Bartlett test of sphericity for Dependent variables.
KMO0.699
Bartlett Test of SphericityApproximate Cardinality466.530287
Degree of Freedom3
Significance0.000
Table 9. Correlation analysis.
VariablesKCCRIECCCEAP
KCPearson Correlation1
Significance (Two-Tailed)
CRPearson Correlation0.768 **1
Significance (Two-Tailed)0.000
IEPearson Correlation0.764 **0.706 **1
Significance (Two-Tailed)0.0000.000
CCPearson Correlation0.748 **0.708 **0.738 **1
Significance (Two-Tailed)0.0000.0000.000
CEPearson Correlation0.768 **0.735 **0.752 **0.746 **1
Significance (Two-Tailed)0.0000.0000.0000.000
APPearson Correlation0.743 **0.737 **0.699 **0.733 **0.732 **1
Significance (Two-Tailed)0.0000.0000.0000.0000.000
** At the 0.01 level (two-tailed), the correlation is significant.
Table 10. Regression analysis.
Panel 1. Regression analysis results.
ModelsRR2Adjusted R2Error in Standard
Estimation
R2 Amount of
Change
FSignificanceDW
10.7990.6380.6360.522140.638349.5410.0002.030
Panel 2. Regression matrix.
ModelUnstandardized
Coefficients
BetatSignificanceCovariance Statistics
BStandard ErrorToleranceVIF
1(Constant)0.4000.109 3.6760.000
KC0.3270.0460.3147.1180.0000.3123.203
CR0.3570.0420.3428.4930.0000.3762.660
IE0.2220.0410.2185.4620.0000.3812.621
Predictor variable: (constant), KOL Charisma (KC), Content Richness (CR), and Interactive Evaluation (IE). Dependent variable: Purchasing of Agricultural Products (AP).
Table 11. Regression analysis.
Panel 1. Regression analysis results.
ModelsRR2Adjusted R2Error in Standard EstimationR2 Amount of
Change
FSignificanceDW
20.8030.6450.6440.516080.645361.6550.0002.017
Panel 2. Regression matrix.
ModelUnstandardized coefficientsBetatSignificanceCovariance statistics
BStandard errorToleranceVIF
2(Constant)0.3630.108 3.3740.001
KC0.3290.0450.3167.2430.0000.3123.203
CR0.2380.0420.2285.7260.0000.3762.660
IE0.3420.0400.3368.5010.0000.3812.621
Predictor variable: (constant), KOL Charisma (KC), Content Richness (CR), and Interactive Evaluation (IE). Dependent variable: Consumer Cognition (CC).
Table 12. Regression analysis.
Plan 1. Regression analysis results.
ModelsRR2Adjusted R2Error in Standard EstimationR2 Amount of
Change
FSignificanceDW
20.8250.6800.6790.482570.680423.1230.0001.996
Plan 2. Regression matrix.
ModelUnstandardized coefficientsBetatSignificanceCovariance statistics
BStandard errorToleranceVIF
2(Constant)0.3070.101 3.0490.002
KC0.3310.0430.3237.7920.0000.3123.203
CR0.2670.0390.2606.8820.0000.3762.660
IE0.3220.0380.3218.5710.0000.3812.621
Predictor variable: (constant), KOL Charisma (KC), Content Richness (CR), and Interactive Evaluation (IE). Dependent variable: Consumer Emotion (CE).
Table 13. Regression analysis.
Panel 1. Regression analysis results.
ModelsRR2Adjusted R2Error in standard estimationR2 Amount of
change
FSignificanceDW
30.7840.6150.6140.537740.615476.7870.0001.829
Panel 2. Regression matrix.
ModelUnstandardized coefficientsBetatSignificanceCovariance statistics
BStandard errorToleranceVIF
3(Constant)0.6250.107 5.8460.000
CC0.4220.0380.42111.0520.0000.4442.255
CE0.4250.0390.41810.9590.0000.4442.255
Predictor variable: (constant), Consumer Cognition (CC), and Consumer Emotion (CE). Dependent variable: Purchasing of Agricultural Products (AP).
Table 14. Regression matrix.
ModelUnstandardized
Coefficients
BetatSignificanceCovariance Statistics
BStandard ErrorToleranceVIF
(Constant)0.4000.109 3.6760.000
KC0.3270.0460.3147.1180.0000.3123.203
CR0.3570.0420.3428.4930.0000.3762.660
IE0.2220.0410.2185.4620.0000.3812.621
(Constant)0.3020.106 2.8510.005
KC0.2390.0460.2295.1550.0000.2873.485
CR0.2930.0420.2807.0310.0000.3562.807
IE0.1300.0420.1283.1280.0020.3402.939
CC0.2700.0400.2706.7490.0000.3552.820
Dependent variable: Purchasing of Agricultural Products (AP).
Table 15. Regression matrix.
ModelUnstandardized
Coefficients
BetatSignificanceCovariance Statistics
BStandard ErrorToleranceVIF
(Constant)0.4000.109 3.6760.000
KC0.3270.0460.3147.1180.0000.3123.203
CR0.3570.0420.3428.4930.0000.3762.660
IE0.2220.0410.2185.4620.0000.3812.621
(Constant)0.3260.107 3.0460.002
KC0.2470.0470.2375.2490.0000.2833.530
CR0.2920.0430.2806.8610.0000.3482.872
IE0.1440.0420.1423.4280.0010.3402.944
CE0.2420.0430.2385.5980.0000.3203.130
Dependent variable: Purchasing of Agricultural Products (AP).
Disclaimer/Publisher’s Note: The statements, opinions and data contained in all publications are solely those of the individual author(s) and contributor(s) and not of MDPI and/or the editor(s). MDPI and/or the editor(s) disclaim responsibility for any injury to people or property resulting from any ideas, methods, instructions or products referred to in the content.

