Article

Simulation-Based Study of the Resilience of Flexible Manufacturing Layouts Subject to Uncertain Demands of Product Variants

Department of Mechanical and Manufacturing Engineering, University of Calgary, Calgary, AB T2N 1N4, Canada
*
Author to whom correspondence should be addressed.
Sustainability 2023, 15(20), 14946; https://doi.org/10.3390/su152014946
Submission received: 3 September 2023 / Revised: 29 September 2023 / Accepted: 13 October 2023 / Published: 17 October 2023
(This article belongs to the Section Sustainable Products and Services)

Abstract

:
Due to market competition, manufacturers typically produce their products with different customized features, leading to the production of product variants (or a product family). Since the market trend can change swiftly, the demands of individual product variants can be difficult to predict. Two flexible manufacturing layouts are commonly considered: functional and cellular layouts. While the functional layout is more resilient to demand changes due to better resource pooling, the cellular layout can be more productive on some occasions due to better routing efficiency. In this context, the purpose of this paper is to quantify and study the criticality of product variants. The criticality score of a product variant can estimate and rank which product variants can sensitively cause bottlenecks in the functional and cellular layouts. The proposed criticality analysis starts with the estimation of bottleneck machines. Through the dependency information of machines and parts, we can estimate the criticality of product variants. The criticality analysis is demonstrated and examined through a simulation study with a study case involving the production of five furniture products with 16 unique parts using 11 machines. The simulation results show that the productions with more critical product variants tend to deteriorate the completion time of the cellular layout more severely. In practice, manufacturers can use the proposed criticality analysis to evaluate the criticality of product variants and support their facility layout decision. For example, if more demand for critical products is expected, the layout should support more resource pooling (e.g., functional layouts).

1. Introduction

Due to market competition, manufacturers need to serve the diverse needs of customers. This leads to the topic of product variety, which concerns the design and manufacturing of a set of product variants (or a product family) [1]. To manage the complexity of production, modular design is often adopted, wherein product variants of the same family share the same product architecture with different components or modules [2]. Product variants can also share common parts to keep the production cost manageable [3].
Industry 4.0, as an important technological trend, refers to a range of interconnected technologies such as cloud computing, the Internet of Things, and cyber-physical systems, which can support production systems in coping with market challenges [4]. Its potential has been discussed in the contexts of product customization [5], cellular manufacturing [6], mass personalization production [7], and sustainable manufacturing [8]. To deploy new technologies of Industry 4.0, decision-making methods have been proposed to support the selection of digital technologies [9] and sustainable machining process [10]. Along with these contexts, this paper focuses on the resilience of facility layouts, which cannot be easily changed over time, subject to uncertain demands of product variants.
While the demands for certain product types (e.g., total vehicle sales) can be forecasted, estimating the demands for individual product variants (e.g., sales of a specific vehicle model) is more challenging. Further, it has been identified that the demands of product variants can be negatively correlated [11]. For example, as total vehicle sales remain relatively stable, higher sales of vehicles model ABC could imply lower sales of some other vehicle models. This research is interested in how the uncertain demands of product variants, which are negatively correlated, can impact the resilience of flexible manufacturing systems in view of their productivity.
Two layouts for flexible manufacturing are common in practice: functional and cellular layouts. Functional layouts focus on grouping machines of similar manufacturing (or machining) functions (e.g., drilling machines are grouped to form a drilling department on the production floor). As work-in-progress parts are free to visit different manufacturing departments, functional layouts allow for flexible routings. They also tend to be more resilient to changes in part demands due to resource pooling [12]. In contrast, cellular layouts form different groups of dissimilar machines (i.e., manufacturing cells), where each group can produce a subset of parts (or part family). Since cells are specialized in producing specific parts, they tend to be more efficient in terms of productivity [13]. However, they are less flexible due to more restricted routings and the loss of resource pooling [12].
In the context of uncertain demands, both functional and cellular layouts can be considered as comparable choices, offering various levels of flexibility in manufacturing with the trade-off of productivity. However, it is important to note that layout decisions cannot be easily reversed, as layout changes can entail high costs and delays. To support these layout decisions, this paper proposes a criticality analysis that estimates how sensitive of a product variant can impact a layout’s performance.
For example, suppose the criticality analysis indicates that an increased production of product variant ‘A’ can sensitively deteriorate the performance of the cellular layout. If the manufacturer anticipates high future demands for product variant ‘A’, they should opt for the functional layout. In essence, the proposed criticality analysis examines the possible bottleneck machines that individual product variants may use in the production process. If a product variant can easily cause bottleneck machines, this product variant is considered “critical” in the production process.
In our view, the resilience of facility layouts subject to uncertain demands is an important element for sustainable manufacturing. Flores-Siguenza et al. [14] reviewed and discussed resilience factors for facility layout problems (FLP). Both sustainability and resilience have been considered relevant factors in the design of supply chains [15,16]. The investigation of product demands and facility layout performance in this paper can help us understand how layout decisions can make the production system more sustainable in response to market changes.
In the remainder of this paper, Section 2 will provide a literature review. Section 3 will present the model of a manufacturing system with the study case for illustration. Section 4 will propose the criticality analysis with the evaluation details. Section 5 will examine the proposed criticality analysis using discrete event simulation and statistical analysis. Section 6 will conclude this paper.

2. Literature Review

2.1. Comparison Studies of Functional and Cellular Layouts

The difference between functional and cellular layouts lies in their principles of organizing (or grouping) machines on a production floor. While the functional layout focuses on grouping machines with similar manufacturing (or machining) functions, the cellular layout forms different groups of dissimilar machines (i.e., manufacturing cells), where each group can produce a subset of parts (or part families). According to the review by [17], the comparison of functional and cellular layouts has been studied since at least the 1970s. As a new concept back then, early studies tried to identify and explore the potentials of the cellular layout [13,18]. When the concepts and practices of group technology and cellular manufacturing became better known, researchers conducted comparison studies between functional and cellular layouts using simulations and empirical data. The review by [17] summarized the trade-off in performance metrics between the two layouts from prior studies. Though there is no consensus on all performance aspects, they generally identify some patterns. First, the cellular layout tends to perform better with shorter setup and inter-station move times. In contrast, the functional layout tends to work well with shorter wait times in machine queues and flow times.
Following the review paper by [17], several comparison studies can be found in the literature. Huq et al. [19] examined how lot sizes and setup time reductions affect the performance of both layouts. Their study emphasized the need for setup time reduction to make the cellular layout competitive, while large lot sizes tend to narrow the throughput performance of two layouts. Assad et al. [12] examined the trade-off between pooling loss (due to the splitting of machine resources) and setup time reduction, justifying the need for setup time reduction in the cellular layout to compensate its pooling loss. Pitchuka et al. [20] analyzed the effects of four factors (i.e., processing time, setup time, batch size, and part arrival) on the queue times of both layouts and verified that the partitioning of part production into cells can reduce the variability of processing time and part arrival. This benefit of variability reduction could compensate the disadvantage of the pooling loss of the cellular layout in some cases.
In addition, researchers have started to extend their considerations beyond the traditional scope of investigations, such as quantification of operational cost (including setup cost, work-in-progress inventory cost, quality cost, and setup time reduction cost) [21], the use of the Taguchi method (or design of experiments) for comparative study [22], and the implementation of pull production control through “Constant Work-in-Progress” (CONWIP) in contrast to kanban [23].
Early papers have identified that changes in part demands can alter the relative performance of functional and cellular layouts [24,25,26]. Seifoddini and Djassemi [27] characterized the percentage of product mix change and showed that the cellular layout tends to perform weakly with increasing product mix variations. Djassemi [28] followed a similar characterization of changes for a system with flexible cross-trained operators and obtained a similar observation that the cellular layout tends to be more sensitive to demand changes. Jithavech & Krishnan [29] interpreted the uncertainty of product demands as a type of risk, which can affect a layout’s efficiency. Thus, demand forecasts and multi-period information have been considered for designing cellular layouts [30,31,32,33].
With this abovementioned background, our study differs in two ways. First, our study adds a layer of “product variant” which are combinations of multiple parts, and we examine the demand uncertainty of product variants (but not parts directly). We consider that the demand uncertainty of product variants is closer to the actual market information associated with product variety [11] and supply chain management [6]. Second, our study aims to evaluate which product variants (subject to demand uncertainty) tend to affect the layout’s performance more (i.e., the performance’s sensitivity to demand changes). To the best of our knowledge, this aspect has not been explored in the literature.

2.2. Numerical Approaches and the Concept of Criticiality

Facility layout problems involve the placement of machines on a production floor, and these problems are inherently combinatorial and challenging to solve [34]. Various numerical approaches have been proposed to analyze and optimize flexible manufacturing systems, such as the use of surrogate functions to reduce simulation efforts [35] and the use of Colored Petri Net to capture system dynamics [36]. Lidberg et al. [37] used results from discrete event simulation and multi-objective optimization to develop a decision tree for operational management. Yadav and Jayswal [38] reviewed numerical approaches for flexible manufacturing systems.
Notably, layout decisions are early-stage decisions, and their effectiveness often depends on uncertain downstream variables (e.g., demands of product variants in this paper). Therefore, this research proposes a criticality analysis. This proposed analysis focuses on one key factor, i.e., bottleneck machines, which can be estimated through the part composition of product variants and machine requirements. Then, discrete event simulation is used to examine how the criticality analysis can support layout decisions.
In this research, bottleneck machines are identified as the key factor that affects the completion time of a production order. We examine the associations among bottleneck machines, parts, and product variants to estimate which product variants can significantly affect the layout’s performance. The concepts of “bottleneck” and “criticality” guide the development of our criticality analysis. In the literature, the notion of a bottleneck can be interpreted as a “point of congestion” [39] and is associated with a factor that can sensitively influence a system’s performance [40,41]. In context of bottleneck detection, Leporis & Králová [39] identified and compared four basic approaches (i.e., active period, turning point, arrow-based method, and criticality indicator) using simulation studies. Further developments have been focused on short-term bottleneck detection and control [42], shifting bottlenecks [41], bottleneck prediction using data analysis [43,44], and cluster analysis to classify bottleneck machines [45].
At the same time, the notion of “machine criticality” has been used to analyze and determine maintenance plans [46,47,48]. Balog et al. [49] evaluated the “critical ratio” associated with due dates and lead times to dispatch jobs in a production system. Notably, while our study references the bottleneck and criticality concepts in the development of the analysis method, the context of our application is not the same. For example, our research goal is not to detect bottleneck or critical machines but to use “offline” (i.e., not real-time) information to estimate the sensitivity of product variant demands towards the relative performance of functional and cellular layouts.

3. Manufacturing System Modeling and the Study Case

3.1. Basic System Model

In this work, a manufacturing system that produces a family of product variants can be described through four sets of elements: product variants (V), parts (P), machines (M), and machine types (T). The set of product variants represents the product family to be produced by the system, denoted as V = {v1, v2, …, vr}, representing r different product variants. The set of parts consists of n different types of parts, denoted as P = {p1, p2, …, pn}, which are required to produce the product family. Suppose that the manufacturing system has m machines, denoted as a set M = {m1, m2, …, mm}, representing the total machine resources. Some machines can be duplicated, meaning that they belong to the same type of machines and perform the same manufacturing functions. Suppose that there are q types of machines, and the set of machine types is denoted as T = {t1, t2, …, tq}. To better track the notations of these elements, Table 1 lists the sets of these elements along with their subscript indices and the total number of elements in each set.
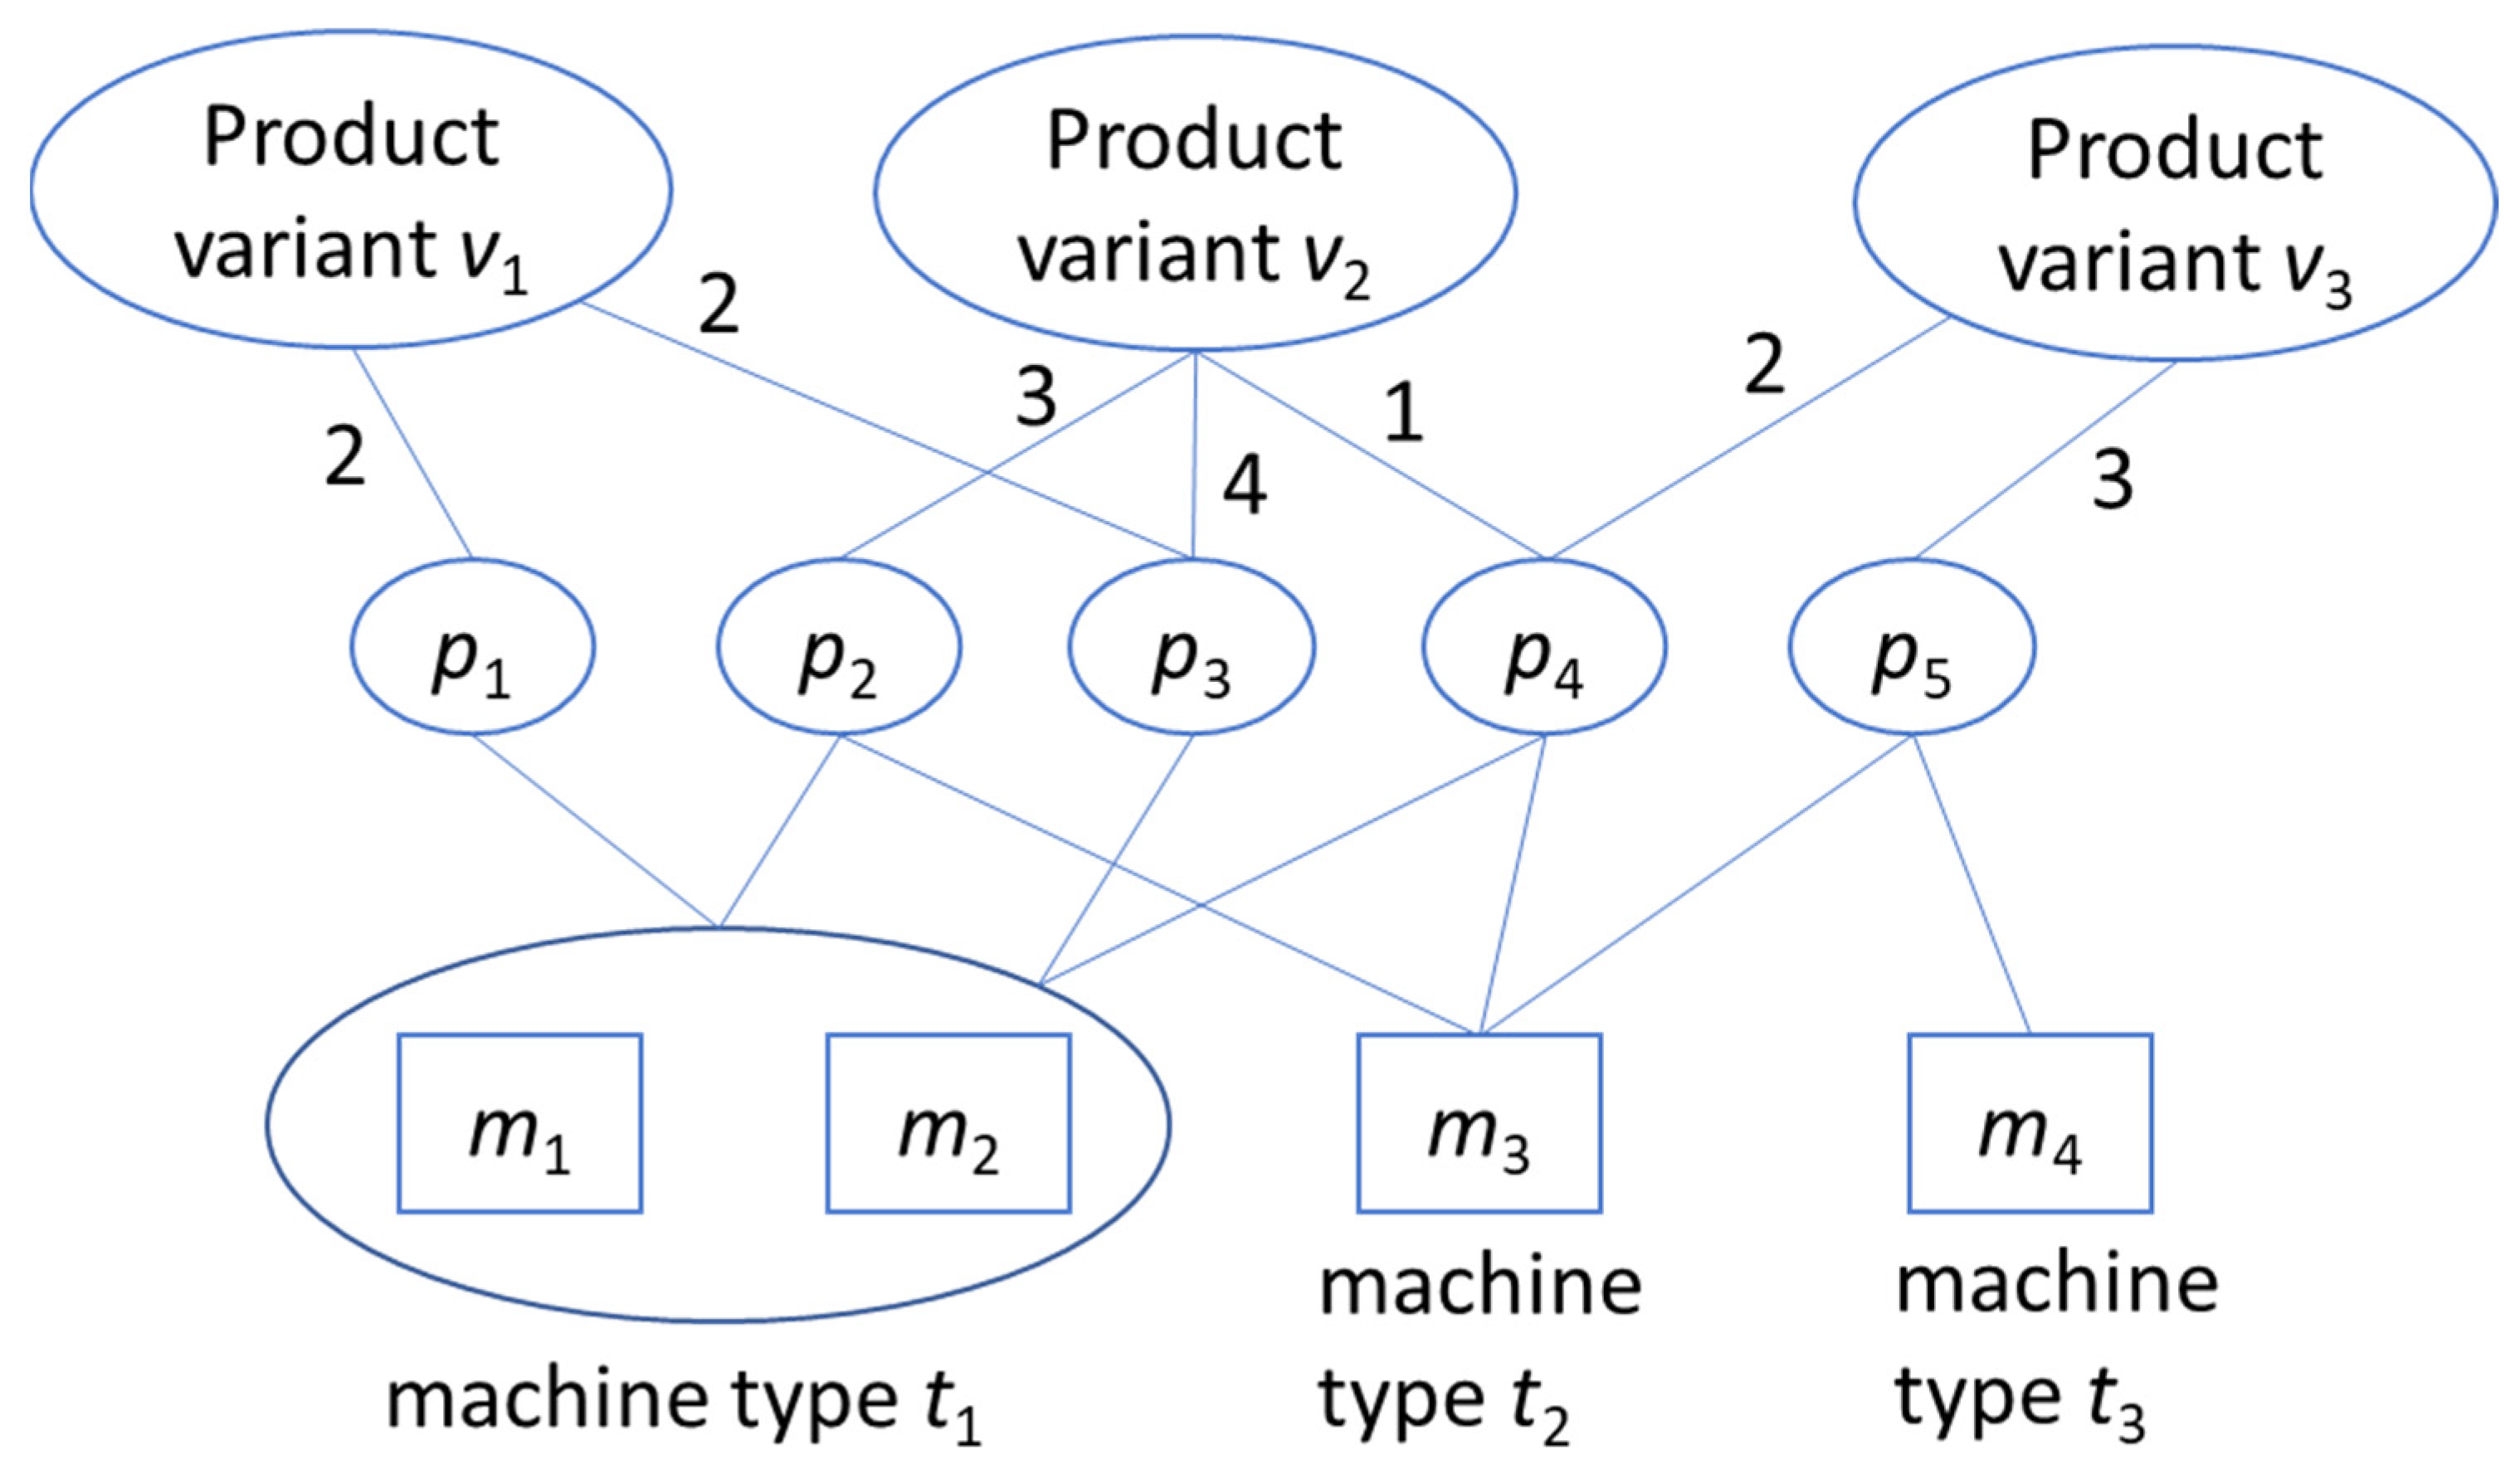
The relationships between the elements of these sets are illustrated in Figure 1. Starting from the top, each product variant is composed of a subset of parts, with the numbers on the links indicating the required numbers of each part. For example, Figure 1 shows that product variant v1 is made of two pieces of part p1 and two pieces of part p3. To define these relationships, a part-variant matrix, denoted as PV = [pvih], is used, where pvih is the number of part pi required to make product variant vh.
The next layer describes the machine requirements to make each part. Let us denote a matrix that maps the binary relationships between parts and machine types, PT = [ptik], where ptik = 1 if machine type tk is required to make part pi (otherwise, ptik = 0). Furthermore, machine duplication is allowed within each machine type. For example, Figure 1 shows that machines m1 and m2 are duplicates for machine type t1. Then, as part p1 requires the service of machine type t1, part p1 can use either machine m1 or m2 to complete the job. To capture these relationships, let us denote a machine-type matrix, MT = [mtjk], where mtjk = 1 if machine mj belongs to machine type tk (otherwise, mtjk = 0).
Notably, the framework model in Figure 1 does not include fixtures, the importance of which should not be underestimated in manufacturing systems [50,51]. In the context of product variety (or mass customization), flexible fixtures are particularly relevant and can be classified into two types: traditional and modern [52]. Traditional flexible fixtures can be found in flexible clamping systems, general-purpose workholders and modular fixtures, which can accommodate different workpieces [53]. Ivanov et al. [54] developed new flexible fixtures to manufacture three different types of parts: levers, forks, and connecting rods. Ivanov et al. [55] further analyzed and demonstrated the economic benefits of using flexible fixtures, which can effectively support small-batch productions with frequent changes of tools. An example of modern flexible fixtures can be found in [52], where adaptive clamping units are used to reduce the distortion of the workpieces. However, the scope of this research is defined at a relatively high level, leaving the consideration of flexible fixtures and setup times as potential areas for future work.

3.2. Introduction to the Study Case

To keep the discussion concrete and easy to follow, we introduce the study case, which is used to demonstrate and examine the research in this paper. The study case is adopted from [56] and involves the production of five furniture products (e.g., shelf, wardrobe, horizontal dresser, vertical dresser, and computer table). These products (or product variants) can be constructed using 16 different wooden plates (i.e., 16 types of parts). The manufacturing system consists of 11 machines, which are classified into 7 machine types.
The information of the PV matrix, PV = [pvih], which describes the number of part pi required to make product variant vh, is provided in Table 2. For example, Table 2 shows that pv21 = 2, indicating that two pieces of part p2 are required to make product variant v1. Furthermore, the matrix of parts and machine types, PT = [ptik], is provided in Table 3.
The machine information of the study case is listed in Table 4. The machine type outlines the specific machine function. If a machine type has multiple machine labels (e.g., drilling machine t5m7, m8, m9), it implies that this machine type has machine duplication (e.g., there are three machines for the drilling function). At this point, the manufacturer can choose between the functional or cellular layout, which will affect the processing time, transfer time, and part routing. These layouts are further explained in next two sections.

3.3. Functional Layout

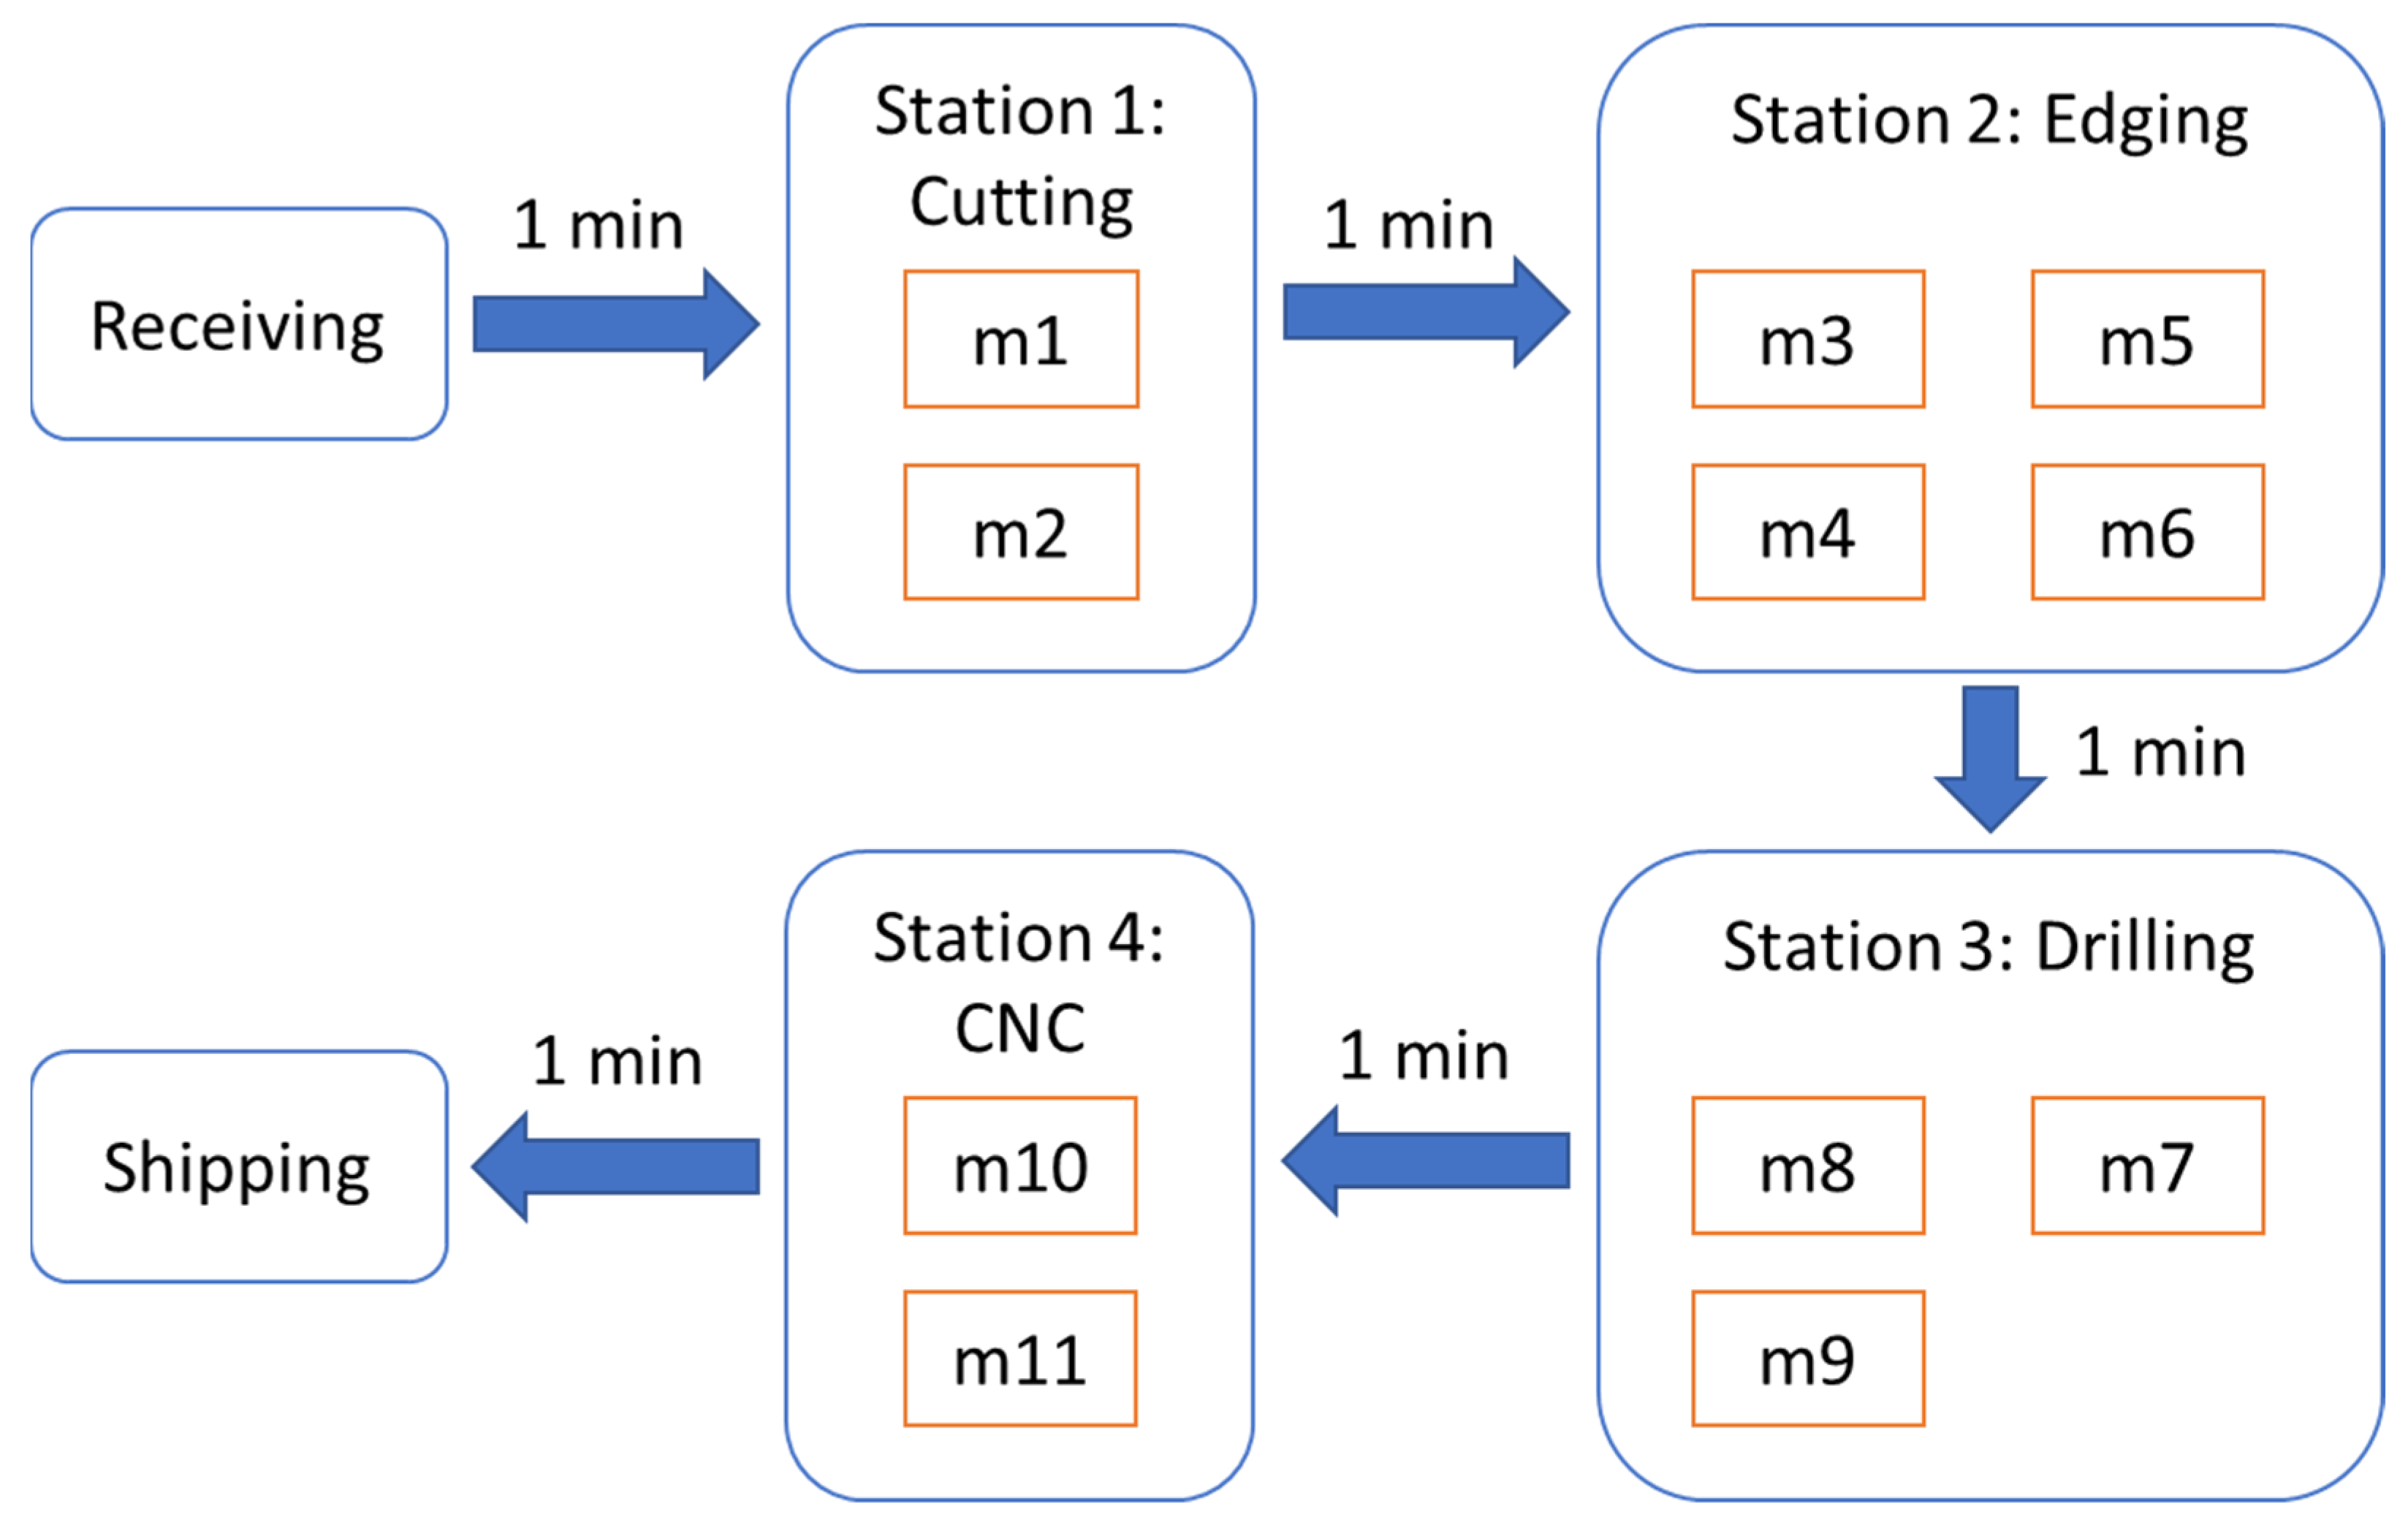
In the functional layout, machines with similar functions are grouped in a station. The functional layout for this study case is illustrated in Figure 2, which depicts four manufacturing stations based on four machine types (or functions): cutting, edging, drilling, and computer numerical control (CNC). In this work, we assume that the transfer time is primarily dominated by the coordination effort needed to move parts between stations, while the time difference due to moving distances is less significant. Consequently, a transfer time of 1 min occurs when a part is moved from one station to another. In contrast, we assume no transfer time occurs for the movement of a part within the same station.
The information regarding part routing and processing time is provided in Table 5. Due to the presence of duplicated machines, we use brackets to denote that a part can be assigned to one of these machines. For example, in p1, the notation (m1, m2) means that p1 can be processed by either m1 or m2. When a part is moved from one station to another station (including receiving and shipping), it takes about 1 min.
To illustrate the total time required to make a part, consider part p3 as an example. Starting from the receiving station, p3 is first moved to station 1 for cutting (a 3 min process). It is then moved to station 2 for edging using m4 (a 4 min process) and then to station 3 for drilling (a 9 min process). The total transfer time is 4 min as it involves four transitions (e.g., receiving → station 1 → station 2 → station 3 → shipping). Then, the total time required to make p3 without waiting in the machine queues is 3 + 4 + 9 + 4 = 20 min.

3.4. Cellular Layout

In the cellular layout, the machines are grouped to form mini factories, each capable of producing a subset of parts independently. The cellular layout for this study case is depicted in Figure 3, which consists of two manufacturing cells. The assignment of parts to each station is also shown in Figure 3. Notably, m8 and m9 are duplicated machines in manufacturing cell 2.
The information regarding part routing and processing time is provided in Table 6. When a part is moved from one station to another station (including receiving and shipping), it takes about 1 min. In contrast to the functional layout, the cellular layout has fewer stations (or manufacturing cells). As the cellular layout is more focused on producing specific parts, it is more efficient (but less flexible) in production. This notion is reflected in two ways. First, we only approximate the transfer time in and out of manufacturing cells but not the transfer time within the same cell (the same treatment is applied to the functional layout). Since the cellular layout has fewer manufacturing cells (than stations), its overall transfer time is shorter. Second, the processing times in the cellular layout are shorter since workers can be more focused on making specific parts.
To illustrate the total time required to make a part, consider part p3 again as an example. Starting from the receiving station, p3 is first moved to the manufacturing cell 1, where it is processed through m1 (a 2 min process), m4 (a 3 min process), and m7 (a 6 min process). After completing machine processing, p3 is moved from the manufacturing cell 1 to the shipping station, resulting in a total transfer time of 2 min. Therefore, the total time required to make p3 without waiting in the machine queues is 2 + 3 + 6 + 2 = 13 min. While it may seem that the cellular layout takes less time to process p3 (compared to the functional layout, which takes 20 min), the cellular layout is less flexible. For example, m7 is the only drilling machine in the manufacturing cell 1. If the parts assigned to this cell also heavily demand this machine, the waiting time in this machine queue will become the bottleneck of the overall manufacturing process.

4. Criticality Analysis

4.1. Development of Criticality Scores

By considering the functional layout as the benchmark, the criticality analysis is concerned with the potential benefit of using the cellular layout comparatively. In this context, the notion of criticality is used to describe the sensitivity of a production that can be severely delayed by certain bottleneck processes. Then, when more critical factors are involved in production (or simply having higher criticality scores), it is more beneficial to stay with the functional layout for its flexibility in addressing bottleneck processes.
In this paper, the criticality analysis is conducted in four aspects sequentially: machine type, part, product variant, and production. Generally, a machine type is critical if it is demanded by many parts with relatively long processing times. Let procik be the processing time of part pi using machine type tk. Recall that ptik is a binary matrix element that indicates whether machine type tk is required to make part pi. Then, the criticality score (cs) of machine type tk, denoted as cs(tk), can be evaluated as follows.
c s ( t k ) = i = 1 n p t i k · p r o c i k
From the aspect of the part, a part is critical if it is more dependent on critical machine types. Let cs(pi) be the criticality score of part pi, and its formulation is given below.
c s ( p i ) = k = 1 q p t i k · c s ( t k )
From the aspect of the product variant, a product variant is critical if it contains more critical parts. Recall that pvih is a matrix element that indicates the number of part pi required to make product variant vh. Let cs(vh) be the criticality score of product variant vh, and its formulation is given below.
c s ( v h ) = i = 1 n p v i h · c s ( p i )
Figure 4 illustrates the evaluation flow of the criticality scores. In summary, the criticality of machine types is relevant to the total processing time of a machine type needed to produce a given set of parts. With the criticality of machine types, the criticality of a part is evaluated based on its machine requirement according to machine types. Since we know the composition of parts for each product variant, we can then calculate the criticality of a product variant based on the criticality of its parts. In each production, the demands of product variants (or simply products) are known and fixed. Then, we can evaluate the criticality of this production (to be discussed in Section 3.3) based on the criticality of product variants.

4.2. Criticality Analysis with Machine Duplication

In the comparison of the functional and cellular layouts, having more machine duplication tends to be more beneficial for the functional layout in terms of the production’s completion time. As the factory aims to process all the parts as quickly as possible in a production run, the completion time becomes highly dependent on how long the parts need to wait for machine services. With machine duplication, the functional layout is more capable of distributing the machine workloads evenly, which can help smooth out the waiting time for parts. Thus, when product demands are uncertain, the functional layout is less likely to experience bottleneck processes that severely delay the completion time. In this section, we aim to conduct the criticality analysis with duplicated machines in some machine types.
Let MD = (md1, md2, …, mdk, …, mdq) be the vector of machine duplicates, where mdk is the number of duplicates of machine type tk. In our criticality analysis, a machine becomes less critical if it is duplicated. Thus, we suppose that the criticality score of a machine is inversely proportional to the number of its duplicates. To apply this notion, we define a vector of machine fraction, denoted as MF = (mf1, mf2, …, mfj, …, mfm), where mfj is the fraction of its duty share (essentially the reciprocal of the number of its duplicates). Then, when machine mj belongs to machine type tk, we have m f j = 1 / m d k .
The consideration of machine duplication will require another round of criticality evaluations. To distinguish this round of evaluations, we use the symbol c s _ m d to indicate the criticality evaluations with machine duplication. Let us denote a part–machine matrix, PM = [pmij], to indicate pmij = 1 if machine mj is required to make part pi (otherwise, pmij = 0). Also, let procij be the processing time of part pi using machine mj. Then, the criticality score of machine mj, denoted as c s _ m d ( m j ) , can be calculated as follows.
c s _ m d ( m j ) = m f j · i = 1 n p m i j · p r o c i j
With the criticality score of each machine, we can re-evaluate the criticality scores of parts (denoted as c s _ m d ( p i ) ) and product variants (denoted as c s _ m d ( v h ) ) with machine duplication as follows.
c s _ m d ( p i ) = j = 1 m p m i j · c s _ m d ( m j )
c s _ m d ( v h ) = i = 1 n p v i h · c s _ m d ( p i )

4.3. Criticality Ratios for Product Variant and Production

Since having more machine duplicates would make a machine type less critical, we expect to see c s _ m d ( v h ) c s ( v h ) for product variant vh. Also, as discussed in Section 3.2, machine duplication tends to make the functional layout more beneficial. Therefore, if there is a significant drop from c s ( v h ) to c s _ m d ( v h ) , the functional layout would tend to be more beneficial for producing product variant vh. This idea leads to the formulation of criticality ratios for comparing the functional and cellular layouts.
Let C R ( v h ) be the criticality ratio of product variant vh, and its formulation is provided in Equation (7). Based on the reasoning discussed earlier, if machine duplication can effectively reduce the criticality of a product variant (i.e., smaller c s _ m d ( v h ) → higher C R ( v h ) ), it is more beneficial to produce this product variant in the functional layout. In other words, higher values of C R ( v h ) imply that the functional layout tends to be more efficient than the cellular layout for producing product variant vh.
C R ( v h ) = c s ( v h ) c s _ m d ( v h )
In the context of uncertain product demands, a production is critical if it needs to produce many product variants with high criticality ratios. Let PD = (pd1, pd2…, pdh, …pdr) be the vector of product demands, where pdh is the number of product variant vh that needs to be produced in a production. Given a production that specifies the product demands as PD, let cs(PD) be the score of production criticality, and its formulation is provided below. Using the same rationale, if the manufacturer expects to have more productions with high production criticality (i.e., c s ( P D ) ), they should choose the functional layout in the long run.
c s ( P D ) = h = 1 r p d h · C R ( v h )

4.4. Criticality Analysis of the Study Case

In this section, the study case is used to further explain and demonstrate the criticality analysis, following the evaluation flow in Figure 4. First, Table 7 lists the criticality scores of machine types and machines. Let us consider the criticality evaluation of machine type t4 for demonstration. From Table 4, we know that machine type t4 has two machine duplicates: m5 and m6. Then, we can check (m5, m6) in Table 5, which indicates that this machine type is required to make p4 (6 min), p5 (6 min), p6 (9 min), p7 (9 min), p8 (9 min), p13 (6 min), p14 (6 min), and p15 (6 min). As a result, we can calculate c s ( t 4 ) = 57 using Equation (1). With two machine duplicates, we have c s _ m d ( m 5 ) = c s _ m d ( m 6 ) = 57/2 = 28.5 using Equation (4). As observed from Table 7, while machine type t5 (i.e., drilling machine) is the most critical (i.e., c s ( t 5 ) = 67), it has three machine duplicates (e.g., m7, m8, m9), leading to a relatively lower criticality score for each machine. In contrast, machine type t7 (or machine m11) is the least critical as it is only required by part p8 (7 min) (see Table 5).
Then, we proceed to calculate the criticality scores of parts, which are listed in Table 8. To demonstrate, consider p4, which requires machine types of t1, t4, and t5 (see Table 3). Using Equation (2), we can obtain cs(p4) = cs(t1) + cs(t4) + cs(t5) = 171. As observed from Table 8, part p13 is the most critical as it requires four machine types and one relatively critical machine, m4 (see Table 5).
With the criticality scores of parts, we can then calculate the criticality scores of product variants using Equations (3) and (6) and criticality ratios using Equation (7). The results are listed in Table 9. As observed, product variant v2 has the highest criticality ratio and can sensitively cause the delay of the completion time. It implies that if the demand of product variant v2 tends to be high (relative to other product variants), we should consider the functional layout. In contrast, product variant v3 has the lowest criticality ratio. In this case, we should lean towards the cellular layout if the demand for product variant v3 tends to be high.
Notably, the criticality analysis can only indicate the sensitivity of the demands of individual product variants concerning the choice between the functional and cellular layouts. It does not consider machine locations and the processing times of the cellular layouts (e.g., Figure 3 and Table 6). The actual decision should still require more analytical and simulation work to approximate the completion times of the two layouts. Yet, the criticality analysis can reveal which product variants would tend to favor the functional (or cellular) layout. This information can help us better understand the simulation work, which will be discussed in the next section.
5. Simulation Setup, Results and Discussion

5.1. Simulation Setup

The simulation model was developed using Python with the discrete event simulation library, SimPy. In this simulation study, the manufacturing system is required to produce a total of 100 units of furniture, where the demand for each product variant is uncertain. To explore the space of uncertain demands, five demand profiles are defined as follows.
  • Even production: (20, 20, 20, 20, 20), where each product variant is produced with 20 units.
  • One-dominating-product production: (60, 10, 10, 10, 10), where one product variant is produced with 60 units and others with 10 units.
  • Two-dominating-product production: (38, 38, 8, 8, 8), where two product variants are produced with 38 units and others with 8 units.
  • Three-dominating-product production: (30, 30, 30, 5, 5), where three product variants are produced with 30 units and others with 5 units.
  • Four-dominating-product production: (24, 24, 24, 24, 4), where four product variants are produced with 24 units and another with 4 units.
To produce these product variants, our proposed criticality analysis, as identified in Table 9, indicates that the productions of product variants v2, v4, and v5 can sensitively reduce the relative performance of the cellular layout. The purpose of this simulation study is to verify how well the criticality analysis can indicate the sensitivity of the layout’s performance concerning the uncertain demands of product variants.

5.2. Simulation Results

In the even production, the functional layout yields the completion time of 2675 min, and the cellular layout yields a completion time of 2349 min. In other words, the cellular layout can complete this production faster, reducing the time by 326 min. To better understand the properties of these two layouts in simulation, Table 10 lists the machine utilization information. In the functional layout, the duplicated machines (e.g., m1 and m2; m5 and m6) tend to have even utilization, and they can effectively share the workloads. One exception is machine m9, which has lower utilization since it is only used when m7 and m8 are busy. In contrast, the duplicated machines in the cellular layout tend to have more uneven utilization. In particular, machine m6 in the cellular layout has the highest utilization (e.g., 0.97). Here, the duplicated machine m5 (utilization = 0.44) cannot effectively share the workload of m6, as both machines belong to different manufacturing cells. Despite the uneven utilization, since the cellular layout has the advantages of shorter processing and transfer times, it can still yield a shorter completion time overall.
In the one-dominating-product production, we made each product variant the dominant product in the production, resulting in five simulation runs for each layout. Table 11 displays the results of completion times for these simulation runs, with the “Time difference” column indicating how much the completion time of the cellular layout differs from that of the functional layout. As shown, the functional layout yields short completion times in the cases of I-2 and I-5 when the critical products (i.e., product variants v2 and v5, respectively) are dominant in the production. In contrast, when product variant v3, which is the least critical, has a high demand in the case of I-3, it gives an advantage to the cellular layout, resulting in a shorter completion time by 956 min.
To further illustrate this concept, Figure 5 plots the data of time difference versus production criticality with a linear regression. The linear regression model is y = 47.6x − 9680, with a coefficient of determination R2 = 0.8044. The positive correlation suggests that the cellular layout tends to yield a higher completion time when the value of production criticality is high. The value of R2 indicates that the linear regression model can account for 80.44% of the variability in the data. In our interpretation, production criticality can adequately explain the time difference between the functional and cellular layouts. This provides evidence to support that the proposed criticality analysis can discern the relative performance between these two layouts.
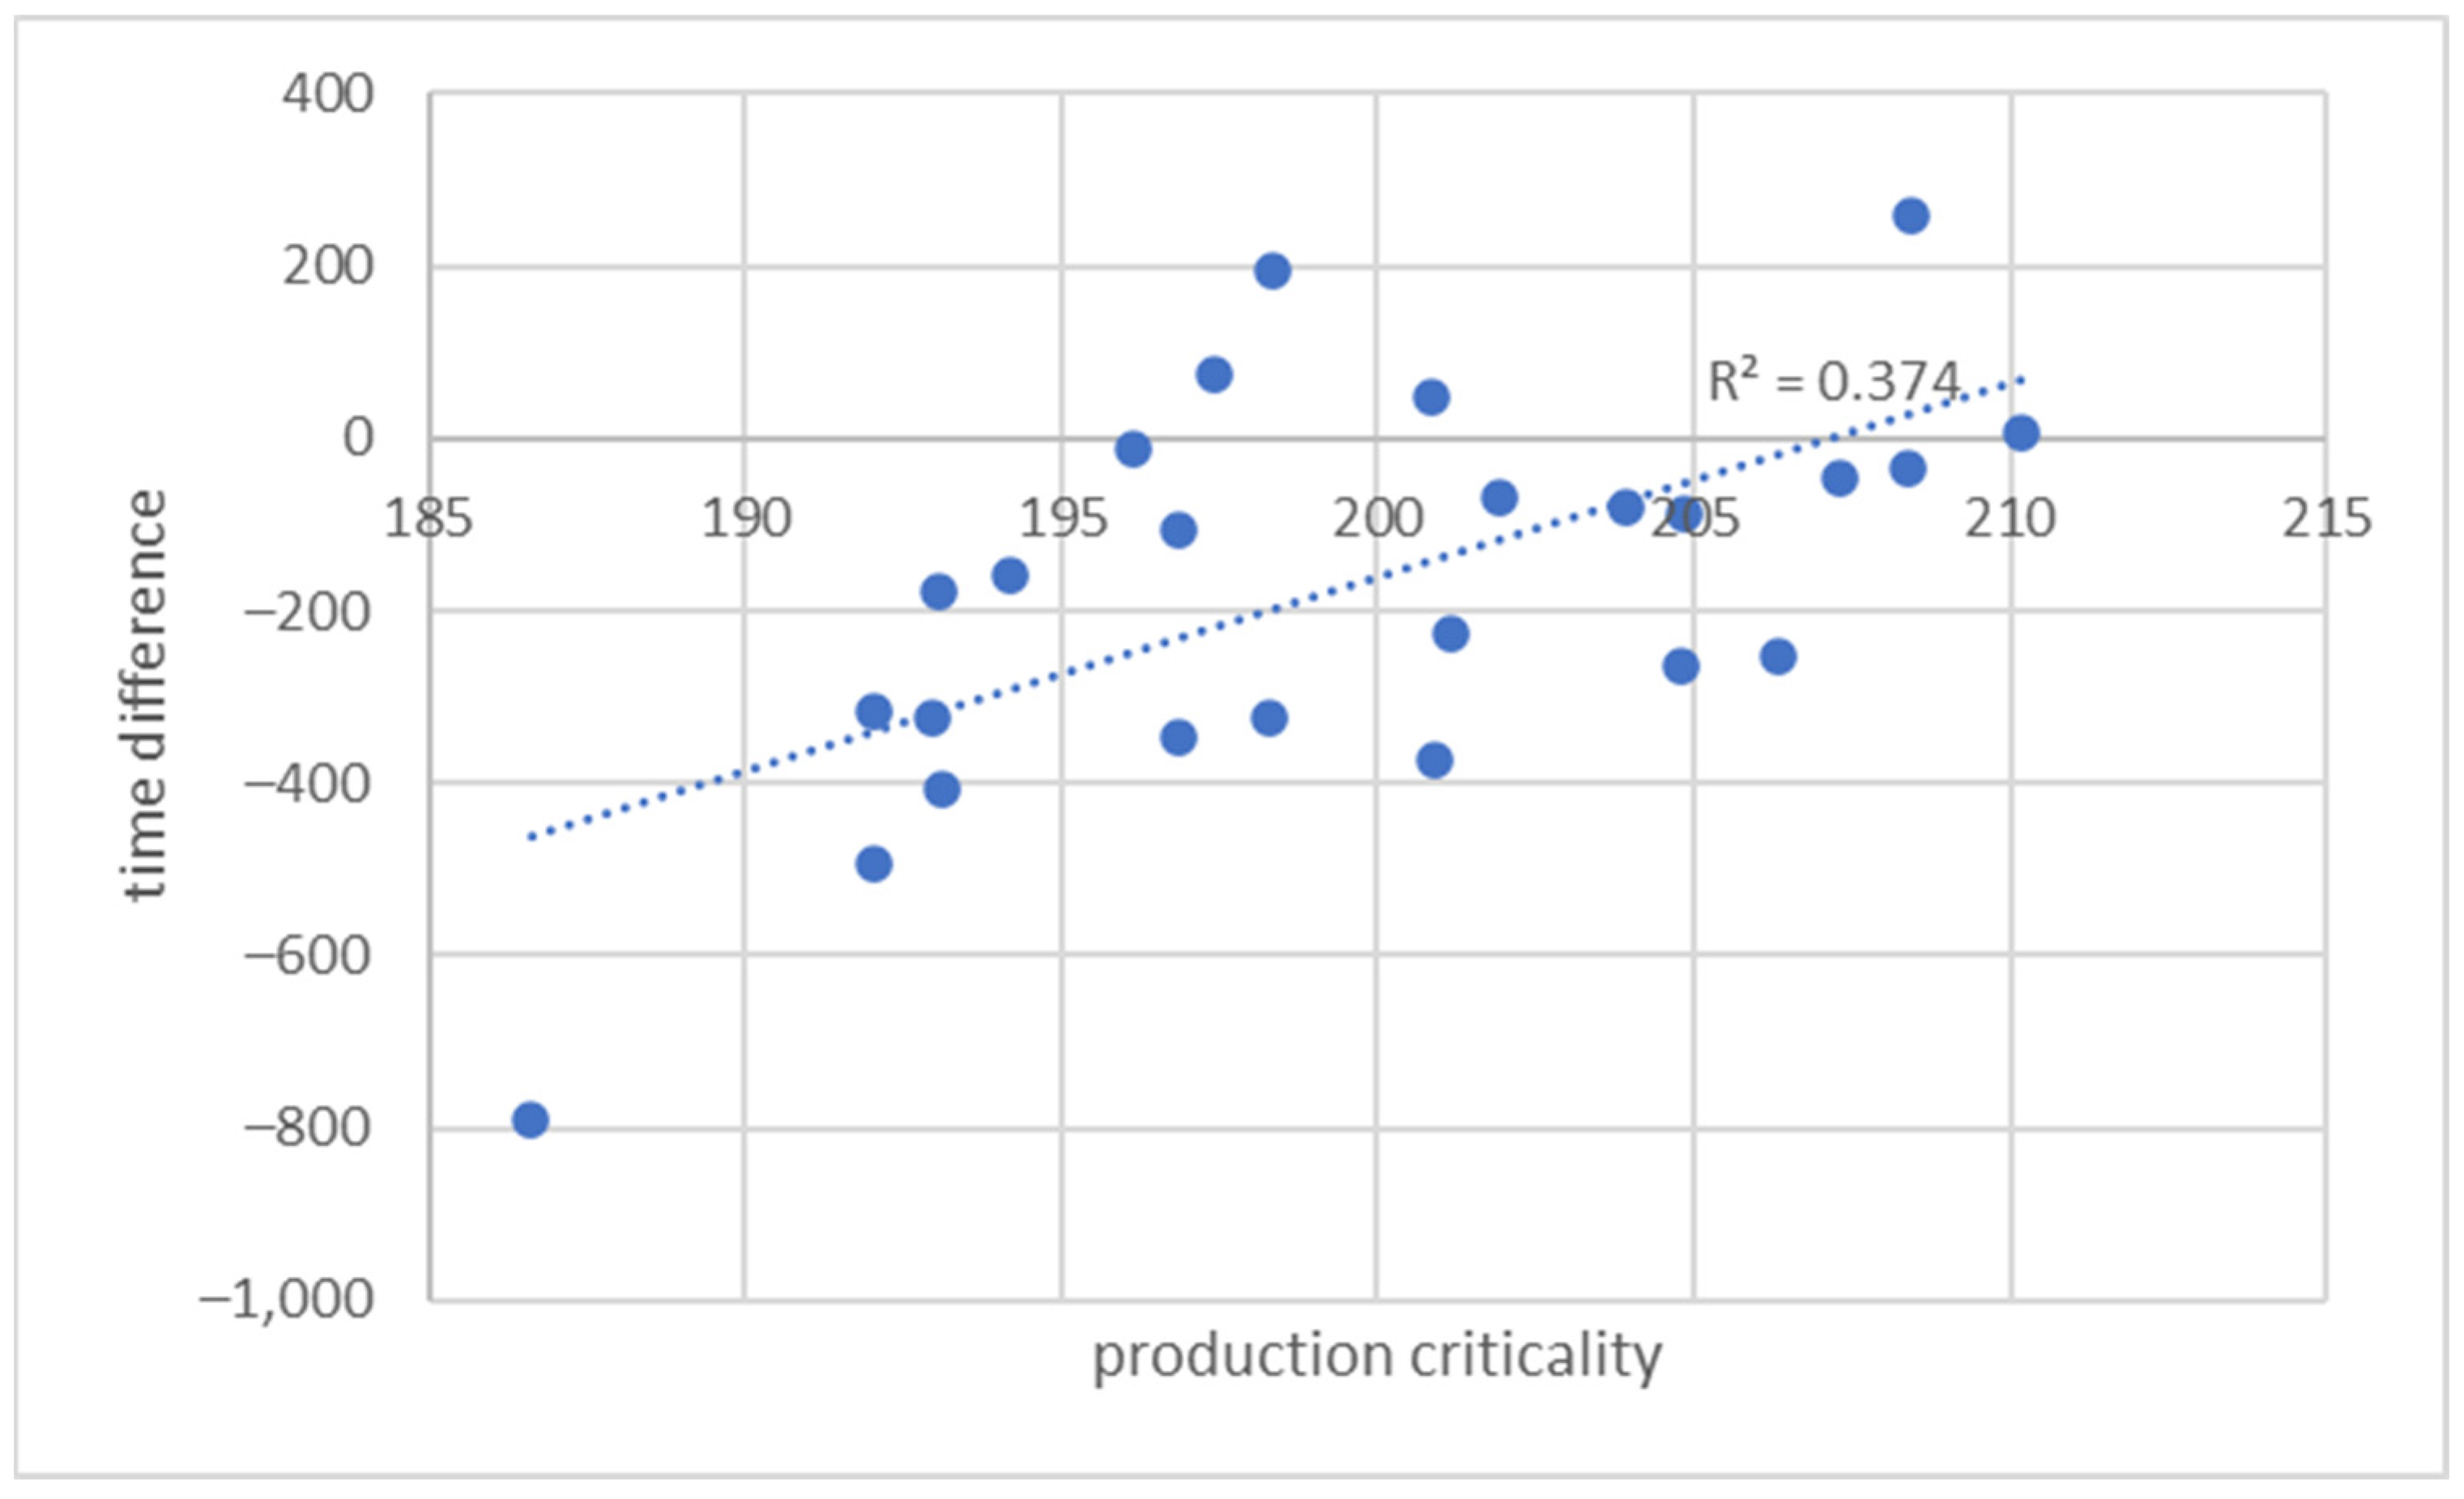
The results of other demand profiles are tabulated in Table 12. To analyze these data, we once again plot the data using a linear regression. The results are displayed in Figure 6. The linear regression model is y = 22.4x − 4640, with a coefficient of determination of R2 = 0.3740. Compared to the cases of the one-dominating product production (i.e., Figure 5), both the positive correlation and the R2 value decrease. This indicates that the positive trend of production criticality favoring the functional layout is weaker.
To provide further insight, we evaluate the variance of product demands in each demand profile as to measure the “evenness” of the product demands (i.e., smaller variance → more even). Then, we generate a plot in Figure 7 that compares the time difference with these variance values. As shown in Figure 7, when the production has more uneven demands (as the variance value increases), the ranges of time differences between the functional and cellular layouts become larger. This trend aligns with our concept of production criticality. In cases with more even productions, the impact from the critical products tends to be less influential, making the choice between the functional and cellular layouts less important. In contrast, if the production becomes skewed to a specific product variant, the choice between two layouts can lead to quite different results.

5.3. Discussion

The core contribution of this paper is the proposed criticality analysis that can indicate which product variants can sensitively reduce the performance of cellular layouts compared to functional layouts. The simulation study generally supports the utility of the criticality analysis. When productions involve producing more product variants with high criticality ratios (as per Equation (7)), the functional layout tends to yield shorter completion times than the cellular layout. This observation is evident in the regression analysis depicted in Figure 5 and Figure 6.
When making layout decisions, manufacturers should have access to certain information: (1) available machine resources and (2) the product variants to be produced. However, they may lack precise knowledge of product variant demands. An intended benefit of the criticality analysis is that it does not require a lot of operational details to support layout decisions. In this context, manufacturers can apply the criticality analysis to identify which product variant(s) might sensitively impact cellular layouts. If they anticipate a higher demand for product variants with high criticality ratios in the future, they should consider functional layouts or prepare for the potential impact of this demand trend on cellular layouts.
It is important to note that the criticality analysis is based on the assumption that bottleneck machines will strongly impact the production’s completion time. This becomes one limitation of the criticality analysis. That is, if other production factors (e.g., workers) are more influential, the proposed criticality analysis may not be directly applicable. Also, this paper examines only one functional layout and one cellular layout for a given set of machines. In practice, there can be more layout options, which would require more comprehensive studies. At this stage of the research, we have limited the layout options to initially validate the utility of the criticality analysis.

6. Conclusions

In the context of producing product variants, the paper proposes a criticality analysis to examine and estimate the sensitivity of product variant demands to the relative performance of functional and cellular layouts. The criticality analysis begins by assessing the criticality of machines. Utilizing information about machine requirements and part compositions, we can then estimate the criticality of individual product variants. In essence, high demand for critical product variants can sensitively impact the performance of cellular layouts. The simulation study explores various demand profiles and demonstrates that productions with more critical product variants tend to experience longer completion times with cellular layouts. The contribution of this paper can be summarized in the following two points:
  • The criticality analysis relies on the information of machine resources and production requirements, without necessitating extensive operational details (e.g., part demands and routing), which are often unavailable for layout decisions. Despite utilizing relatively limited information, the criticality analysis can reveal the sensitivity of product variant demands to layout performance through the simulation study.
  • In practice, manufacturers can use the criticality analysis to inform their layout decisions. For example, if they anticipate a higher production of critical product variants, they should consider more flexible layouts and encourage resource pooling in the layout design.
While this paper introduces the criticality concept regarding uncertain product variant demands, we identify four potential directions for future work:
  • More production factors can be incorporated in the manufacturing system model, such as flexible fixtures, setup times, lot sizes, and scheduling decisions.
  • More market factors can be incorporated in the criticality analysis. For example, the selling prices of product variants can be associated with their criticality scores in order to influence their market demands.
  • The criticality analysis can be extended to develop a decision-making method for the facility layout design in the presence of market uncertainty.
  • The study of uncertain demands using simulations calls for more computational techniques since the demand profiles of product variants can be complex. Potential techniques to consider include experimental design and Monte Carlo simulation.

Author Contributions

Conceptualization, S.L., B.E. and A.J.E.; methodology, S.L. and B.E.; software, S.L. and B.E.; validation, S.L., B.E. and A.J.E.; investigation, S.L.; writing—original draft preparation, S.L.; writing—review and editing, S.L., B.E. and A.J.E.; supervision, S.L.; funding acquisition, S.L. All authors have read and agreed to the published version of the manuscript.

Funding

This research was funded by NSERC Discovery Grants.

Data Availability Statement

The authors confirm that the data supporting the findings of this study are available within the article. The simulation model and data of this research are available from the corresponding author on request.

Conflicts of Interest

The authors declare no conflict of interest.

References

  1. ElMaraghy, H.; Schuh, G.; ElMaraghy, W.; Piller, F.; Schönsleben, P.; Tseng, M.; Bernard, A. Product variety management. CIRP Ann. 2013, 62, 629–652. [Google Scholar] [CrossRef]
  2. Tseng, M.M.; Jiao, J.; Merchant, M.E. Design for Mass Customization. CIRP Ann. 1996, 45, 153–156. [Google Scholar] [CrossRef]
  3. Hu, S.J. Evolving Paradigms of Manufacturing: From Mass Production to Mass Customization and Personalization. Procedia CIRP 2013, 7, 3–8. [Google Scholar] [CrossRef]
  4. Yin, Y.; Stecke, K.E.; Li, D. The evolution of production systems from Industry 2.0 through Industry 4.0. Int. J. Prod. Res. 2018, 56, 848–861. [Google Scholar] [CrossRef]
  5. Pech, M.; Vrchota, J. The Product Customization Process in Relation to Industry 4.0 and Digitalization. Processes 2022, 10, 539. [Google Scholar] [CrossRef]
  6. YounesSinaki, R.; Sadeghi, A.; Mosadegh, H.; Almasarwah, N.; Suer, G. Cellular manufacturing design 1996–2021: A review and introduction to applications of Industry 4.0. Int. J. Prod. Res. 2022, 61, 5585–5636. [Google Scholar] [CrossRef]
  7. Wang, Y.; Ma, H.-S.; Yang, J.-H.; Wang, K.-S. Industry 4.0: A way from mass customization to mass personalization production. Adv. Manuf. 2017, 5, 311–320. [Google Scholar] [CrossRef]
  8. Enyoghasi, C.; Badurdeen, F. Industry 4.0 for sustainable manufacturing: Opportunities at the product, process, and system levels. Resour. Conserv. Recycl. 2021, 166, 105362. [Google Scholar] [CrossRef]
  9. Medić, N.; Anišić, Z.; Lalić, B.; Marjanović, U.; Brezocnik, M. Hybrid fuzzy multi-attribute decision making model for evaluation of advanced digital technologies in manufacturing: Industry 4.0 perspective. Adv. Prod. Eng. Manag. 2019, 14, 483–493. [Google Scholar] [CrossRef]
  10. Celent, L.; Mladineo, M.; Gjeldum, N.; Crnjac Zizic, M. Multi-Criteria Decision Support System for Smart and Sustainable Machining Process. Energies 2022, 15, 772. [Google Scholar] [CrossRef]
  11. Swaminathan, J.M.; Tayur, S.R. Managing Broader Product Lines through Delayed Differentiation Using Vanilla Boxes. Manag. Sci. 1998, 44 Pt 2, S161–S172. [Google Scholar] [CrossRef]
  12. Assad, A.A.; Kramer, S.B.; Kaku, B.K. Comparing functional and cellular layouts: A simulation study based on standardization. Int. J. Prod. Res. 2003, 41, 1639–1663. [Google Scholar] [CrossRef]
  13. Wemmerlöv, U.; Hyer, N.L. Cellular manufacturing in the U.S. industry: A survey of users. Int. J. Prod. Res. 1989, 27, 1511–1530. [Google Scholar] [CrossRef]
  14. Flores-Siguenza, P.; Siguenza-Guzman, L.; Lema, F.; Tigre, F.; Vanegas, P.; Aviles-González, J. A systematic literature review of facility layout problems and resilience factors in the industry. In Applied Technologies; ICAT 2021; Communications in Computer and Information Science; Botto-Tobar, M., Montes León, S., Torres-Carrión, P., Zambrano Vizuete, M., Durakovic, B., Eds.; Springer: Cham, Switzerland, 2022; Volume 1535. [Google Scholar]
  15. Mari, S.I.; Lee, Y.H.; Memon, M.S. Sustainable and resilient garment supply chain network design with fuzzy multi-objectives under uncertainty. Sustainability 2016, 8, 1038. [Google Scholar] [CrossRef]
  16. Fahimnia, B.; Jabbarzadeh, A. Marrying supply chain sustainability and resilience: A match made in heaven. Transp. Res. Part E Logist. Transp. Rev. 2016, 91, 306–324. [Google Scholar] [CrossRef]
  17. Agarwal, A.; Sarkis, J. A review and analysis of comparative performance studies on functional and cellular manufacturing layouts. Comput. Ind. Eng. 1998, 34, 77–89. [Google Scholar] [CrossRef]
  18. Burbidge, J.; Dale, B. Planning the introduction and predicting the benefits of group technology. Eng. Costs Prod. Econ. 1984, 8, 117–128. [Google Scholar] [CrossRef]
  19. Huq, F.; Hensler, D.A.; Mohamed, Z.M. A simulation analysis of factors influencing the flow time and through-put performance of functional and cellular layouts. Integr. Manuf. Syst. 2001, 12, 285–295. [Google Scholar] [CrossRef]
  20. Pitchuka, L.N.; Adil, G.K.; Ananthakumar, U. Effect of conversion of functional layout to a cellular layout on the queue time performance: Some new insights. Int. J. Adv. Manuf. Technol. 2006, 31, 594–601. [Google Scholar] [CrossRef]
  21. Agarwal, A. Partitioning bottleneck work center for cellular manufacturing: An integrated performance and cost model. Int. J. Prod. Econ. 2008, 111, 635–647. [Google Scholar] [CrossRef]
  22. Jerbi, A.; Chtourou, H.; Maalej, A.Y. Comparing functional and cellular layouts using simulation and Taguchi method. J. Manuf. Technol. Manag. 2010, 21, 529–538. [Google Scholar] [CrossRef]
  23. Li, J.-W. Simulation study of coordinating layout change and quality improvement for adapting job shop manufacturing to CONWIP control. Int. J. Prod. Res. 2010, 48, 879–900. [Google Scholar] [CrossRef]
  24. Gaither, N.; Frazier, G.V.; Wei, J.C. From Job Shops to Manufacturing Cells. Prod. Inventory Manag. J. 1990, 31, 33–37. [Google Scholar]
  25. Morris, J.S.; Tersine, R.J. A Simulation Analysis of Factors Influencing the Attractiveness of Group Technology Cellular Layouts. Manag. Sci. 1990, 36, 1567–1578. [Google Scholar] [CrossRef]
  26. Seifoddini, H. A probabilistic model for machine cell formation. J. Manuf. Syst. 1990, 9, 69–75. [Google Scholar] [CrossRef]
  27. Seifoddini, H.; Djassemi, M. Determination of a flexibility range for cellular manufacturing systems under product mix variations. Int. J. Prod. Res. 1997, 35, 3349–3366. [Google Scholar] [CrossRef]
  28. Djassemi, M. A simulation analysis of factors influencing the flexibility of cellular manufacturing. Int. J. Prod. Res. 2005, 43, 2101–2111. [Google Scholar] [CrossRef]
  29. Jithavech, I.; Krishnan, K.K. A simulation-based approach for risk assessment of facility layout designs under stochastic product demands. Int. J. Adv. Manuf. Technol. 2010, 49, 27–40. [Google Scholar] [CrossRef]
  30. Das, K.; Abdul-Kader, W. Consideration of dynamic changes in machine reliability and part demand: A cellular manufacturing systems design model. Int. J. Prod. Res. 2011, 49, 2123–2142. [Google Scholar] [CrossRef]
  31. Safaei, N.; Tavakkoli-Moghaddam, R. Integrated multi-period cell formation and subcontracting production planning in dynamic cellular manufacturing systems. Int. J. Prod. Econ. 2009, 120, 301–314. [Google Scholar] [CrossRef]
  32. Sharifi, S.; Chauhan, S.S.; Bhuiyan, N. A dynamic programming approach to GA-based heuristic for multi-period CF problems. J. Manuf. Syst. 2014, 33, 366–375. [Google Scholar] [CrossRef]
  33. Venkatadri, U.; Elaskari, S.M.; Kurdi, R. A multi-commodity network flow-based formulation for the multi-period cell formation problem. Int. J. Adv. Manuf. Technol. 2017, 91, 175–187. [Google Scholar] [CrossRef]
  34. Hosseini-Nasab, H.; Fereidouni, S.; Fatemi Ghomi, S.M.T.; Fakhrzad, M.B. Classification of facility layout problems: A review study. Int. J. Adv. Manuf. Technol. 2018, 94, 957–977. [Google Scholar] [CrossRef]
  35. Seidelmann, T.; Mostaghim, S. Surrogate Functions and Digital Twin Simulation for Modern Facility Layout Planning. In Proceedings of the 2023 IEEE Conference on Artificial Intelligence (IEEE CAI), Santa Clara, CA, USA, 5–6 June 2023; pp. 197–198. [Google Scholar] [CrossRef]
  36. Nabi, H.Z.; Aized, T.; Riaz, F. Modeling, analysis and optimization of carousel-based flexible manufacturing system. J. Ind. Prod. Eng. 2022, 39, 479–493. [Google Scholar] [CrossRef]
  37. Lidberg, S.; Aslam, T.; Pehrsson, L.; Ng, A.H. Optimizing real-world factory flows using aggregated discrete event simulation modelling: Creating decision-support through simulation-based optimization and knowledge-extraction. Flex. Serv. Manuf. J. 2020, 32, 888–912. [Google Scholar] [CrossRef]
  38. Yadav, A.; Jayswal, S. Modelling of flexible manufacturing system: A review. Int. J. Prod. Res. 2018, 56, 2464–2487. [Google Scholar] [CrossRef]
  39. Leporis, M.; Králová, Z. A simulation approach to production line bottleneck analysis. In Proceedings of the International Conference on Cybernetics and Informatics, Vyšná Boca, Slovak, 10–13 February 2010; pp. 13–22. [Google Scholar]
  40. Kuo, C.-T.; Lim, J.-T.; Meerkov, S.M. Bottlenecks in serial production lines: A system-theoretic approach. Math. Probl. Eng. 1996, 2, 233–276. [Google Scholar] [CrossRef]
  41. Roser, C.; Nakano, M. A Quantitative Comparison of Bottleneck Detection Methods in Manufacturing Systems with Particular Consideration for Shifting Bottlenecks. In Advances in Production Management Systems: Innovative Production Management towards Sustainable Growth; Umeda, S., Nakano, M., Mizuyama, H., Hibino, H., Kiritsis, D., von Cieminski, G., Eds.; Springer International Publishing: Berlin/Heidelberg, Germany, 2015; pp. 273–281. [Google Scholar] [CrossRef]
  42. Li, L.; Chang, Q.; Ni, J. Data driven bottleneck detection of manufacturing systems. Int. J. Prod. Res. 2009, 47, 5019–5036. [Google Scholar] [CrossRef]
  43. Li, L.; Chang, Q.; Xiao, G.; Ambani, S. Throughput Bottleneck Prediction of Manufacturing Systems Using Time Series Analysis. J. Manuf. Sci. Eng. 2011, 133, 021015. [Google Scholar] [CrossRef]
  44. Subramaniyan, M.; Skoogh, A.; Salomonsson, H.; Bangalore, P.; Bokrantz, J. A data-driven algorithm to predict throughput bottlenecks in a production system based on active periods of the machines. Comput. Ind. Eng. 2018, 125, 533–544. [Google Scholar] [CrossRef]
  45. Subramaniyan, M.; Skoogh, A.; Muhammad, A.S.; Bokrantz, J.; Johansson, B.; Roser, C. A generic hierarchical clustering approach for detecting bottlenecks in manufacturing. J. Manuf. Syst. 2020, 55, 143–158. [Google Scholar] [CrossRef]
  46. Márquez, A.C.; de León, P.M.; Rosique, A.S.; Fernández, J.F.G. Criticality Analysis for Maintenance Purposes: A Study for Complex In-service Engineering Assets. Qual. Reliab. Eng. Int. 2016, 32, 519–533. [Google Scholar] [CrossRef]
  47. Gopalakrishnan, M.; Skoogh, A.; Salonen, A.; Asp, M. Machine criticality assessment for productivity improvement: Smart maintenance decision support. Int. J. Prod. Perform. Manag. 2019, 68, 858–878. [Google Scholar] [CrossRef]
  48. Gopalakrishnan, M.; Subramaniyan, M.; Skoogh, A. Data-driven machine criticality assessment—Maintenance decision support for increased productivity. Prod. Plan. Control 2022, 33, 1–19. [Google Scholar] [CrossRef]
  49. Balog, M.; Dupláková, D.; Szilágyi, E.; Mindaš, M.; Knapcikova, L. Optimization of time structures in manufacturing management by using scheduling software Lekin. TEM J. 2016, 5, 319–323. [Google Scholar]
  50. Gameros, A.; Lowth, S.; Axinte, D.; Nagy-Sochacki, A.; Craig, O.; Siller, H. State-of-the-art in fixture systems for the manufacture and assembly of rigid components: A review. Int. J. Mach. Tools Manuf. 2017, 123, 1–21. [Google Scholar] [CrossRef]
  51. Illidge, A.; Bright, G. An automated flexible fixture system for mass customisation. S. Afr. J. Ind. Eng. 2018, 29, 21–34. [Google Scholar]
  52. Li, X.; Yang, Y.; Li, L.; Shi, Y.; Zhao, G.; He, N.; Qian, N.; Mu, Z. An approach for optimising the fixturing configuration in flexible machining fixtures. Int. J. Prod. Res. 2020, 59, 6223–6240. [Google Scholar] [CrossRef]
  53. Rong, Y.; Huang, S.H.; Hou, Z. Advanced Computer-Aided Fixture Design; Elsevier: Burlington, MA, USA, 2005. [Google Scholar] [CrossRef]
  54. Ivanov, V.; Dehtiarov, I.; Pavlenko, I.; Kosov, I.; Kosov, M. Technology for complex parts machining in multiproduct manufacturing. Manag. Prod. Eng. Rev. 2019, 10, 25–36. [Google Scholar]
  55. Ivanov, V.; Liaposhchenko, O.; Denysenko, Y.; Pavlenko, I. Ensuring economic efficiency of flexible fixtures in mul-tiproduct manufacturing. Eng. Manag. Prod. Serv. 2021, 13, 53–62. [Google Scholar]
  56. Suzić, N.; Stevanov, B.; Ćosić, I.; Anišić, Z.; Sremčev, N.; Suzić, N.; Anišić, B.S.-I.Ć.; Sremčev, N. Customizing products through application of group technology: A case study of furniture manufacturing. J. Mech. Eng. 2012, 58, 724–731. [Google Scholar] [CrossRef]
Figure 1. Relational graph of manufacturing system elements (Note: numbers on the links indicate the numbers of parts demanded by the product variants.).
Sustainability 15 14946 g001
Figure 2. Functional layout of the study case.
Sustainability 15 14946 g002
Figure 3. Cellular layout of the study case.
Sustainability 15 14946 g003
Figure 4. Evaluation flow of the criticality scores.
Sustainability 15 14946 g004
Figure 5. Time difference versus production criticality in the one-dominating-product production.
Sustainability 15 14946 g005
Figure 6. Time difference versus production criticality in the two-, three- and four-dominating-product productions.
Sustainability 15 14946 g006
Figure 7. Time difference versus the evenness of the product demands.
Sustainability 15 14946 g007
Table 1. Sets and elements of the manufacturing system.
Set ExpressionSubscript IndexTotal Number of Elements in the Set
Product variantV = {v1, v2, …, vr}hr
PartP = {p1, p2, …, pn}in
MachineM = {m1, m2, …, mm}jm
Machine typesT = {t1, t2, …, tq}kq
Table 2. Part requirements of each product variant (matrix PV = [pvih]).
Product Variant v1Product Variant v2Product Variant v3Product Variant v4Product Variant v5
Part p100220
Part p220301
Part p300024
Part p403033
Part p502013
Part p604000
Part p700120
Part p802000
Part p900300
Part p1002000
Part p1100002
Part p1201010
Part p1320112
Part p1420001
Part p1500022
Part p1600004
Table 3. Requirements of machine types for each part (matrix PT = [ptik]).
Machine Type t1Machine Type t2Machine Type t3Machine Type t4Machine Type t5Machine Type t6Machine Type t7
Part p11000000
Part p21010000
Part p31010100
Part p41001100
Part p51001100
Part p61001100
Part p71001100
Part p81001001
Part p91010010
Part p101010100
Part p111000100
Part p121000010
Part p131011100
Part p141101100
Part p151101100
Part p161100100
Table 4. Machine information of the study case.
Machine TypeLabel of Machine TypeLabel of Machine
Cutting machinet1m1, m2
One-side edging machinet2m3
Two-side edging machine with gutter makingt3m4
Two-side edging machinet4m5, m6
Drilling machinet5m7, m8, m9
Multi-purpose machining centert6m10
Drilling machining centert7m11
Table 5. Information of part routing and processing time in the functional layout.
Part LabelPart RoutingProcessing Time
p1(m1, m2)3 min
p2(m1, m2) → m43 min → 4 min
p3(m1, m2) → m4 → (m7, m8, m9)3 min → 4 min → 9 min
p4(m1, m2) → (m5, m6) → (m7, m8, m9)3 min → 6 min → 6 min
p5(m1, m2) → (m5, m6) → (m7, m8, m9)3 min → 6 min → 9 min
p6(m1, m2) → (m5, m6) → (m7, m8, m9)3 min → 9 min → 6 min
p7(m1, m2) → (m5, m6) → (m7, m8, m9)3 min → 9 min → 6 min
p8(m1, m2) → (m5, m6) → m113 min → 9 min → 7 min
p9(m1, m2) → m4m103 min → 9 min → 7 min
p10(m1, m2) → m4 → (m7, m8, m9)3 min → 4 min → 6 min
p11(m1, m2) → (m7, m8, m9)3 min → 9 min
p12(m1, m2) → m102 min → 13 min
p13(m1, m2) → m4 → (m5, m6) → (m7, m8, m9)3 min → 6 min → 6 min → 4 min
p14(m1, m2) → m3 → (m5, m6) → (m7, m8, m9)3 min → 6 min → 6 min → 4 min
p15(m1, m2) → m3 → (m5, m6) → (m7, m8, m9)3 min → 3 min → 6 min → 4 min
p16(m1, m2) → m3 → (m7, m8, m9)3 min → 3 min → 4 min
Table 6. Information of part routing and processing time in the cellular layout.
Part LabelPart RoutingManufacturing CellProcessing Time
p1m1Cell 12 min
p2m1m4Cell 12 min → 3 min
p3m1m4m7Cell 12 min → 3 min → 6 min
p4m2m6 → (m8, m9)Cell 22 min → 4 min → 4 min
p5m2m6 → (m8, m9)Cell 22 min → 4 min → 6 min
p6m2m6 → (m8, m9)Cell 22 min → 6 min → 4 min
p7m2m6 → (m8, m9)Cell 22 min → 6 min → 4 min
p8m2m6m11Cell 22 min → 6 min → 5 min
p9m1m4m10Cell 12 min → 6 min → 5 min
p10m1m4m7Cell 12 min → 3 min → 4 min
p11m2 → (m8, m9)Cell 22 min → 6 min
p12m1m10Cell 11 min → 10 min
p13m1m4m5m7Cell 12 min → 4 min → 4 min → 3 min
p14m1m3m5m7Cell 12 min → 4 min → 4 min → 3 min
p15m1m3m5m7Cell 12 min → 2 min → 4 min → 3 min
p16m1m3m7Cell 12 min → 2 min → 3 min
Table 7. Criticality scores of machine types and machines.
Criticality Score of Machine TypesCriticality Score of Machines
Labels of Machine TypeCritical Score, c s ( t k ) Labels of MachineCritical Score, c s _ m d ( m j )
t147m1, m223.5
t212m312
t327m427
t457m5, m628.5
t567m7, m8, m922.3
t620m1020
t77m117
Table 8. Criticality scores of parts.
Criticality Score of Parts
Without Machine Duplication, c s ( p i ) With Machine Duplication, c s _ m d ( p i )
Part p14723.5
Part p27450.5
Part p314172.8
Part p417174.3
Part p517174.3
Part p617174.3
Part p717174.3
Part p811159.0
Part p99470.5
Part p1014172.8
Part p1111445.8
Part p126743.5
Part p13198101.3
Part p1418386.3
Part p1518386.3
Part p1612657.8
Table 9. Criticality scores and ratios of product variants.
Criticality Score of Product VariantsCriticality Ratios, C R ( v h )
Without Machine Duplication, c s ( v h ) With Machine Duplication, c s _ m d ( v h )
Product variant v1910476.31.91
Product variant v22110976.22.16
Product variant v3967585.71.65
Product variant v42033956.22.13
Product variant v533411572.52.12
Table 10. Machine utilization of the even production.
Machine TypeMachine LabelsMachine Utilization
Functional LayoutCellular Layout
Cutting machinem10.730.66
m20.730.44
One-side edging machinem30.310.24
Two-side edging machine with gutter makingm40.890.72
Two-side edging machinem50.940.44
m60.920.97
Drilling machinem70.890.81
m80.810.75
m90.550.20
Multi-purpose machining centerm100.350.30
Drilling machining centerm110.100.09
Table 11. Production criticality and completion time in the one-dominating product production.
Case LabelProduct DemandProduction CriticalityCompletion TimeTime Difference
Functional LayoutCellular Layout
I-1(60, 10, 10, 10, 10)195.262208 min1810 min−398 min
I-2(10, 60, 10, 10, 10)207.813384 min3960 min576 min
I-3(10, 10, 60, 10, 10)182.293476 min2520 min−956 min
I-4(10, 10, 10, 60, 10)206.052784 min2560 min−224 min
I-5(10, 10, 10, 10, 60)205.973599 min3730 min131 min
Table 12. Production criticality and completion time of the demand profiles in the two-, three- and four-dominating-product productions.
Case LabelProduct DemandProduction CriticalityCompletion TimeTime Difference
Functional LayoutCellular Layout
II-1(38, 38, 8, 8, 8)201.952707 min2640 min−67 min
II-2(38, 8, 38, 8, 8)186.642920 min2128 min−792 min
II-3(38, 8, 8, 38, 8)200.892346 min1972 min−374 min
II-4(38, 8, 8, 8, 38)200.842806 min2854 min48 min
II-5(8, 38, 38, 8, 8)194.172950 min2790 min−160 min
II-6(8, 38, 8, 38, 8)208.423192 min3450 min258 min
II-7(8, 38, 8, 8, 38)208.383364 min3330 min−34 min
II-8(8, 8, 38, 38, 8)193.112755 min2350 min−405 min
II-9(8, 8, 38, 8, 38)193.063295 min3118 min−177 min
II-10(8, 8, 8, 38, 38)207.323153 min3106 min−47 min
III-1(30, 30, 30, 5, 5)192.952486 min2160 min−326 min
III-2(30, 30, 5, 30, 5)204.822799 min2710 min−89 min
III-3(30, 30, 5, 5, 30)204.782873 min2610 min−263 min
III-4(30, 5, 30, 30, 5)192.062588 min2096 min−492 min
III-5(30, 5, 30, 5, 30)192.023038 min2722 min−316 min
III-6(30, 5, 5, 30, 30)203.902805 min2727 min−78 min
III-7(5, 30, 30, 30, 5)198.342641 min2835 min194 min
III-8(5, 30, 30, 5, 30)198.303061 min2735 min−326 min
III-9(5, 30, 5, 30, 30)210.183277 min3285 min8 min
III-10(5, 5, 30, 30, 30)197.422969 min3043 min74 min
IV-1(24, 24, 24, 24, 4)196.882395 min2290 min−105 min
IV-2(24, 24, 24, 4, 24)196.852633 min2287 min−346 min
IV-3(24, 24, 4, 24, 24)206.352904 min2650 min−254 min
IV-4(24, 4, 24, 24, 24)196.142714 min2700 min−14 min
IV-5(4, 24, 24, 24, 24)201.162971 min2746 min−225 min
Disclaimer/Publisher’s Note: The statements, opinions and data contained in all publications are solely those of the individual author(s) and contributor(s) and not of MDPI and/or the editor(s). MDPI and/or the editor(s) disclaim responsibility for any injury to people or property resulting from any ideas, methods, instructions or products referred to in the content.