
Microbial Fuel Cell Using a Novel Ionic-Liquid-Type Membrane-Cathode Assembly with Heterotrophic Anodic Denitrification for Slurry Treatment
 ,
,  , ,
, , 
Abstract
:1. Introduction
2. Materials and Methods
2.1. Fuel and Chemicals
2.2. Ionic Liquids
2.3. Synthesis of Mixed-Valence Copper and Cobalt Oxides
2.4. Preparation of New Proton-Exchange Membranes with Catalytic Activity Based on Ionic Liquids
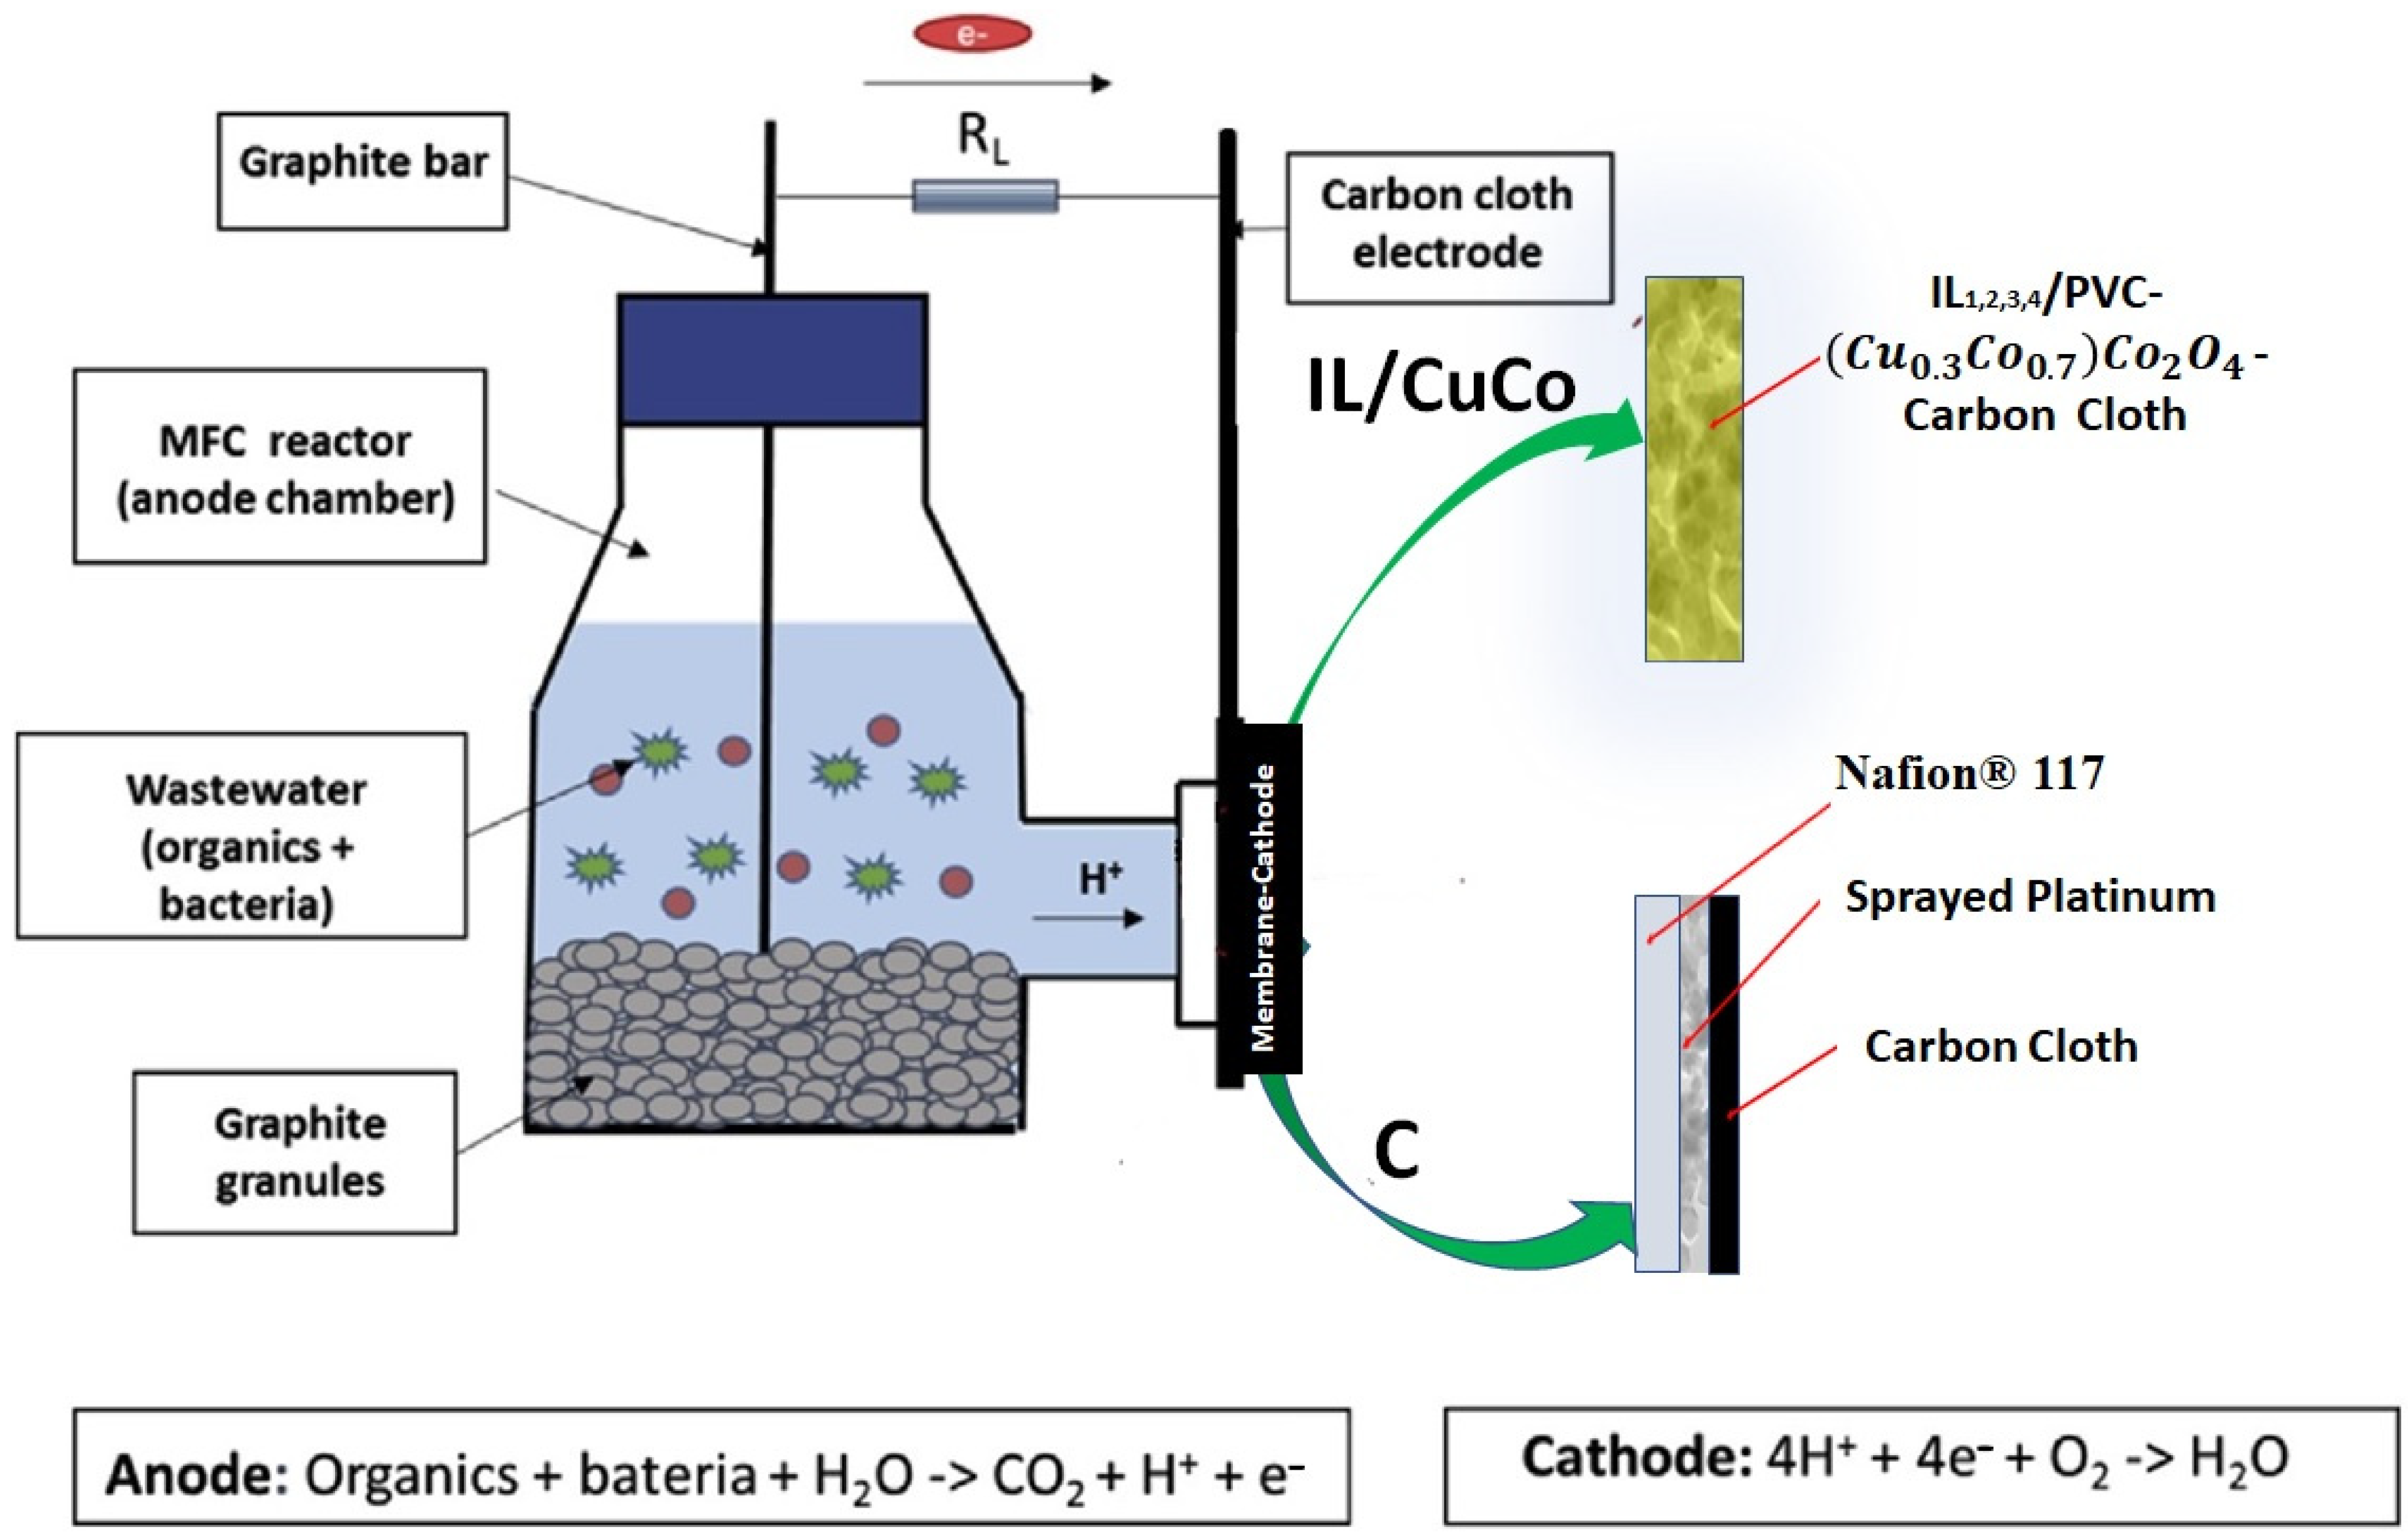
2.5. MFC Studies
2.6. Analytical Methods
2.6.1. Chemical Analysis
- Chemical oxygen demand (COD) tests were conducted using COD 145,541 Supelco cuvettes from Sigma-Aldrich, following the procedure outlined in DIN ISO 15705. This method has received approval from the USEPA for wastewater analysis.
- Total nitrogen (organic and inorganic nitrogen) tests were conducted in nitrogen (total) 114,763 Supelco cuvettes (Sigma-Aldrich). The digestion is analogous to EN ISO 11906-1.
- Nitrates (NO3−) tests were conducted in nitrates 100,614 Supelco cuvettes (Sigma-Aldrich). The procedure is analogous to DIN 38405-9.
- Nitrites (NO2−) tests were conducted in nitrites 114,547 Supelco cuvettes (Sigma-Aldrich). The procedure is analogous to EPA 354.1, APHA 4500-NO2 B, DIN EN 26 777, and ISO 6777.
- Ammoniacal nitrogen (NH4+, NH3) tests were conducted in ammonium 114,559 Supelco cuvettes (Sigma-Aldrich). The procedure is analogous to EPA 350.1, APHA 4500-NH3 F, ISO 7150-1, and DIN 38406-5.
- Biochemical oxygen demand at 5 days (BOD5) was determined. A system of six Velp Scientifica instruments was employed for the manometric assessment of BOD. In this process, dicyanamide served as an inhibitor for nitrification.
2.6.2. Electrochemical Analysis
Polarisation Test
Internal Resistance
2.7. Statistical Analysis
2.8. SEM-EDX Characterisation
3. Results and Discussion
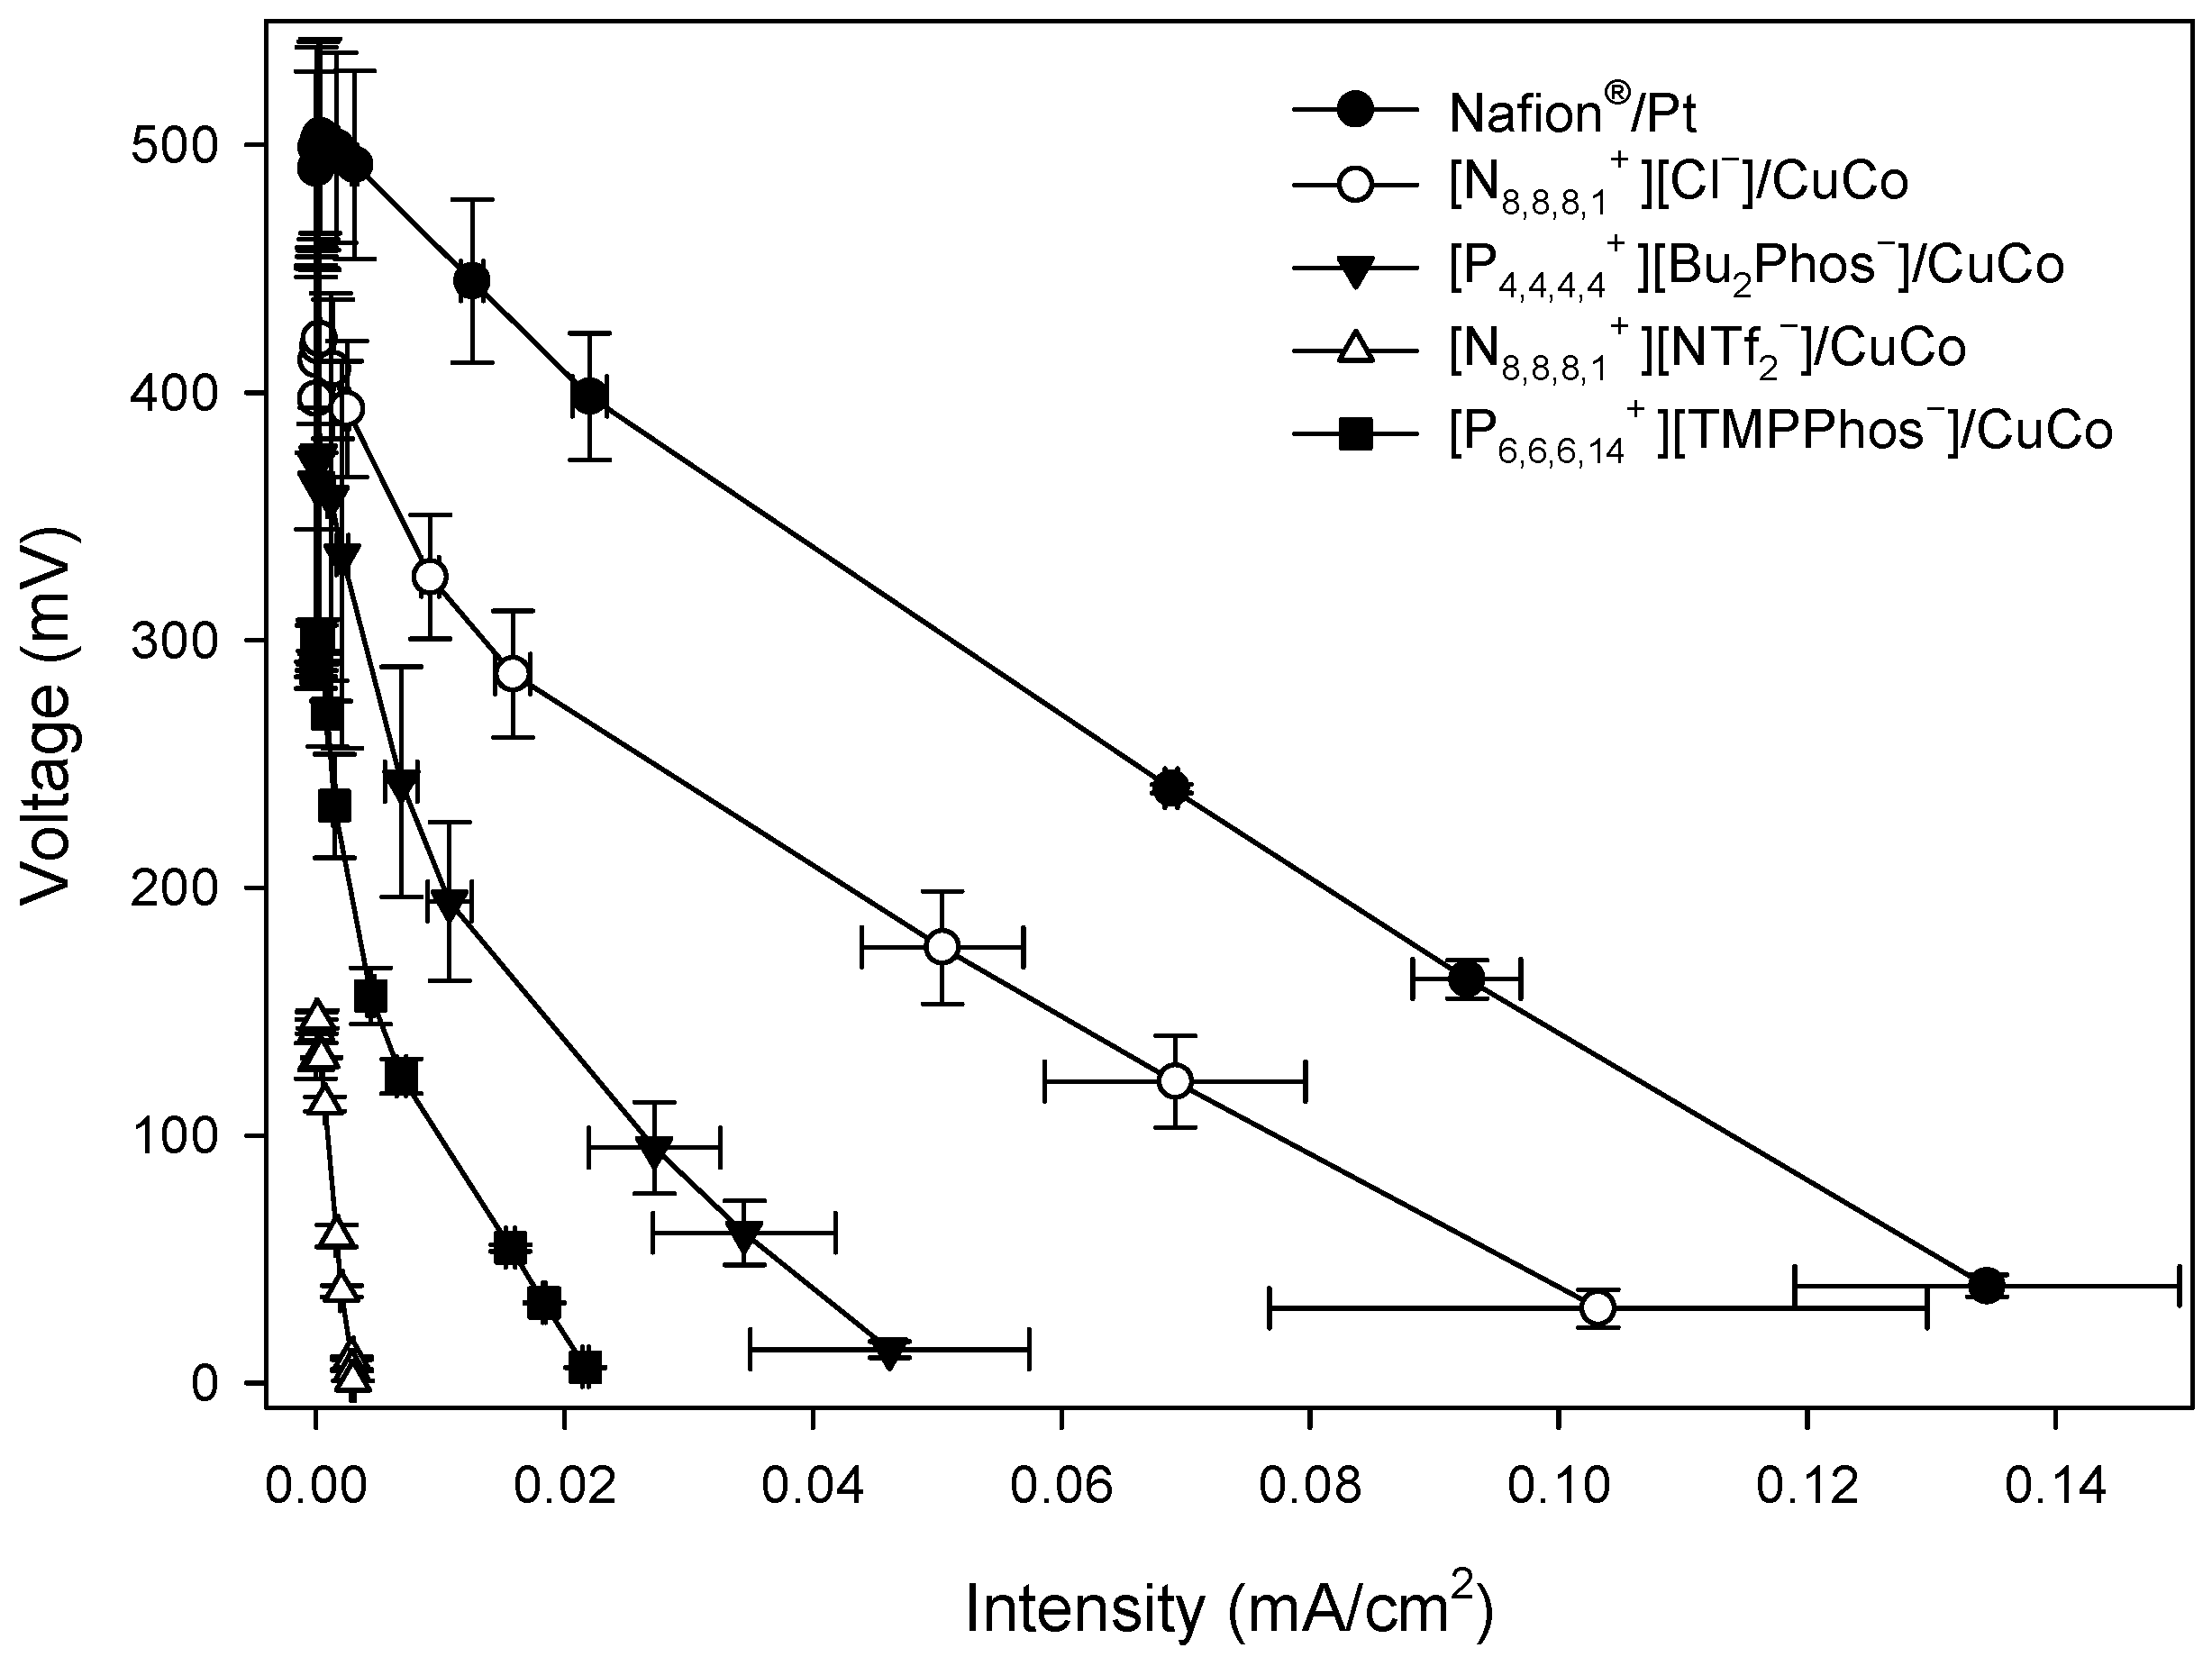
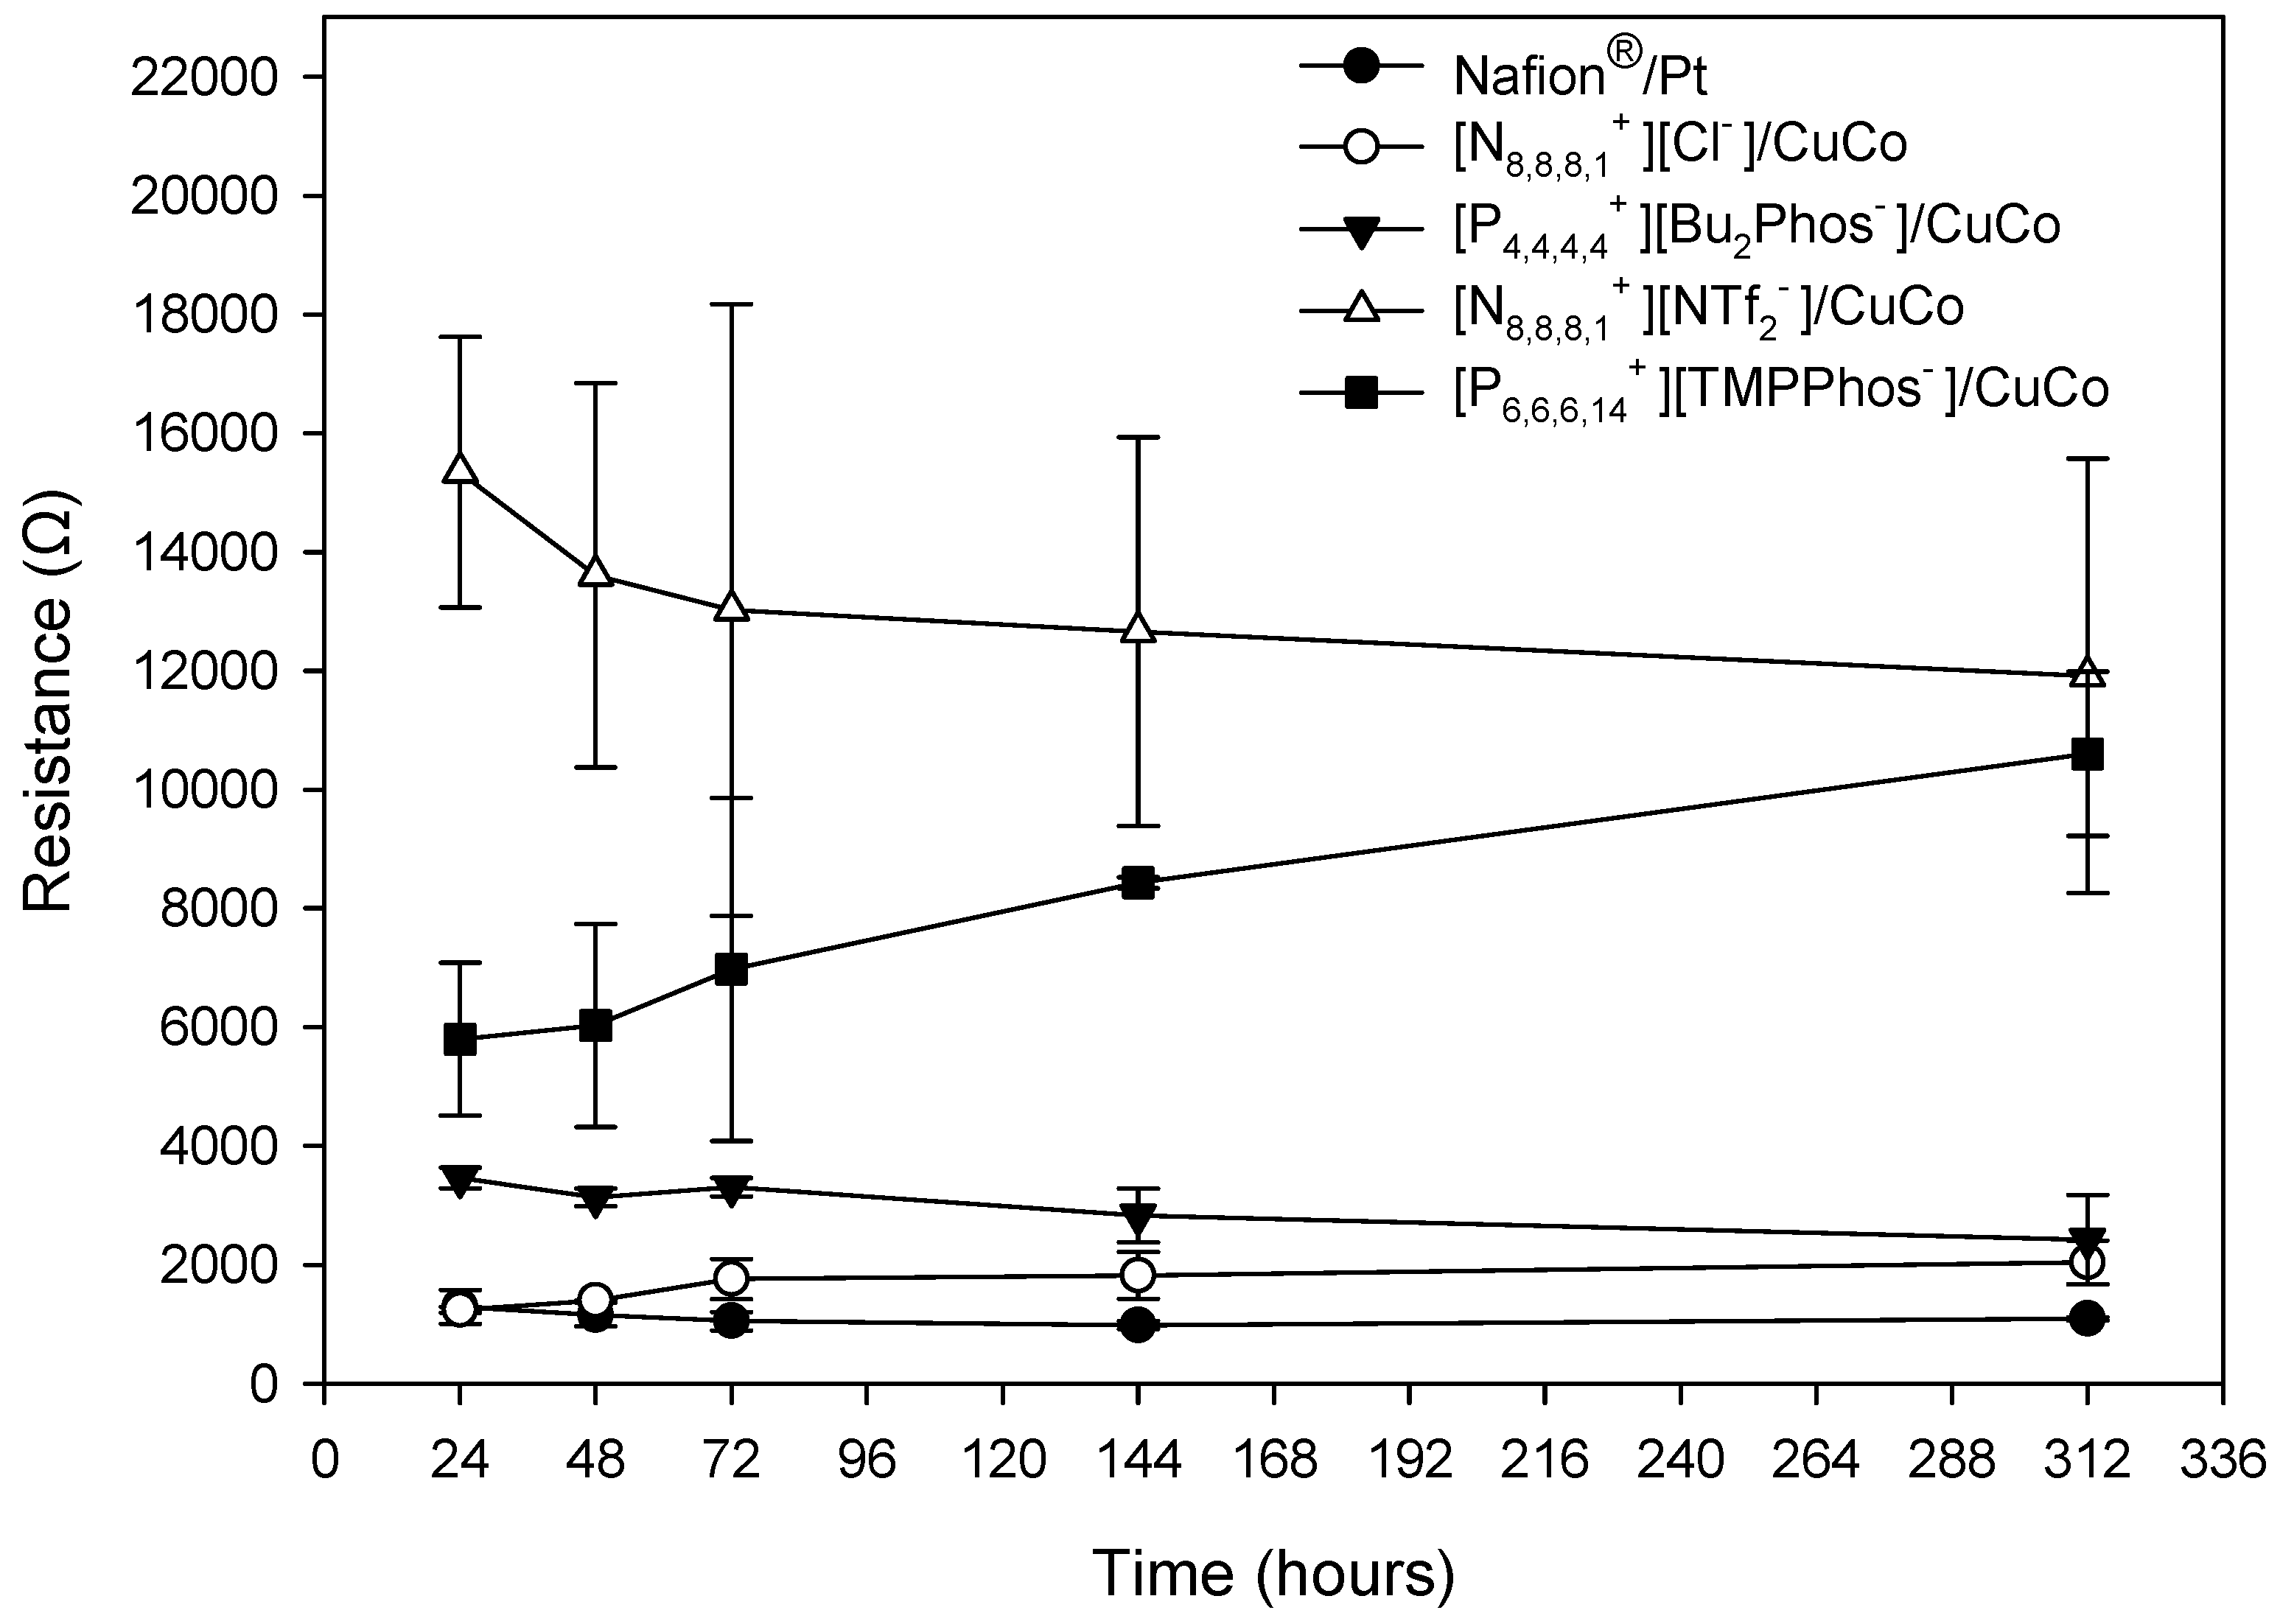
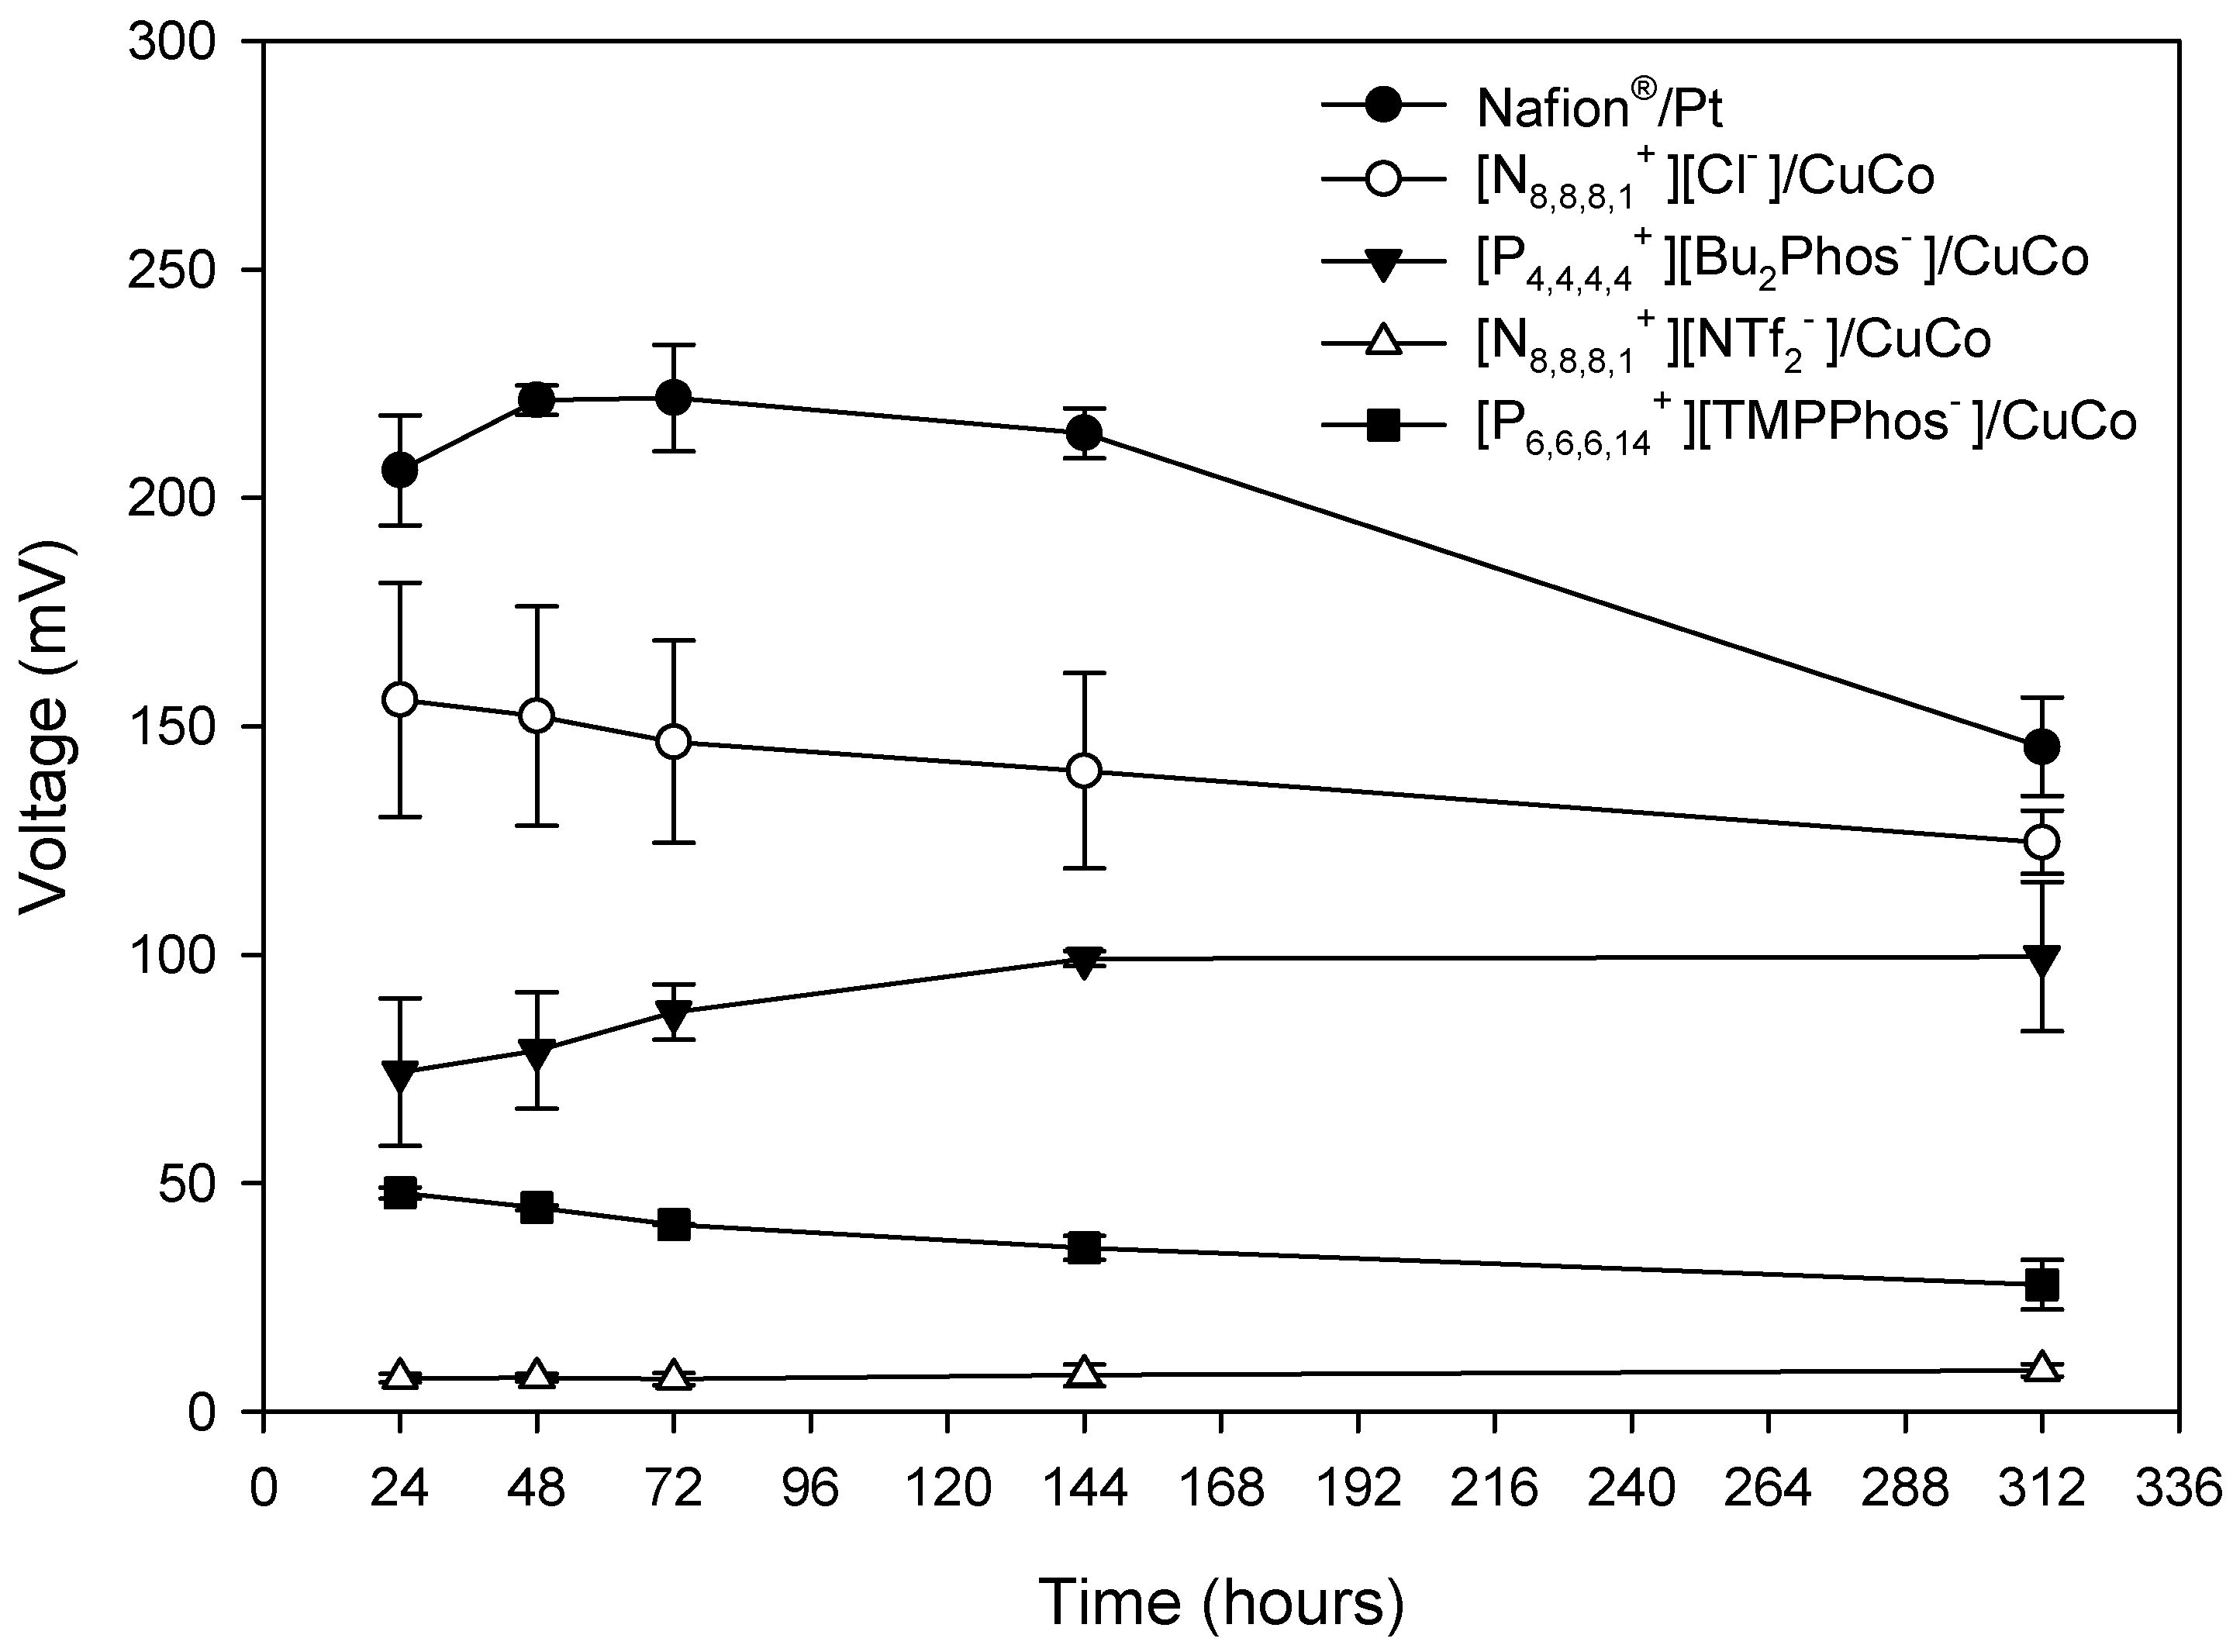
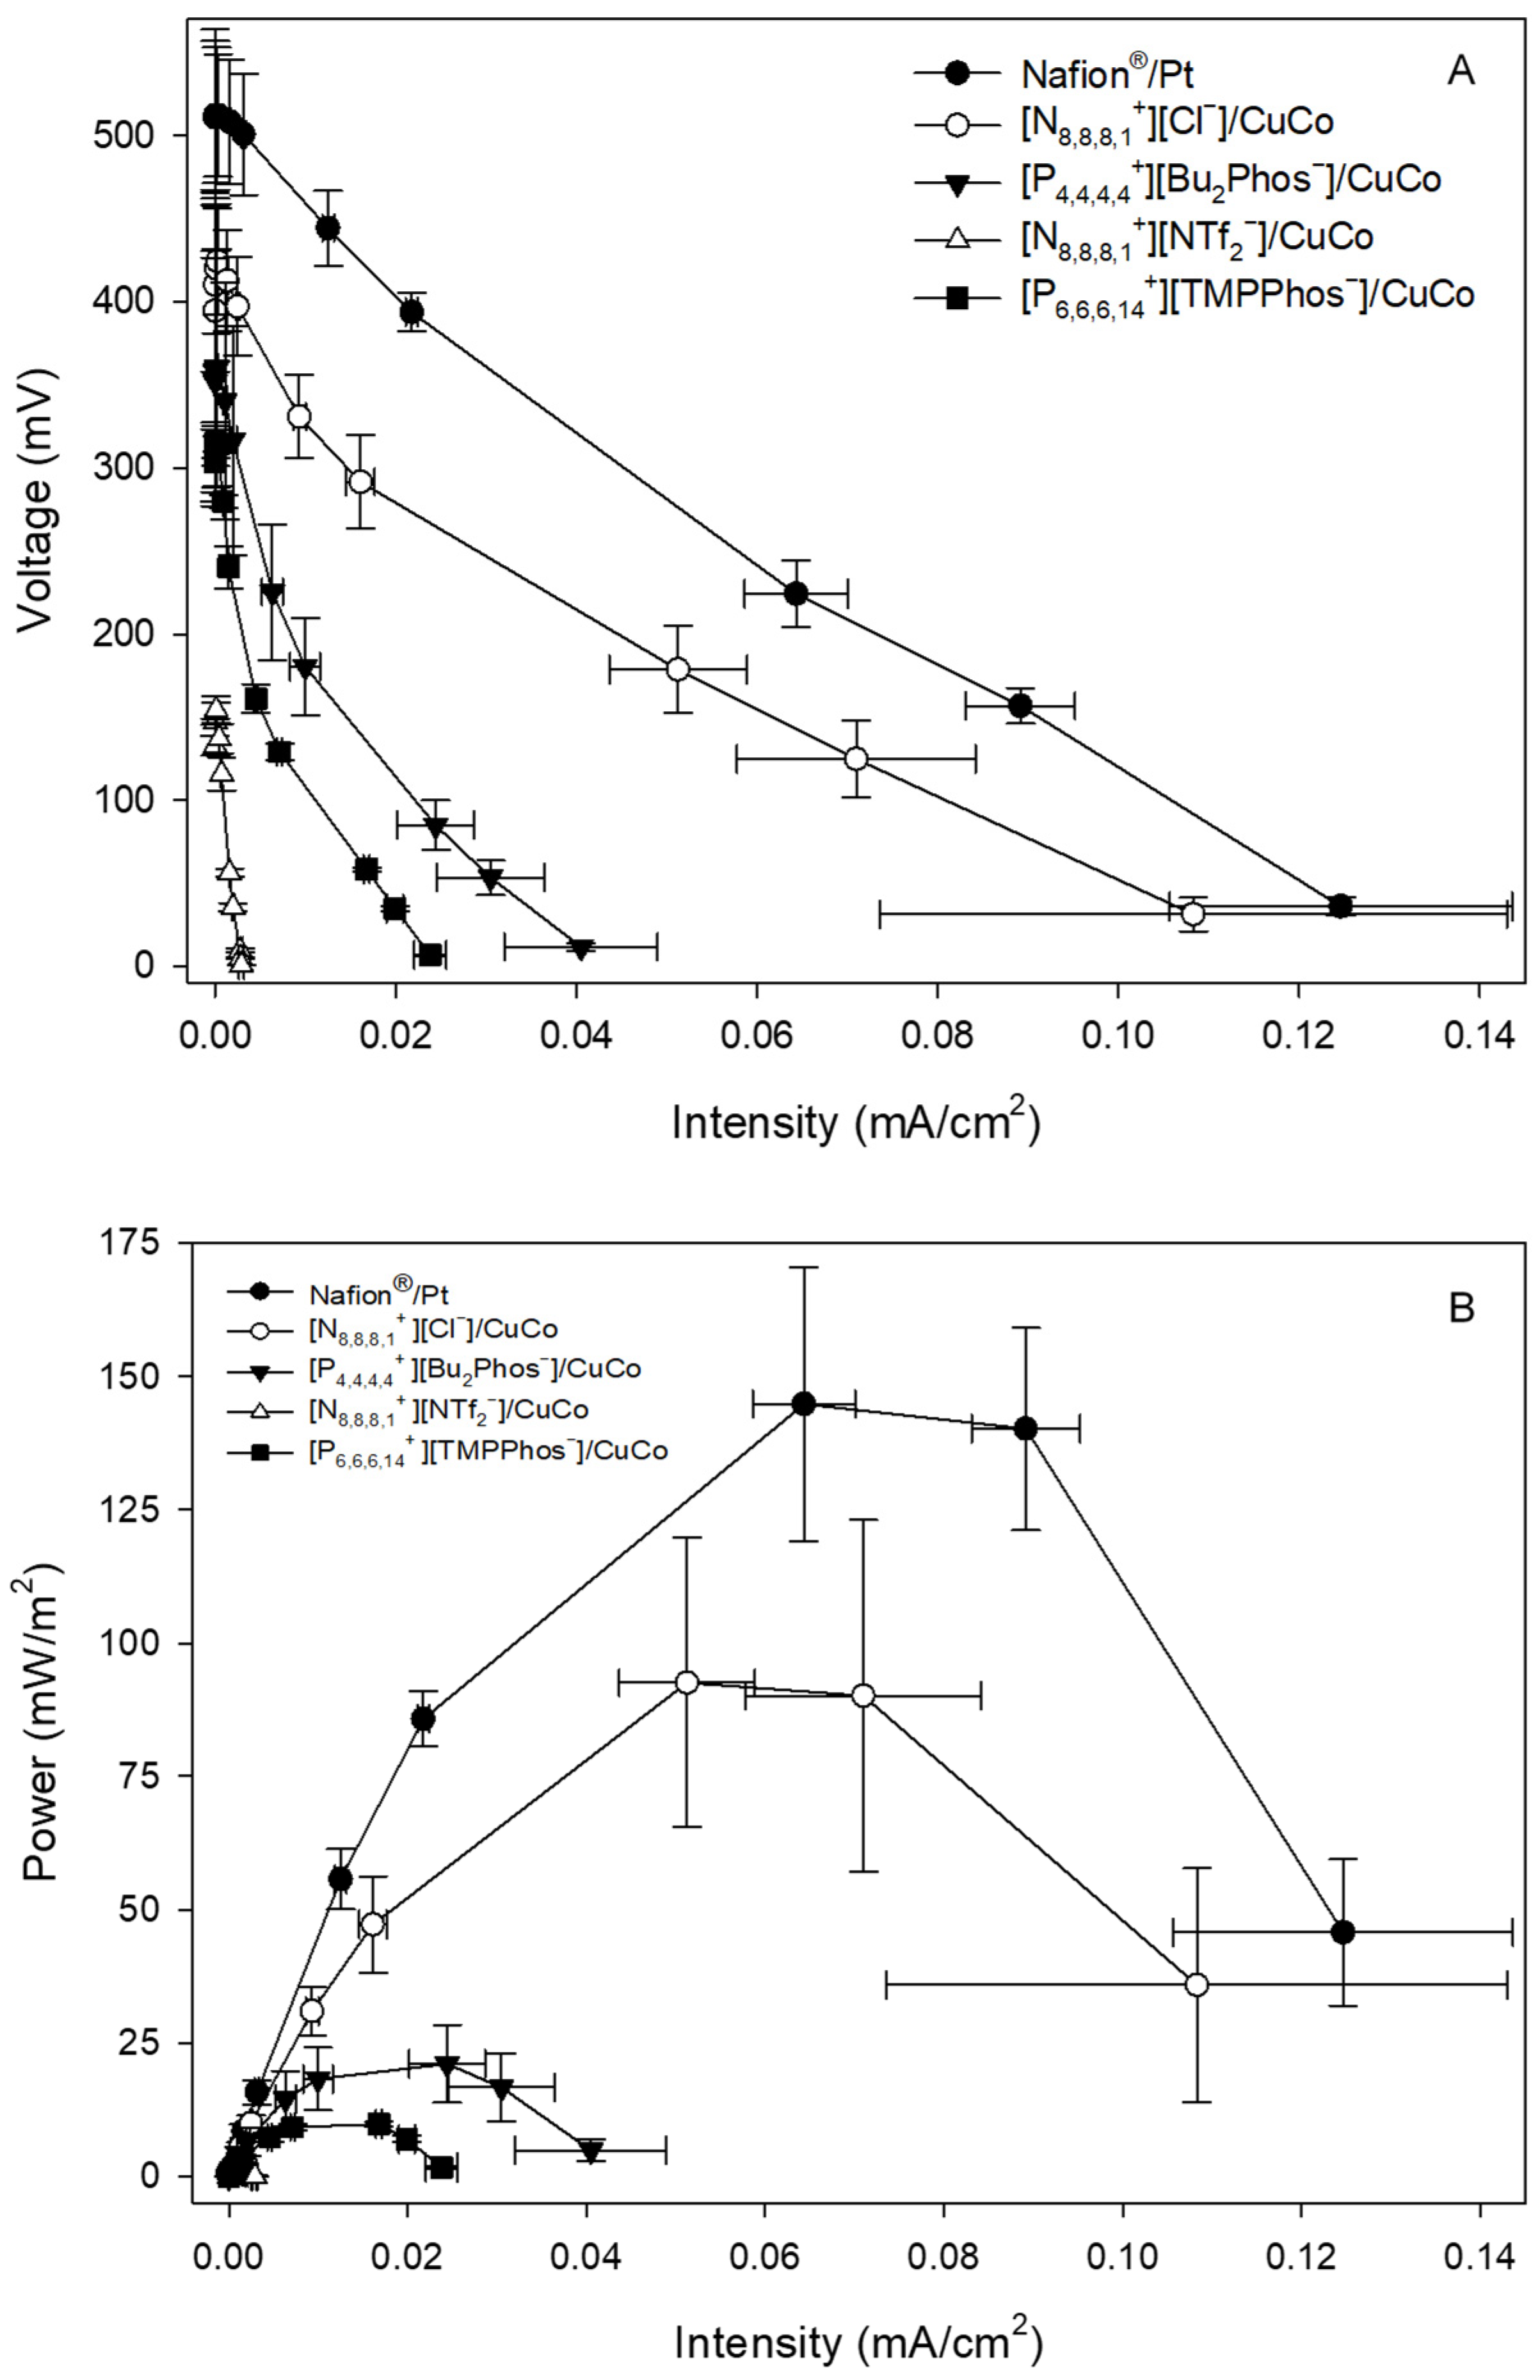
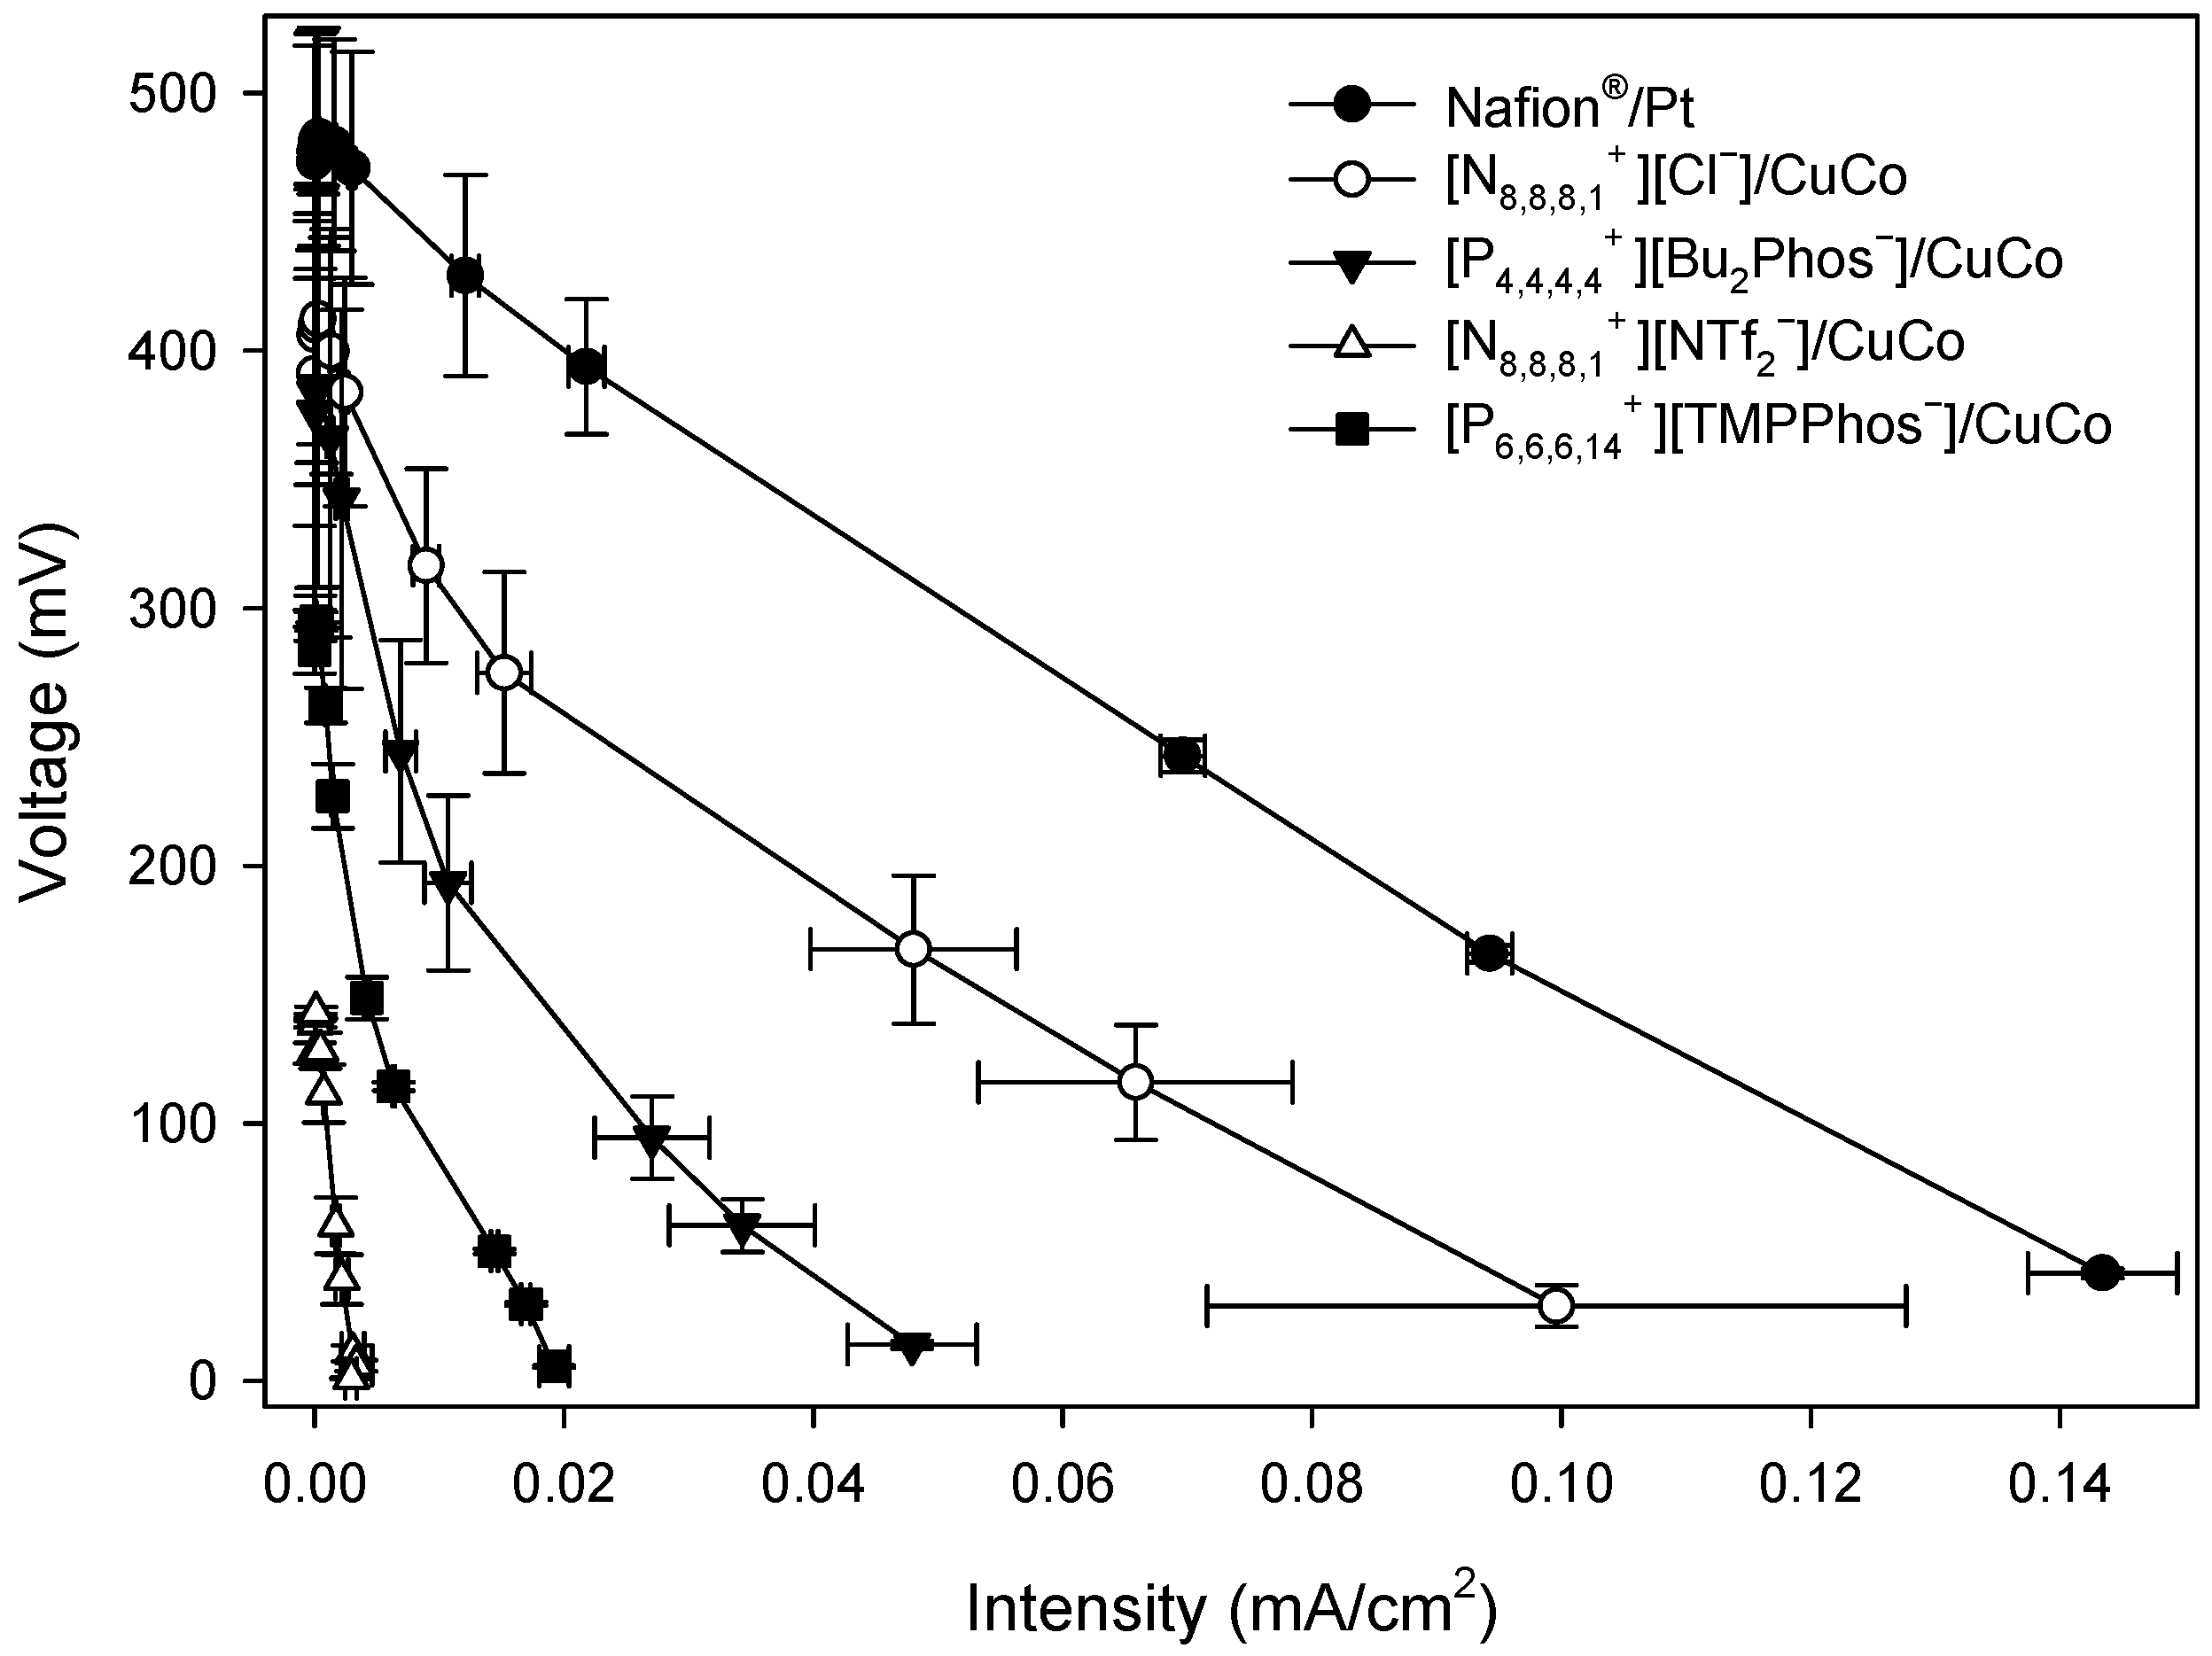
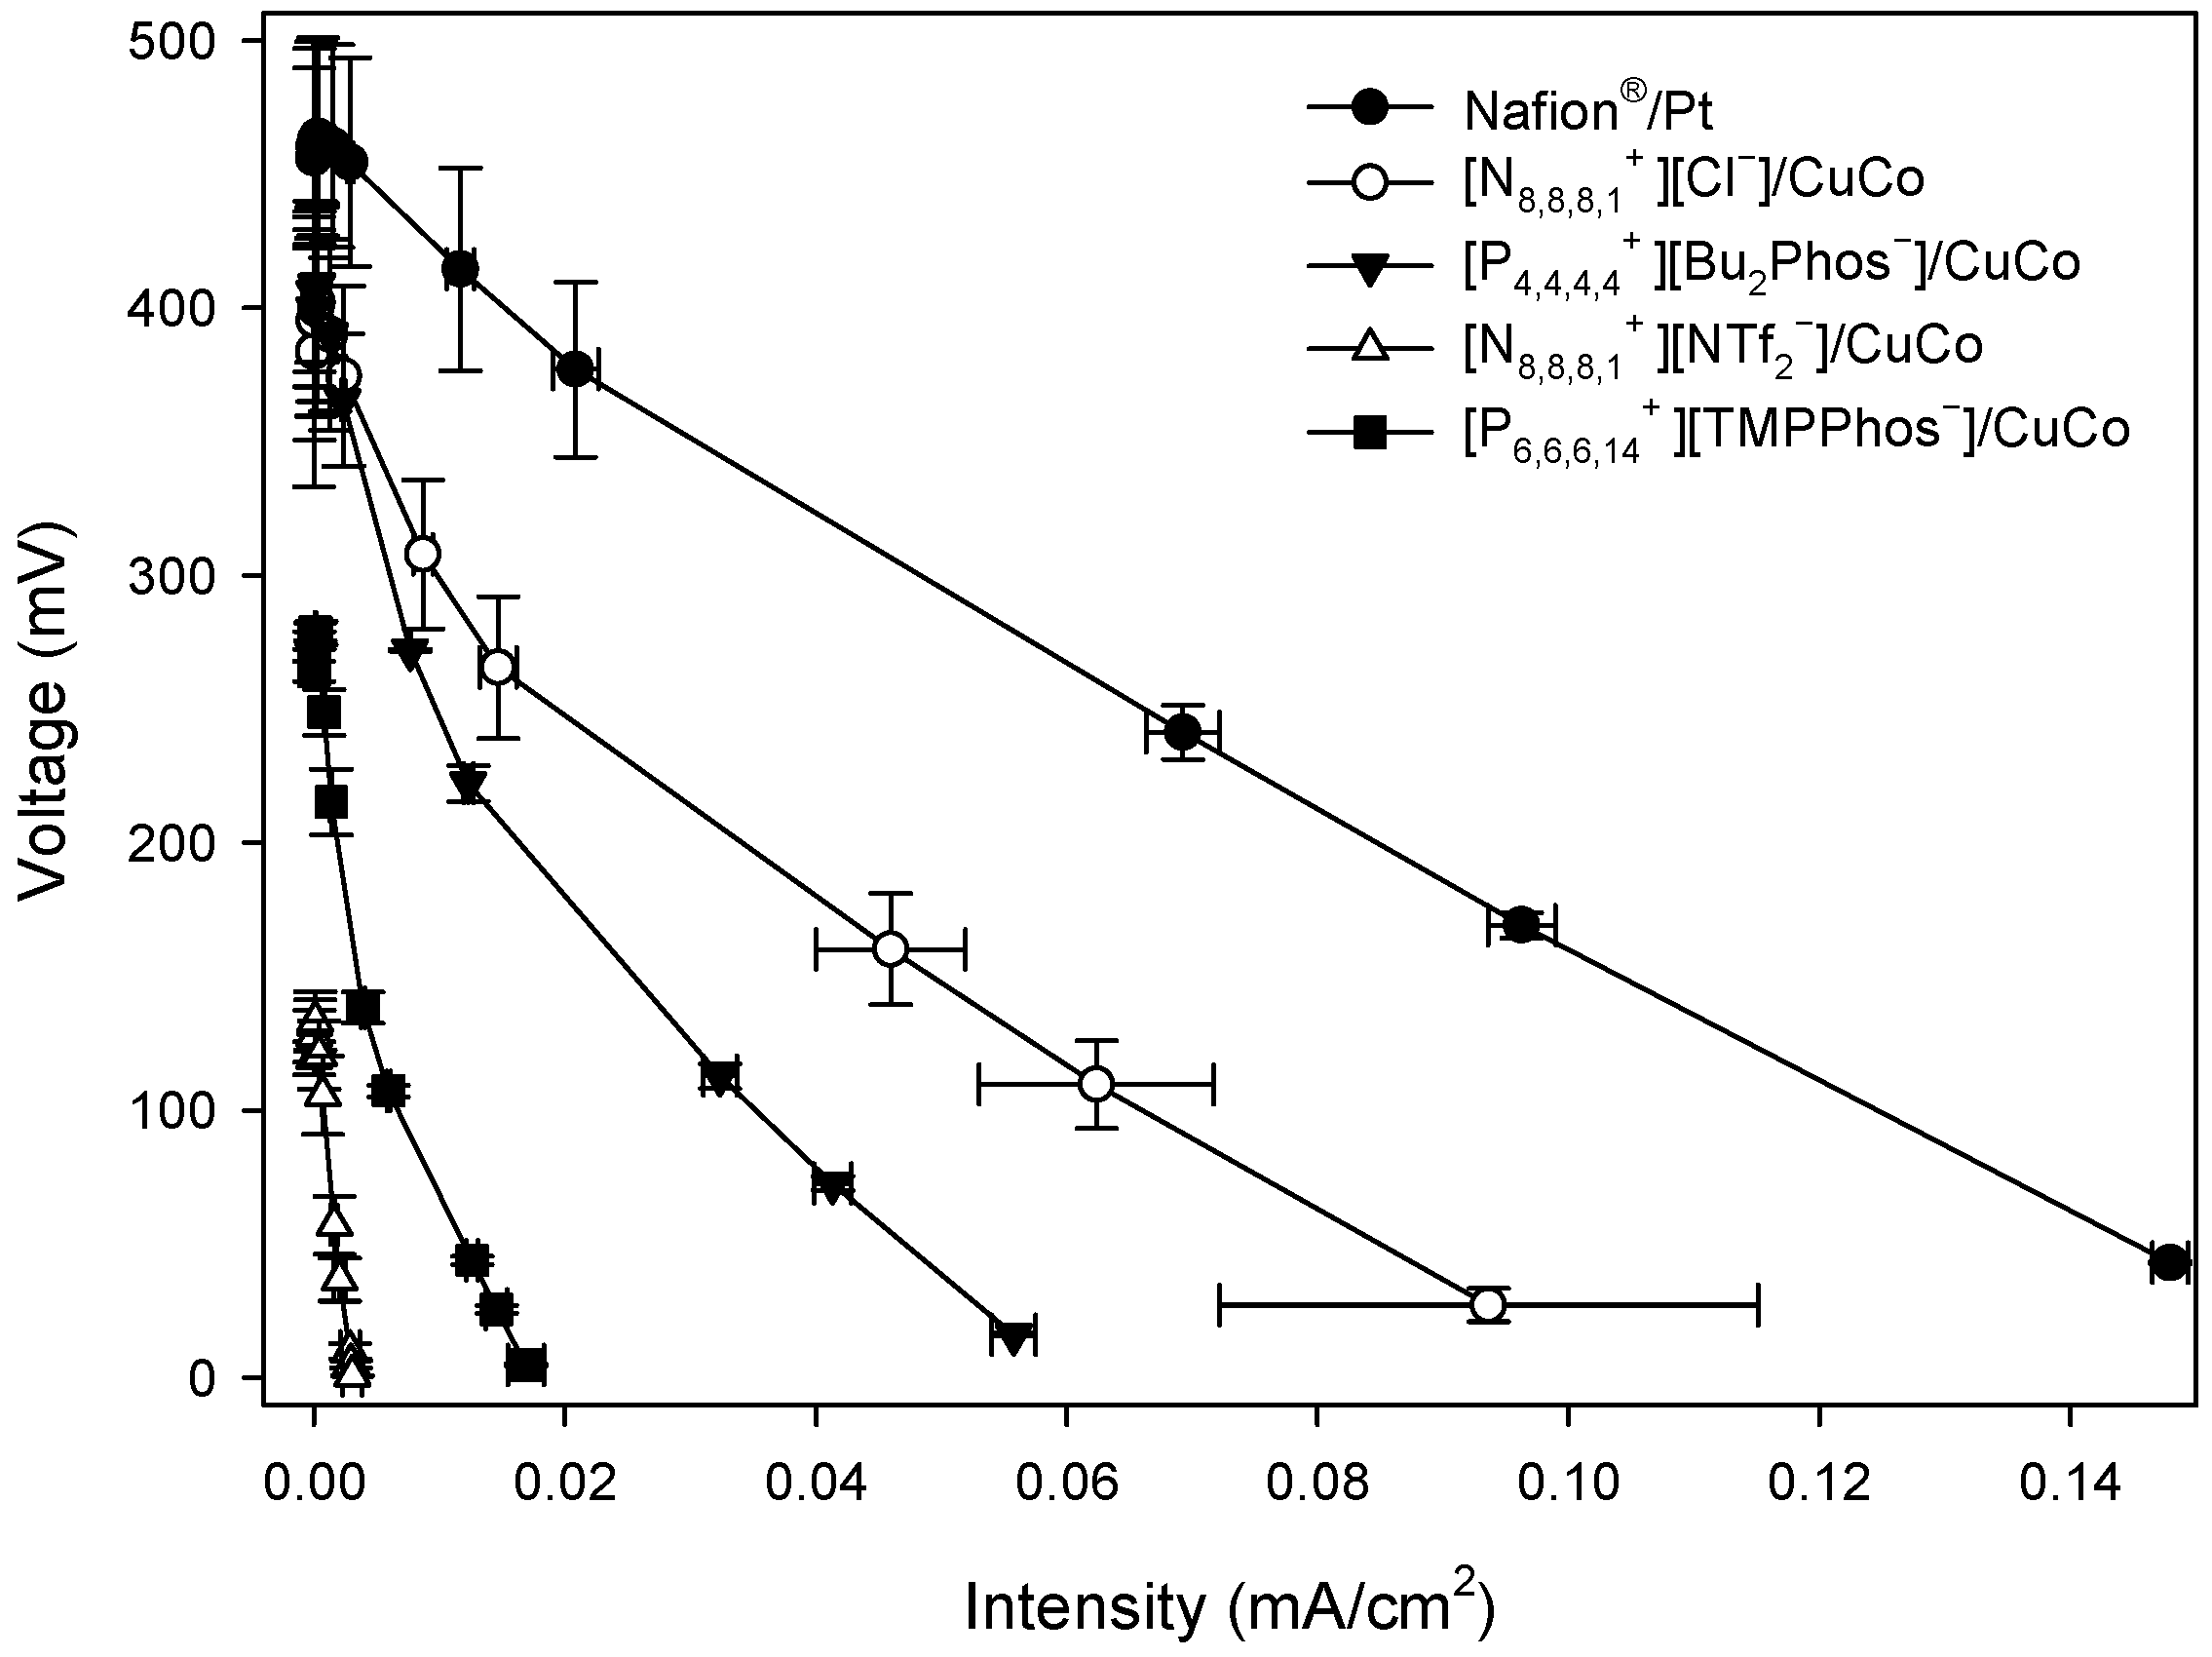
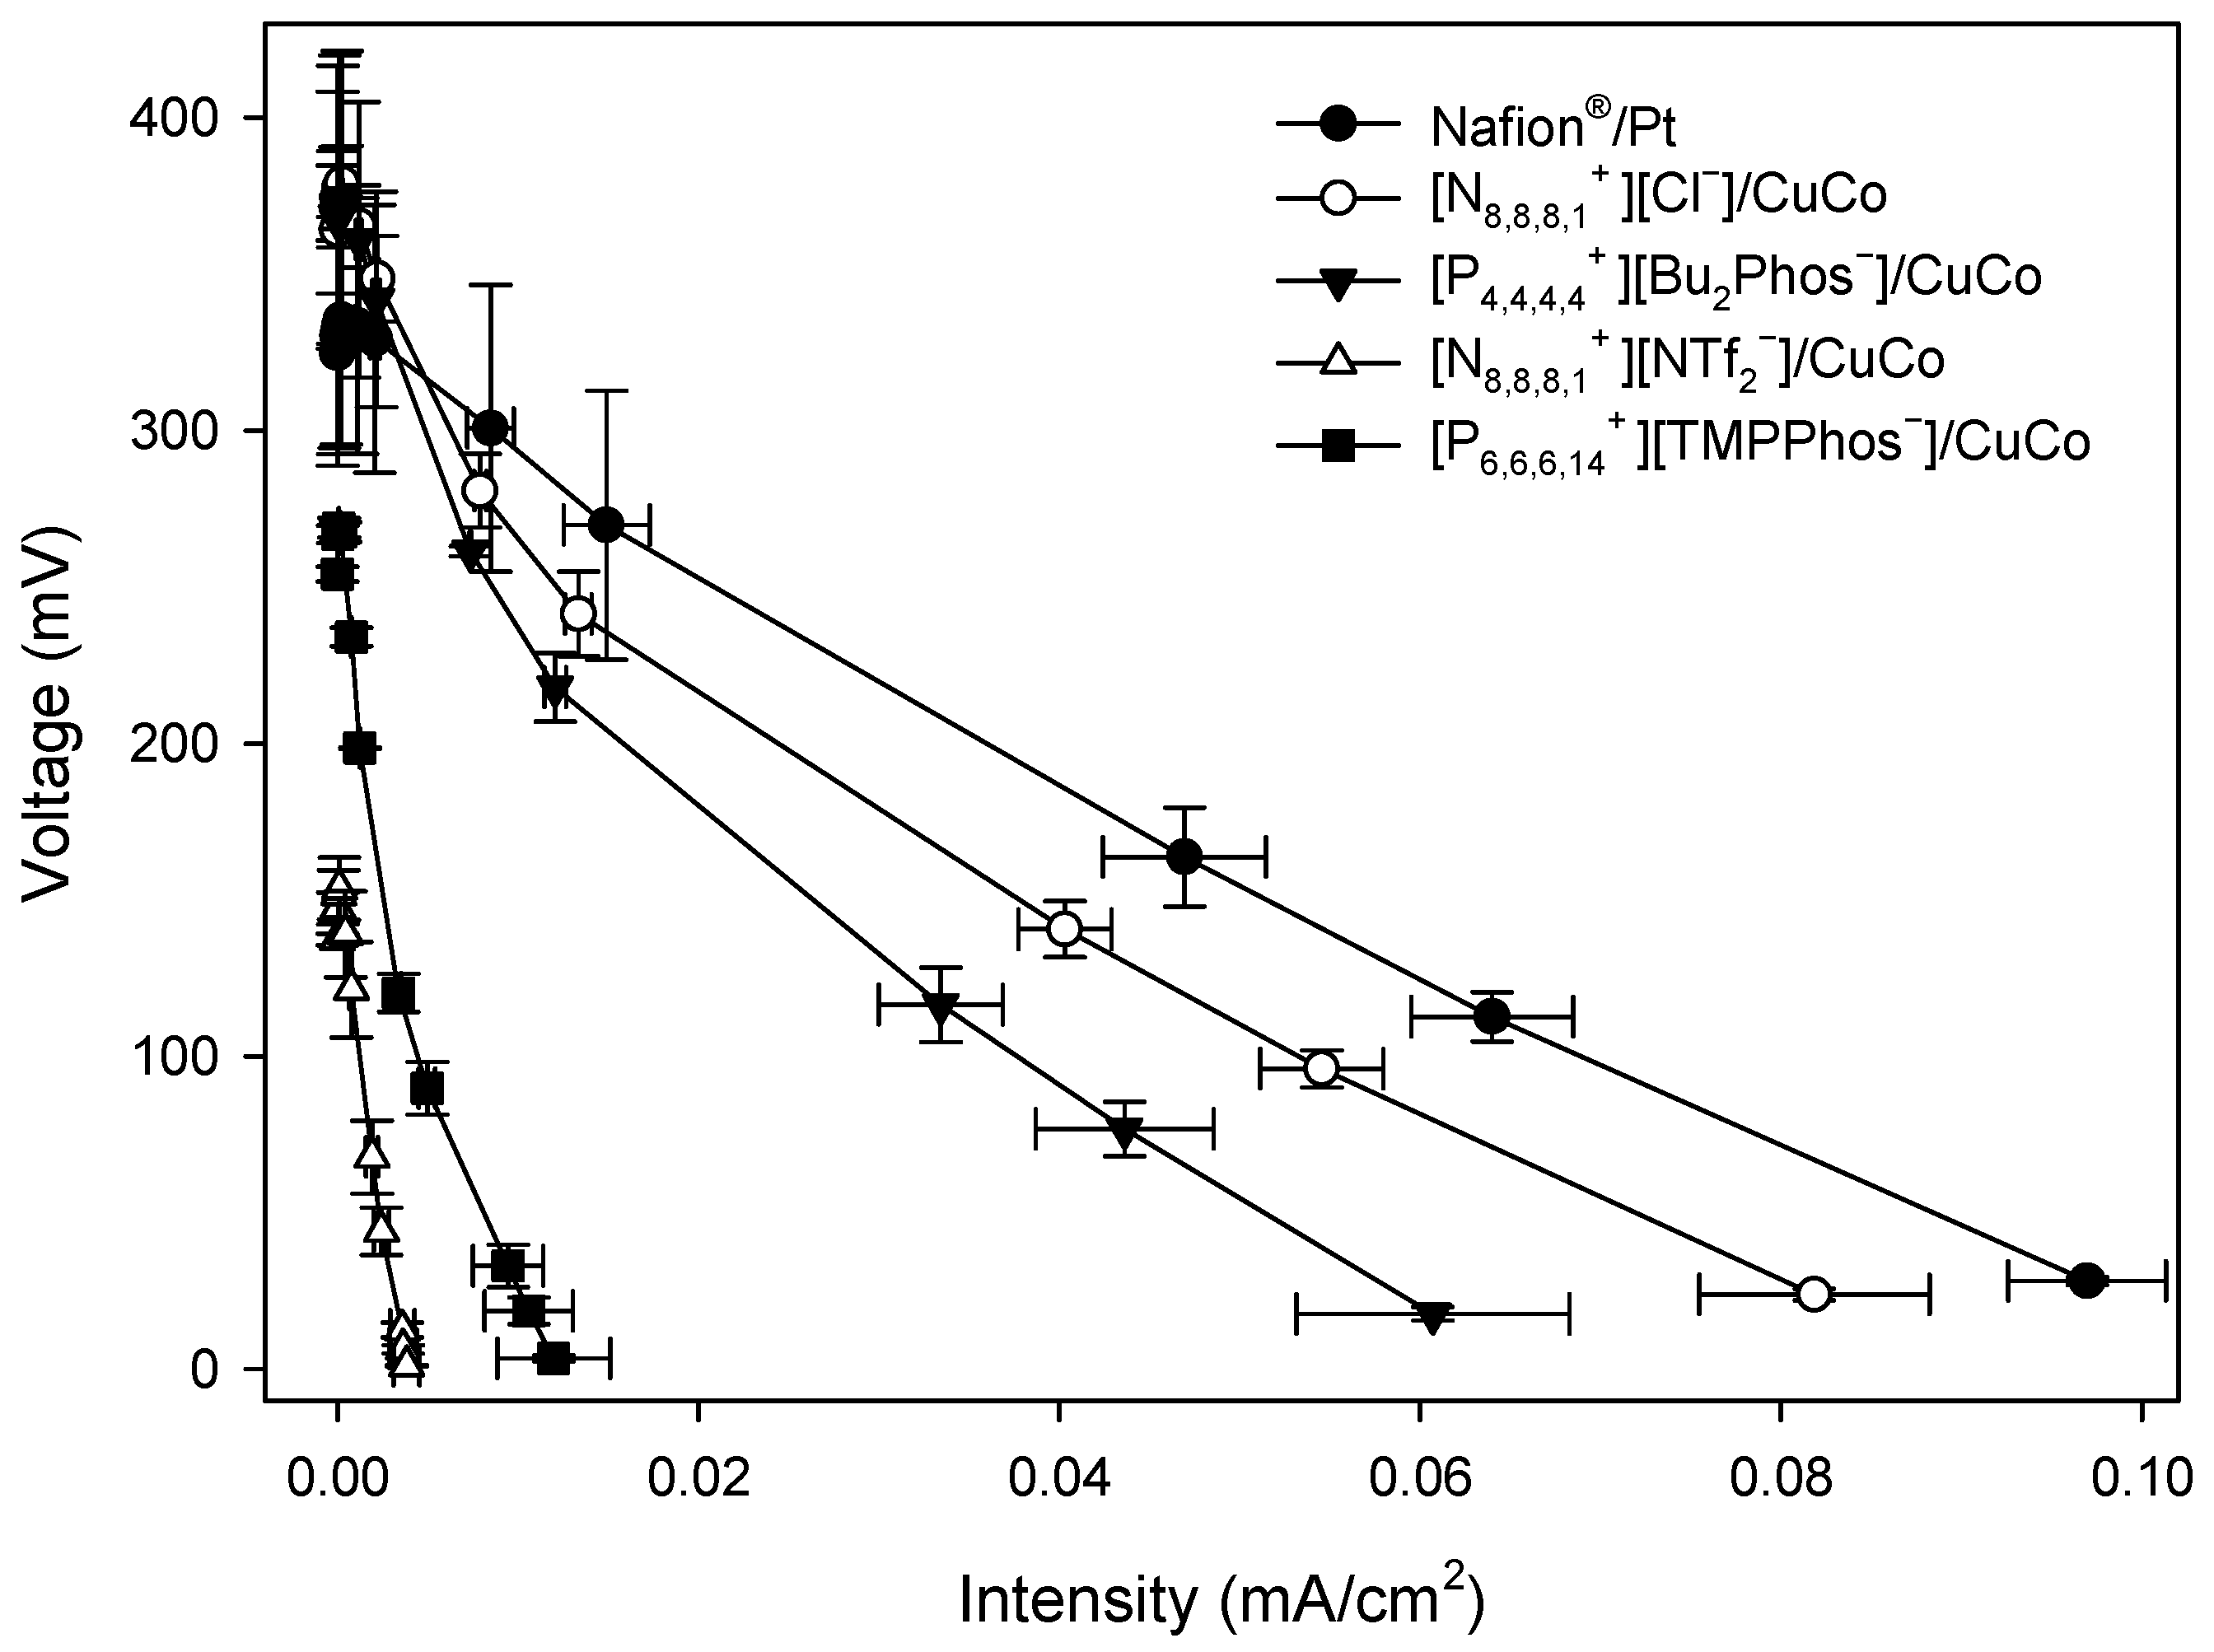
3.1. Electrochemical Analysis
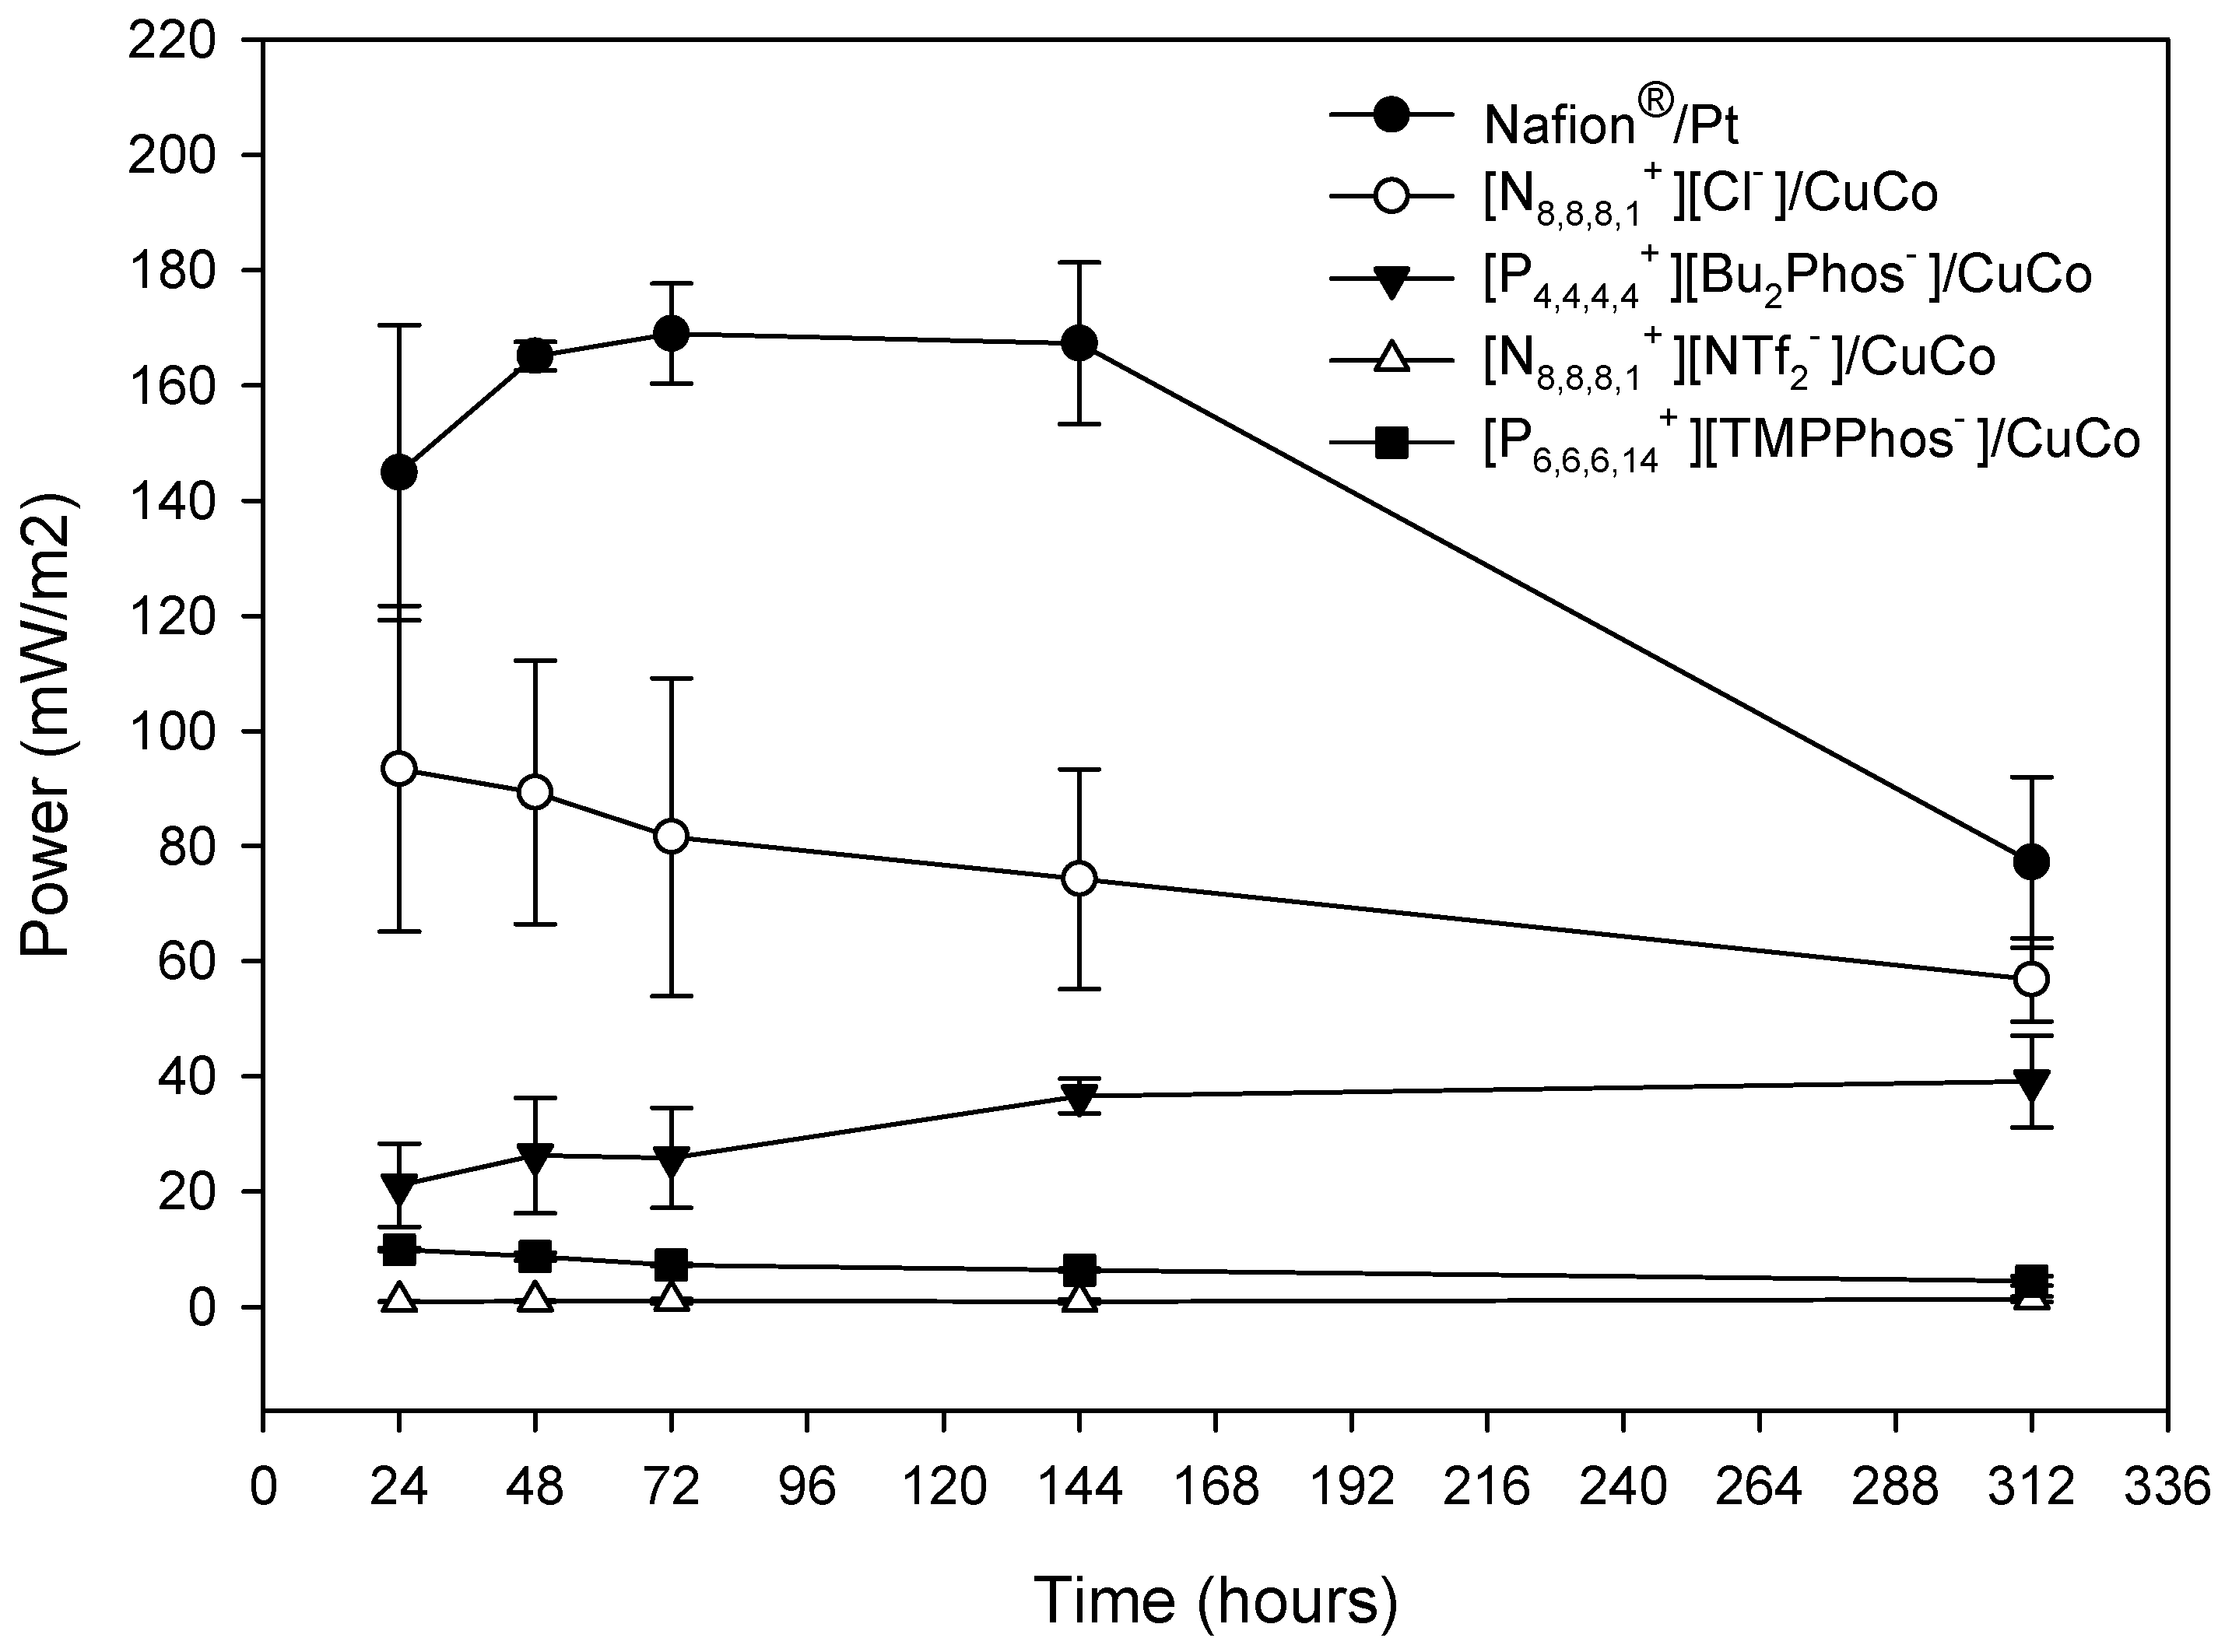
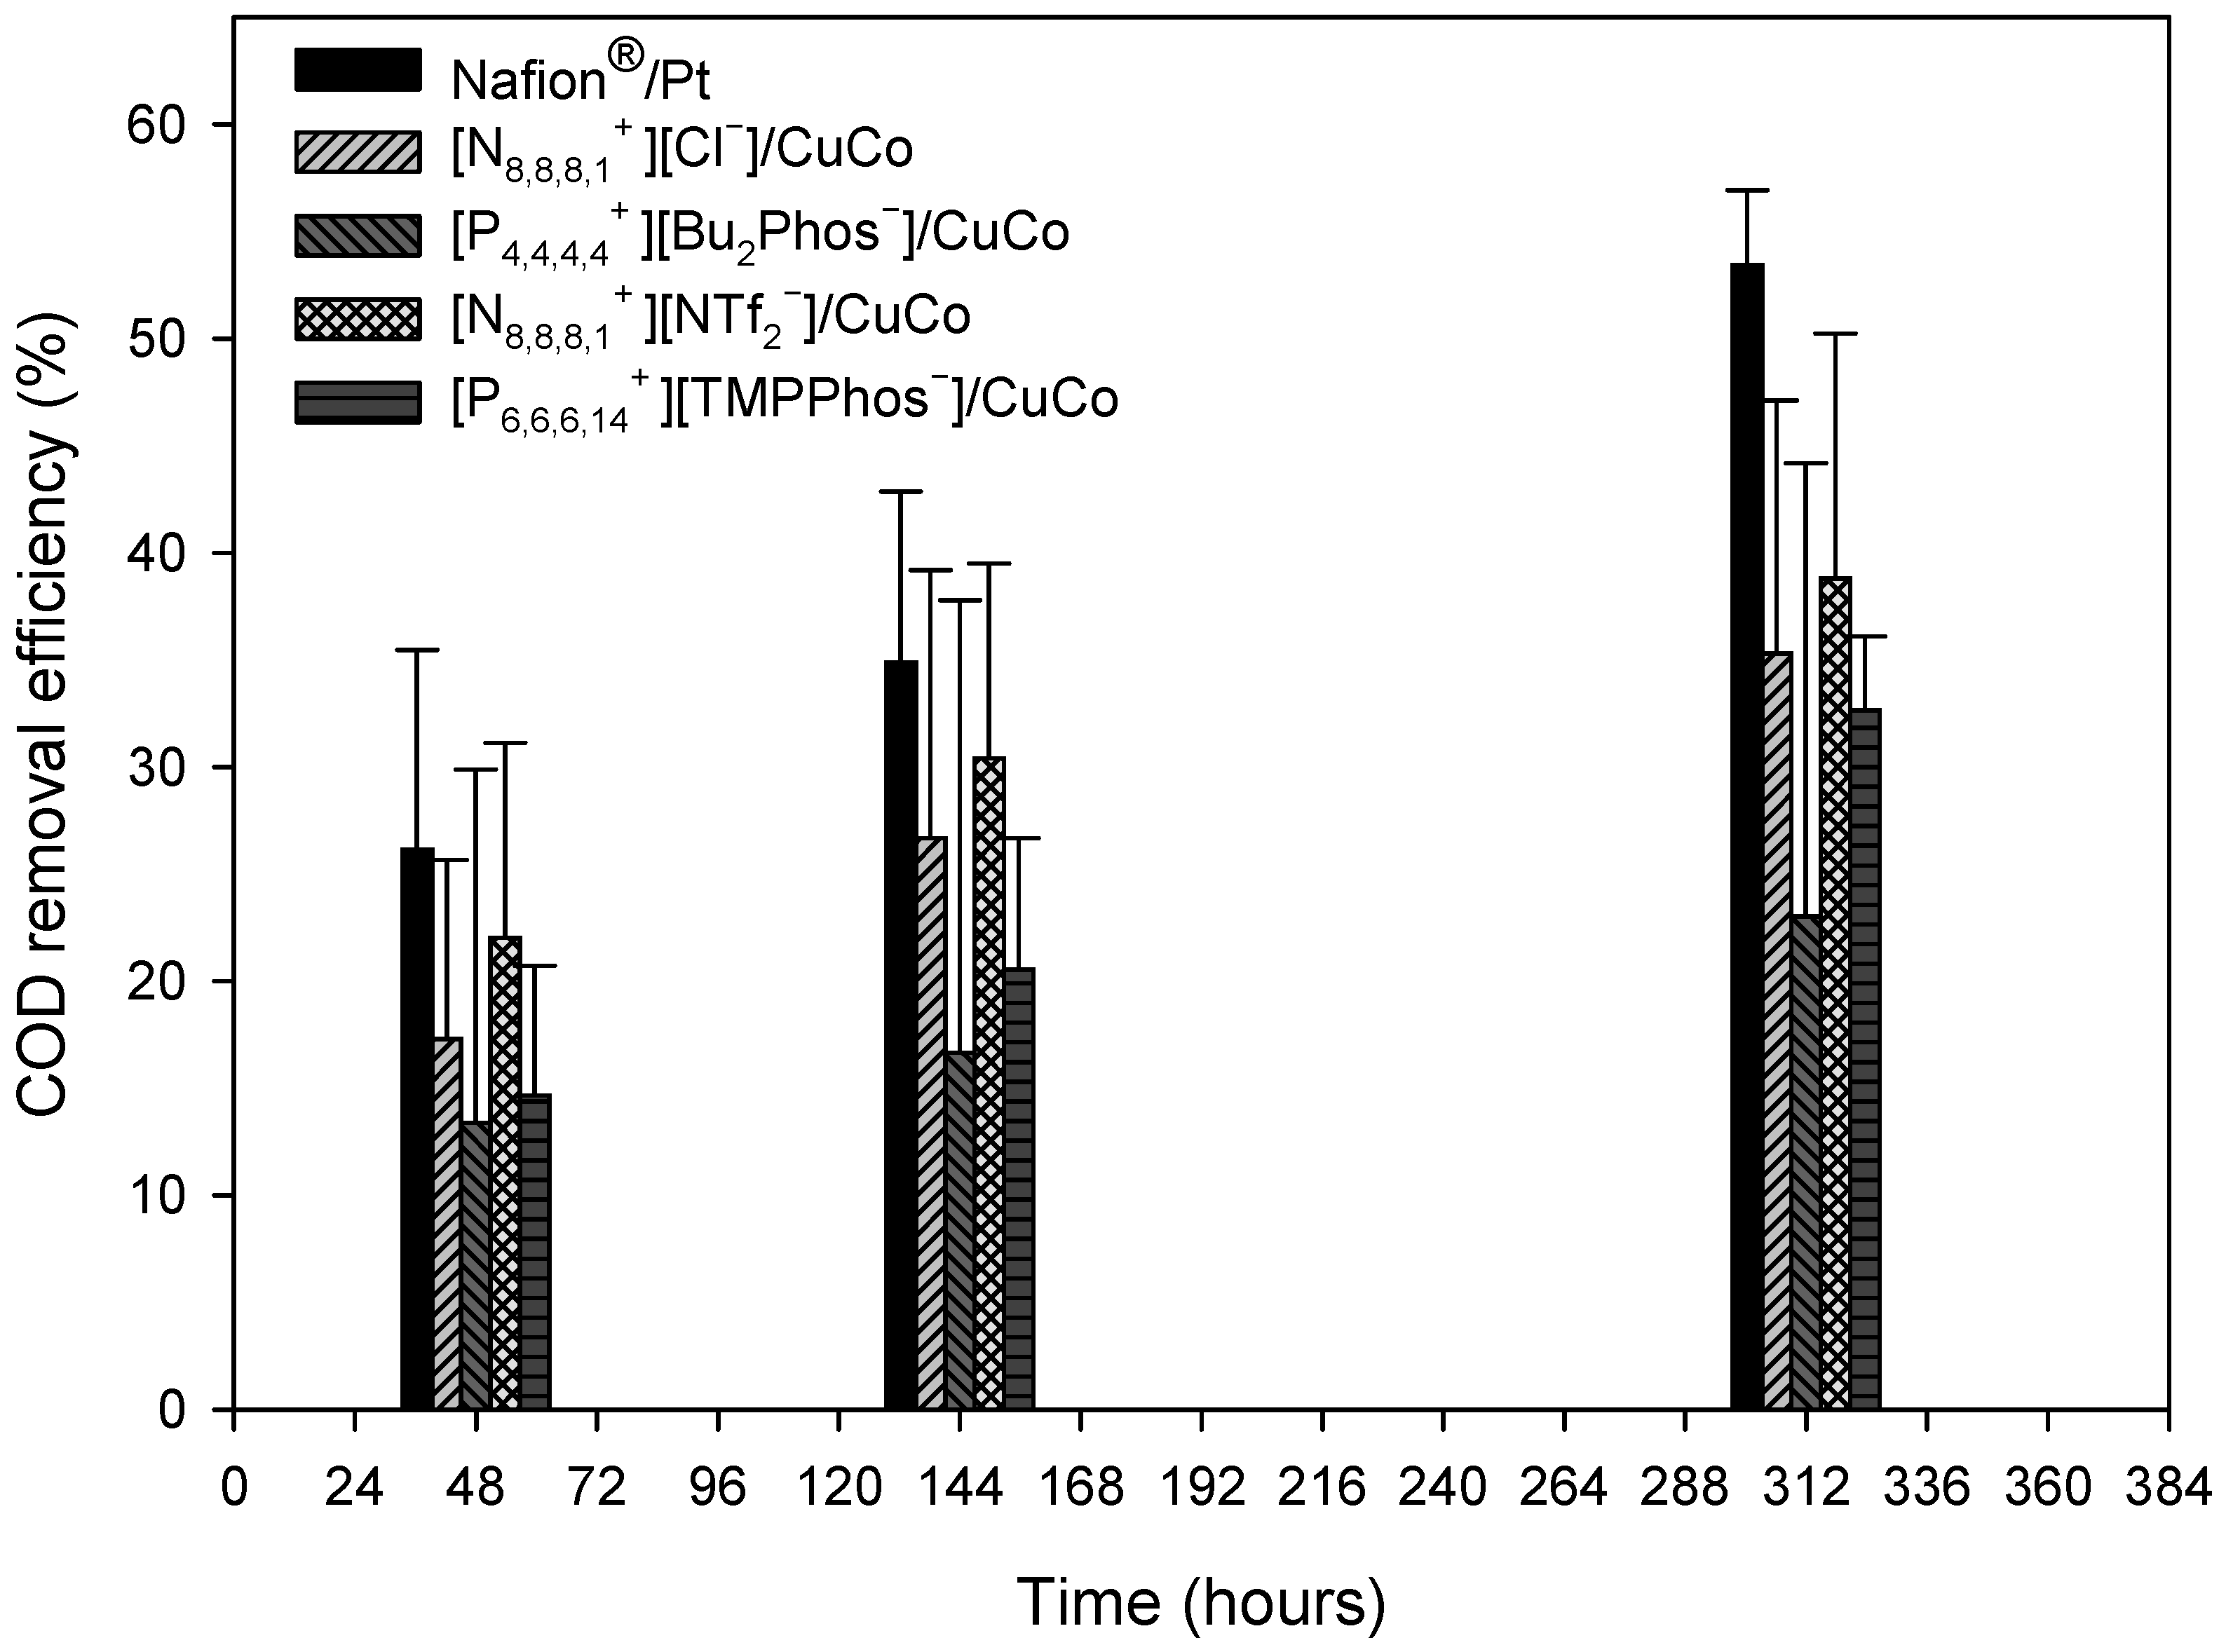
3.2. Slurry Wastewater Treatment Using Microbial Fuel Cells
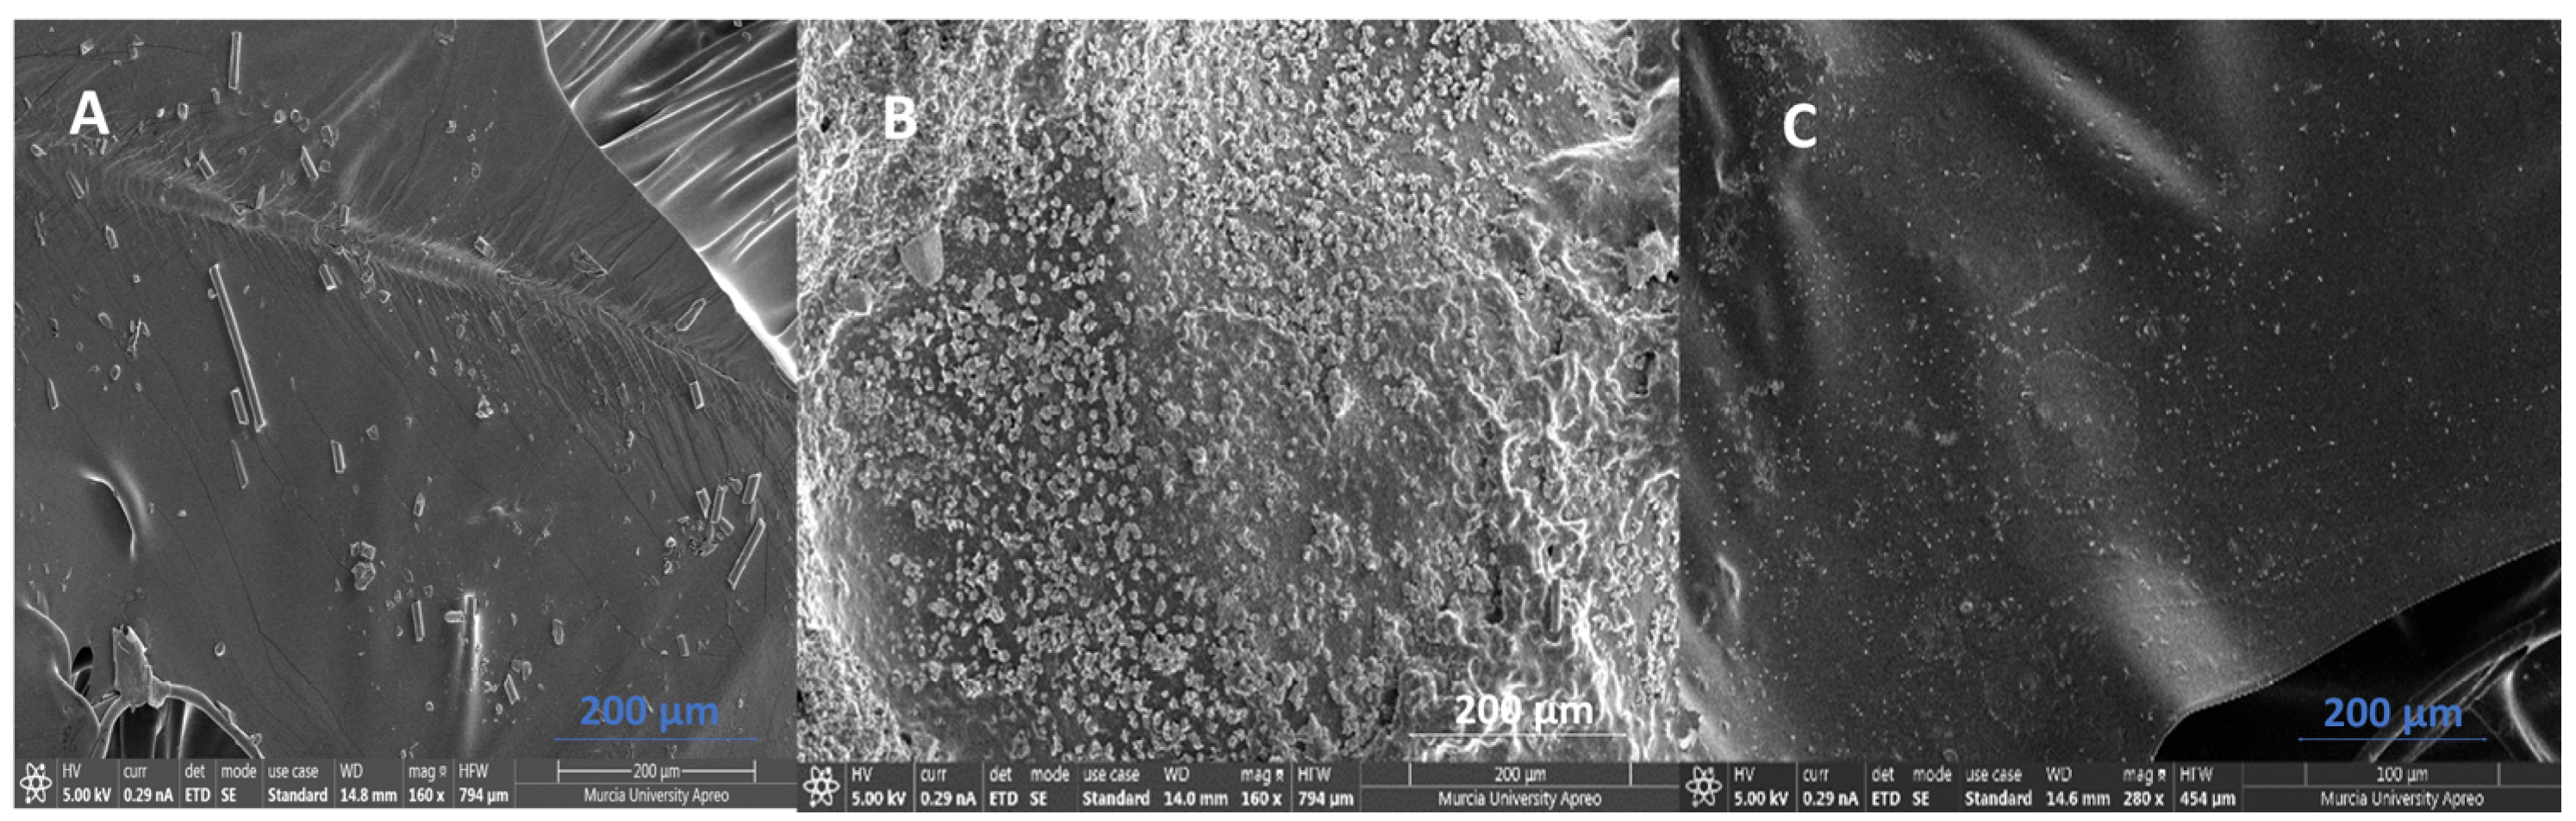
3.3. Characterisation of Membrane–Catalyst Assembly Systems
4. Conclusions
Author Contributions
Funding
Informed Consent Statement
Data Availability Statement
Acknowledgments
Conflicts of Interest
Appendix A


References
- Marszałek, M.; Kowalski, Z.; Makara, A. Physicochemical and microbiological characteristics of pig slurry. Tech. Trans. Chem. 2014, 111, 81–91. [Google Scholar]
- Rittmann, B.E.; McCarty, P.L. Environmental Biotechnology: Principles and Applications; McGraw-Hill Education: New York, NY, USA, 2001. [Google Scholar]
- Ward, M.H.; Jones, R.R.; Brender, J.D.; de Kok, T.M.; Weyer, P.J.; Nolan, B.T. Drinking water nitrate and human health: An updated review. Int. J. Environ. Res. Public Health 2018, 15, 1557. [Google Scholar] [CrossRef] [PubMed]
- Zonfa, T.; Kamperidis, T.; Falzarano, M.; Lyberatos, G.; Polettini, A.; Pomi, R.; Rossi, A.; Tremouli, A. Two-Stage Process for Energy Valorization of Cheese Whey through Bio-Electrochemical Hydrogen Production Coupled with Microbial Fuel Cell. Fermentation 2023, 9, 306. [Google Scholar] [CrossRef]
- Yaqoob, A.A.; Mohamad Ibrahim, M.N.; Rafatullah, M.; Chua, Y.S.; Ahmad, A.; Umar, K. Recent Advances in Anodes for Microbial Fuel Cells: An Overview. Materials 2020, 13, 2078. [Google Scholar] [CrossRef] [PubMed]
- Cui, Y.; Lai, B.; Tang, X. Microbial Fuel Cell-Based Biosensors. Biosensors 2019, 9, 92. [Google Scholar] [CrossRef] [PubMed]
- Boas, J.V.; Oliveira, V.B.; Simoes, M.; Pinto, A.M.F.R. Review on microbial fuel cells applications, developments and costs. J. Environ. Manag. 2022, 307, 114525. [Google Scholar] [CrossRef]
- Banerjee, A.; Calay, R.K.; Eregno, F.E. Role and Important Properties of a Membrane with Its Recent Advancement in a Microbial Fuel Cell. Energies 2022, 15, 444. [Google Scholar] [CrossRef]
- Rossi, R.; Hur, A.Y.; Page, M.A.; Thomas, B.; Butkiewicz, J.J.; Jones, D.W.; Baek, G.; Saikaly, P.E.; Cropek, D.M.; Logan, B.E. Pilot scale microbial fuel cells using air cathodes for producing electricity while treating wastewater. Water Res. 2022, 215, 118208. [Google Scholar] [CrossRef]
- Sevda, S.; Dominguez-Benetton, X.; Vanbroekhoven, K.; Wever, H.D.; Sreekrishnan, T.R.; Pant, D. High strength wastewater treatment accompanied by power generation using air cathode microbial fuel cell. Appl. Energy 2013, 105, 194–206. [Google Scholar] [CrossRef]
- Schmidt, A.; Sturm, G.; Lapp, C.J.; Siebert, D.; Saravia, F.; Horn, H.; Ravi, P.P.; Lemmer, A.; Gescher, J. Development of a production chain from vegetable biowaste to platform chemicals. Microb. Cell Factories 2018, 17, 90. [Google Scholar] [CrossRef]
- Roche, I.; Katuri, K.; Scotthamber, K. A microbial fuel cell using manganese oxide oxygen reduction catalysts. J. Appl. Electrochem. 2010, 40, 13–21. [Google Scholar] [CrossRef]
- Sawant, S.Y.; Han, T.H.; Cho, M.H. Metal-Free Carbon-Based Materials: Promising Electrocatalysts for Oxygen Reduction Reaction in Microbial Fuel Cells. Int. J. Mol. Sci. 2017, 18, 25. [Google Scholar] [CrossRef] [PubMed]
- Santoro, C.; Artyushkova, K.; Babanova, S.; Atanassov, P.; Ieropoulos, I.; Grattieri, M.; Cristiani, P.; Trasatti, S.; Li, B.; Schuler, A.J. Parameters characterization and optimization of activated carbon (AC) cathodes for microbial fuel cell application. Bioresour. Technol. 2014, 163, 54–63. [Google Scholar] [CrossRef]
- Blázquez, E.; Gabriel, D.; Baeza, J.A.; Guisasola, A.; Ledezma, P.; Freguia, S. Implementation of a sulfide–air fuel cell coupled to a sulfate-reducing biocathode for elemental sulfur recovery. Int. J. Environ. Res. Public Health 2021, 18, 5571. [Google Scholar] [CrossRef]
- Zhang, G.; Zhang, H.; Zhang, C.; Zhang, G.; Yang, F.; Yuan, G.; Gao, F. Simultaneous nitrogen and carbon removal in a single chamber microbial fuel cell with a rotating biocathode. Process Biochem. 2013, 48, 893–900. [Google Scholar] [CrossRef]
- Gancarz, P.; Zorębski, E.; Dzida, M. Influence of experimental conditions on the electrochemical window. Case study on bis(trifluoromethylsulfonyl)imide-based ionic liquids. Electrochem. Commun. 2021, 130, 107107. [Google Scholar] [CrossRef]
- Tiago, G.A.O.; Matias, I.A.S.; Ribeiro, A.P.C.; Martins, L.M.D.R.S. Application of Ionic Liquids in Electrochemistry—Recent Advances. Molecules 2020, 25, 5812. [Google Scholar] [CrossRef]
- Ortiz-Martínez, V.M.; Ortiz, A.; Fernández-Stefanuto, V.; Tojo, E.; Colpaert, M.; Améduri, B.; Ortiz, I. Fuel cell electrolyte membranes based on copolymers of protic ionic liquid [HSO3-BVIm][TfO] with MMA and hPFSVE. Polymer 2021, 179, 121583. [Google Scholar] [CrossRef]
- Elhenawy, S.; Khraisheh, M.; AlMomani, F.; Al-Ghouti, M.; Hassan, M.K. From Waste to Watts: Updates on Key Applications of Microbial Fuel Cells in Wastewater Treatment and Energy Production. Sustainability 2022, 14, 955. [Google Scholar] [CrossRef]
- Clauwaert, P.; Rabaey, K.; Aelterman, P.; De Schamphelaire, L.; Pham, T.H.; Boeckx, P.; Boon, N.; Verstraete, W. Biological denitrification in microbial fuel cells. Environ. Sci. Technol. 2007, 41, 3354–3360. [Google Scholar] [CrossRef]
- Blázquez, E.; Gabriel, D.; Baeza, J.A.; Guisasola, A. Treatment of high-strength sulfate wastewater using an autotrophic biocathode in view of elemental sulfur recovery. Water Res. 2016, 105, 395–405. [Google Scholar] [CrossRef] [PubMed]
- Fang, C.; Min, B.; Angelidaki, I. Nitrate as an oxidant in the cathode chamber of a microbial fuel cell for both power generation and nutrient removal purposes. Appl. Biochem. Biotechnol. 2010, 164, 464–474. [Google Scholar] [CrossRef] [PubMed]
- Drewnowski, J.; Fernandez-Morales, F.J. Heterotrophic anodic denitrification in microbial fuel cells. Sustainability 2016, 8, 561. [Google Scholar] [CrossRef]
- Zhang, Y.; Xu, Q.; Huang, G.; Zhang, L.; Liu, Y. Effect of dissolved oxygen concentration on nitrogen removal and electricity generation in self pH-buffer microbial fuel cell. Int. J. Hydrogen Energy 2020, 45, 34099–34109. [Google Scholar] [CrossRef]
- Missoun, F.; de los Ríos, A.P.; Ortiz-Martínez, V.; Salar-García, M.J.; Hernández-Fernández, J.; Hernández-Fernández, F.J. Discovering Low Toxicity Ionic Liquids for Saccharomyces cerevisiae by Using the Agar Well Diffusion Test. Processes 2020, 8, 1163. [Google Scholar] [CrossRef]
- Kebaili, H.; Pérez de los Ríos, A.; Salar García, M.J.; Ortiz-Martínez, V.M.; Kameche, M.; Hernández-Fernández, J.; Hernández-Fernández, F.J. Evaluating the Toxicity of Ionic Liquids on Shewanella sp. for Designing Sustainable Bioprocesses. Front. Mater. 2020, 7, 578411. [Google Scholar] [CrossRef]
- Cong, H.N.; El Abbassi, K.; Chartier, P. Electrocatalysis of Oxygen Reduction on Polypyrrole/Mixed Valence Spinel Oxide Nanoparticles. J. Electrochem. Soc. 2002, 149, A525. [Google Scholar] [CrossRef]
- Ortiz-Martínez, V.M.; Salar-García, M.J.; Touati, K.; Hernández-Fernández, F.J.; de los Ríos, A.P.; Belhoucine, F.; Berrabbah, A.A. Assessment of spinel-type mixed valence Cu/Co and Ni/Co-based oxides for power production in single-chamber microbial fuel cells. Energy 2016, 113, 1241–1249. [Google Scholar] [CrossRef]
- Pujiastuti, S.; Onggo, H. Effect of various concentration of sulfuric acid for Nafion membrane activation on the performance of fuel cell. AIP Conf. Proc. 2016, 1711, 060006. [Google Scholar]
- Kiely, P.D.; Cusick, R.; Call, D.F.; Selembo, P.A.; Regan, J.M.; Logan, B.E. Anode microbial communities produced by changing from microbial fuel cell to microbial electrolysis cell operation using two different wastewaters. Bioresour. Technol. 2011, 102, 388–394. [Google Scholar] [CrossRef]
- Larrosa-Guerrero, A.; Scott, K.; Katuri, K.P.; Godinez, C.; Head, I.M.; Curtis, T. Open circuit versus closed circuit enrichment of anodic biofilms in MFC: Effect on performance and anodic communities. Appl. Microbiol. Biotechnol. 2010, 87, 1699–1713. [Google Scholar] [CrossRef] [PubMed]
- Angosto, J.M.; Fernández-López, J.A.; Godínez, C. Brewery and liquid manure wastewaters as potential feedstocks for microbial fuel cells: A performance study. Environ. Technol. 2015, 36, 68–78. [Google Scholar] [CrossRef] [PubMed]
- Hoang, A.T.; Nižetić, S.; Ng, K.H.; Papadopoulos, A.M.; Le, A.T.; Kumarf, S.; Hadiyanto, H.; Pham, V. Microbial fuel cells for bioelectricity production from waste as sustainable prospect of future energy sector. Chemosphere 2022, 287, 32285. [Google Scholar] [CrossRef] [PubMed]
- Yaqoob, A.A.; Khatoon, A.; Mohd Setapar, S.H.; Umar, K.; Parveen, T.; Mohamad Ibrahim, M.N.; Ahmad, A.; Rafatullah, M. Outlook on the Role of Microbial Fuel Cells in Remediation of Environmental Pollutants with Electricity Generation. Catalysts 2020, 10, 819. [Google Scholar] [CrossRef]
- Pandit, S.; Savla, N.; Sonawane, J.M.; Sani, A.M.; Gupta, P.K.; Mathuriya, A.S.; Rai, A.K.; Jadhav, D.A.; Jung, S.P.; Prasad, R. Agricultural Waste and Wastewater as Feedstock for Bioelectricity Generation Using Microbial Fuel Cells: Recent Advances. Fermentation 2021, 7, 169. [Google Scholar] [CrossRef]
- Yokoyama, H.; Ohmori, H.; Ishida, M.; Waki, M.; Tanaka, Y. Treatment of cow-waste slurry by a microbial fuel cell and the properties of the treated slurry as a liquid manure. Anim. Sci. J. 2006, 77, 634–638. [Google Scholar] [CrossRef]
- Larrosa, A.; Lozano, L.J.; Katuri, K.P.; Head, I.; Scott, K.; Godinez, C. On the repeatability and reproducibility of experimental two-chambered microbial fuel cells. Fuel 2009, 88, 1852–1857. [Google Scholar] [CrossRef]
- Tomás-Alonso, F.; Rubio, A.M.; Álvarez, R.; Ortuño, J.A. Dynamic Potential Response and SEM-EDX Studies of Polymeric Inclusion Membranes Based on Ionic Liquids. Int. J. Electrochem. Sci. 2013, 8, 4955–4969. [Google Scholar] [CrossRef]


| Full Name | Abbreviation | Structure | Water Miscibility | State at 25 °C | Radius of Inhibition (RI) (cm) |
|---|---|---|---|---|---|
| Methyltrioctylammonium chloride | [N8,8,8,1+][Cl−] |  | Insoluble | Liquid | 0.6 ± 0.2 [16] 3.0 ± 0.7 [17] |
| Tetrabutylphosphonium dibutyl phosphate | [P4,4,4,4+][Bu2Phos−] |  | Partially soluble | Liquid | 0.5 ± 0.1 [16] 0.9 ± 0.2 [17] |
| Methyltrioctylammonium bis(trifluoromethylsulfonyl)imide | [N8,8,8,1+][NTf2−] |  | Insoluble | Liquid | 0.0 [16] 1.2 ± 0.7 [17] |
| Trihexyl(tetradecyl)phosphonium bis 2,4,4-(trimethylpentyl)phosphinate | [P6,6,6,14+][TMPPhos−] | 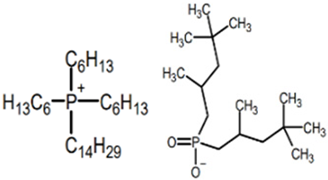 | Insoluble | Liquid | 0.5 ± 0.1 [16] 2.6 ± 0.1 [17] |
| Parameter | Initial Values (mg/L) | Nafion®/Pt (%) | [N8,8,8,1+][Cl−]/CuCo (%) | [P4,4,4,4+][Bu2Phos−]/CuCo (%) | [N8,8,8,1+][NTf2−]/CuCo (%) | [P6,6,6,14+][TMP-Phos−]/CuCo(%) |
|---|---|---|---|---|---|---|
| [COD] | 2286 ± 5.66 | 53.46 ± 3.47 | 35.33 ± 11.79 | 23.03 ± 21.16 | 38.83 ± 11.41 | 32.67 ± 3.45 |
| [NO2-N] | 0.104 ± 0.02 | 0 ± 12.05 | 10.57 ± 4.34 | 14.51 ± 12.48 | 6.89 ± 1.5 | 1.78 ± 5.73 |
| [NO3-N] | 5.25 ± 0.64 | 12.01 ± 9.54 | 26.64 ± 15.35 | 17.27 ± 2.09 | 14.64 ± 5.82 | 3.12 ± 4.42 |
| [NH4-N] | 622 ± 24.04 | 2.6 ± 2.51 | 0 ± 2.01 | 2.79 ± 5.35 | 0 ± 1.93 | 0 ± 6.65 |
| [NT] | 680 ± 14.14 | 9.51 ± 5 | 3.64 ± 3.04 | 5.8 ± 8.2 | 2.13 ± 7.23 | 0.75 ± 1.06 |
| [Norganic] | 52.65 ± 10.56 | 96.68 ± 56.5 | 70.03 ± 32.71 | 45.26 ± 52.03 | 69.96 ± 86.96 | 15.59 ± 87.82 |
| PEM-Catalyst Assembly -Carbon Cloth | |||
|---|---|---|---|
| Peak Element | Atomic % A | Atomic % B | Atomic % C |
| C K | 87.16 | 65.8 | 76.21 |
| N K | - | - | - |
| O K | - | 22.69 | 3.17 |
| Cl K | 13.29 | 11.02 | 20.82 |
| Ca K | - | 8.09 | - |
| Co K | 0.22 | 0.15 | 0.79 |
| Cu K | 0.10 | - | 0.15 |
| Pt M | 0.37 | 0.68 | 0.70 |
Disclaimer/Publisher’s Note: The statements, opinions and data contained in all publications are solely those of the individual author(s) and contributor(s) and not of MDPI and/or the editor(s). MDPI and/or the editor(s) disclaim responsibility for any injury to people or property resulting from any ideas, methods, instructions or products referred to in the content. |
© 2023 by the authors. Licensee MDPI, Basel, Switzerland. This article is an open access article distributed under the terms and conditions of the Creative Commons Attribution (CC BY) license (https://creativecommons.org/licenses/by/4.0/).
Share and Cite
Hernández-Fernández, A.; Iniesta-López, E.; Garrido, Y.; Ieropoulos, I.A.; Hernández-Fernández, F.J. Microbial Fuel Cell Using a Novel Ionic-Liquid-Type Membrane-Cathode Assembly with Heterotrophic Anodic Denitrification for Slurry Treatment. Sustainability 2023, 15, 14817. https://doi.org/10.3390/su152014817
Hernández-Fernández A, Iniesta-López E, Garrido Y, Ieropoulos IA, Hernández-Fernández FJ. Microbial Fuel Cell Using a Novel Ionic-Liquid-Type Membrane-Cathode Assembly with Heterotrophic Anodic Denitrification for Slurry Treatment. Sustainability. 2023; 15(20):14817. https://doi.org/10.3390/su152014817
Chicago/Turabian StyleHernández-Fernández, Adrián, Eduardo Iniesta-López, Yolanda Garrido, Ioannis A. Ieropoulos, and Francisco J. Hernández-Fernández. 2023. "Microbial Fuel Cell Using a Novel Ionic-Liquid-Type Membrane-Cathode Assembly with Heterotrophic Anodic Denitrification for Slurry Treatment" Sustainability 15, no. 20: 14817. https://doi.org/10.3390/su152014817
APA StyleHernández-Fernández, A., Iniesta-López, E., Garrido, Y., Ieropoulos, I. A., & Hernández-Fernández, F. J. (2023). Microbial Fuel Cell Using a Novel Ionic-Liquid-Type Membrane-Cathode Assembly with Heterotrophic Anodic Denitrification for Slurry Treatment. Sustainability, 15(20), 14817. https://doi.org/10.3390/su152014817