1. Introduction
Hong Kong represents a gateway between Mainland China and the rest of the world. However, as Shanghai and Shenzhen grow in size and importance, certain natural effects related to the geography of finance may militate for Hong Kong’s continuing important role in serving as the main financial hub, providing resources to China’s new sectors—such as its solar (photovoltaic) industry. A “California effect” likely determines the importance of a financial center [
1]. In this optimistic view of the geography of finance, a financial center needs to locate not too close and not too far from the productive sectors and activities it finances. In this view, Hong Kong should continue to play a pivotal role in financing China’s mostly Shanghai-based solar industry, given its middling distance from the solar industries its financial services firms serve. While we do observe such forces, other forces are making centers such as Chicago more important hubs of Chinese solar industry finance than Hong Kong. Why?
In this paper, we argue that the purported “California effect” often found in the literature does not hold up when we consider the way that financial services firms intermediate or disintermediate the value chains of the client companies they provide finance for. Our original research shows how financial centers can exist thousands of miles—or literally half a world way—from their clients if they develop competencies that let them opportunistically seize market opportunities in what we call sunrise industries (a pun to the solar industry we focus on in this paper). Such a competencies-based approach to understanding the geography of finance helps us understand why certain places emerge as (international) financial centers, and others do not. As financial firms actively seek to penetrate new markets, their collective action can make their urban centers hotbeds of novel finance. The picture, thus, is far more nuanced than any “California effect” might lead us to believe.
We organize the paper as follows: The first section provides the reader with an overview of China’s solar industry and its place in the world. We show the importance of China’s solar industry relative to other countries—and describe the size of financing flows needed to fully fund Chinese solar industry activity. The second section describes the Chinese solar companies’ value chains—so readers can follow our subsequent argument (that financiers develop competencies they need to intermediate or disintermediate these value chains in a way to earn profits). The third section describes the way that finance fits into these value chains. Financial intermediaries sit at various parts of the chain—specializing in providing unique types of finance appropriate for that specific part of the value chain. We also show the size of the financial flows needed to fund these solar companies—as a rough “market size” for Hong Kong–based (and other cities’) financial services firms. Having presented this rather lengthy background,
Section 4 describes the way that Chinese solar (photovoltaic) firms locate the geography and location of the financial intermediaries they choose. We discuss the predictions around the location of these financial services firms given in the literature—and outline the problems with well-established theories of financial firm (and international financial center) location. We show how US (and other) rivals have taken business, which most analysts might predict should go to Hong Kong–based banks and broker-dealers. The fifth section places the solar industry—and the finance of that industry—in a regional context. We show how Hong Kong firms might recapture a prime position in financing solar industry investment if they develop competencies aimed at serving the wider Asian electricity/energy market. We show how financial firms in an international financial center intermediate supply and demand for funds needed for solar-based electricity production and consumption. These firms’ role in this intermediation determines their competitiveness far more than any purported California effect.
We should flag several caveats before we begin. First, we do not follow the usual format of providing the literature review first, and then running regressions to test hypotheses from that literature. Instead, we use our scarce space to describe in detail the way the solar (photovoltaic) industry works and the way its financiers react to these companies’ needs. As such, we only address the literature in the third section—after fully describing the industry we analyze in this paper. Second, we provide mostly qualitative data to develop the nuanced view of the way financial firms in international financial centers locate and compete for solar industry business. While not denying the importance of quantitative methods, we think these tools illuminate our discussion far more than regression or econometric analysis. Finally, we state in several places that our results from the finance of China’s solar industry tell us something about the geography of finance and the location of international financial centers in general. Of course, we have not tested this assertion in other places and industries. We hope our study will provide the motivation for future scholars to conduct these broader and more comprehensive studies.
2. The Distribution of Solar Power Production in China and the World
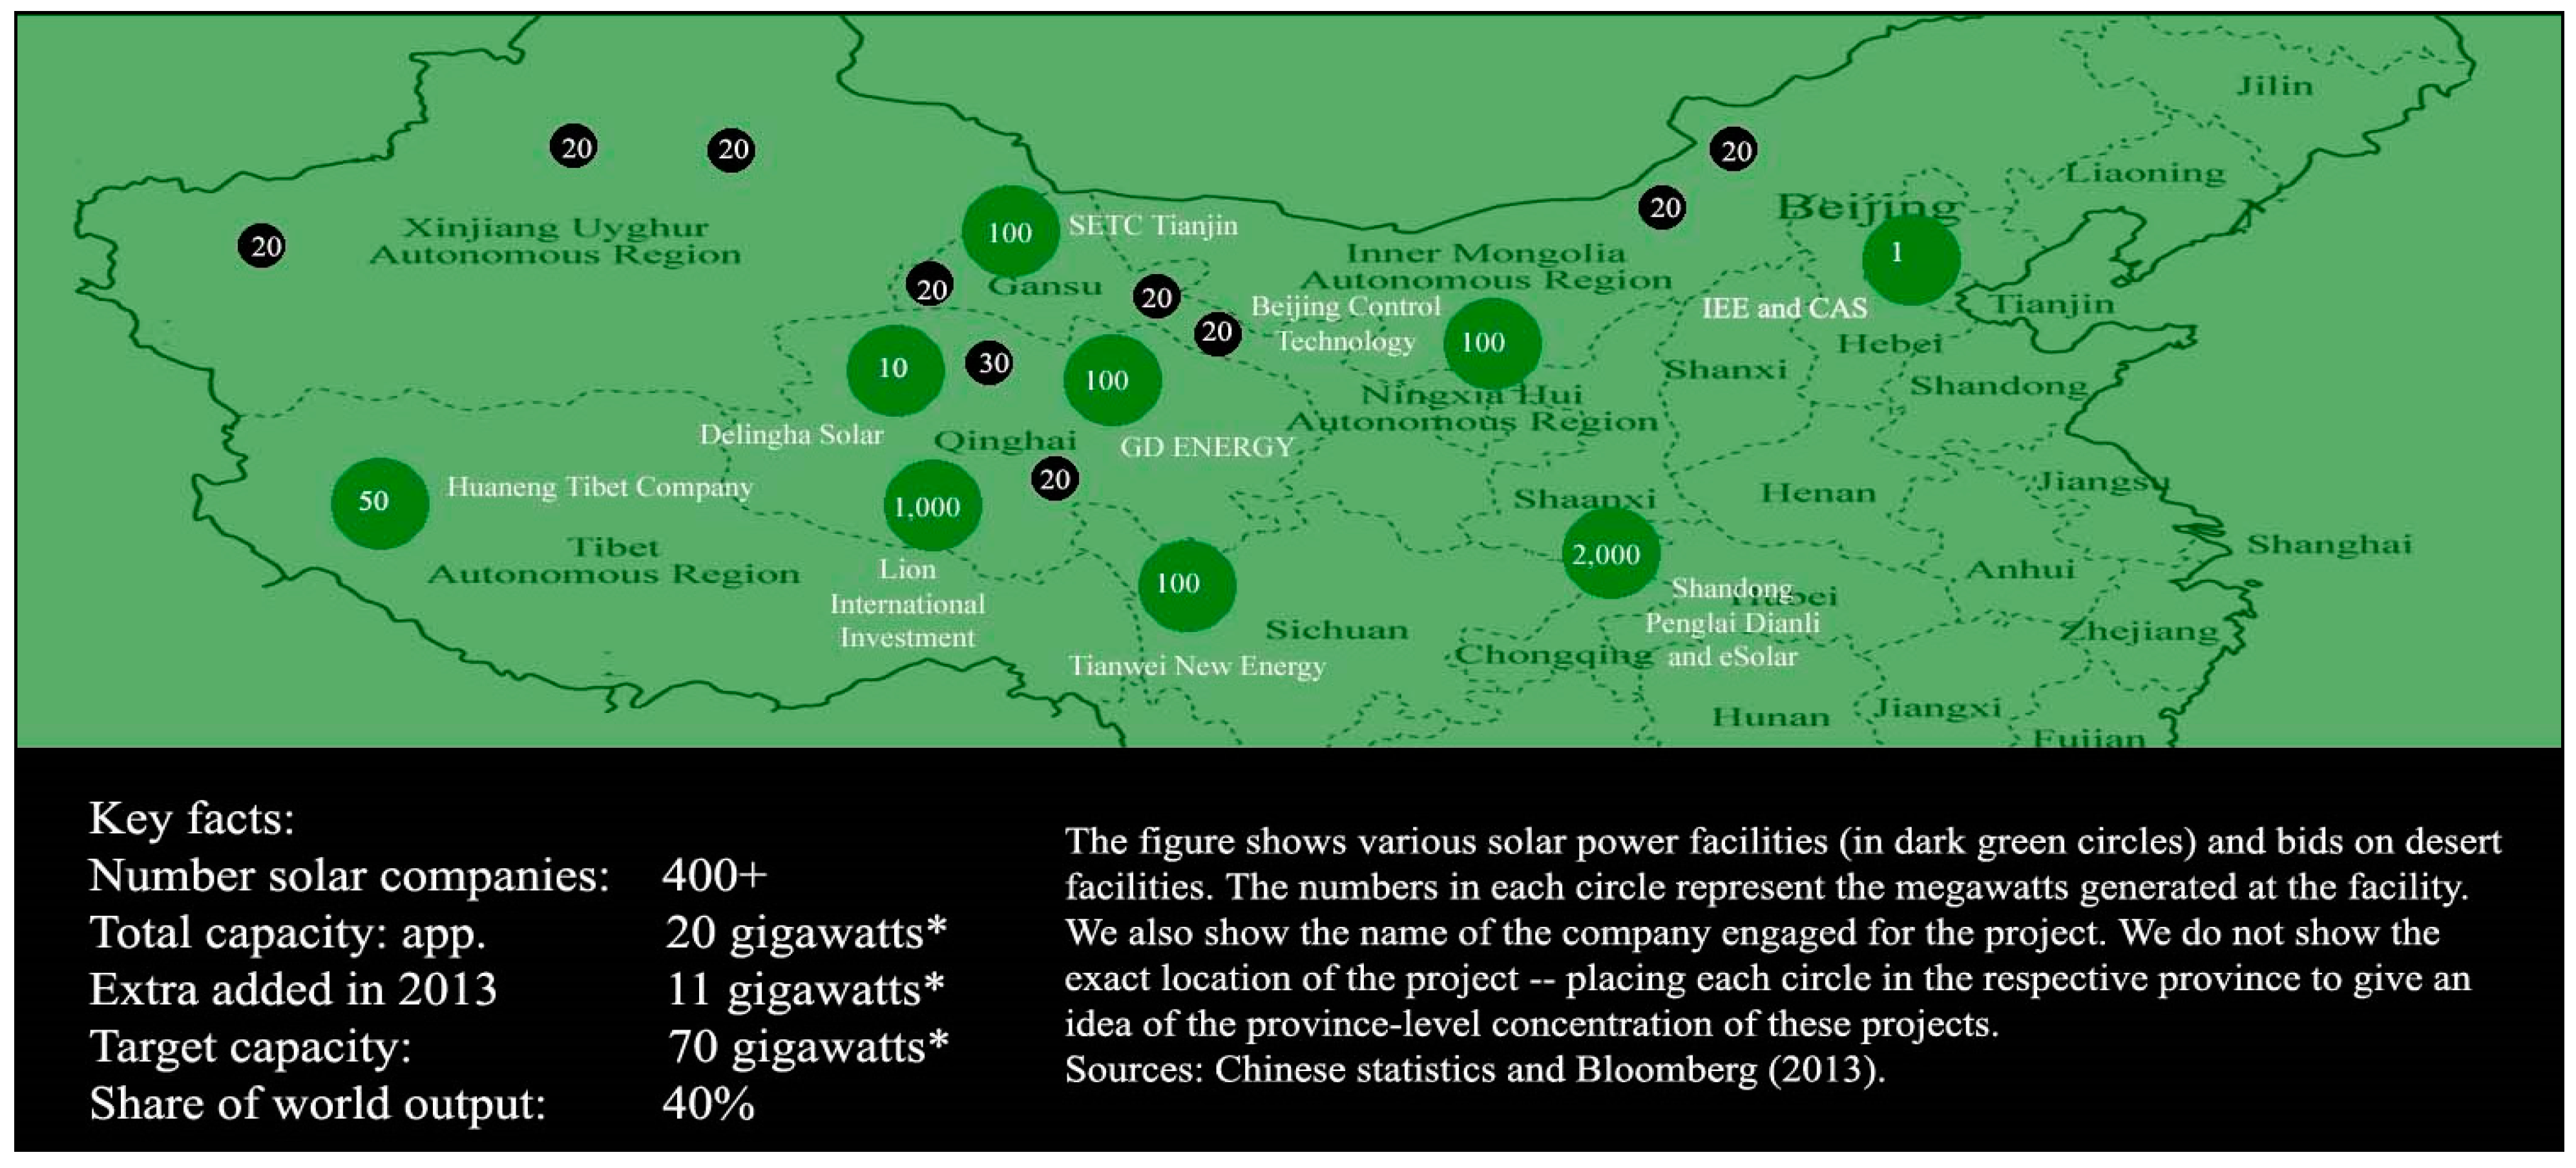
China represents one of the world’s largest solar energy markets—potentially providing a revenue-generating bonanza for potential investors. Estimates of current solar (photovoltaic) production on the Mainland place the value of China’s solar industry at about EUR 37 billion—representing roughly 40% of the world’s solar panel production [
2]. Geometrically extrapolating China’s photovoltaic sector production at current growth rates leads to market sizes of at least EUR 100 billion by 2017. China’s 12th Five Year Plan backs up these extrapolations, planning for large increases in the production and consumption of solar power [
3].
Based on these sources,
Figure 1 shows several major solar projects on the Mainland—and key facts about installed and marginally added capacity [
4]. Unsurprisingly, much of this capacity has been brought online in the Western regions—far from China’s traditional financial centers (such as Beijing, Shanghai, and Hong Kong). Provinces such as Xinjiang and Inner Mongolia have the largest amount of sunshine (as measured by megajoules per meter squared of solar panel surface). These also represent China’s least financially developed regions. As such, China had to rely on financial centers to agglomerate and channel financial capital (money) for solar-related tastes in these regions (and technologies going to these regions) [
5,
6].
The distribution of such capacity may have changed over the years. The epic changes in trade, finance, and energy flows across the world would certainly have affected the levels of these flows. However, similar stresses impacted this global market throughout the past 20 or so years. The “heart” of our analysis, thus, does not change since these data were collected around 2010. Intuitions in the social sciences tend to be eternal or not. Even future scientists proving us wrong with future data (uncorrupted by a new Chinese real estate development plan boom, COVID-19, and the massive reorbiting of the price vector—across the economy—from steel to installers’ hourly wages) would provide just as useful a result.
Chinese solar production represents a large and growing piece of a global industry.
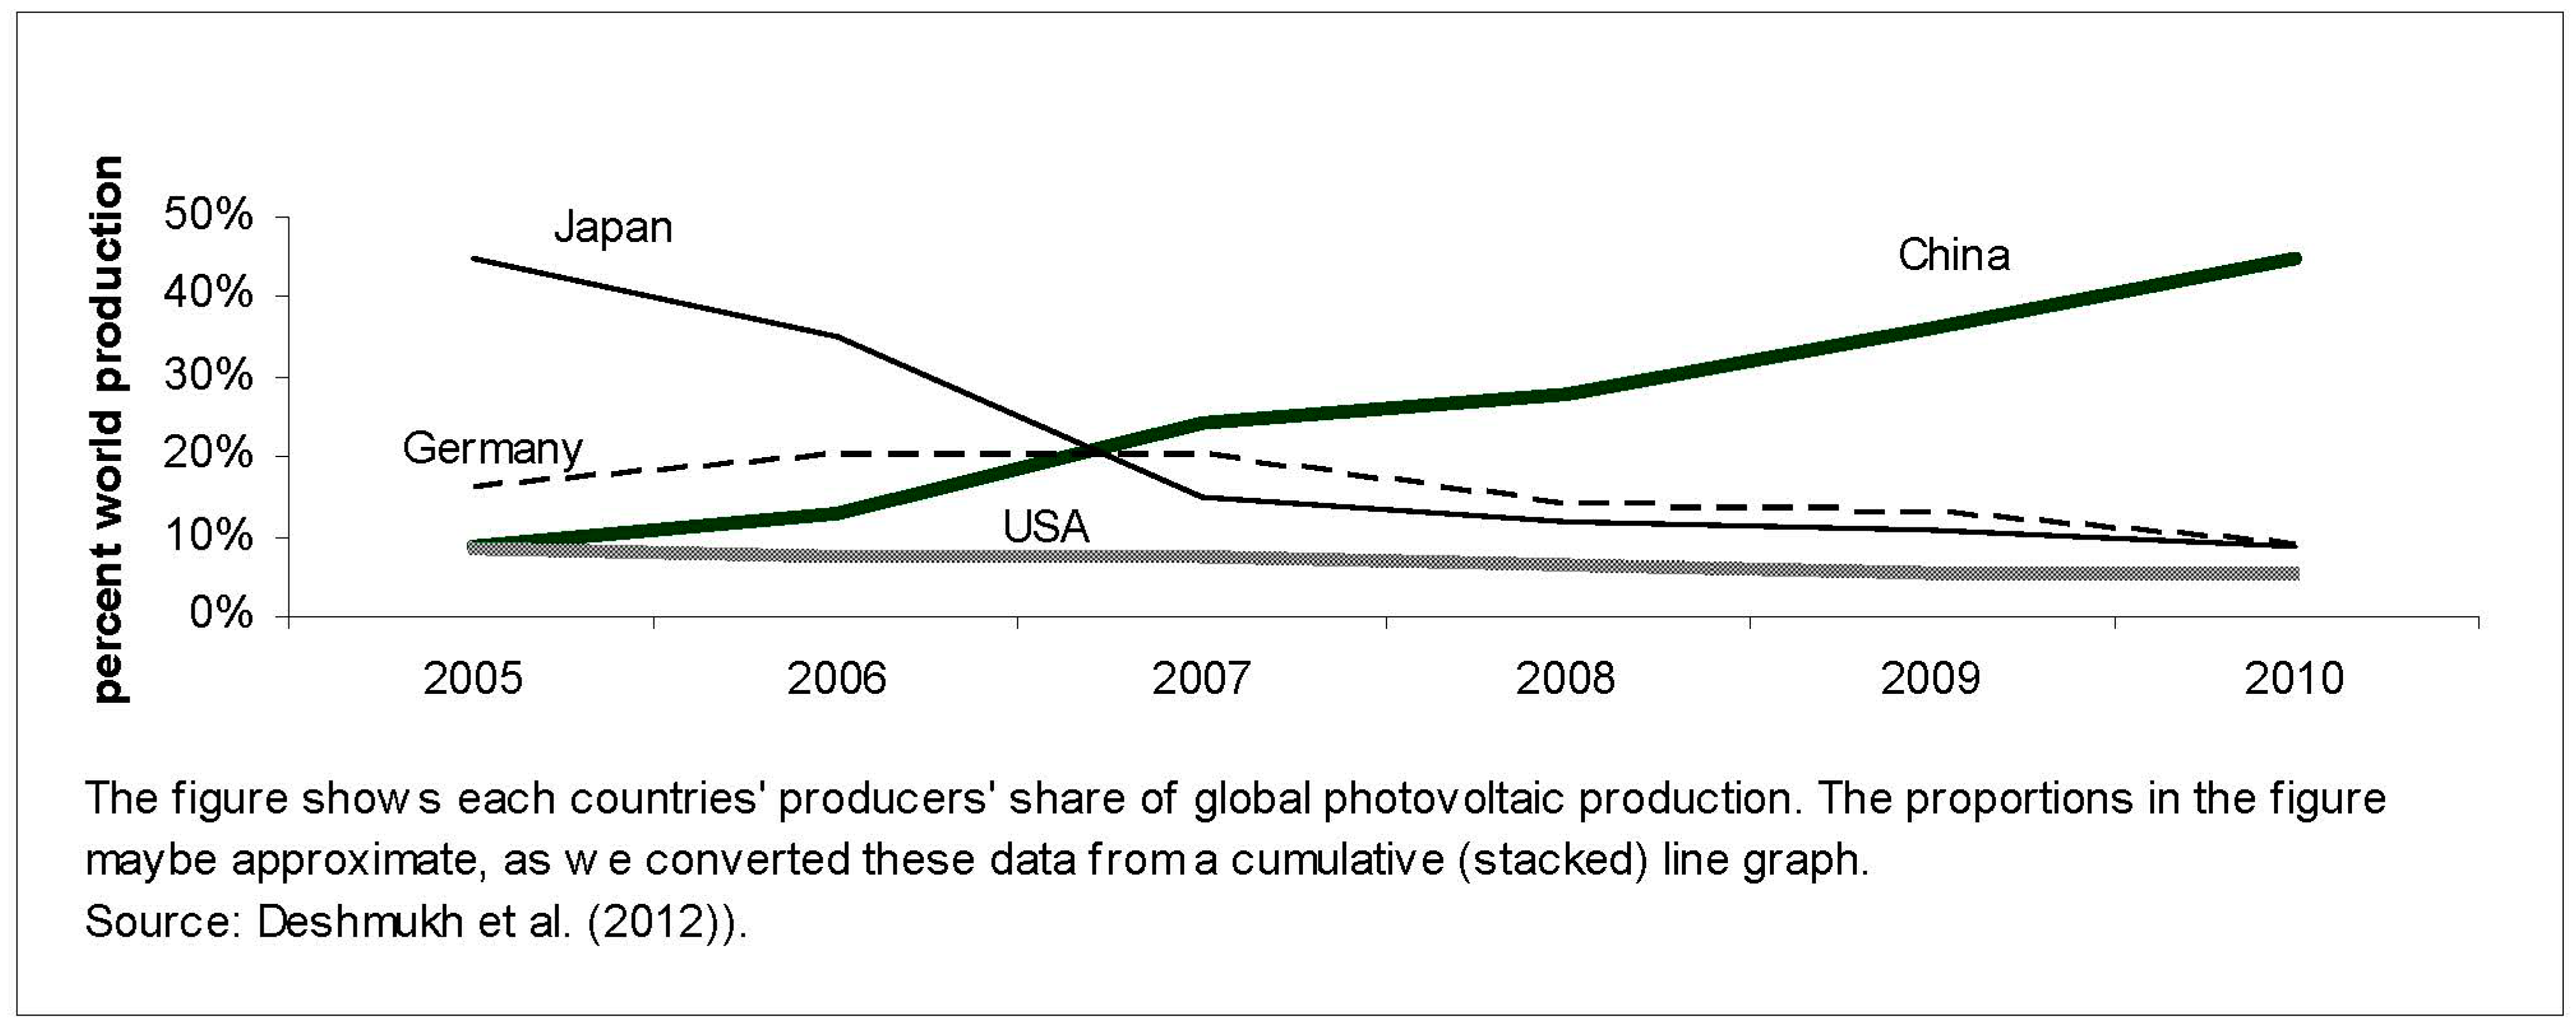
As shown in
Figure 2, the Mainland solar production capacity rose to about 40% of global photovoltaic cell production in 2012 [
7]. Such market share has come at the expense mostly of German and Japanese producers. Roughly 31 gigawatts of solar power came online in 2012—from solar panels using a variety of technologies to convert solar energy into electricity. These data suggest little change in relative ranking between countries since 2010. China has taken over the market by 2010. None of the other countries’ resource allocations could possibly have changed the figures in
Figure 2. Updating these figures to 2023 values would not change very much relative world production, as the “heart” driving photovoltaics globally has not changed much.
Figure 3 shows the major technologies used and Chinese producers’ share of global production in the niches where its solar companies have a revealed comparative advantage [
8,
9]. The US has a clear advantage in polysilicon—with 34% of global production. The names of firms may change, but the relative geographical location of investment and remained constant after 2010. For example, Hanenergy and Trony Solar have both experienced setbacks as individual firms since 2022. Each stratum of production may have seen different players (such as Trony Solar in its niche or Yinli in its stratum) get bigger and smaller since 11. Note that the post-2011 data would suggest the intuitions developed in this article, and the previous literature has become undisprovable. The Pacific Asia region (excluding China) produces 62% of the world’s TF modules. China exercises a dominant market position in three technologies—wafers, C–Si cells, and modules. Mainland companies such as LDK Solar (which make polysilicon) may not have a global advantage (compared with the US). However, JA Solar (a global leader in the industry) does [
6]. Such production levels suggest that Chinese solar companies will have large financing needs into the foreseeable future.
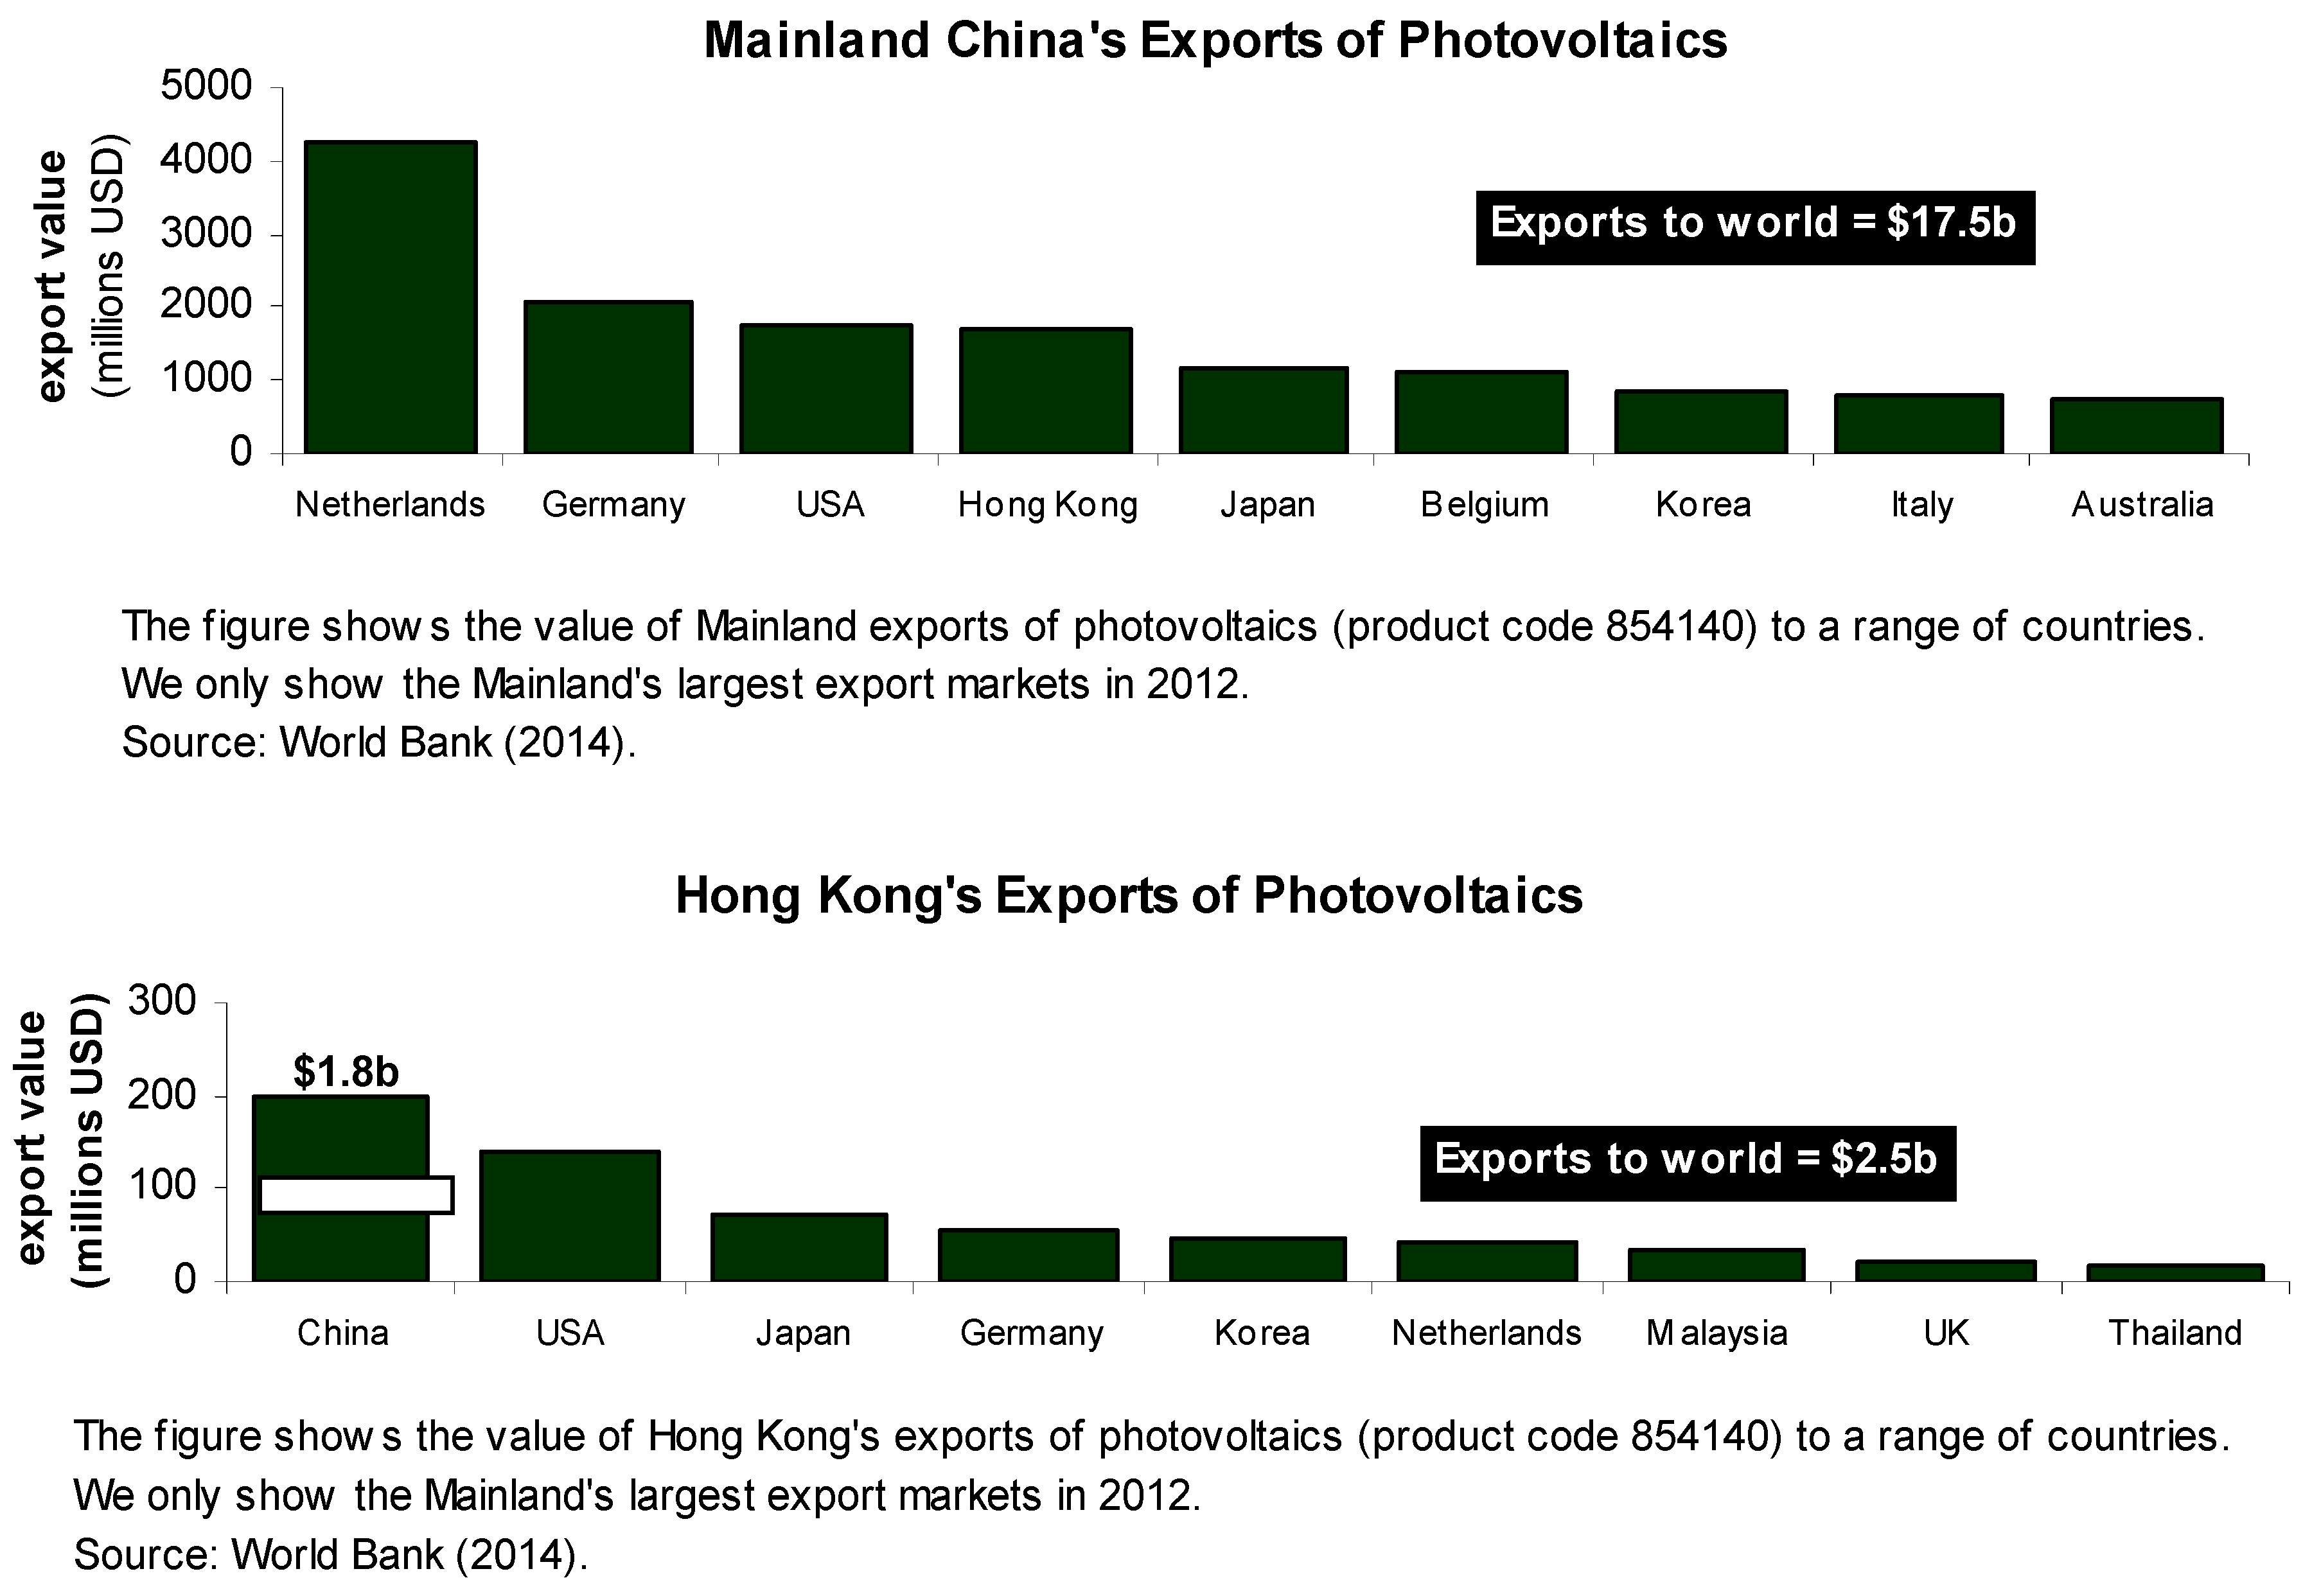
The Mainland’s structure of solar panel exports also reveals several things about future expected national and international financial flows tied to solar consumption and production.
Figure 4 shows China’s main solar panel export markets (on the top panel) and Hong Kong’s (on the bottom panel). First, the Dutch, Germans, and Americans receive a large relative amount of solar cell imports from China. These flows suggest relatively constrained domestic solar cell production runs (at least compared with a world in which China does not export such large volumes and values of solar cells). Several studies such as Burr show that reductions in Chinese imports would likely constrain domestic solar consumption in places such as the US. Specifically, a 25% tariff on Chinese solar imports chokes off supply and reduces US consumption by 30% [
10].
These competencies took decades to build and do not ‘turn on a dime’. Thus, the 2014 data illustrating the relevant rank of these values still hold true in the 2021 data—and beyond. The value of exports has gone up and down. Plotting these recent data—from roughly 2014 to present—would only confuse the message. For example, seeing supply disruptions, producers would have already started reallocating resources back in 2018. Upon seeing COVID-19 data, production values may have fluctuated wildly as producers tried to adjust. However, none of these fluctuations could possibly be attributable to changes in the tastes and tastes for photovoltaic technologies. Even if we observe massive changes in the ranking of photocell investment in absolute and relative terms since 2012, the massive changes tell us little about the changes in Hong Kong (as a full trade model would need to speculate about these outcomes). We aim to present a theory—to confront with data—and build intuitions in our readers. We do not try to develop a computable model that would present supply and demand in an global economic sector since 2012. Trying to use updated data to build completely new models of the world is as erroneous as the famous Lord Kelvin claim that physicists had only to calculate a few minor extra digits in their maths before being able to understand all physics—right before the quantum revolution was discovered.
What does this mean for a smaller jurisdiction such as Hong Kong? A jurisdiction with feet in the markets that create these new technologies? Jurisdictions that help securitize the corporate entities while bringing these technologies to the market? Facilitate the funding of these technologies, often in competition with other financial centers? Often in cooperative competition with other industry groups (such as the Sandhill Group in Silicon Valley)? What do the trends above show about the way a financial center such as Hong Kong helps attract investment into these new technologies? Does the investment and production of photovoltaic-related securities law in China’s neighborhood (Hong Kong) provide China’s markets with the sustainable competitive advantage that Michael Porter never would have found in the Italian shoe sector—no matter how much recent data he used?
His book—The Competitive Advantage of Nations—would have remained obscure without his focus on his obsessive attempt to trade off the length that financial channels must have developed into in the 1900s to fund the new garment and shoe industries with uncopiable shoe sectors. If the California effect we discuss in this paper transcends one of the 10 data points, our analysis points to a question that is almost a decade long in finance and sustainability.
Our paper looks at the extent of whether Hong Hong’s financial law and services as a financial center would have helped or help China’s and Asia’s nascent photovoltaic. Hong Kong certainly did not come out of nowhere. Even looking at
Figure 4, Hong Kong possesses a solar industry of its own sufficient integratedness with the Mainland to provide a platform for solar-industry-related finance. Any cluster of financial institutions specializing in solar-industry-related finance should draw on (and have local access to) individuals with specific knowledge in the field. The figure shows that Hong Kong clearly has a relatively large “touch” to the solar panel industry—be it indigenous or merely as a re-export market. The Mainland serves as Hong Kong’s largest photovoltaic trading partner; its other markets (the US and Japan) represent a tiny fraction of these exports. Hong Kong has not developed any large and sustainable solar market of its own that is worth financing. Few opportunities exist to develop trade finance and other services for solar trade with other countries. Such numbers indicate that financial services aimed at sunrise industries such as solar energy must be targeted abroad (and particularly at China). Hong Kong can bring in the money—but not actually build out these sunrise sectors.
This pattern of development provides Hong Kong investors with potential opportunities. First, the Chinese Ministry of Science and Technology and other state-affiliated parties cannot provide enough finance to meet all of the production and distribution needs. Solar energy currently makes up less than 5% of all of China’s electricity production [
12]. In order to achieve the government’s pollution reduction, energy security, and other policies, solar energy investments will need to increase by at least another EUR 40 billion [
13]. If government financing enabled the first wave of solar energy generation on the Mainland, private sector investment must enable future waves [
14]. Second, the State-Owned Assets Supervision and Administration Commission will most likely eventually sell shares in China’s state-owned solar companies, and even possibly the state power companies that distribute their power [
15].
Many publicly traded Chinese entities (both state owned and completely privately owned) started as nontraded state-owned companies [
16]. Hong Kong investors will likely profit as privatization spreads to China’s state-owned solar companies and its grid power providers [
17,
18]. Third, Hong Kong provides a potential beachhead for further investment on the Mainland. CLP Holdings—a Hong Kong power company—has investments on the Mainland and a market capitalization of over HKD 160 billion. Three of the five major Chinese power companies have subsidiaries listed on the Hong Kong Stock Exchange. China Power International Development, Huadian Power International Corporation, and Datang International Power Generation Company have Hong Kong listings. They represent independent power-producing subsidiaries of larger nontraded state-owned enterprises. Hong Kong companies such as CLP could provide useful partners and investors in China’s lumbering solar giants. CLP, as an investment for foreign investors such as US and EU funds, thus provides a potential conduit for further investment in Mainland solar.
3. Geographic Specialization across Solar Value Chains
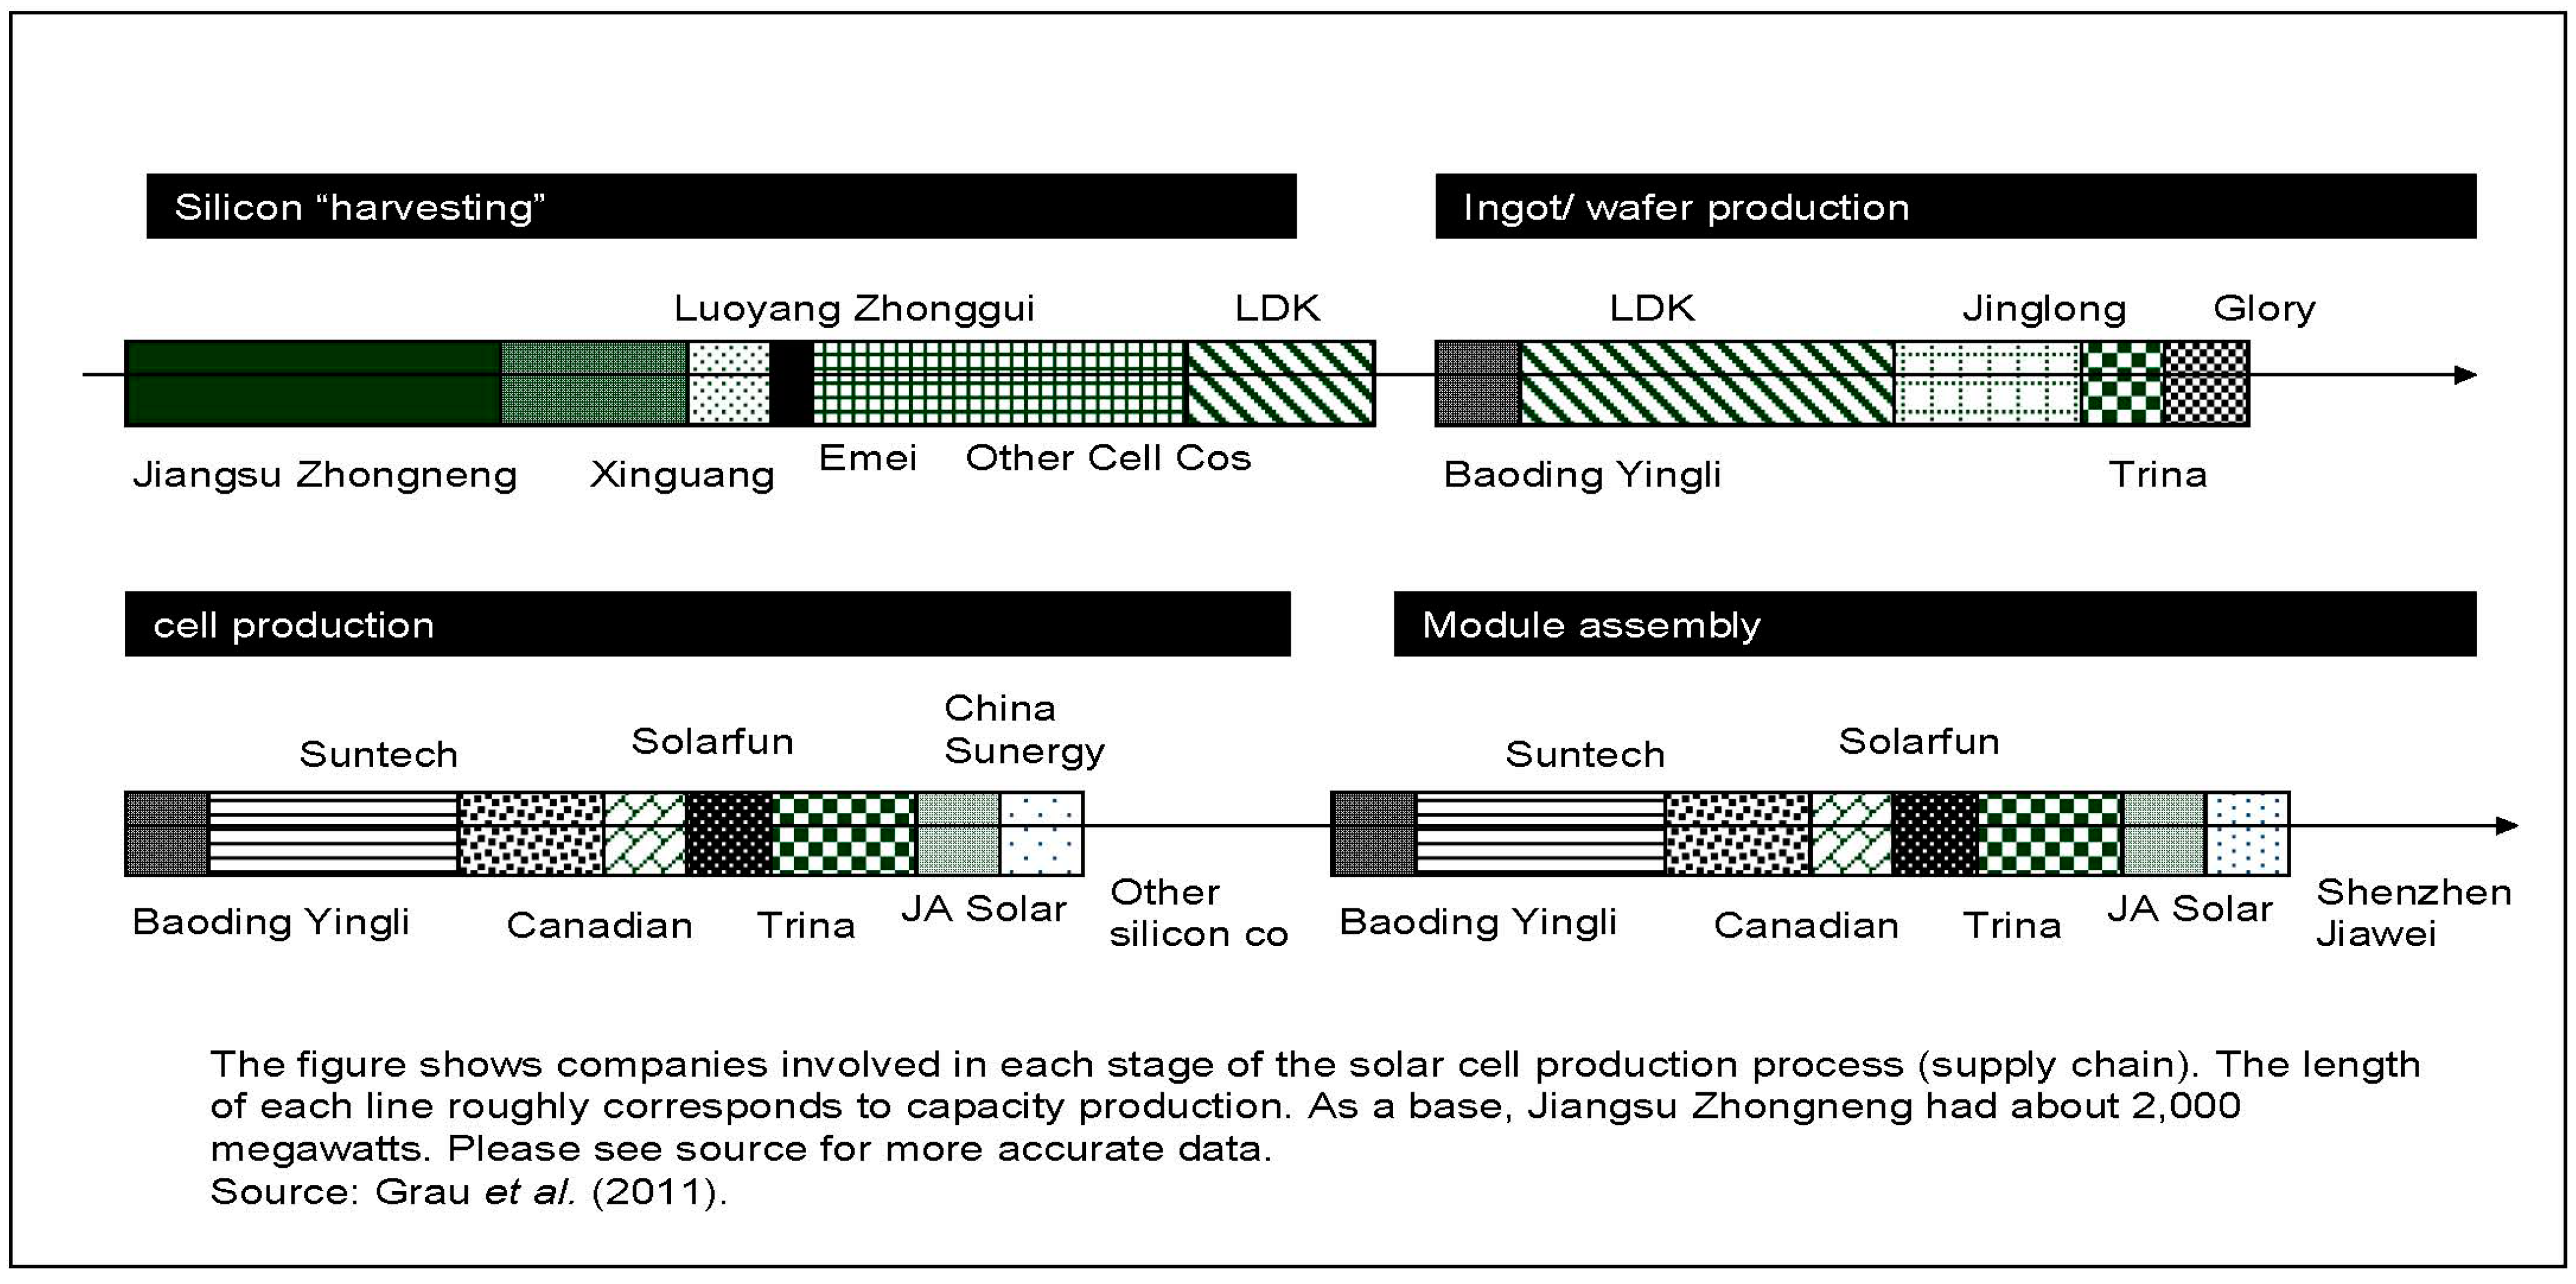
The photovoltaic industry consists of a range of subsectors with their own production and financing needs.
Figure 5 shows the various companies that contribute megawatts to each major part of the solar panel supply chain [
19]. This schema represents the broadest generalization of the inputs into solar panel production described better by other authors [
20]. Generally speaking, the production of solar panels requires four major value chain segments—silicon harvesting, the creation of silicon ingots and wafers, the creation of solar cells into modules, and the assembly of modules into electricity-producing units [
14]. In China, silicon harvesting tends to involve a different set of companies than in the other parts of the supply chain. Potential investors in each segment of the supply chain have a range of companies to choose from. Investors interested in across-chain exposure might focus on Baoding and Trina. Investors interested in niche suppliers might focus on companies such as Xinguang. Many of these companies do not trade on public exchanges—making private placement and asset securitization investments the only ways of getting exposure to these companies. Concentrated competencies will need to be developed in an international financial center to assess and price these investments. As noted previously, the relative allocation of market segments among individual players constitutes a far less important feature understanding the dynamics that the sunrise industry relies upon and the role of the California effect in deciding how the international allocation of portfolio investment transfers to these sunrise companies.
As many analysts have already pointed out, China’s solar industry requires consolidation.
Table 1 shows the number of companies and employment in the major segments of China’s photovoltaic supply chain. The specific company names might change over the years. However, the overall structure—and the ideas that drive the evolution of a “sunrise industry”—should remain stable for decades. A large range of producers and suppliers occupy each segment of the supply chain—suggesting the need for consolidation [
21]. The Chinese photovoltaic industry employs easily over 6000 workers—with many of these in “bloated” cells and ingots–wafers segments [
22]. Dropping prices and increasing debt burdens have represented clear signals of such a bloat. However, at the time of this writing, many analysts already believed much that the industry shake-up had already occurred [
23].
The development of Hong Kong as a solar industry financial center can help alleviate these problems in three ways. First, Hong Kong’s “better” M & A regulations could provide a forum for richer and prosperous firms to acquire failing firms. Many commentators such as [
24] have argued that the Chinese government plans to deal with the problem of over = capacity (and too many companies competing) by letting companies fail. By listing in Hong Kong and using its internationally savvy financial institutions, many of these companies could merge, offer themselves for purchase, and/or sell their assets
and liabilities. Credit and subsidies given to Mainland solar firms top USD 70 billion in recent years [
4]. Reselling some of the noncollectible debt at a discount would help reduce the impact on China’s already-debt-burden budgets and possibly even allow for the continuation of economically viable but highly indebted Mainland photovoltaic firms.
Second, Hong Kong provides a ready-to-use English language financial media ready to provide coverage and analysis of these companies—including a very active presence by
Bloomberg and
Reuters. Widespread and in-depth reporting of publicly traded companies might encourage solar company management to take more profitable pricing, debt load, and other decisions. Third, only a deep and sophisticated financial center can trade the complex structured and asset-backed securities the solar industry likely needs to use to develop—such as solar insurance products [
25]. As we describe later, Hong Kong provides the best venue for developing specialized financial services for the companies occupying each segment of China’s solar supply chain.
4. Solar Power Financing Segments and the Varieties of Solar Securitization
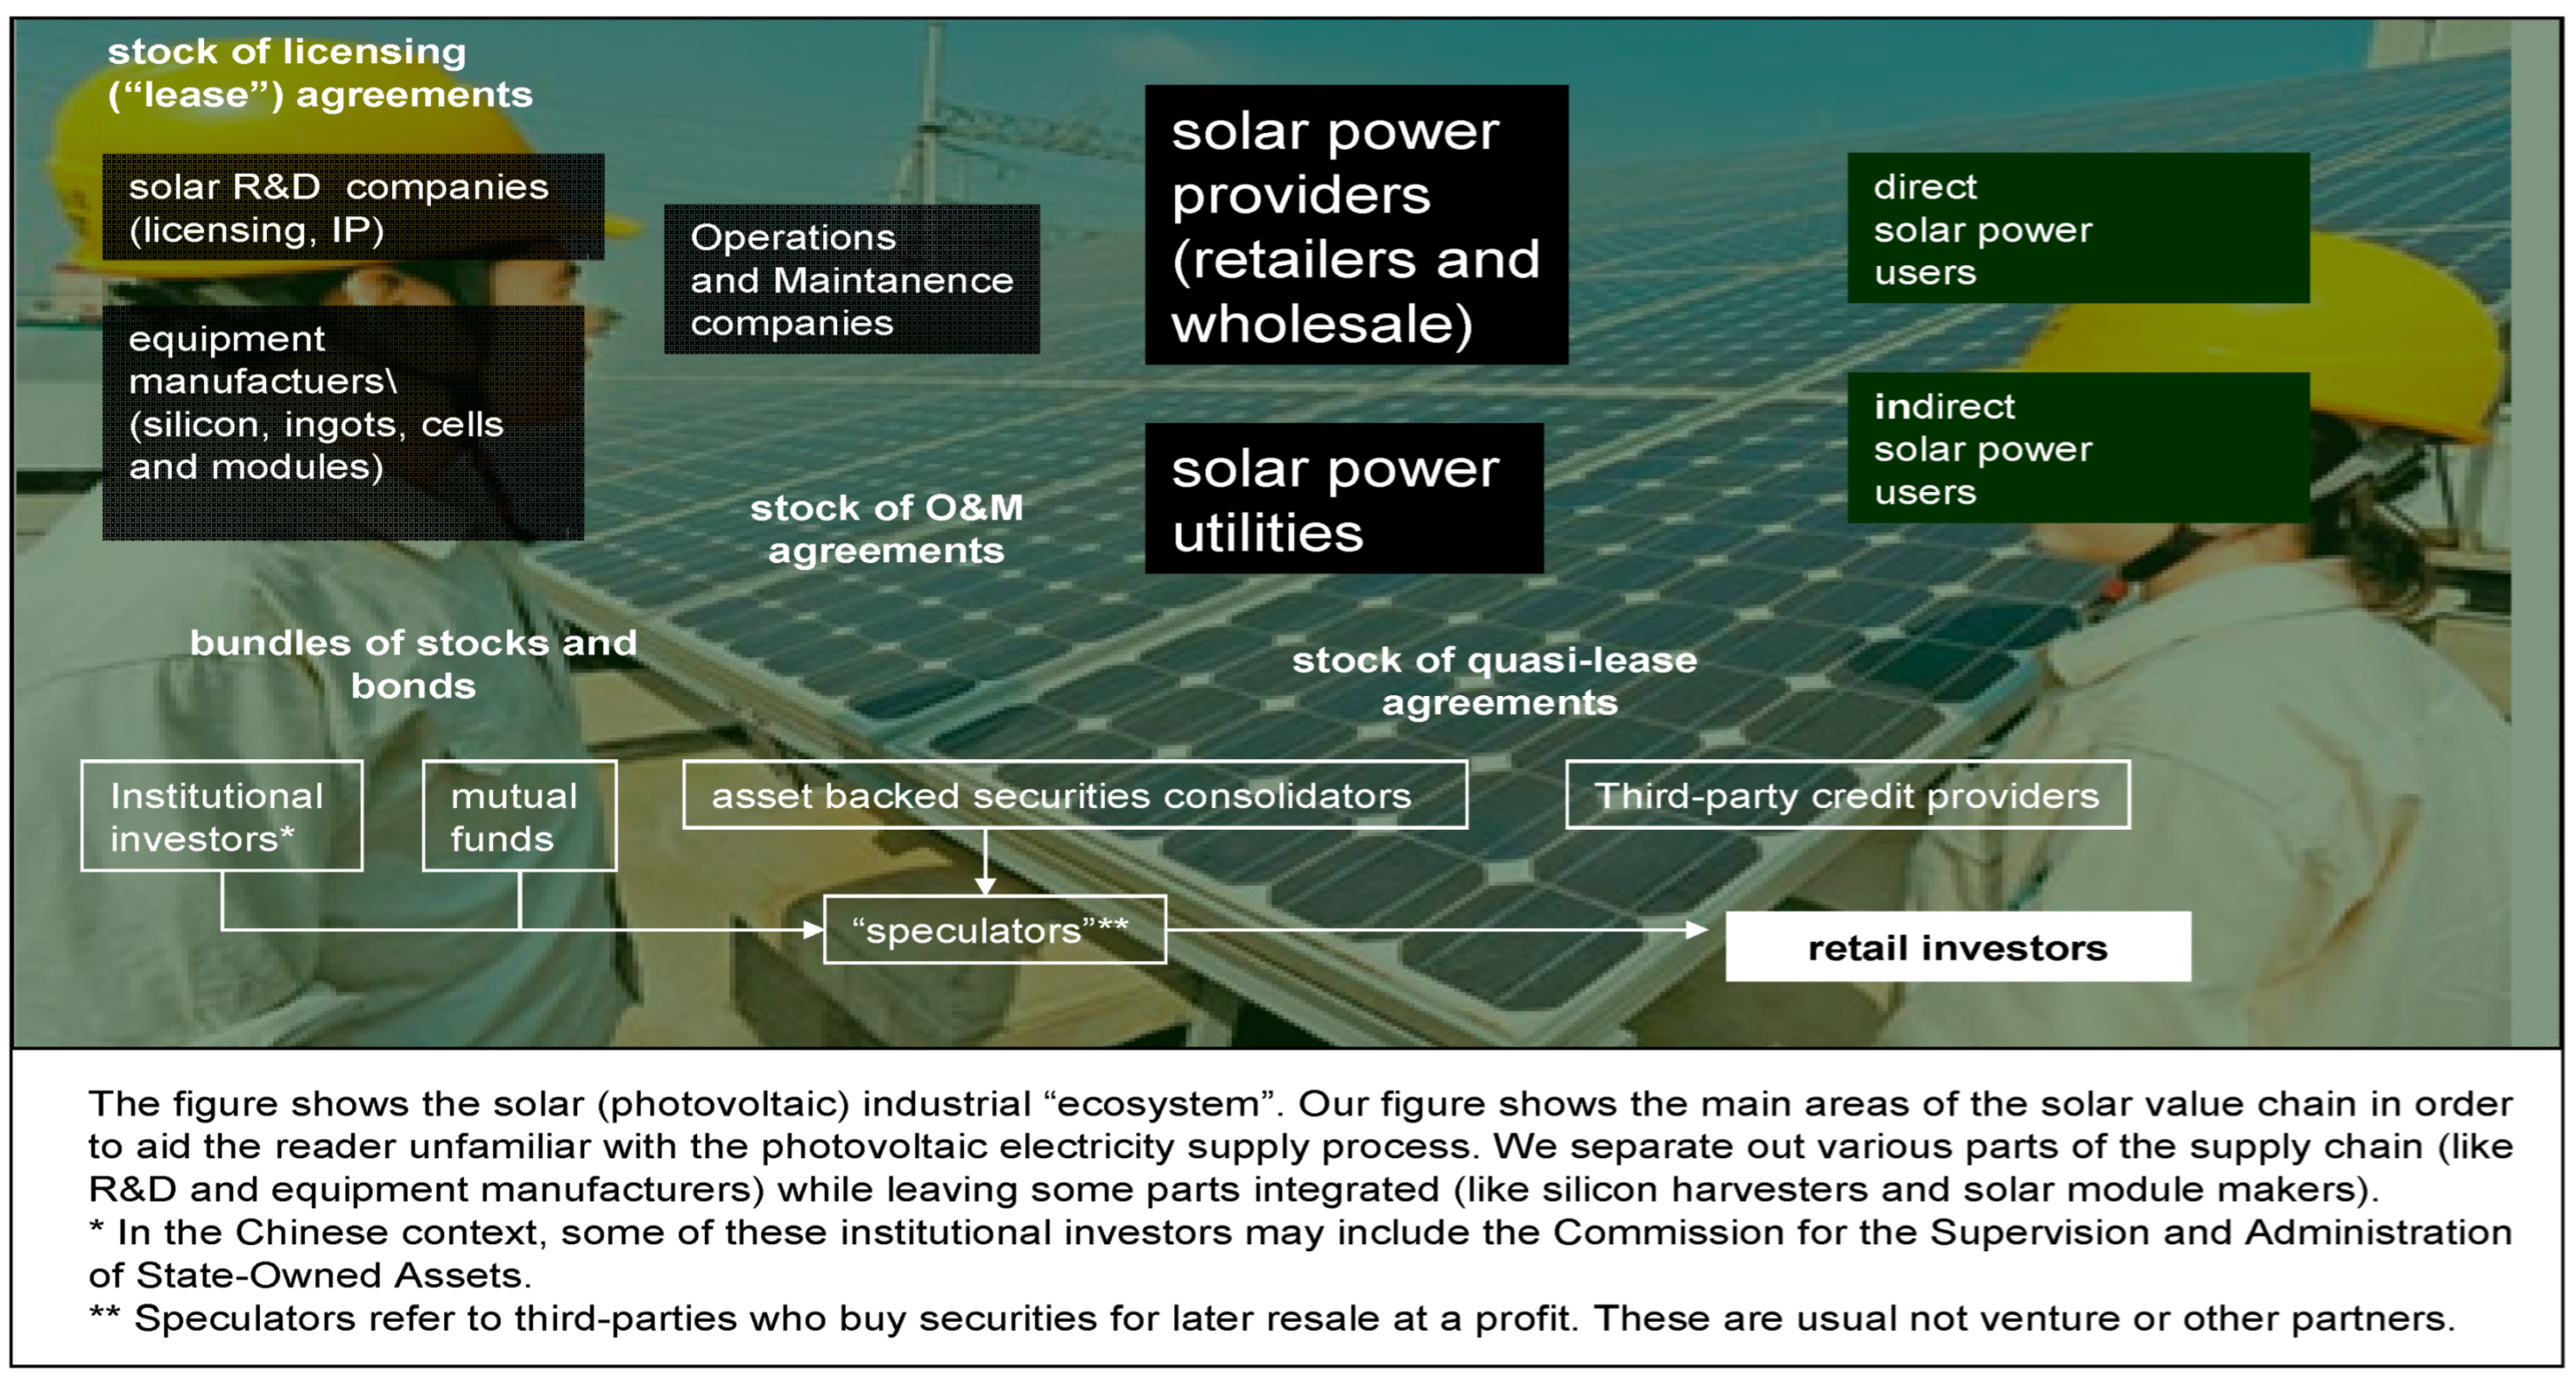
The photovoltaic market consists of a range of suppliers, producers, intermediaries, and complementary service providers that bring solar energy to final business and residential consumers.
Figure 6 shows a partial
value chain (more like an ecosystem) that would require financing from Hong Kong’s financial institutions—both in China and potentially in other jurisdictions [
26,
27]. These value chains will have remained stable since we put this scheme together—given the incipient (and thus slow moving) nature of this industry’s structural development. The major segments include the R & D companies that create the innovations that make solar power an increasing viable method of electricity generation, equipment manufactures (such as solar cell and module producers), operations and maintenance companies, and distributors (wholesalers and retailers). Integration across value chain segments helps increase gross profit margins—which hover at about 20% over the range of Chinese photovoltaic producers [
28].
R & D functions either occur in publicly funded bodies or often are subsumed into the larger photovoltaic manufactures who can afford to fund large R & D programs. Increasingly, the market is opening to small R & D companies looking to receive patent licensing revenues [
29]. Equipment manufacturers (the part of the value chain we have spent the most space analyzing) provide equipment for use at home and export abroad. Operations and maintenance companies oversee the installation and upkeep of these residential and industrial solar panels and complexes [
30,
31]. Solar panel providers deliver panels either to residential customers or to industrial-size consumers, such as utilities, that transfer electricity onto business and residential customers [
32].
Within this ecosystem stand a number of financial intermediaries who provide funding. Institutional investors, mutual funds, and banks/broker-dealers hold equity and debt in China’s consolidated R & D, manufacture, and operations/maintenance companies. In 2012, for example, roughly USD 1 billion in new renewable investments appeared on the Shanghai Stock Exchange and USD 100 million on the Shenzhen Exchange [
33]. These “bundles of stocks and bonds” (as we have labelled them in the figure) can stay in the hands of the institution or transfer to final owners who can represent other companies and retail investors. The other major part of the financing market includes various debt obligations and notes of credit and receivables (promises to pay for solar panels, maintenance, and other goods and services). Particularly in the US, a side market in solar panel purchase and lease financing has begun to develop in order to provide funds to the consumer (rather than producer) side of the market. In the US, equity has accounted for about half of solar companies’ finance—with private equity and venture capital comprising much of the remaining share [
34]. Even in the US, debt accounted for only about 10% of solar investment finance.
Each of these market segments can use a range of financial securities in order to raise funds and pass along risks.
Table 2 shows the range of securities that various companies in solar companies’ value chains can use. Simple equities and debt (bonds) represent the most prosaic varieties of securities. However, other securities (such as asset-backed and debt-backed obligations) represent increasingly useful securities. As we describe later, because of Mainland solar companies’ existing capital structures, debt instruments would likely swamp trade in equities. Most importantly, solar companies (and related solar finance companies) make excellent candidates for securitizing their assets and liabilities and offering them directly. Such a direct offer provides investors with targeted exposure to the risks and returns on those assets (such as a machine that presses silicon chips). Why buy equities that bundle all kinds of management, macroeconomic, operational, and other risks when investors can purchase directly securities that only give them risk returns related to those silicon pressing machines?
The table shows various securities that companies in solar company producers’ value chains can use to raise funds and pass off risks. We show estimated maximum achievable market sizes for the securitization of various Mainland solar companies’ assets and liabilities on the assumption that all equity, debt, and securitization of these assets and liabilities trade through Hong Kong intermediaries. We make numerous assumptions about investors’ preferences for packaged securities in order allocate certain market sizes to particular classes of securities. For example, from the total value of equity finance (priced at market values in June 2014), we allocate part of that to preferred (rather than ordinary) shares based on assumptions about the overall market’s risk aversion and desire for steady-stream payments.
Methodology: Our methodology consisted of the following. We obtained market valuations for all Mainland solar companies traded in Hong Kong in June 2014 (about USD 4 billion). We further found the total assets and liabilities reported by all non-US-listed Mainland photovoltaic producers. We then allocated the total value of equity, debt, short-, and long-term assets and liabilities to various tradable securities shown in the table. Insurance estimates come from the estimated premiums paid on the total value of insured assets (including financial assets), which come to about 50% of the total.
Source: authors—based on data from WRDS (2014) [
35].
The maximum achievable market size for trade in Mainland solar companies’ financial assets and liabilities in the short term comes to about USD 20 billion. Such an estimate assumes that Hong Kong financial intermediaries can securitize all assets and liabilities of non-US-listed Mainland solar companies. If Hong Kong companies could generate 1% of the value of these financial assets in commissions, fees, capital gains (from sales), and so forth, the revenue generated from these assets could amount to USD 200 million per year.
Moreover, by specializing in solar finance, Hong Kong’s financial intermediaries can provide cheaper and easier financing than rivals in Beijing, Shanghai, and Shenzhen. Such specialization could help ensure that Hong Kong’s financial institutions receive this lucre.
Such computations also tell us something useful about writing the financial law that underpins Hong Kong as an international financial center. These estimates suggest exactly which types of securities policymakers need to regulate (and which to encourage). In this case, legal changes that develop Hong Kong’s debt markets appear as a priority. We also see that the unique profile of solar companies’ assets and liabilities makes their securitization (and the sale of these securities) a profitable and socially useful function.
5. Hong Kong and the Geography of Solar Finance
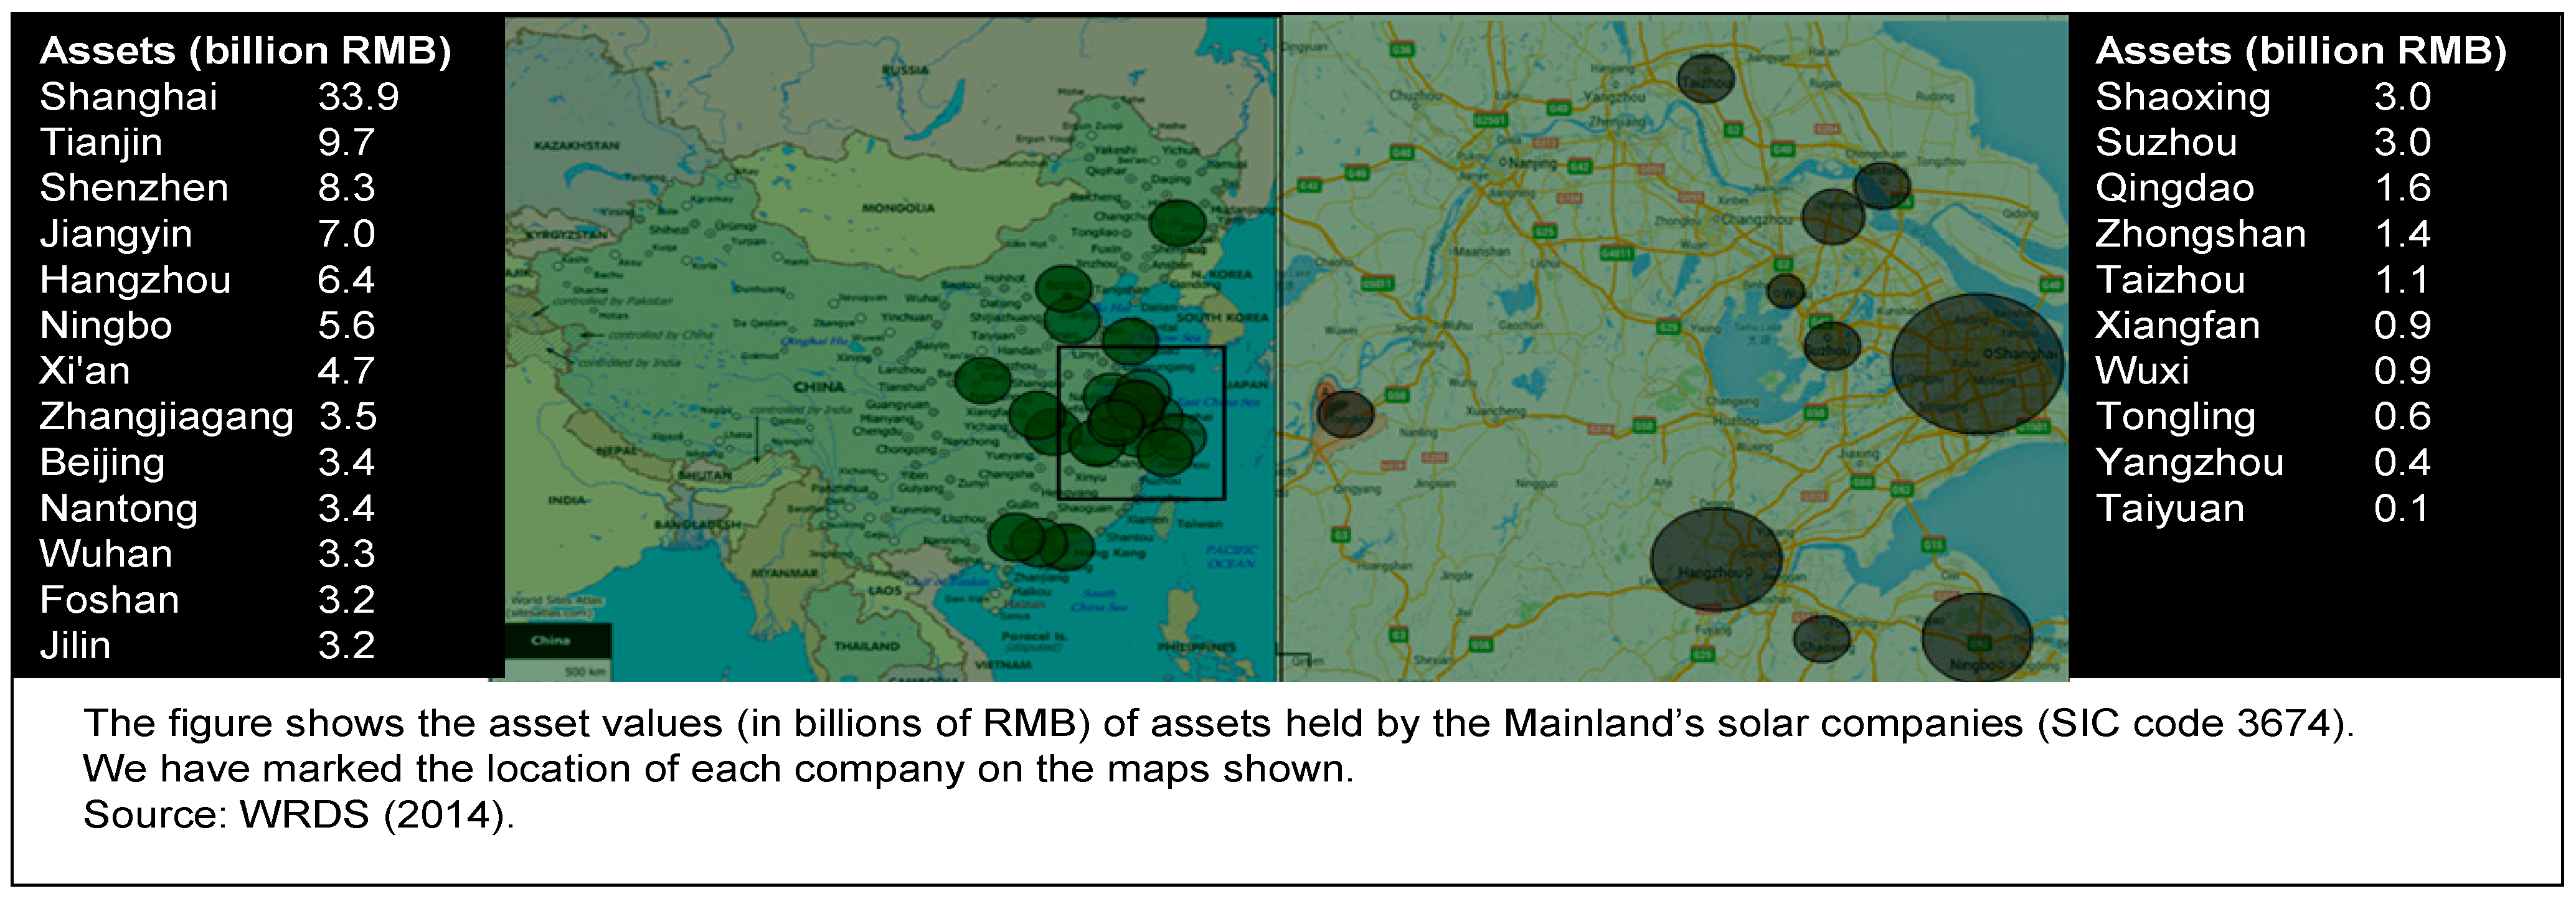
Why should Mainland solar companies use Hong Kong–based financial intermediaries instead of those located closer to them? Indeed, Chinese photovoltaic production tends already to center on areas of Chinese finance.
Figure 7 shows major areas of photovoltaic production on the Mainland. As we saw in a previous figure, most of the actual electricity generation occurs in China’s western provinces (close areas of high solar irradiation). However, production tends to occur close to financial and industrial centers in China’s eastern provinces [
6]. The greater Shanghai area clearly represents a cluster—its photovoltaic companies developing around a sustainable source of finance—with assets totaling RMB 33.9 billion (or about USD 5.4 million). The next largest cluster centers on Tianjin—geographically close to Beijing (the banking center of China). The third largest center lies around Shenzhen—a third financial center. The geographical location of solar companies on the Mainland generally follows the location of finance [
36,
37]. This “geographical balancing” between the location of finance and the sunrise technology has not changed in place or relative proportion since 2021. Naturally, the value of assets in RMB may fluctuate a bit from year to year.
Do the smallness and distance of Hong Kong’s own solar panel industry preclude its financial institutions from playing a pivotal role in financing the Mainland’s solar industry? Not necessarily. Much research from the US suggests that companies looking for capital do not necessarily use the financial institutions in their same city or geographical area. Private equity investments in companies located outside the venture capitalist’s own city have higher rates of success [
38]. In 14.5% of the cases, these financiers make investments in companies that eventually result in an initial public offering located outside the city where the venture capitalist’s headquarters lie. Initial public offerings from investments made outside of cities where venture capitalists have offices weigh in at about 17% of the total. Moreover, investor networks tend to form “barbell” patterns, with a clustering of investors who make geographically distant investments [
39]. If Hong Kong and China follow this pattern, we can expect a clustering of Hong Kong–based solar energy investment firms.
The literature suggests that such “barbell” pattern may develop in the geography of solar investment between Hong Kong (as a financial center) and Shanghai (as a solar company center) for several reasons.
Table 3 provides a summary of some of the literature pointing to the development of such a pattern. Financial firms—like all firms—benefit from knowledge spillovers and reduced transactions costs as they locate together [
15,
40]. However, authors such as [
41] might argue that a solar energy financial cluster cannot exist in isolation. They find evidence of such a “barbell” effect—with a more geographical proximate financial cluster developing and interacting with a distant one. As we show later, Hong Kong can clearly serve as the “local” solar financing cluster interacting with the large Mainland solar company investment clusters in New York and Chicago. In [
39], the authors provide another study showing that financial cluster development occurs with some geographical distance from the sunrise industries they fund. Indeed, their “bridging” role in bringing new ideas, technologies, and money to a sunrise industry cluster necessitates a fair amount of distance. Hong Kong provides the advantage of being not too far, but not too close, to Mainland solar panel producers and other value chain members.
The table shows statistically significant effects (at the 95% level or “better”) from a range of studies analyzing the geography of investment. We translate their findings from other industries in other countries (usually the US) to the Hong Kong context into a solar industry context. As usual, readers should interpret such comparisons cautiously, as effects observed in other countries and sectors may not apply to Hong Kong.
Other effects militate against Shanghai or other financial centers serving the Mainland’s burgeoning solar industry. One of these effects includes the development of “financing finickiness” among financiers located too close to the sunrise industry. Using Silicon Valley as an example, [
1] finds a “California effect”, which discourages sunrise industries there from obtaining funding locally. If a similar “Hong Kong effect” operates like in California, we can expect Hong Kong to be the preferred location of solar finance. Indeed, again if the US experience serves as any guide, Hong Kong companies specializing in financing the Mainland’s solar companies might develop a competitive advantage due to their already-existing portfolios [
42]. From this perspective, Hong Kong companies already fund Mainland science, technology, and other companies. Such pre-existing holdings can complement new investments in solar—increasing returns across the portfolio. Most of these studies imply that Hong Kong needs to race to develop a size and scale needed to offer solar investments before Shanghai and Shenzhen do.
However, not all the evidence points inextricably toward Hong Kong’s role as a solar financing center. A number of scholars such as [
43] point to the important role culture and institutions play in the development of a financial center focused on particular sunrise industries. Hong Kong shares a similar culture to the Mainland’s—and increasingly institutions that “harmonize” with Mainland institutions. Such an explanation, however, ignores the complementary nature of Hong Kong’s institutions. As we explain later in the paper, Hong Kong may represent an ideal solar financing center because of differences in its legal and other institutions with the Mainland. Moreover, Hong Kong may lose out to Shanghai and Shenzhen if its lawmakers do not develop its securitization markets. In [
44], the author noticed the trend that securities markets tend to push out insurance and banking markets. As securitization develops, companies and investors move their banking and insurance business to shadow banks (which provide the same services through securitized lending and insurance). Hong Kong has quickly lost its regional role as a securities center [
45].
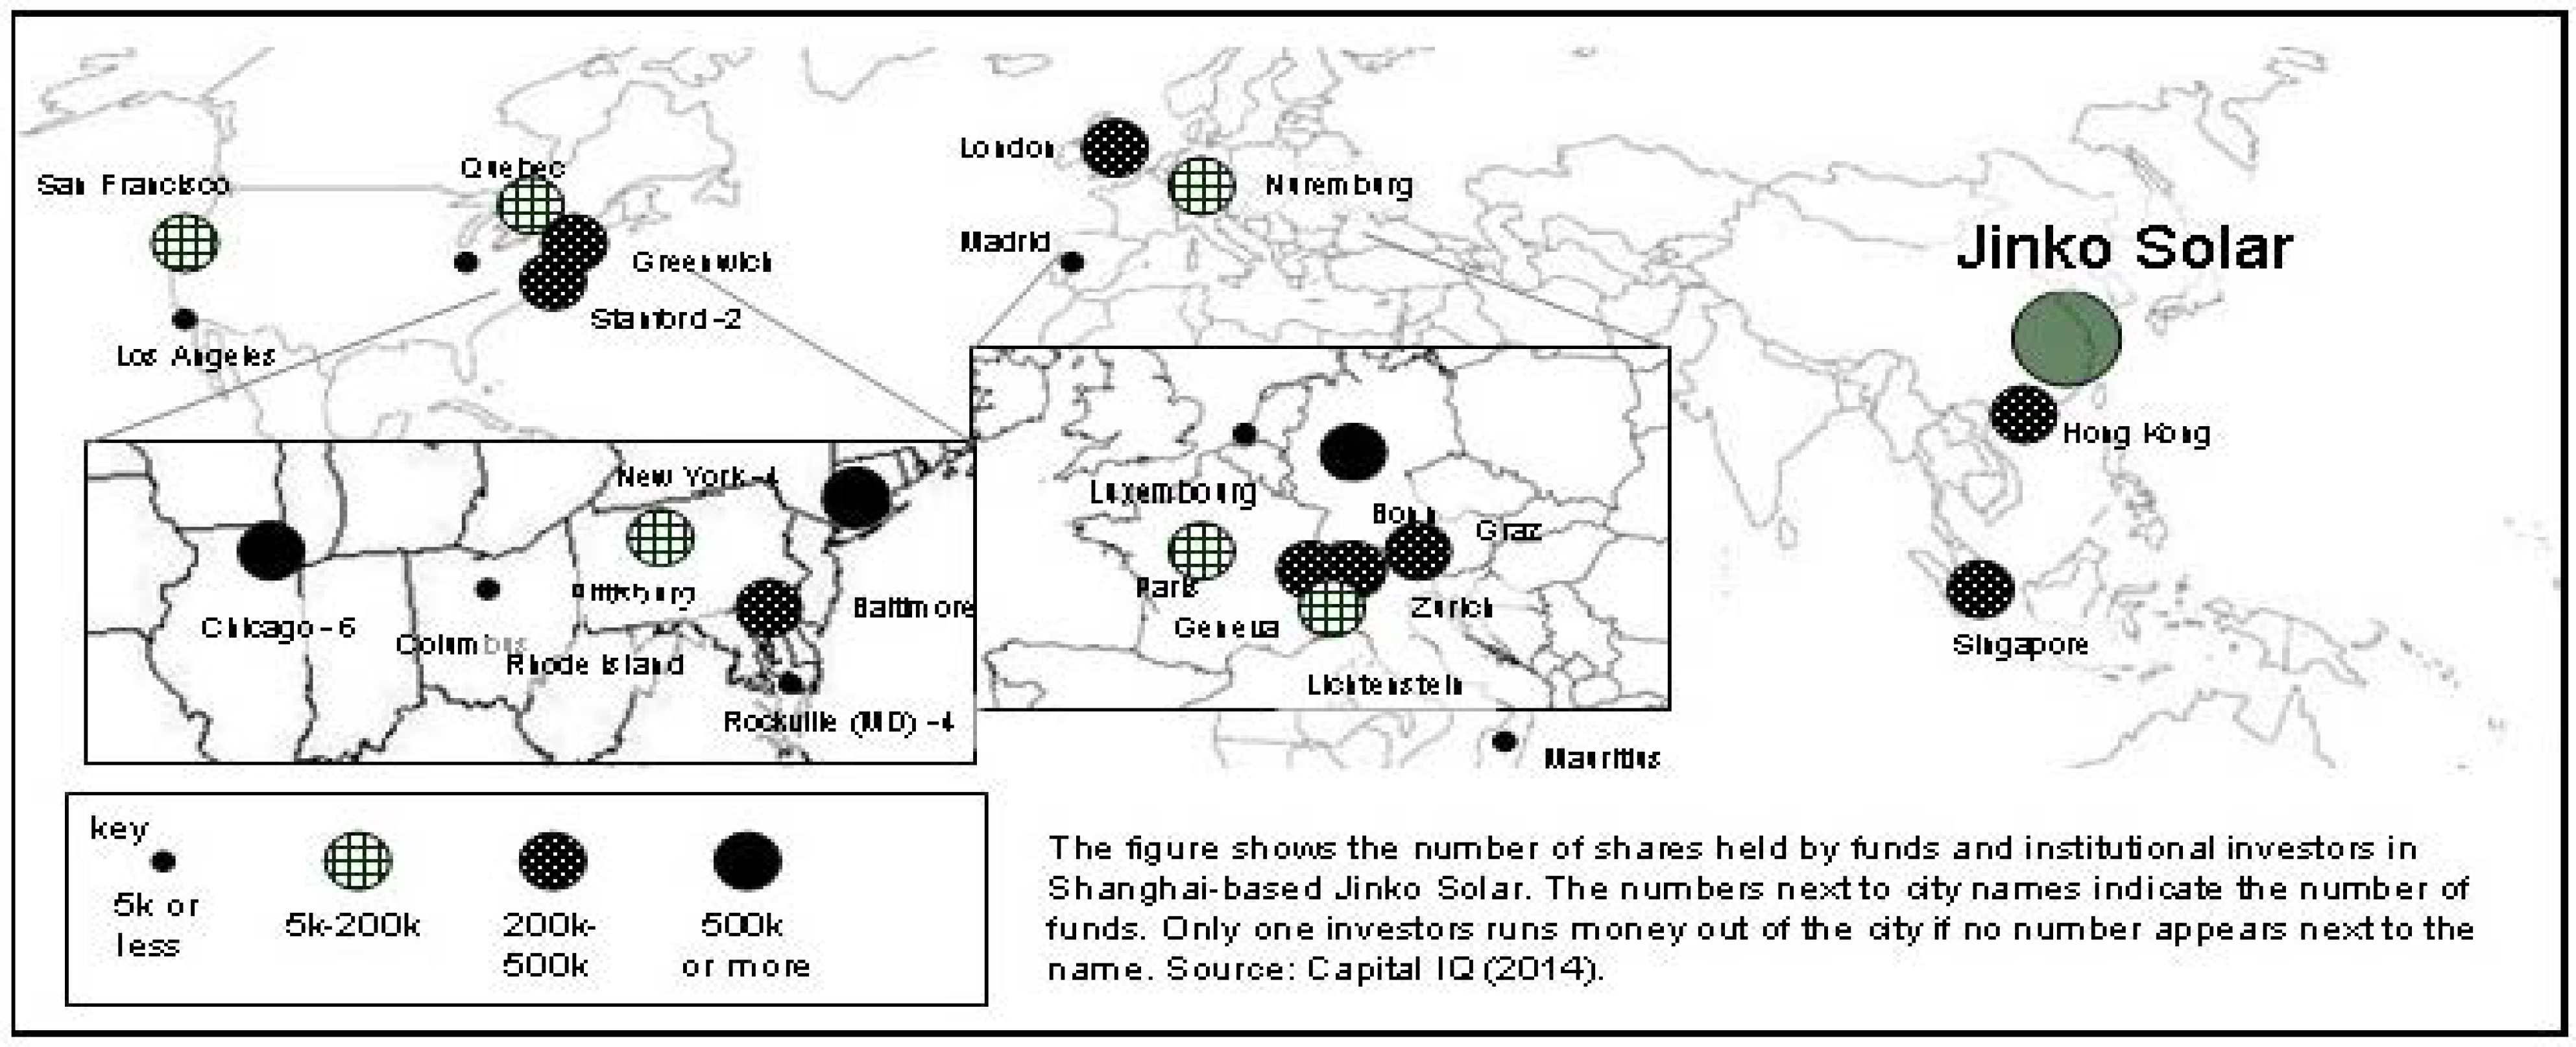
The geographical profile of investment in the larger Chinese photovoltaic companies suggests that Hong Kong has not built up significant investment competencies in this sector [
46].
Figure 8 shows the location and holdings of major mutual fund and institutional investors in the New York–listed Jinko Solar (a Shanghai-based photovoltaic company) to take one example that represents the broader universe of Mainland solar companies.
Here, we show the number of shares held by mutual funds and institutions rather than brokers and custodians. The specific service providers and their assets under management will have changed since we collected these data. All dynamic industries and their web of financiers will evolve over time. However, we contend that our theory helps us understand and predict this evolution. Of the 13% of total company shareholders who report their holdings publicly, Hong Kong–based investors hold a relatively large proportion of the company assets (about 12%). Central Asset Investments represented the main holder of Jinko’s equity among Hong Kong domiciled funds and institutions at around 12% of assets.
However, institutional investors from other cities hold more than 75% of these shares. Hong Kong companies’ relatively meager holding represents both a benefit and cost to Hong Kong as an international financial center. On the upside, having less Hong Kong–centered investment in Jinko benefits the company—as it draws from range of different holders able to bring new perspectives (and gain diversification in return). On the downside, if Jinko represented such a good investment, why don’t more Hong Kong investors take more and larger stakes? Hong Kong institutions and funds are either unwilling or unable to invest in solar companies such as Jinko to the same extent as their foreign rivals. In either case, Hong Kong investors clearly do not serve as a value-adding intermediary for local and foreign Mainland solar company investors.
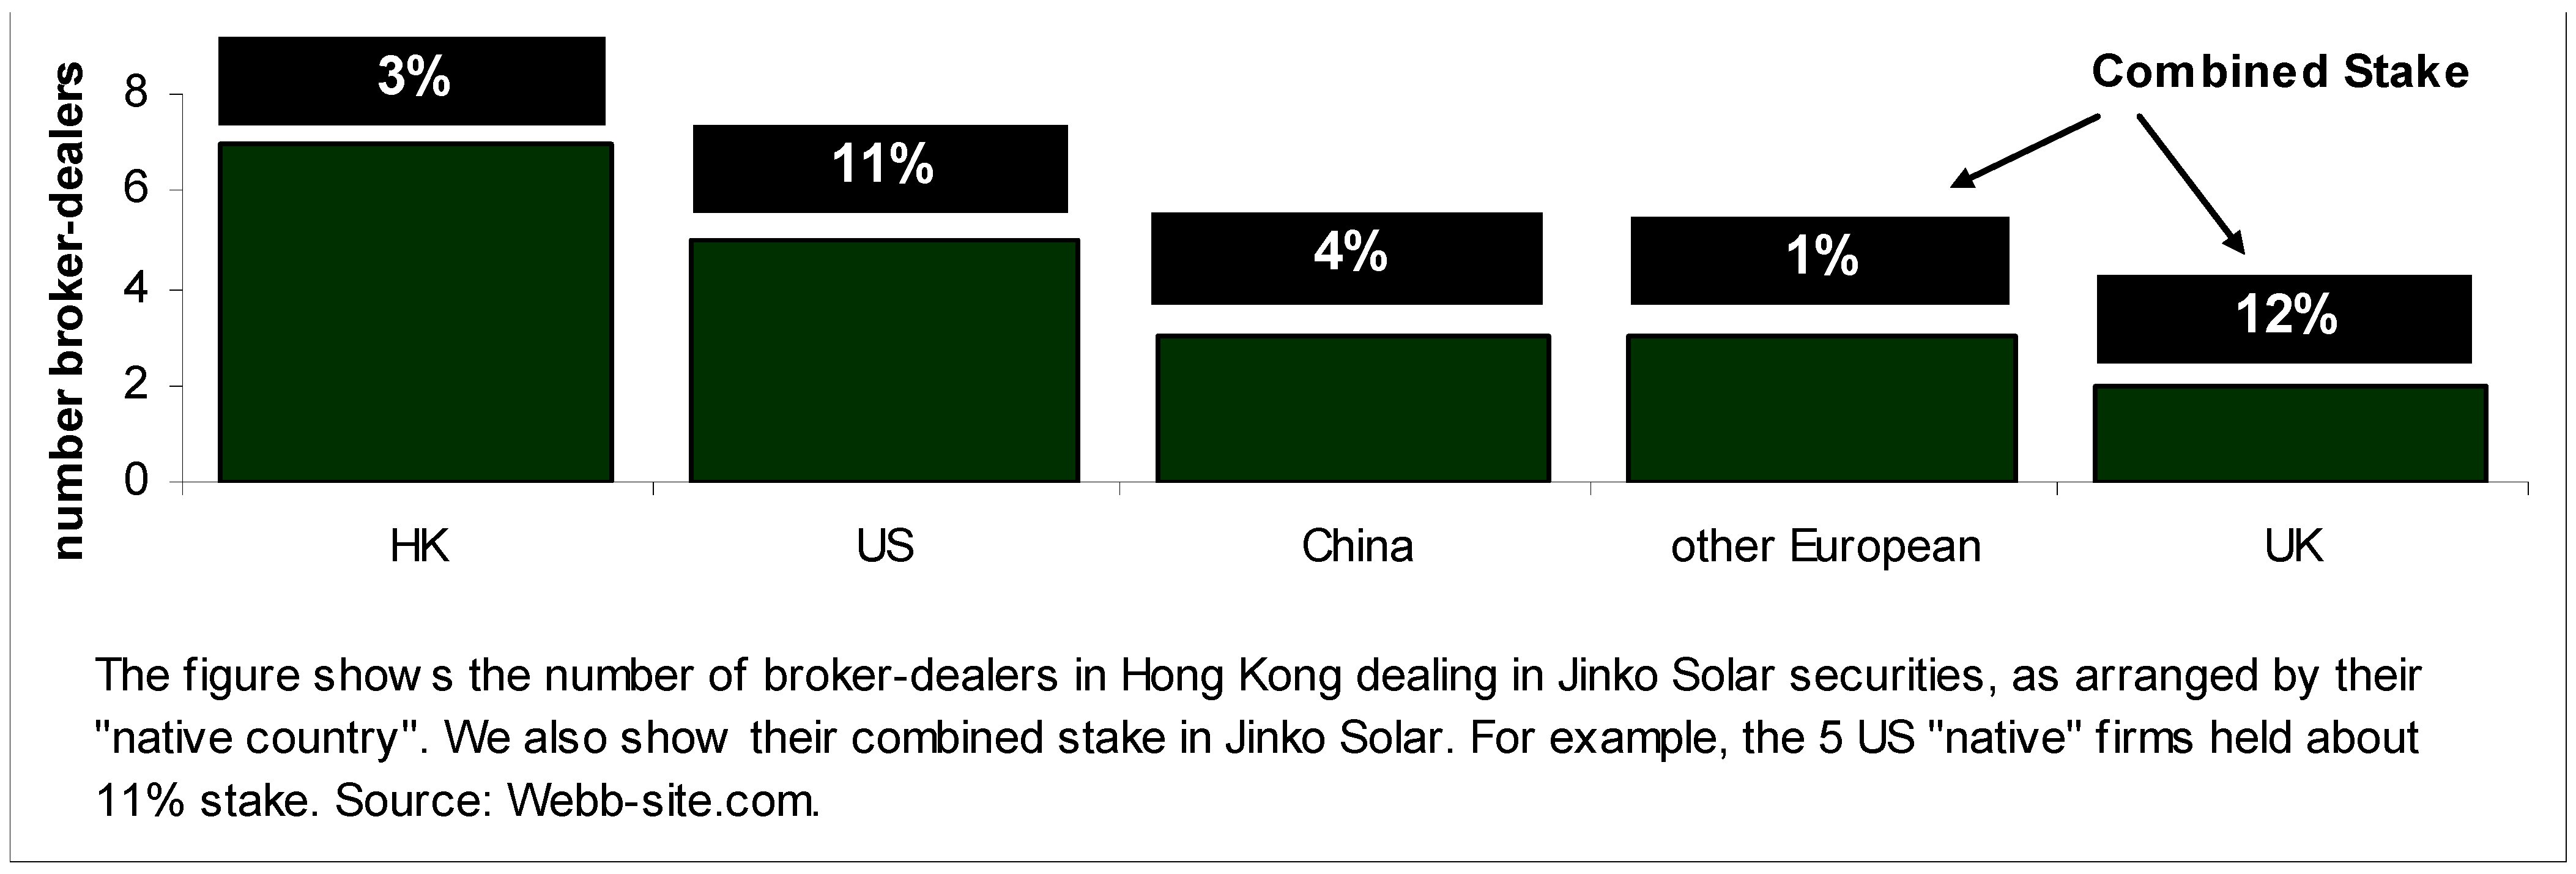
If Hong Kong develops as one end of the “barbell” it will likely serve as a pass-through conduit for real investors located in other jurisdictions. Continuing with our Jinko Solar, we see one example of such a pass-through.
Figure 9 shows the nationality of Hong Kong–based custodians holding Jinko Solar’s shares (using data from around 2012). By the number of custodians, Hong Kong national broker-dealers represent the majority. However, by shareholding, US and UK firms registered and domiciled in Hong Kong hold the majority of Jinko’s shares. Hong Kong serves as a pass-through for other international investors rather than as hub for solar (and other kinds of) local investors. Such market behavior represents the norm—even any one datum or small set of this evolution changes in size.
6. Hong Kong in Regional Solar Energy Markets
Hong Kong’s needed leadership as a solar industry finance center comes into focus when considering the size of future regional solar consumption. Outside of Europe, Chinese markets represented the largest markets for photovoltaics, roughly 35% in 2012 [
8]. However, these amounts only represent the tip of the iceberg.
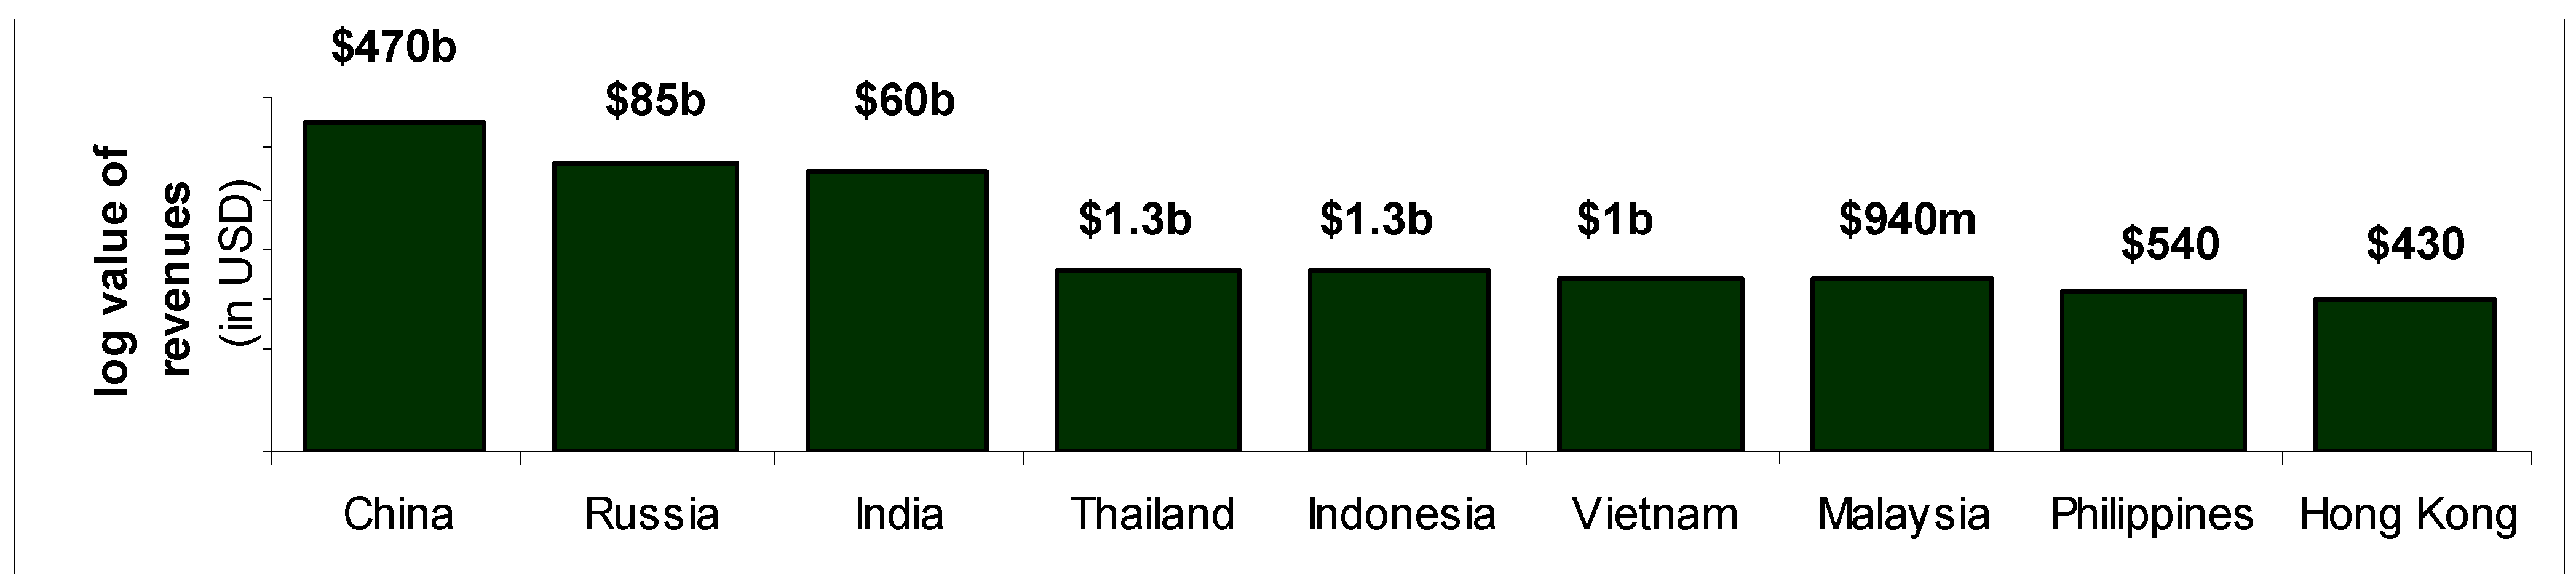
Figure 10 shows the potential value of solar energy
consumption in the Asian region alone over the next 10 years. In other words, the figure assesses the likely customer spending on photovoltaically generated electricity over the next 10 years, given a set of assumptions that we chose in order to make economics of the market easier to understand. China represents the largest market—at USD 470 billion in potential revenue over the next decade. The growth (or marginal) change in these market sizes comes to about USD 155 billion by 2018. Other market size estimates confirm our own estimates [
48]. Russia and India represent the next 2 largest markets with about USD 140 billion in spending between them. Spending in Hong Kong should come to USD 430 billion—a paltry figure in comparison. Altogether, the value of photovoltaic energy revenues in Asia alone could top half a trillion dollars. Despite claims to the contrary, China’s large energy needs mean that the sun will not set on the China solar power industry for quite some time [
49].
Naturally, readers should use caution, which extrapolates data or patterns into the future. We do no show future data, as they do not change the way the reader would qualitatively understand a California effect. Disruptions in several of these markets since 2014 in several of these markets would furthermore add pure noise—obscuring the relationships we hope to illustrate.
However, these amounts only represent the beginning. Solar energy represents less than 5% of most of the world’s energy production—and represents even 2% or less in most Asian countries [
13]. If countries such as the Philippines, India, the Philippines and others manage to expand access to electricity beyond current levels (rather than simply replacing coal, gas, and oil with solar), market sizes could be much bigger. Many countries’ politicians are already looking for ways to increase their production (and thus consumption) of photovoltaically generated electricity [
9]. Thus, the market for solar power could be much, much bigger if financial institutions in a place such as Hong Kong could figure out ways of providing flexible and low-cost finance to solar technology producers and users.
Looking at electricity usage in Asia from space at night, one can see that as household incomes increase, the price of solar electricity declines and taxes rise on tax-carbon-emitting electricity production methods, and the markets shown in the figure will become more profitable. However, both consumers and producers will need ways of financing such growth [
50]. If Hong Kong’s financial institutions can help lower the costs of electricity and provide finance that makes access to electricity more widespread, Hong Kong’s role as an international financial center can only increase.
Once solar energy costs reach parity with other forms of electricity, solar could provide far more than 5% of the region’s (or world’s) energy needs. Current estimates place such cost parity at the end of the decade [
51]. At present, solar power electricity in China is three times more expensive than the cheapest alternative (hydropower at 4.21 cents per kilowatt hour) and up to two times more expensive than the next most expensive form of electricity generation, with biomass at 11.90 cents per kilowatt hour [
52]. Affirming Reichelstein and coauthors’ analysis, Zhao and coauthors find that if cost decreases continue on their current trajectory, solar power should reach parity with the cheapest by the end of the decade. Most authors agree that solar energy costs will come down to represent the cheapest forms of electricity generation—making photovoltaics the preferred method of electricity generation. Once photovoltaic reach cost parity with other forms of electricity generation, the total market potential over the decade could easily reach USD 1–2 trillion.
If Hong Kong financial institutions provide even 10% of that finance, such finance would increase the size of Hong Kong’s portfolio assets under management by 30%—but still not even getting Hong Kong close to the league of Japan or Germany as an international financial center. Our estimate of USD 1–2 trillion comes from doubling the net present value of financial transactions tied to financing solar electricity (as shown in
Figure 10) and increasing penetration in the financing of electricity markets in the region, and Arner et al.’s Figure 2.2a provides our estimate of portfolio assets under management [
45].
Hong Kong financial institutions can also play a role in helping Mainland solar companies regionalize. A number of commentators have pointed to Chinese companies’ setting up production facilities in other Asian countries, as labor costs increase on the Mainland.
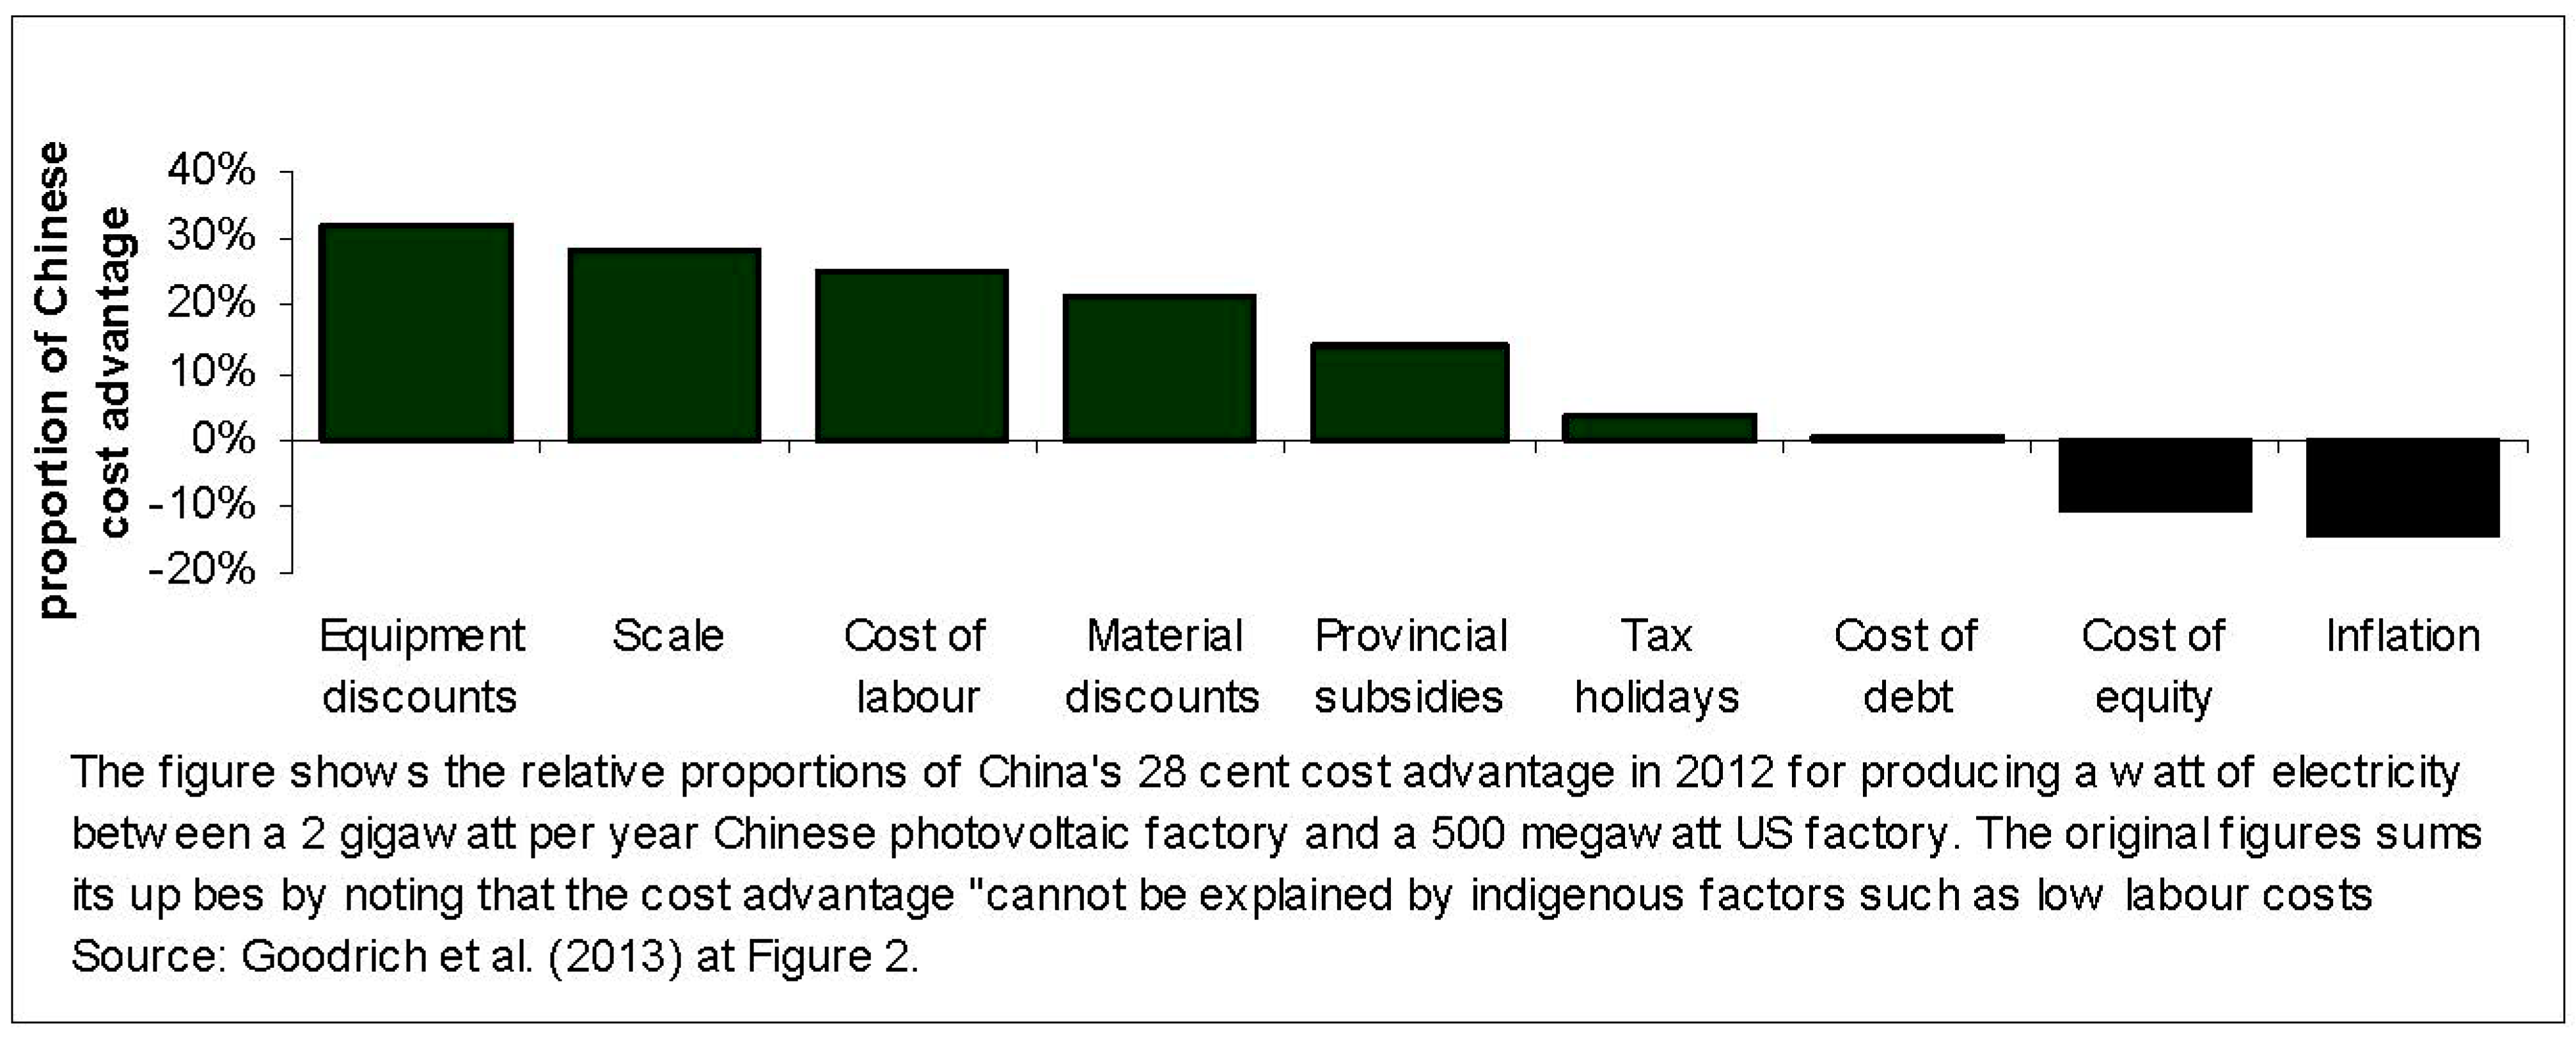
Figure 11 shows the factors driving such regionalization—by showing the various components of China’s photovoltaic cost advantage vis-à-vis US producers [
53]. Equipment and material discounts, economies of scale, low labor costs, subsidies, and tax holidays represent the various components of China’s photovoltaic sector cost advantages. As the Mainland economy heats up, discounts, labor cost advantages, subsidies, and tax holidays will likely disappear. The Mainland’s solar companies will thus look for countries providing these advantages—such as Vietnam, Myanmar, Indonesia, and other low-cost jurisdictions. Interestingly, the Mainland’s cost of finance (both debt and equity) serves to reduce its cost advantages. To the extent that Hong Kong’s financial institutions can provide cheaper debt and equity finance to Mainland solar companies, such finance would help promote the Mainland’s solar competitive advantage. The specifics of labor costs might change. However, the role that financial competition plays in driving competitiveness in the upcoming years will remain as important for this one sunrise industry (photovoltaics) as for them all.
Hong Kong’s value as an international financial center consists of bringing low-cost capital to high photovoltaic cost jurisdictions.
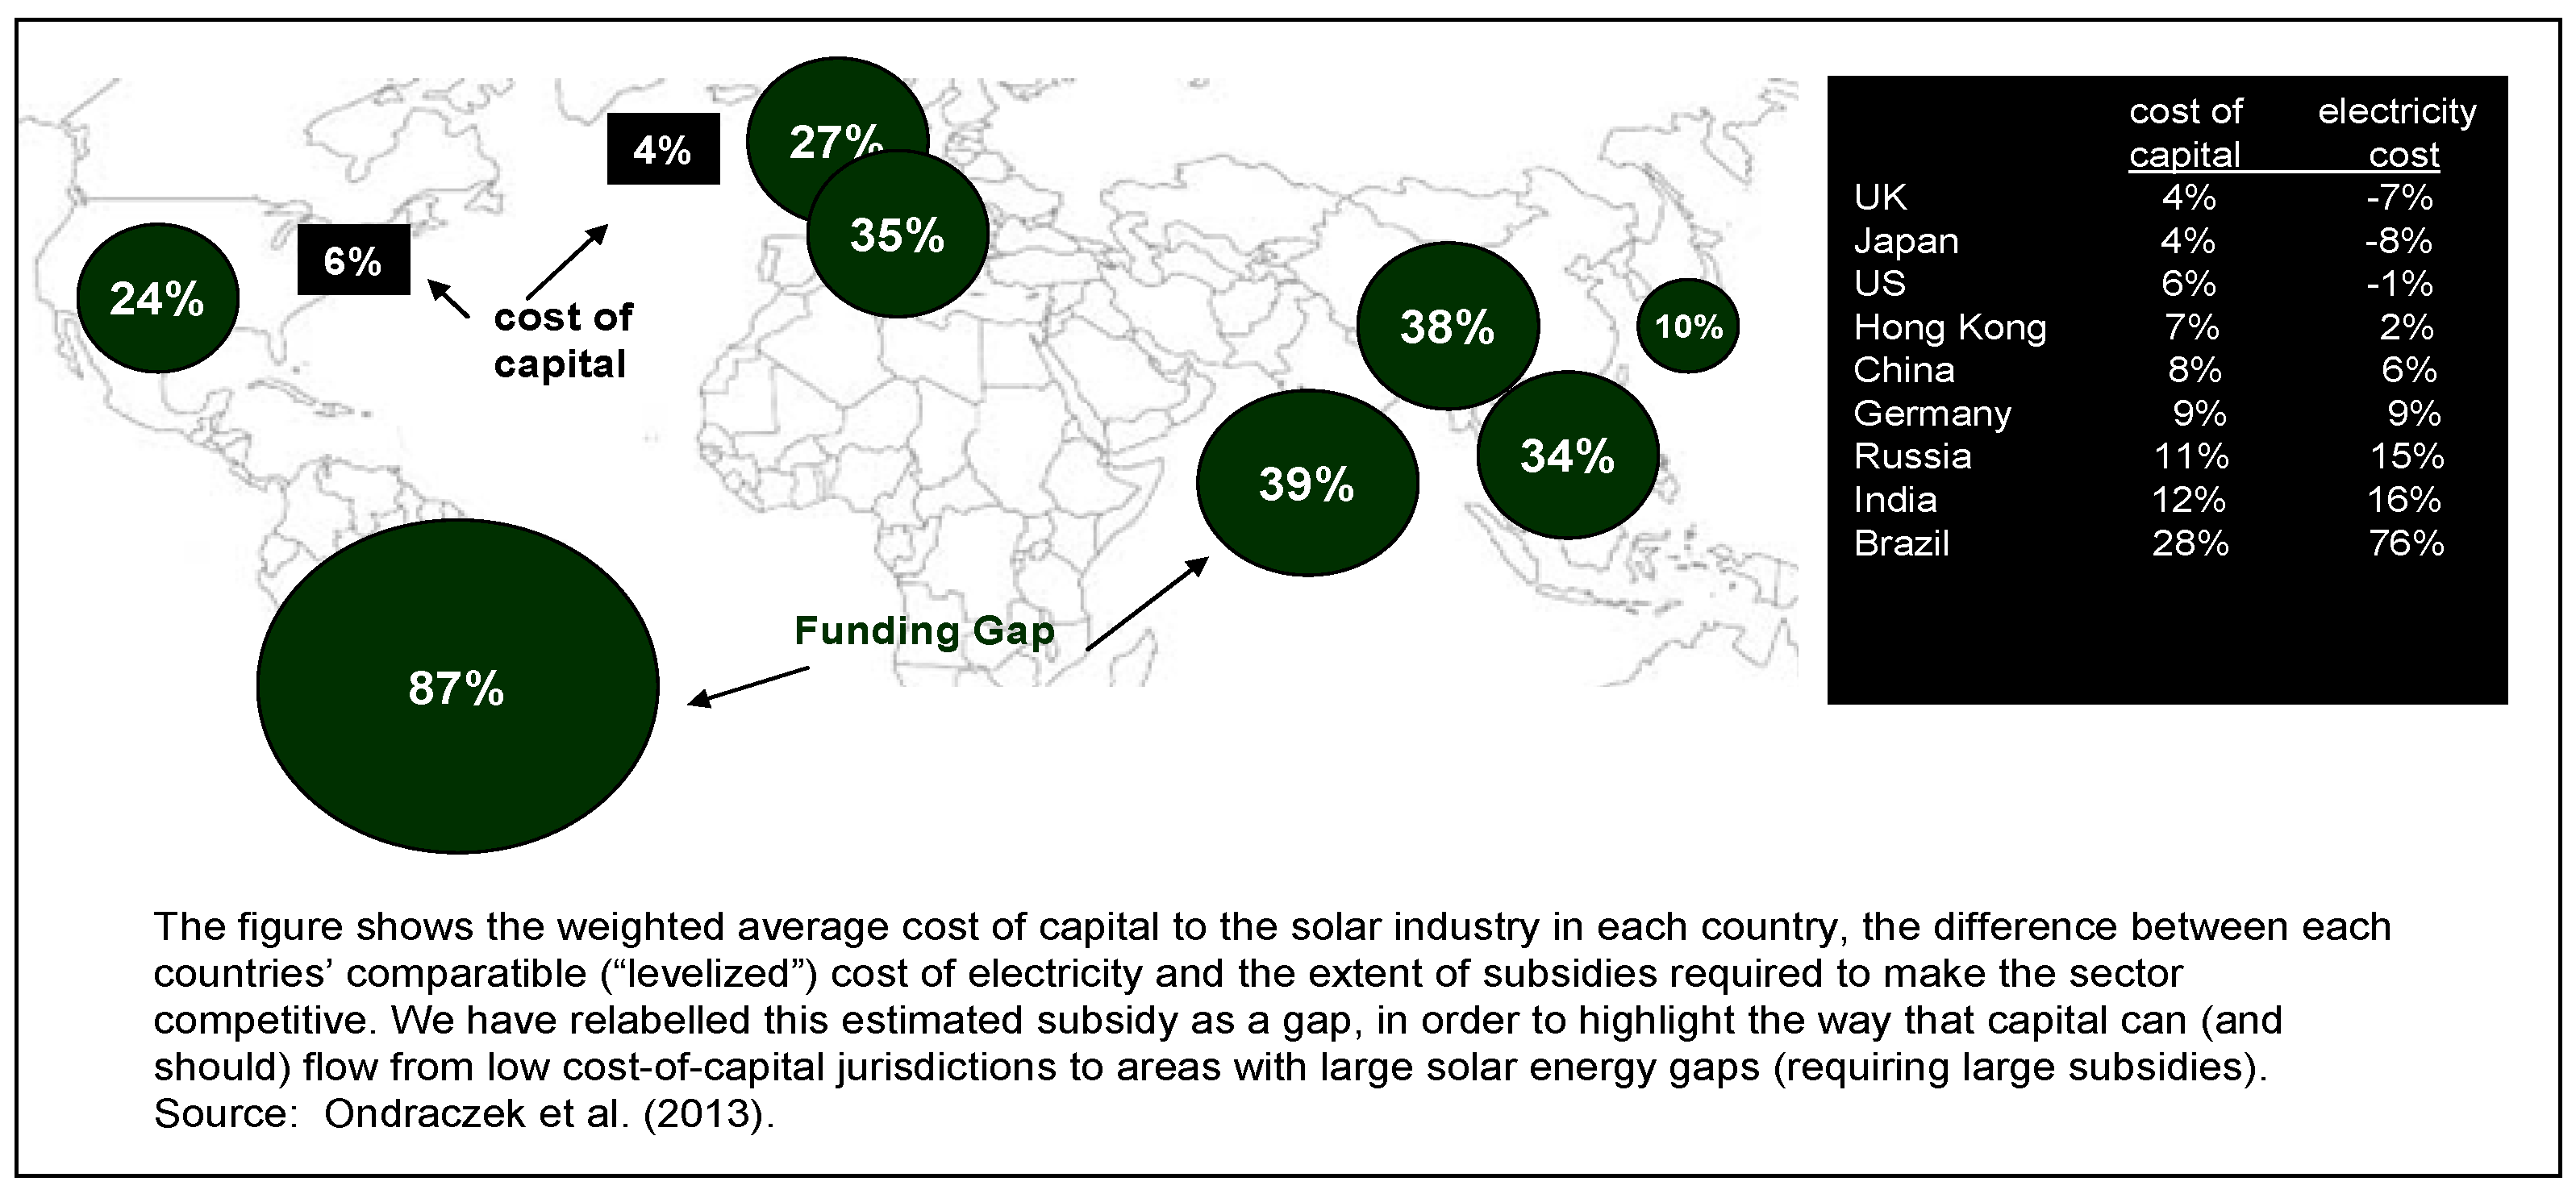
Figure 12 provides a “heat map” for solar energy funding—showing where the cost of capital is cheapest and where the cost of solar electricity is highest [
54]. As we have previously noted, an international financial center represents a technology for bringing low-cost capital to fund expensive new tastes and technologies. As shown in the figure, the US and UK represent jurisdictions with some of the lowest costs of capital in the photovoltaic space. Countries such as China, India, and Hong Kong represent areas where the cost of producing solar energy remains relatively high. The role of international financing institutions (such as banks and broker-dealers) consists of helping to provide capital that brings down the cost of such electricity—through economies of scale, financing of research and development, funding licensing agreements, and so forth. Given Hong Kong’s slightly higher cost of capital, the best strategy consists of intermediating in funding relationships (already exhibited in its California effect) between the US/UK and the Mainland as well as other large electricity users in the region.
How can Hong Kong’s financial institutions intermediate (by putting themselves in the middle of) financing relationships between UK/US financiers and the Mainland’s solar companies. As we have shown previously, many Mainland solar producers list in the US—and a number of US funds and institutions buy Mainland shares (listed anywhere) for resale in solar-branded funds. How can Hong Kong financial firms step into funding chains? Hong Kong’s financial institutions need to provide financial services that American and British funders cannot easily provide. Hong Kong’s stock exchange and bonding trading are shallower than the US and UK’s. Instead, Hong Kong institutions can help Mainland solar firms “squeeze” more return out of their assets.
7. Conclusions
Hong Kong seems ripe to benefit from a supposed California effect—an effect where financial firms located not too close and not too far from clients attract the most business. However, firms based in Chicago often trump Hong Kong firms in attracting money for Chinese solar-related investments. We argue that the geographical evolution of China’s solar financing industry shows the limits of such a California effect. Any place that bunches up the desire and know-how to provide finance will emerge as an international financial center in the service of a particular sector or industry. We show how our work extends the extending research in order to predict where and how international financial centers may thus develop. Such desire and know-how look unlikely to emerge in the same city where solar companies locate (as entrepreneurs are more interested in revolutionizing solar electricity generation and provision rather than in revolutionizing the way firms and customers pay for these innovations). However, firms located very far away will also fail to emerge as a key financial center for solar industry finance—unless many firms in the same place focus on developing the skills and networks needed to provide such finance. Nothing about geographical “structure” determines the way financial firms emerge over space and time.
These results hold important lessons for upcoming, aspiring financial centers—from Hong Kong to Malta—as much as lessons for the academics working in them. International financial centers looking to raise assets under management need to focus on improving their understanding of the industries they finance far more than understanding how to build a better bank or make a more efficient broker-dealer. Such advice flies in the face of most pundits, who encourage financial centers to focus on improving their banking and securities sectors. Academics looking to understand the way international financial centers evolve over place and time need to look past geographical or culture distance. Academics will fail to quantify the extent to which a financier “fits” in with a part of an industry’s value chains or develops unique competencies that allow it to market solar-related securities better than others. Such aspects of the geography of finance defy quantification. However, taking a deeper, meticulous look at the way financial firms actually compete for business in various cities helps to understand the geography of finance far better than the usual functionalist or structuralist models imply.


