Article

Carbon Distribution Characteristics and Sequestration Potential of Various Land-Use Types in a Stony Soil Zone of the Arid Mountainous Regions on the Eastern Tibetan Plateau

1
School of Environment and Resources, Southwest University of Science and Technology, Mianyang 621002, China
2
Department of Culture and Tourism, Taiyuan University, Taiyuan 237016, China
*
Author to whom correspondence should be addressed.
Sustainability 2023, 15(20), 14721; https://doi.org/10.3390/su152014721
Submission received: 16 August 2023 / Revised: 25 September 2023 / Accepted: 7 October 2023 / Published: 11 October 2023
(This article belongs to the Section Sustainable Agriculture)

Abstract

:
In arid mountainous areas with stony soils in the Eastern Tibetan Plateau, intensively managed orchards (which include the need for plowing, irrigation, and soil stone removal), eco-forests, and grasslands, all converted from croplands, are becoming increasingly popular. We randomly collected soil samples at 0–15, 15–30, 30–45, and 45–60 cm depths from the four land-use types on the northern and southern slopes in the region. Differences in soil organic carbon (SOC) content/stock, soil water content (SWC), and rock fragment content (RFC) in land-use types and slopes were analyzed using two-way ANOVA. The factors’ contributions to SOC variation were assessed using mixed-effect models. Results showed the following: (1) In topsoil (0–30 cm), SOC contents followed the order eco-forest > orchard > grassland ≈ cropland; in subsoil (30–60 cm), the order was orchard > eco-forest > cropland ≈ grassland. SOC stocks (0–60 cm) were higher in orchards (93.72 Mg ha−1) and eco-forests (92.44 Mg ha−1) than in grasslands (53.65 Mg ha−1) and croplands (53.05 Mg ha−1). Contributions of SOC stocks at the 0–15 cm depth level to total SOC were above 40% for GL and EF and between 27 and 35% for OL and CL; at the 45–60 cm level, OL contributed 16–20% and was higher than 10–15% for the other land-use types. (2) Eco-forests and grasslands showed increased SOC contents/stocks at all soil layers on the northern slope than on the southern one. Orchards and croplands, however, showed no differences in contents between slopes. (3) Land-use types, TN, SWC, RFC, slope aspect, and management practices significantly affected SOC variation. Our results suggest that forest plantations (orchards and eco-forests) in arid mountainous regions, through active management practices (e.g., irrigation and fertilization), are vital for improving soil carbon sinks and achieving peak carbon/carbon neutrality goals.

1. Introduction

Arid mountainous areas with stony soils in the Eastern Tibetan Plateau are crucial parts of the ecological barriers of the Qinghai–Tibet Plateau and the Loess Plateau in the Sichuan and Yunnan Provinces, and they played a central role in the construction of the National Ecological Security Strategy “Two Barriers and Three Belts” [1]. It should be noted that natural disasters, such as landslides and mudslides, are frequent in this region, which, together with constant human activities, cause severe land degradation [2]. In 1999, the Chinese government launched the “Grain for Green” program, converting sloping farmlands into eco-forests, grasslands, and orchards in the arid mountainous regions. Unexpectedly, the SOC variation in the relevant land-use types was controversial.
Studies [3,4] showed that, in arid and stony soil mountainous areas in the Eastern Tibetan Plateau, the restoration of agricultural lands to forests (apple orchards and eco-forests) and scrubs (pepper plantations) increased soil carbon stocks by 6% and 8%, respectively; SOC contents were affected by land-use types and elevations and were positively correlated with the number of reforestation years. The conversion of cropland to woodland or grassland in arid regions can reduce anthropogenic disturbances and soil erosion, enhance the stability of soil aggregates [5], increase the prevalence of detritus and roots [6], and weaken weathering and microbial decomposition [7], thus promoting SOC accumulation [8]. However, opposite conclusions were reached by Wang [9], who found that SOC content decreased after croplands were converted into eco-forests (Robinia acacia) because the high level of anthropogenic disturbance to the land inhibited the soil microbial population. In the arid regions of West China, Li [10] and Yang [11] found that SOC contents and stocks were higher in farmland than in woodland and grassland, due to irrigation and fertilization.
Farmers employ a range of management practices, such as shallow plowing, fertilizer application, flood irrigation, and the removal of soil gravel to increase land productivity in their orchards. Under frequent plowing, the topsoil aggregate structure is disrupted, leading to an increase in SOC mineralization [12]. This is accompanied by a reduction in vegetation cover, which not only leads to SOC loss through increased soil erosion, but also results in higher soil temperatures during the daytime, which further activates the microbial decomposition of SOC [13], thus weakening the stability of SOC in the surface layer. Topsoil organic carbon losses are induced by flood irrigation through the gas and hydrology pathways. Flood irrigation significantly increases CO2 emissions from soils compared to drip irrigation [14], can reduce topsoil carbon content by altering the ratio between bacteria and fungi, and can translocate topsoil-soluble carbon into deeper layers [15], where it can be readily adsorbed on unsaturated soil particles and, thus, protected from mineralization. Rock fragments (gravels) contribute to SOC sequestration by altering soil hydrological processes, structures, and chemical elements during drought conditions. Some studies found that soils with moderate amounts of gravel can optimize soil contracture, lower hydraulic conductivity, reduce evaporation [16], and protect crops from dry conditions, promoting SOC sequestration. Moreover, elements released by gravels during weathering can enhance microbial and plant growth and accelerate SOC accumulation [17]. Currently, reports on the effects of land management practices on SOC distribution and sequestration in the arid mountains of the Eastern Tibetan Plateau are lacking [18].
Our objectives were as follows: (1) examine differences in SOC content/stocks among land-use types, in-depth, and on slope aspects; (2) analyze the characteristics and potential for soil carbon sequestration in orchards and other land-use types; and (3) assess the effects of management measures (including plowing, flood irrigation, fertilization, and soil gravel removal) on SOC distribution and sequestration in the studied regions.

2. Materials and Methods
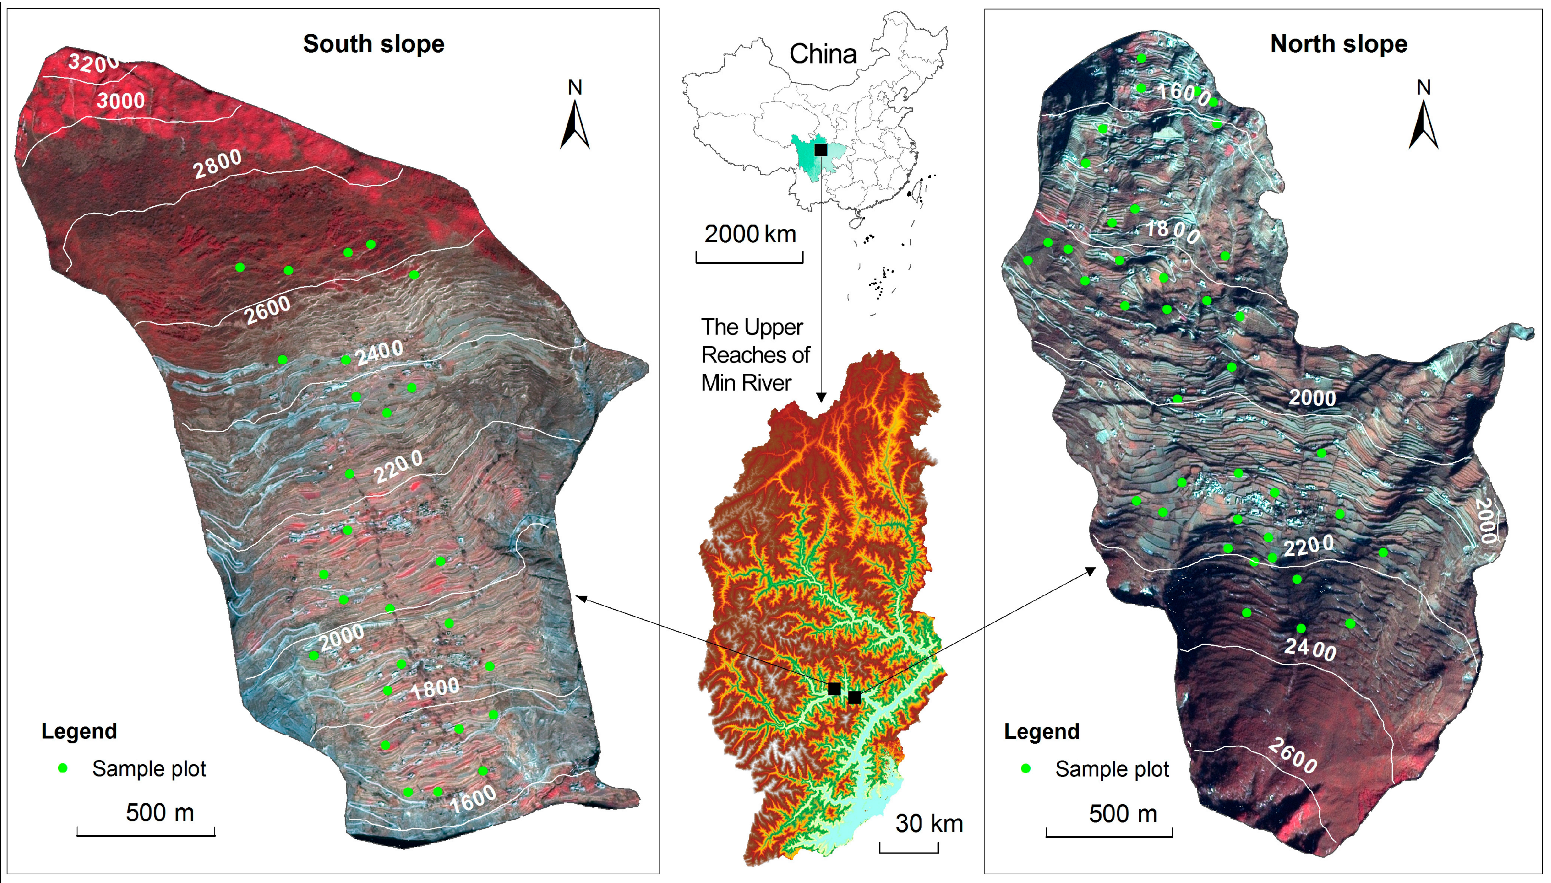
2.1. Study Area

The study area is located on the slopes of both banks of the Zagunao River, a tributary of the upper Min River, on the eastern margin of the Tibetan Plateau. One is on the northern slope (31°32′32″ N, 103°26′57″ E), and another is on the southern one (31°35′1″ N, 103°19′33″ E) (Figure 1). The average annual temperature and precipitation are 6.9–11 °C and 500–600 mm, respectively, but the average evaporation is 1500 mm. The soil is yellowish-brown, shallow, and stony or gravelly, and it is classified as Haplastepts [4] by the USDA (U.S. Soil Classification System). Native vegetation types include mesophytes and drought-tolerant plants adapted to arid mountainous regions [3].
Historically, most of the land use in the region has been gradually transformed, from croplands to plantations. Current land use still exhibits significant vertical zonation. The eco-forest (EF) area, at 2200–2500 m altitudes on the northern slopes, is dominated by Robinia pseudoacacia Linn, while that on the southern slopes, at 2500–2800 m, is dominated by Abies faxoniana Rehd, and neither plantation has been actively managed since 1999. Orchard lands (OLs) are distributed at 1500–2200 m elevation on the northern slope and 1600–2500 m on the southern one, and include species of Cerasus pseudocerasus Lindl., Prunus cerasifera Ehrh., and Malus pumila Mill. Grasslands (GL) are scattered among the orchards on both slopes at altitudes of 1500–2000 m. Species include Rhynchosia minima Linn., Setaria faberii Herrm., Lathyrus deilsianus Harms., and Cymbopogon distans Wats. Cropland (CL), a disappearing land-use type, is found below 2000 m above sea level and planted with maize and soybeans. See Table 1 for details on land-use types.
Orchard management is a main productive activity for farmers in the region. Fruit (cherry, plum, and apple) trees were planted at 6.0 × 6.0 m spacing. Every spring, orchards were fertilized by applying farmyard manure (a mixture of corn straw, orchard litter, and goat and yak dung, all fermented, about 30% water content): 10,000–20,000 kg ha−1; special fertilizer for fruit trees (N-P2O5-K2O): 2000–3500 kg ha−1; and urea (CH4N2O): 200–300 kg ha−1. Then, rapid shallow tilling was carried out at 10–15 cm soil depth to allow fertilizer to enter the soil efficiently. After ripe fruits are harvested, cherry (in June), plum (in August), and apple (in October) orchards are fertilized again with similar fertilizer as in the spring, except without the urea fertilizer. Flood irrigation is the only way to alleviate soil water shortages in orchards. Soil stone removal is a crucial management measure in orchards to reduce gravel abrasion on agricultural tools. In addition, farmers often interplant their orchards with crops such as vegetables, soybeans, and corn. During this process, the topsoil is strongly disturbed (Figure S1).

2.2. Sampling Design

From November to December 2020, thirty-nine sample plots were randomly selected within five gradients divided into 200 m increments from 1500 to 2500 m elevation on the northern slope. Thirty-nine sample plots were selected randomly on the northern slope, including cropland (CL)*3, grassland (GL)*5, eco-forest (EF)*6, and orchard land (OL)*25. Twenty-seven sample plots were selected on the southern slopes using the same method, including CL*5, GL*4, EF*5, and OL*13 (Figure 1 and Figure S2). The final number of plots selected included eleven croplands, nine grasslands, eleven eco-forests, and thirty-eight orchards. The ground distance between two neighboring plots ranged from 100 to 500 m. Areas at the top of the watershed and on steep slopes were excluded from being selected as sample plots, in order to minimize the confounding effects of slope and erosion; orchard plots inter-planted with vegetables and food crops were also excluded, to minimize the effects of differences in fertilizer application. Five replicate sampling points were set up in a square (area 10 m*10 m) in the center of each sample plot—four at the ends of the diagonals, and one at their intersection. After removing the leaf litter and humus layer, soil cores were collected at depth intervals of 0–15, 15–30, 30–45, and 45–60 cm at each sampling point. Five soil cores from the same layer and plot were mixed to form a sample representing the plot. In addition, soil water content (SWC) was collected every ten days, for a total of 3 times.

2.3. Soil Determination

Soil samples were baked at 65 °C to a constant weight and passed through a sieve with a mesh size of 2 mm. The fraction smaller than 2 mm was fine earth, and the remainder (>2 mm) was composed of rock fragments. The SWC was computed by dividing the lost water weight from the fresh soil sample by its weight [17]. The rock fragment content (RFC) was calculated by dividing the rock fragment weight by the oven-dried sample weight [19]. The soil bulk density (BD) was obtained by dividing the dried sample weight by its volume [20]. The SOC content of fine earth was determined using potassium dichromate external heating [21]. The total nitrogen content (TN) was determined using the micro-Kjeldahl method [17]. Vegetation age, fertilizer application, and land income details were obtained from visiting farmers. The SOC stock (Mg ha−1) for each soil layer i, was calculated using the following equation:
SOC stock = Ci Ti Di (1 − Ri)/10
where Ci, Ti, Di, and Ri are the SOC content (g kg−1), soil thickness (cm), BD (g cm−3), and RFC (mass) of the layer, respectively. Total SOC stock represents the sum of the SOC stocks at the 0–15 cm, 15–30 cm, 30–45 cm, and 45–60 cm depth levels.
SOCS contribution (%) for each soil layer i, was calculated using the following equation:
SOCS contribution = SOCSi/Total SOC stock × 100
where SOCSi is the soil organic carbon stock of the soil layer

2.4. Statistical Analysis

Using an IBM SPSS 26.0, a two-way ANOVA was conducted to examine differences in SWC, RFC, SOC content/stock, TN, SOC stratification ratio (SOC SR), and SOCS contribution between slope aspects and among land-use types. The least significant difference test was applied to multiple comparisons of the means, and p < 0.05 represented significance. One-dimensional linear regression was used to determine the relationship between SWC and RFC. In R4.2.2, generalized mixed-effects models [22] were employed to calculate the contribution of SOC content variations explained by the variables present on both slopes. The altitude gradient (200 m interval) was used as a random factor, and the remaining variables were fitted as fixed factors.

3. Results

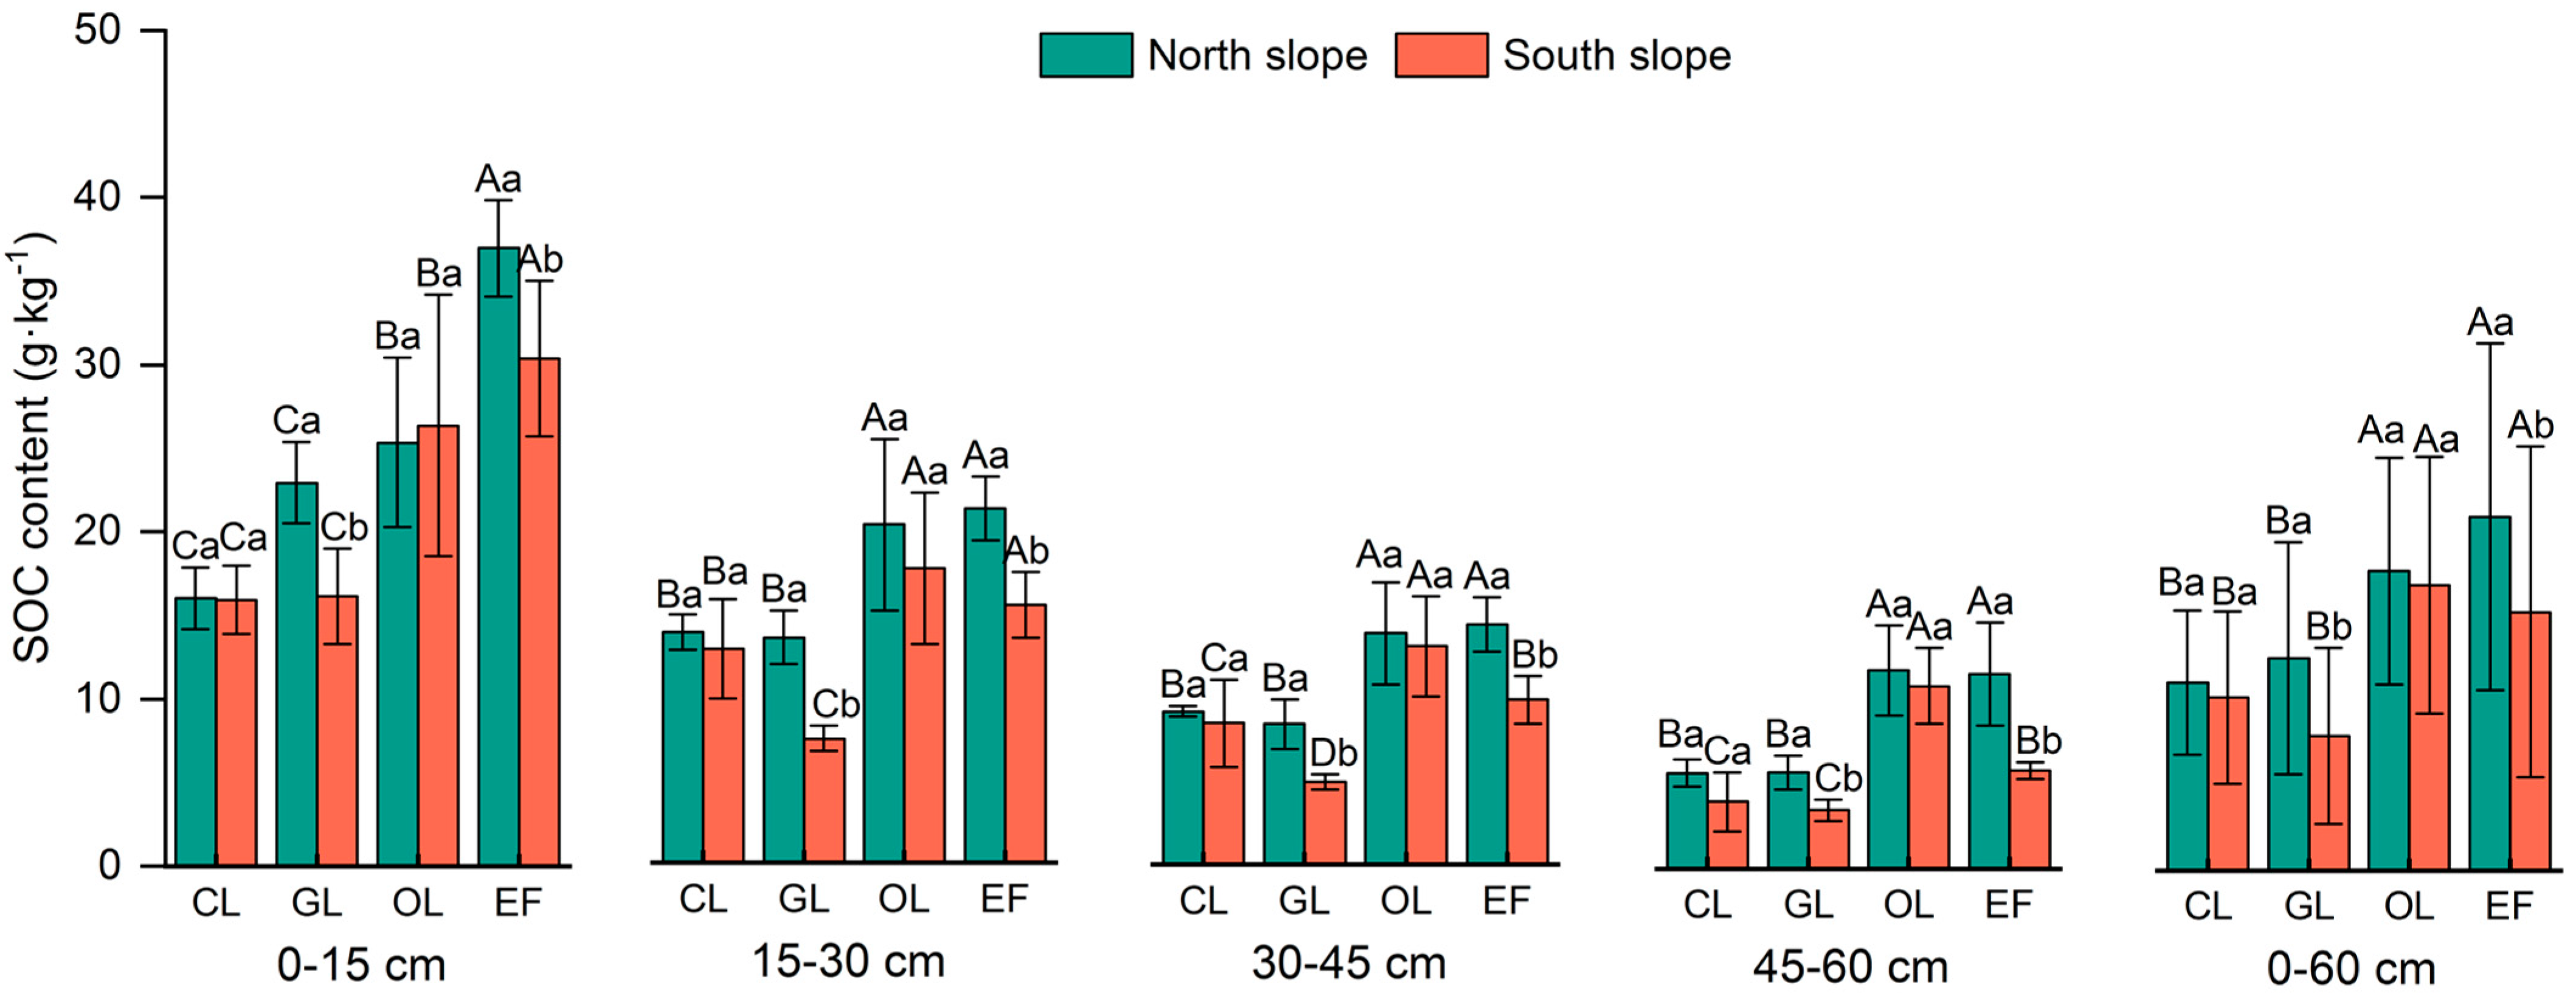
3.1. SOC Content and Its Stratification Ratio

Differences in SOC content among land-use types and soil depths, and between slope aspects are significant (Figure 2). The order of SOC contents at the 0–15 cm depth level was EF > OL > GL > CL (p < 0.05), with values of 33.7, 25.9, 19.6, and 16.0 g·kg−1, respectively. The SOC contents among all land-use types reduced when soil depth increased. EF’s SOC content drastically decreased with increasing depth in the 0–30 cm layer, followed by GL, OL, and CL. At the 45–60 cm depth level, SOC contents followed the order OL > EF > CL ≈ GL (p < 0.05), with 11.4, 8.8, 4.9, and 4.6 g·kg−1, respectively. At the 0–60 cm depth level, SOC contents were significantly higher in EF (18.5 g·kg−1) and OL (17.6 g·kg−1) than in CL (10.6 g·kg−1) and GL (10.5 g·kg−1). The SOC contents in GL and EF were significantly higher on the northern slope than on the southern one, and those in CL and OL were not different between slopes. In contrast, SOC contents were characterized by lower topsoil (0–15 cm) and higher subsoil (45–60 cm) in orchards, higher topsoil and lower subsoil in eco-forests, and both low topsoil and low subsoil in grasslands and croplands. These results indicate that eco-forests and orchards are ideal carbon sequestration options for these four land-use types; compared to eco-forests, orchards have the advantage of sequestering carbon in the subsoil and demonstrate a disadvantage in the topsoil.
The stratification ratio of SOC content (SOC SR) is a reliable way to assess soil functionality. A higher value implies less soil disturbance and stronger carbon sequestration in the topsoil. SOC SR values differed among land-use types and between slope aspects (Table 2). SOC SR1, SR2, SR3, and SRM were greater in GL and EF than in OL and CL. They increased with soil depth (p < 0.05). On average, GL had the highest SOC SR, followed by EF and CL, and intensively managed OL had the least, with the values of 3.2, 3.0, 2.2, and 1.9, respectively. SOC SR values for each land type were higher on the southern slope than on the northern one, although not statistically significant. It suggests that the impact of current management practices on the surface SOC sequestration in OL is uncertain or unfavorable.

3.2. SOC Stocks and Sequestration

The differences in SOC stocks among land-use types varied considerably across soil horizons (Figure 3). At the 0–15 cm depth level, the order of SOC stocks was EF > OL > GL > CL; at 15–30 cm, EF ≈ OL > CL ≥ GL; at 30–45 cm, OL > EF > CL > GL; at 45–60 cm, OL > EF > GL ≈ CL. It is clear that, in the surface layer (0–15 cm), SOC stocks were higher in EF than in OL, GL, and CL; in the bottom layer (45–60 cm), SOC stocks were higher in OL than in other land types. Total SOC stocks (0–60 cm depth) in EF, OL, GL, and CL on the northern slope were 98.11 Mg ha−1, 92.56 Mg ha−1, 57.32 Mg ha−1, and 54.53 Mg ha−1, respectively, while those on the southern slope were 86.76 Mg ha−1, 94.89 Mg ha−1, 49.98 Mg ha−1, and 51.57 Mg ha−1, respectively. Total SOC stocks were higher in EF and OL than in GL and CL on both slopes, with no differences between EF and OL or between GL and CL; those in GL and EF were significantly higher on the northern slope than on the southern one, while those in CL and OL did not differ between these slopes. These results again demonstrate that EF and OL are ideal for capturing SOC, while CL and GL are not, considering the entire soil profile.
Regarding the contribution of SOC stocks at different soil horizons to total SOC varied across land-use types (Table 3), at the 0–15 cm depth level, it was above 40% for GL and EF and between 27 and 35% for OL and CL, with GL and EF contributing more than OL and CL (p < 0.05). The contribution decreased with increasing soil depth and the pattern was reversed among the land types. At depths of 45–60 cm, OL contribution was in the 16–20% range and was significantly higher than 10–15% of the other land-use types. Regarding slope aspects, at the 0–15 cm depth level, all land-use types contributed more to total SOC stocks on the southern slope than did those on the northern one. The contribution pattern tended to reverse with increasing soil depth. At the 45–60 cm depth level, the southern slope areas contributed less than the northern ones, except for GL. These results suggest that it is realistic and feasible to enhance weak carbon sequestration in the topsoil of OL by optimizing management activities.

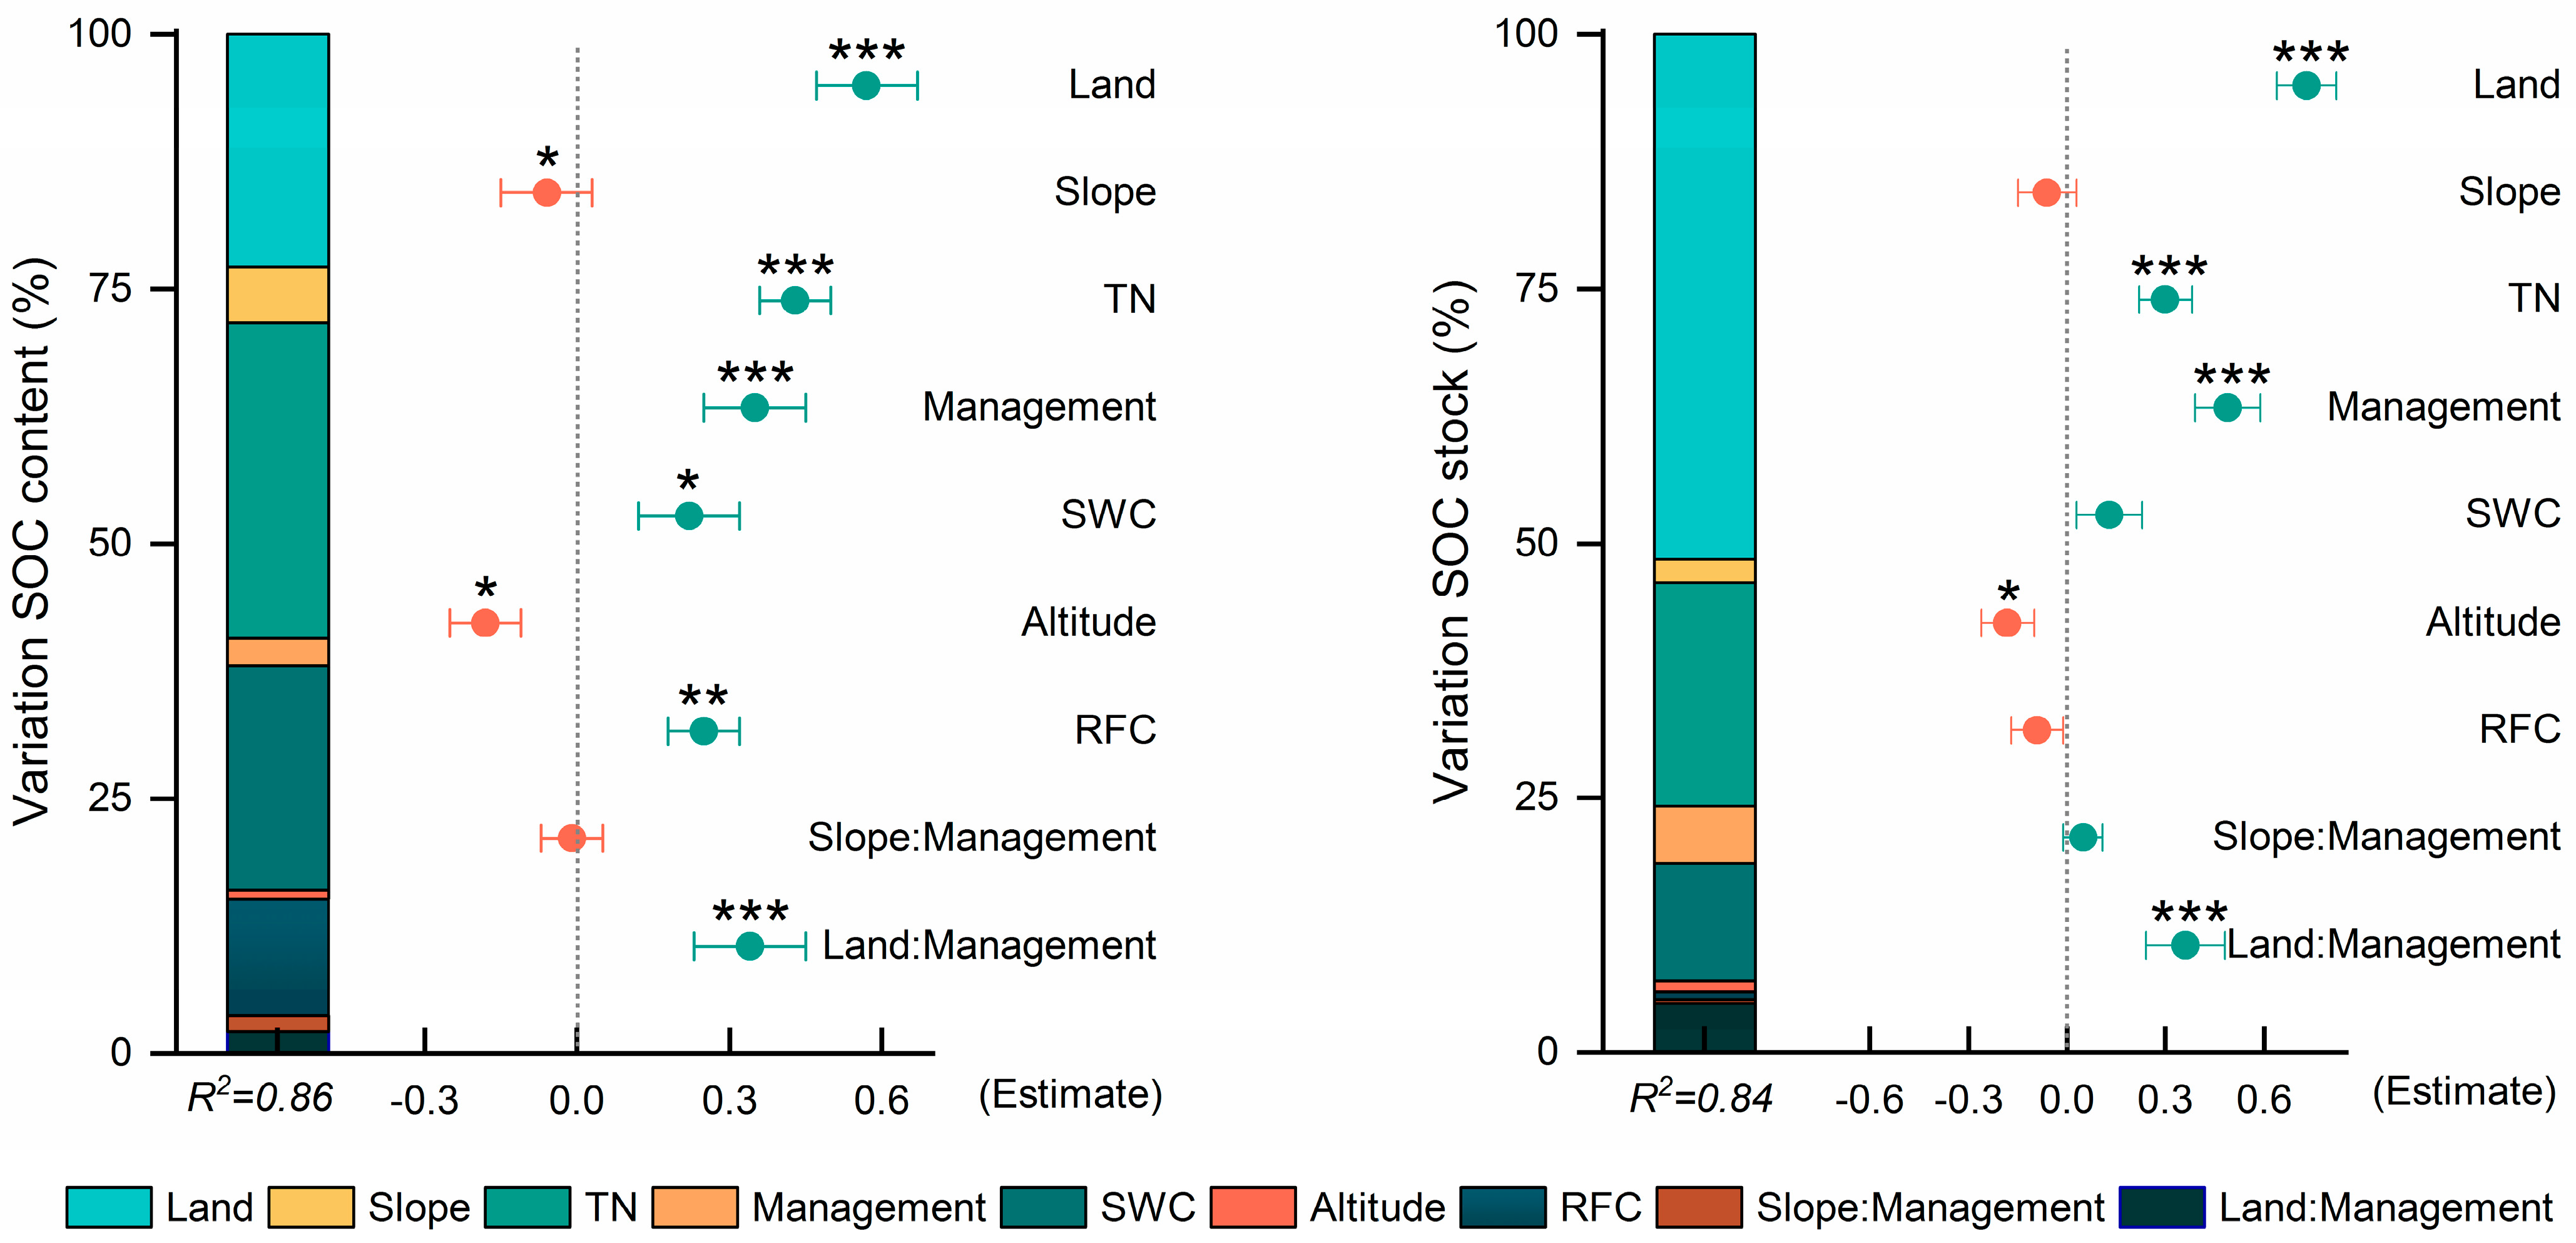
3.3. Factors Influencing SOC Distribution

The correlations between the studied factors and the SOC were various (Table 4). Land-use type, SWC, and TN were positively associated with SOC contents/stocks on both the northern and southern slopes. Management practices were significantly correlated with SOC content. The RFC was negatively correlated with SOC stock. The SWC increased with RFC and elevation, displaying a strong positive correlation.
Land-use type contributed the most to SOC changes (SOC content: 22.8%, SOC stock: 51.6%), followed by TN (SOC content: 31.0%, SOC stock: 22.1%), SWC (SOC content: 22.1%, SOC stock: 11.6%), RFC (SOC content: 11.4%, SOC stock: 0.8%), slope aspect (SOC content: 5.5%, SOC stock: 2.2%), management (SOC content: 2.6%, SOC stock: 5.6%), land-use type: management (SOC content: 2.2%, SOC stock: 4.8%), slope aspect: management (SOC content: 1.5%, SOC stock: 0.4%), and altitude (SOC content: 0.8%, SOC stock: 1.0%) (Figure 4). The effects of the land-use type: management interaction on SOC variation was significant, while that of the slope aspect: management interaction on SOC variation was not. This suggests that SOC distribution is the result of a combination of factors, such as land-use type, slope orientation, and management activities.

4. Discussion

4.1. Differences in SOC Distribution between Eco-Forests and Orchards

In the arid mountainous region of the Eastern Tibetan Plateau, the SOC content at the 0–30 cm depth level in the eco-forests of this study (age: 21 years; altitude: 2300–2400 m) was 29.1 g kg−1, which is very close to that in the eco-forests studied by Liu [3] (age: 16 years; altitude: 1000 m), at 28.3 g kg−1, but much higher than that in the ones described by Wang [9] (age: 10 years; altitude: 2220 m), at 13.5 g kg−1. The reason for the inconsistency of these values should be related to tree age and elevation. During the early stage of afforestation (10–15 years), the original vegetation in the land disappears, and the detritus and root biomass of the newly planted trees are minimal, providing little recharge to soil carbon [23]. Thus, SOC content is elevated very slowly or even declines. This explains the low SOC content or even degradation in eco-forests as reported by Wang et al. in the middle and late stages of afforestation (after 15 years), with the vegetation’s primary productivity and cover increasing, above- and below-ground biomass and soil physicochemical properties improving, and SOC content beginning to increase significantly [24]. This process explains the significant increase in SOC content in eco-forests observed in this study. In arid zones, moisture is vital for terrestrial ecosystems. Eco-forests within higher altitudes have better soil moisture conditions and higher vegetation productivity, providing plenty of carbon sources (detritus, roots) in the soil. Its temperatures are lower (frozen earth occurs in winter), thus reducing SOC decomposition [25]. Therefore, the higher tree age and elevation for the eco-forests in this study area are significant reasons for their higher soil carbon content than those recorded in other studies.
The SOC content at the 0–30 cm depth in orchards (plum, apple, and cherry trees) in this study area was 22.8 g·kg−1, which was 15.2% higher than that of orchards (pear and apple trees) studied by Liu [3], at 19.8 g·kg−1, and 39.9% higher than that in economic forests (pepper tree) in the study of Wang [9] at 16.3 g·kg−1. In addition to the tree age mentioned above, the reason for the inconsistency of these values is also related to the tree species. Plant detritus and roots among land-use types can affect SOC distribution [26]. For example, richer plant detritus of deciduous broadleaf trees, such as cherry, plum, and apple trees, results in significantly higher SOC stocks at a 0–20 cm soil depth [24] and more developed root systems [27], which can provide more carbon sources to the soil. Pepper trees are deciduous shrubs with less litter and shallower root systems, which provide less carbon to the soil [3]. In pepper plantations with higher SOC mineralization rates [4], SOC accumulation is slower. Management practices on different land types affect SOC accumulation [28]. For example, farmers in this study area prefer to invest more (fertilizer and irrigation water) in cherry, plum, and apple orchards than in pepper orchards, due to the comparative economic advantage. Therefore, orchard soils can be replenished with water and nutrients such as nitrogen, phosphorus, and potassium, improving the soil pH and microbial environment and facilitating SOC accumulation [29].
In arid mountainous areas, SOC levels are higher on shady slopes, due to higher soil moisture content, than on sunny slopes [30,31,32]. In our study, although the eco-forests followed this rule, the orchards (containing cherry, plum, and apple trees) did not show the same one, but differences were non-significant between the northern and southern slopes. In arid valleys, moisture is a vital factor in agroforestry ecosystems and the formation of differences in SOC between shady and sunny slopes. Without an irrigation water source, orchard SOC should be higher on shady slopes than on sunny slopes. Under irrigated conditions, the physiological water deficit in orchards on a sunny slope is relieved, crop primary productivity is enhanced [33], and the SOC level is increased [34]. Thus, irrigation reduces the difference in SOC levels in orchards on shady and sunny slopes by augmenting soil moisture in orchards on sunny slopes. It is well known that SOC decomposition is faster on warmer sunny slopes, which discourages soil carbon sequestration. However, in sunny-sloped orchards, abundant sunlight produces more photosynthetic products (vegetative primary productivity), and lower soil moisture (over the long term, excluding periods of irrigation) slows down SOC decomposition, which offsets the carbon loss caused by faster SOC decomposition due to higher temperatures on sunny slopes [35]. Thus, irrigation is the main factor contributing to the non-significant difference in soil carbon between shaded and sunny slopes.

4.2. Effects of Management Practices on SOC Sequestration in Orchards

Some studies showed that, at all soil depths, carbon sequestration capabilities in forest lands were higher than those in orchard lands in arid areas [36,37]. In this study, although surface (0–15 cm) SOC sequestration in orchards was lower than in eco-forests, it was higher in subsoils (45–60 cm). This phenomenon should correlate with orchard management practices, including plowing, irrigation, fertilization, and soil gravel removal. (1) As a result of plowing in orchards every spring, the topsoil aggregate structure that protects SOC is destroyed, resulting in faster SOC mineralization [38,39]. Poorly covered or bare soil surfaces are more vulnerable to surface runoff erosion, increasing carbon loss [40]; moreover, these soils tend to experience higher temperatures during the daytime, which, together with the frequent foehn winds that occur in this region [4], lead to faster surface SOC decomposition. (2) Soil hydrologic changes caused by flood irrigation water application and downward infiltration prompt deep SOC sequestration [14,41]. Repeated wetting and drying during irrigation can enhance water-holding capacity and water infiltration by altering cohesion and fragmentation processes in the soil to promote the formation of water-stabilized micro-aggregates [42]. Increased water infiltration can promote SOC accumulation and sequestration in deeper layers by transferring soluble carbon downward vertically, where it can be readily absorbed by unsaturated soil particles [43]. (3) Moderate gravel contributed to SOC sequestration by altering soil hydrological processes, structure, and chemical elements during dry conditions [44,45]. Under tilling and irrigation, the soil pore structure optimized by gravels facilitates surface organic matter to migrate downward [19], thus enhancing carbon accumulation in the subsoil of the orchards. The importance of gravel in maintaining soil fertility in arid zones is also evidenced in an old Qiang proverb, “A stone is equivalent to four taels of oil”.
Whether flood irrigation is responsible for the weaker surface SOC sequestration of orchards in this region is uncertain. Some studies observed that flood irrigation inhibited microbial activity and reduced soil organic matter decomposition rates, thereby increasing surface SOC stocks [46,47]. However, a study showed that flood irrigation weakened surface SOC sequestration in seven-year experimental irrigation [41]. Moreover, the effect of management on SOC in this study was studied as the combined effect of activities such as tilling, irrigation, gravel content, and fertilization on SOC, rather than the effect of irrigation alone on SOC. Therefore, a precise understanding of the role of management in carbon balance requires studying and elucidating the effects of irrigation independently on surface SOC carbon sequestration.
It is well known that, in arid zones, the right amount of gravel promotes SOC accumulation, while too many stones reduce soil carbon sequestration by decreasing fine soil volume. So, what is the range of the appropriate amount of soil gravel? Wang et al. [48] found the highest SOC stocks under 40–50% gravel cover in the cold and arid desert of the Northwest Tibetan Plateau; Han et al. [49] found that rock fragment contents (5–55%) in orchards positively correlated with SOC contents in dry valleys in western Sichuan, China. Farmers in this region varied widely in their understanding of the appropriate range of soil gravels (soil in some orchards contained 36.8% gravel, while others contained only 11.8%; see Table 1). It is then urgent to determine the threshold of gravel content corresponding to optimal soil carbon sequestration in this region.

5. Conclusions

SOC contents in topsoil (0–30 cm) were ordered as EF (26.3 g·kg−1) > OL (22.6 g·kg−1) > GL (15.4 g·kg−1) ≈ CL (14.6 g·kg−1); at subsoil (45–60 cm), the order was OL (12.6 g·kg−1) > EF (10.7 g·kg−1) > CL (6.7 g·kg−1) ≈ GL (5.8 g·kg−1). This indicates that SOC contents were characterized by lower topsoil and higher subsoil in orchards, higher topsoil and lower subsoil in eco-forests, and low topsoil and subsoil in grasslands and croplands. Total SOC stocks (0–60 cm depth) in EF, OL, GL, and CL were 92.4 Mg ha−1, 93.7 Mg ha−1, 53.7 Mg ha−1, and 53.1 Mg ha−1, respectively. The contributions of SOC stocks at the 0–15 cm soil depth level to the total SOC were above 40% for GL and EF and between 27 and 35% for OL and CL; at 45–60 cm, the contribution of OL was in the 16–20% range and was significantly higher than 10–15% of the other land-use types. This demonstrates that EF and OL are ideal for capturing SOC, considering the entire soil profile; OL has poor carbon sequestration in topsoil, but a superior one in subsoil. Therefore, we recommend the construction of a vertical agricultural structure of orchards at lower altitudes (2200 m) and eco-forests at higher altitudes (>2200 m) in arid mountainous regions; optimized management practices are required to enhance carbon sequestration in orchard topsoil.

Supplementary Materials

The following supporting information can be downloaded at: https://www.mdpi.com/article/10.3390/su152014721/s1, Figure S1: Vegetables inter-planted in orchards. (a) After plowing and removing gravel, prepare for fertilizer and seeding; (b) seedlings grow in half a month; (c) vegetables can be harvested in a month and a half. Figure S2 Altitude distribution of soil samples on the north and south slopes. (Notes: CL, cropland; GL, grassland; OL, orchard land; EF, eco-forest).

Author Contributions

Conceptualization, methodology, formal analysis, investigation, resources, and writing—original draft, Y.H.; methodology, formal analysis, writing—review and editing, and project administration, Q.W.; investigation and funding acquisition, F.L.; visualization and funding acquisition, Y.G.; supervision and funding acquisition, S.S.; investigation and visualization, G.L.; software and data curation, Y.Z. All authors have read and agreed to the published version of the manuscript.

Funding

This work was supported by the Key R&D Project of Sichuan Province, China (grant No. 2021 YFN0125); the Sichuan Science and Technology Program (grant No. 2020 YFH0120); and the Natural Science Foundation of the Southwest University of Science and Technology (grant No. 18 zx7117).

Institutional Review Board Statement

Not applicable.

Informed Consent Statement

Not applicable.

Data Availability Statement

Not applicable.

Conflicts of Interest

The authors declare no conflict of interest.

References

  1. Wang, Q.; Shi, M.Q.; Guo, Y.L.; Zhang, Y. The vertical differentiation of the mountain settlement niche in the upper reaches of Minjiang River. Acta Geogr. Sin. 2013, 68, 1559–1567, (In Chinese with English Abstract). [Google Scholar]
  2. Li, A.N.; Wang, A.S.; Liang, S.L.; Zhou, W.C. Eco-environmental vulnerability evaluation in mountainous region using remote sensing and GIS—A case study in the upper reaches of Minjiang River, China. Ecol. Model. 2006, 192, 175–187. [Google Scholar] [CrossRef]
  3. Liu, S.L.; Dong, Y.H.; Cheng, F.Y.; Yin, Y.J.; Zhang, Y.Q. Variation of soil organic carbon and land use in a dry valley in Sichuan province, Southwestern China. Ecol. Eng. 2016, 95, 501–504. [Google Scholar] [CrossRef]
  4. Lv, C.; Saba, T.; Wang, J.; Hui, W.; Liu, W.; Fan, J.; Wu, J.; Liu, X.; Gong, W. Conversion effects of farmland to Zanthoxylum bungeanum plantations on soil organic carbon mineralization in the arid valley of the upper reaches of Yangtze River, China. PLoS ONE 2022, 17, e0262961. [Google Scholar] [CrossRef]
  5. Kan, Z.R.; Liu, W.X.; Liu, W.S.; Lai, R.; Dang, Y.P.; Zhao, X.; Zhang, H.L. Mechanisms of soil organic carbon stability and its response to no-till: A global synthesis and perspective. Glob. Change Biol. 2022, 28, 693–710. [Google Scholar] [CrossRef] [PubMed]
  6. Zhao, Q.Z.; Shi, P.; Li, P.; Li, Z.B.; Min, Z.Q.; Sun, J.M.; Cui, L.Z.; Niu, H.B.; Zu, P.J.; Cao, M.H. Effects of vegetation restoration on soil organic carbon in the Loess Plateau: A meta-analysis. Land Degrad. Dev. 2023, 34, 2088–2097. [Google Scholar] [CrossRef]
  7. You, M.; Zhu-Barker, X.; Hao, X.X.; Li, L.J. Profile distribution of soil organic carbon and its isotopic value following long term land-use changes. Catena 2021, 207, 105623. [Google Scholar] [CrossRef]
  8. Segura, C.; Navarro, F.B.; Jiménez, M.N.; Fernández-Ondoño, E. Implications of afforestation vs. secondary succession for soil properties under a semiarid climate. Sci. Total Environ. 2020, 704, 135393. [Google Scholar] [CrossRef] [PubMed]
  9. Wang, X.; Wang, X.; Huang, C.; Wang, Y. Characteristics of soil organic carbon and labile organic carbon under different land use types at forest—Drought valley ecotone in the upper reaches of Minjiang River. J. Soil Water Conserv. 2011, 25, 167–172. (In Chinese) [Google Scholar]
  10. Li, Y.G.; Liu, W.; Feng, Q.; Zhu, M.; Yang, L.S.; Zhang, J.T. Effects of land use and land cover change on soil organic carbon storage in the Hexi regions, Northwest China. J. Environ. Manag. 2022, 312, 114911. [Google Scholar] [CrossRef]
  11. Yang, K.Q.; Wang, K.; Zhang, X.Y.; Chang, X.F.; Bai, G.S.; Zheng, J.Y.; Wu, G.L. Change in soil water deficit and soil organic matter consumption over time in rain-fed apricot orchards on the semi-arid Loess Plateau, China. Agric. Ecosyst. Environ. 2021, 314, 107381. [Google Scholar] [CrossRef]
  12. Li, Y.; Liu, W.; Feng, Q.; Zhu, M.; Zhang, J.; Yang, L.; Yin, X. Spatiotemporal Dynamics and Driving Factors of Ecosystem Services Value in the Hexi Regions, Northwest China. Sustainability 2022, 14, 14164. [Google Scholar] [CrossRef]
  13. Abera, W.; Tamene, L.; Abegaz, A.; Hailu, H.; Piikki, K.; Söderström, M.; Girvetz, E.; Sommer, R. Estimating spatially distributed SOC sequestration potentials of sustainable land management practices in Ethiopia. J. Environ. Manag. 2021, 286, 112191. [Google Scholar] [CrossRef] [PubMed]
  14. Emde, D.; Hannam, K.D.; Most, I.; Nelson, L.M.; Jones, M.D. Soil organic carbon in irrigated agricultural systems: A meta-analysis. Glob. Change Biol. 2021, 27, 3898–3910. [Google Scholar] [CrossRef]
  15. Tetegan, M.; Korboulewsky, N.; Bouthier, A.; Samouëlian, A.; Cousin, I. The role of pebbles in the water dynamics of a stony soil cultivated with young poplars. Plant Soil 2015, 391, 307–320. [Google Scholar] [CrossRef]
  16. Johnson, D.W.; Walker, R.F.; Glass, D.W.; Miller, W.W.; Murphy, J.D.; Stein, C.M. The effect of rock content on nutrients in a Sierra Nevada forest soil. Geoderma 2012, 173–174, 84–93. [Google Scholar] [CrossRef]
  17. Zhang, F.F.; Wei, Y.N.; Bo, Q.F.; Tang, A.; Song, Q.L.; Li, S.Q.; Yue, S.C. Long-term film mulching with manure amendment increases crop yield and water productivity but decreases the soil carbon and nitrogen sequestration potential in semiarid farmland. Agric. Water Manag. 2022, 273, 107909. [Google Scholar] [CrossRef]
  18. Du, Z.Y.; Cai, Y.J.; Yan, Y.; Wang, X.D. Embedded rock fragments affect alpine steppe plant growth, soil carbon and nitrogen in the northern Tibetan Plateau. Plant Soil 2017, 420, 79–92. [Google Scholar] [CrossRef]
  19. Lai, X.M.; Zhu, Q.; Castellano, M.J.; Liao, K.H. Soil rock fragments: Unquantified players in terrestrial carbon and nitrogen cycles. Geoderma 2022, 406, 115530. [Google Scholar] [CrossRef]
  20. Paranychianakis, N.V.; Giannakis, G.; Moraetis, D.; Tzanakakis, V.A.; Nikolaidis, N.P. Crop Litter Has a Strong Effect on Soil Organic Matter Sequestration in Semi-Arid Environments. Sustainability 2021, 13, 13278. [Google Scholar] [CrossRef]
  21. Walkley, A.; Black, I.A. An examination of the degtjareff method for determining soil organic matter, and a proposed modification of the chromic acid titration method. Soil Sci. 1934, 37, 29–38. [Google Scholar] [CrossRef]
  22. Lai, J.; Zou, Y.; Zhang, S.; Zhang, X.; Mao, L. glmm.hp: An R package for computing individual effect of predictors in generalized linear mixed models. J. Plant Ecol. 2022, 15, 1302–1307. [Google Scholar] [CrossRef]
  23. Li, D.; Niu, S.; Luo, Y. Global patterns of the dynamics of soil carbon and nitrogen stocks following afforestation: A meta-analysis. New Phytol. 2012, 195, 172–181. [Google Scholar] [CrossRef] [PubMed]
  24. Hou, G.; Delang, C.O.; Lu, X. A meta-analysis of changes in soil organic carbon stocks after afforestation with deciduous broadleaved, sempervirent broadleaved, and conifer tree species. Ann. For. Sci. 2020, 77, 92. [Google Scholar] [CrossRef]
  25. Che, M.X.; Gong, Y.B.; Xu, M.J.; Kang, C.F.; Lv, C.; He, S.Q.; Zheng, J.K. Effects of elevation and slope aspect on the distribution of the soil organic carbon associated with Al and Fe mineral phases in alpine shrub–meadow soil. Sci. Total Environ. 2021, 753, 141933. [Google Scholar] [CrossRef]
  26. Liu, D.; Huang, Y.M.; An, S.S.; Sun, H.Y.; Bhople, P.; Chen, Z.W. Soil physicochemical and microbial characteristics of contrasting land-use types along soil depth gradients. Catena 2018, 162, 345–353. [Google Scholar] [CrossRef]
  27. Panchal, P.; Preece, C.; Peñuelas, J.; Giri, J. Soil carbon sequestration by root exudates. Trends Plant Sci. 2022, 27, 749–757. [Google Scholar] [CrossRef]
  28. Sofoulaki, E.; Tzanakakis, V.A.; Giannopoulos, G.; Kapellakis, I.; Kabourakis, E.; Chatzistathis, T.; Monokrousos, N. Different Contribution of Olive Groves and Citrus Orchards to Soil Organic Carbon Sequestration: A Field Study in Four Sites in Crete, Greece. Sustainability 2023, 15, 1477. [Google Scholar] [CrossRef]
  29. Liu, Q.; Xu, H.; Yi, H. Impact of Fertilizer on Crop Yield and C: N: P Stoichiometry in Arid and Semi-Arid Soil. Int. J. Environ. Res. Public Health 2021, 18, 4341. [Google Scholar] [CrossRef]
  30. Xue, R.; Yang, Q.; Miao, F.H.; Wang, X.Z.; Shen, Y.Y. Slope aspect influences plant biomass, soil properties and microbial composition in alpine meadow on the Qinghai-Tibetan plateau. J. Soil Sci. Plant Nutr. 2018, 18, 1–12. [Google Scholar] [CrossRef]
  31. Enescu, R.; Dincă, L.; Vasile, D.; Vlad, R. Does the Slope Aspect Influence the Soil Organic Matter Concentration in Forest Soils? Forests 2022, 13, 1472. [Google Scholar] [CrossRef]
  32. Lozano-García, B.; Parras-Alcántara, L.; Brevik, E.C. Impact of topographic aspect and vegetation (native and reforested areas) on soil organic carbon and nitrogen budgets in Mediterranean natural areas. Sci. Total Environ. 2016, 544, 963–970. [Google Scholar] [CrossRef] [PubMed]
  33. Hannachi, N.; Cocco, S.; Fornasier, F.; Agnelli, A.; Brecciaroli, G.; Massaccesi, L.; Weindorf, D.; Corti, G. Effects of cultivation on chemical and biochemical properties of dryland soils from southern Tunisia. Agric. Ecosyst. Environ. 2015, 199, 249–260. [Google Scholar] [CrossRef]
  34. Zhu, M.; Feng, Q.; Qin, Y.Y.; Cao, J.J.; Li, H.Y.; Zhao, Y. Soil organic carbon as functions of slope aspects and soil depths in a semiarid alpine region of Northwest China. Catena 2017, 152, 94–102. [Google Scholar] [CrossRef]
  35. De Moraes Sá, J.C.; Potma Gonçalves, D.R.; Ferreira, L.A.; Mishra, U.; Inagaki, T.M.; Ferreira Furlan, F.J.; Moro, R.S.; Floriani, N.; Briedis, C.; De Oliveira Ferreira, A. Soil carbon fractions and biological activity based indices can be used to study the impact of land management and ecological successions. Ecol. Indic. 2018, 84, 96–105. [Google Scholar] [CrossRef]
  36. Hammad, H.M.; Fasihuddin Nauman, H.M.; Abbas, F.; Ahmad, A.; Bakhat, H.F.; Saeed, S.; Shah, G.M.; Ahmad, A.; Cerdà, A. Carbon sequestration potential and soil characteristics of various land use systems in arid region. J. Environ. Manag. 2020, 264, 110254. [Google Scholar] [CrossRef]
  37. Liu, X.; Chen, D.T.; Yang, T.; Huang, F.R.; Fu, S.; Li, L.H. Changes in soil labile and recalcitrant carbon pools after land-use change in a semi-arid agro-pastoral ecotone in Central Asia. Ecol. Indic. 2020, 110, 105925. [Google Scholar] [CrossRef]
  38. Sepahvand, H.; Feizian, M.; Mirzaeitalarposhti, R.; Müller, T. Density separation of soil organic matter across three land uses in calcareous soils of Iran. Arch. Agron. Soil Sci. 2019, 65, 1820–1830. [Google Scholar] [CrossRef]
  39. Morugán-Coronado, A.; Linares, C.; Gómez-López, M.D.; Faz, Á.; Zornoza, R. The impact of intercropping, tillage and fertilizer type on soil and crop yield in fruit orchards under Mediterranean conditions: A meta-analysis of field studies. Agric. Syst. 2020, 178, 102736. [Google Scholar] [CrossRef]
  40. Liu, W.S.; Liu, W.X.; Kan, Z.R.; Chen, J.S.; Zhao, X.; Zhang, H.L. Effects of tillage and straw management on grain yield and SOC storage in a wheat-maize cropping system. Eur. J. Agron. 2022, 137, 126530. [Google Scholar] [CrossRef]
  41. Qi, Y.Q.; Li, J.; Deng, S.J.; Wang, J.; Zhang, Y.J.; Pei, H.W.; Shen, Y.J.; Hui, D.F.; Lambers, H.; Sardans, J.; et al. Long-term irrigation reduces soil carbon sequestration by affecting soil microbial communities in agricultural ecosystems of northern China. Eur. J. Soil Sci. 2022, 73, e13143. [Google Scholar] [CrossRef]
  42. Trost, B.; Prochnow, A.; Drastig, K.; Meyer-Aurich, A.; Ellmer, F.; Baumecker, M. Irrigation, soil organic carbon and N2O emissions. A review. Agron. Sustain. Dev. 2013, 33, 733–749. [Google Scholar] [CrossRef]
  43. Tautges, N.E.; Chiartas, J.L.; Gaudin, A.C.M.; O’Geen, A.T.; Herrera, I.; Scow, K.M. Deep soil inventories reveal that impacts of cover crops and compost on soil carbon sequestration differ in surface and subsurface soils. Glob. Change Biol. 2019, 25, 3753–3766. [Google Scholar] [CrossRef] [PubMed]
  44. Kosmas, C.; Moustakas, N.; Danalatos, N.G.; Yassoglou, N.J.C. The effect of rock fragments on wheat biomass production under highly variable moisture conditions in Mediterranean environments. Catena 1994, 1–2, 191–198. [Google Scholar] [CrossRef]
  45. Zheng, Y.; Chen, N.; Zhang, C.K.; Dong, X.X.; Zhao, C.M. Effects of Rock Fragments on the Soil Physicochemical Properties and Vegetation on the Northeastern Tibetan Plateau. Front. Environ. Sci. 2021, 9, 693769. [Google Scholar] [CrossRef]
  46. Guo, S.F.; Qi, Y.C.; Peng, Q.; Dong, Y.S.; He, Y.L.; Yan, Z.Q.; Wang, L.Q. Influences of drip and flood irrigation on soil carbon dioxide emission and soil carbon sequestration of maize cropland in the North China Plain. J. Arid. Land 2017, 9, 222–233. [Google Scholar] [CrossRef]
  47. Ning, D.F.; Zhang, Y.Y.; Qin, A.Z.; Gao, Y.; Duan, A.W.; Zhang, J.Y.; Liu, Z.G.; Zhao, B.; Liu, Z.D. Interactive effects of irrigation system and level on grain yield, crop water use, and greenhouse gas emissions of summer maize in North China Plain. Sci. Total Environ. 2023, 864, 161165. [Google Scholar] [CrossRef]
  48. Wang, X.D.; Liu, G.C.; Liu, S.Z. Effects of gravel on grassland soil carbon and nitrogen in the arid regions of the Tibetan Plateau. Geoderma 2011, 166, 181–188. [Google Scholar] [CrossRef]
  49. Han, Y.W.; Wang, Q.; Li, F.C.; Guo, Y.L.; Yan, W.P.; An, Y.D.; Bai, Y.P.; Yang, M.; Zheng, Y.T.; Hu, Q. The difference in soil organic carbon distribution between natural and planted forests: A case study on stony soils mountainous area in the Upper Min River Arid Valley, China. Soil Use Manag. 2023, 39, 147–160. [Google Scholar]
Figure 1. Locations of sampling sites in the study area.
Sustainability 15 14721 g001
Figure 2. Differences in SOC contents between slope aspects and among land-use types. (Different lowercase letters indicate significant differences in SOC contents between the northern and southern slopes in the same land-use type; different capital letters indicate significant differences in SOC contents among land-use types on the same slope aspect; p < 0.05).
Sustainability 15 14721 g002
Figure 3. Differences in SOC stock between slope aspects and among land-use types. (Different lowercase letters indicate significant differences between the northern and southern slopes of the same land type; different capital letters indicate significant differences among land types on the same slope aspect; p < 0.05).
Sustainability 15 14721 g003
Figure 4. The percentage of variation in SOC content and stock was explained by factors such as land-use type, slope aspect, TN, management, RFC, SWC, altitude, and the interactions between slope aspect and management, and land type and management. (Notes: estimates are standard regression coefficients of the factors; 95% confidence intervals; p-values of regression coefficients: * p < 0.05, ** p < 0.01, *** p < 0.001. Blue dots indicate a negative effect; red dots indicate a positive one. Land indicates land-use type).
Sustainability 15 14721 g004
Table 1. Survey summary of land-use types on the northern and southern slopes in the dry valley.
VariableDepth (cm)CroplandsOrchard LandsGrasslandsEco-Forests
N-SS-SN-SS-SN-SS-SN-SS-S
TN
(g·kg−1)
0–151.8 ± 0.2 Ba2 ± 0.3 Ba2.1 ± 0.6 Bb3 ± 0.7 Aa1.7 ± 0.3 Ba1.8 ± 0.5 Ba3 ± 0.5 Aa2.8 ± 0.3 Aa
15–301.3 ± 0.3 Aba1.4 ± 0.5 Aba1.6 ± 0.4 ABa1.9 ± 0.8 Aa1.2 ± 0.5 Ba1 ± 0.3 Ba1.8 ± 0.4 Aa1.1 ± 0.1 Abb
30–450.8 ± 0.2 ABa1 ± 0.2 Ba1.2 ± 0.4 Ab1.5 ± 0.4 Aa0.7 ± 0.2 Ba0.8 ± 0.3 Ba1.2 ± 0.3 Aa0.8 ± 0.2 Bb
45–600.6 ± 0.1 Ba0.8 ± 0.2 Ba1.1 ± 0.4 Ab1.4 ± 0.3 Aa0.5 ± 0.2 Ba0.7 ± 0.2 Ba0.9 ± 0.2 ABa0.6 ± 0.1 Bb
Mean1.1 ± 0.5 Bca1.3 ± 0.6 Ba1.5 ± 0.6 Abb1.9 ± 0.8 Aa1 ± 0.6 Ca1.1 ± 0.5 Ba1.7 ± 0.9 Aa1.3 ± 0.9 Bb
SWC
(%)
0–1520.5 ± 6.4 Ba7.8 ± 0.5 Cb19.7 ± 5.9 Ba12.6 ± 4.5 Bb17.1 ± 7.6 Ca10.2 ± 3.3 Cb27.3 ± 4.1 Aa17.4 ± 9.0 Ab
15–3019.6 ± 6.5 Ba11.5 ± 1.9 Bb16.2 ± 4.7 Ba11.3 ± 3.5 Bb11.1 ± 2.0 Ca7.9 ± 1.9 Cb23.4 ± 3.4 Aa13.1 ± 1.0 Ab
30–4514.6 ± 2.8 Ba10.4 ± 1.8 Bb15.8 ± 4.8 Ba11.6 ± 2.9 Bb10.4 ± 2.3 Ca7.9 ± 2.3 Ca20.5 ± 2.6 Aa14.1 ± 1.7 Aa
45–6013.9 ± 2.4 Ba9.4 ± 2.0 Bb14.9 ± 4.3 Ba11.3 ± 2.8 Bb9.2 ± 1.8 Ca6.8 ± 2.2 Ca17.9 ± 3.2 Aa13.5 ± 1.6 Aa
Mean17.2 ± 5.2 Ba9.8 ± 2.1 Bb16.6 ± 5.2 Ba11.7 ± 3.4 Bb12.0 ± 5.0 Ca8.2 ± 2.6 Cb22.3 ± 4.8 Aa14.5 ± 4.6 Ab
RFC
(%)
0–1518.2 ± 4.5 Ca11.8 ± 2.6 Bb30.9 ± 12.9 Ba22.8 ± 8.5 Ab31.1 ± 8.3 Ba21.5 ± 15.1 Ab37.3 ± 8.9 Aa19.5 ± 11.3 Ab
15–3028.5 ± 6.0 Ba16.9 ± 3.4 Ab27.9 ± 13.6 Ba16.9 ± 7.5 Ab38.3 ± 11.6 Aa13.6 ± 5.5 Ab40.4 ± 8.0 Aa16.9 ± 5.5 Ab
30–4531.4 ± 1.4 Ba26.8 ± 6.6 Ab32.5 ± 15.1 Ba26.4 ± 6.9 Aa38.4 ± 18.9 Aa26.8 ± 9.5 Ab45.8 ± 6.1 Aa26.0 ± 4.0 Ab
45–6036.8 ± 3.8 Ba23.3 ± 1.7 Ab30.8 ± 13.5 Ba31.8 ± 9.4 Aa50.8 ± 6.8 Aa25.4 ± 11.4 Ab47.6 ± 7.0 Aa26.9 ± 3.2 Ab
Mean28.8 ± 8.0 Ba19.7 ± 7.0 Ab30.5 ± 13.7 Ba24.5 ± 9.6 Ab39.7 ± 13.4 Aa21.8 ± 11.1 Ab42.8 ± 8.2 Aa22.3 ± 7.6 Ab
Altitude (m)--1500–22001600–24001500–22001600–24001500–22001600–24002200–25002400–2800
Age (year)-->30>30212121212121
Notes: N-S, northern slope; S-S, southern slope; TN, soil total nitrogen content; SWC, soil water content; RFC, rock fragment content; “--”, non-existent. Different lowercase letters (a > b) represent statistically significant differences between the northern and southern slopes at the same soil depth, p < 0.05; different capital letters (A > B) represent statistically significant differences in different land-use types at the same soil depth, p < 0.05.
Table 2. Differences in SOC RS among land-use types between the northern and southern slopes.
Land TypeCLGLEFOLLand TypeCLGLEF
Slope TypeN-SS-SN-SS-SN-SS-SN-SS-S
SOC RS11.2 ± 0.1 Ba1.3 ± 0.2 Ba1.7 ± 0.3 Ab2.2 ± 0.3 Aa1.8 ± 0.3 Aa2.0 ± 0.3 Aa1.3 ± 0.2 Ba1.5 ± 0.2 Ba
SOC RS21.7 ± 0.2 Ba2.0 ± 0.4 Ba2.8 ± 0.6 Aa3.2 ± 0.3 Aa2.6 ± 0.2 Ab3.1 ± 0.5 Aa1.9 ± 0.4 Ba2.0 ± 0.3 Ba
SOC RS32.8 ± 0.5 Bb4.3 ± 1.1 Aa4.0 ± 0.6 Aa4.7 ± 0.5 Aa3.3 ± 0.7 Bb5.2 ± 1.2 Aa2.2 ± 0.4 Ca2.4 ± 0.3 Ba
SOC RSM1.9 ± 0.8 Ba2.5 ± 1.5 Ba2.9 ± 1.1 Aa3.4 ± 1.1 Aa2.6 ± 0.8 Ab3.4 ± 1.6 Aa1.8 ± 0.5 Ba2.0 ± 0.5 Ba
Notes: N-S, northern slope; S-S, southern slope; SOC SR1, SR2, and SR3 represent the ratios of the SOC content at the 0–15 cm depth level to the SOC content at 15–30 cm, 30–45 cm, and 45–60 cm depth levels, respectively; SOC RSM is the mean of SOC SR1, SR2, and SR3. Different lowercase letters indicate significant differences in SOC SR between the northern and southern slopes in the same land-use type; different capital letters indicate significant differences in SOC SR among land-use types on the same slope aspect; p < 0.05.
Table 3. Contribution of SOC stocks at different soil depths to total SOC stocks.
Depth (cm)CLGLEFOLDepth (cm)CLGLEF
N-SS-SN-SS-SN-SS-SN-SS-S
0–1527.6 ± 1.2 Bb34.3 ± 4.4 Ba43.5 ± 6.8 Ab47.8 ± 3.4 Aa41.5 ± 4.8 Aa41.9 ± 4.6 Aa32.1 ± 3.8 Ba34.5 ± 3.2 Ba
15–3033.3 ± 2.7 Aa32.7 ± 1.7 Aa27.2 ± 6 Ba25.9 ± 1.1 Ba26.7 ± 4 Ba29.9 ± 3.6 ABa28.1 ± 4.1 Ba28.3 ± 1.9 ABa
30–4524.6 ± 0.3 Aa21.1 ± 3.2 Aa19.2 ± 4.6 ABa14.7 ± 1.5 Bb17.3 ± 2.4 Ba18.3 ± 1.3 ABa20.5 ± 2.9 ABa20.6 ± 2.4 Aa
45–6014.5 ± 1.8 Ba11.9 ± 2.3 Bb10.1 ± 1.5 Ca11.6 ± 1.3 Ba14.4 ± 4.3 Ba9.9 ± 1.2 Bb19.3 ± 3.4 Aa16.6 ± 1.5 Aa
Notes: Different lowercase letters indicate significant differences in the contribution between the northern and southern slopes in the same land-use type; different capital letters indicate significant differences in the contribution among land-use types on the same slope aspect; p < 0.05.
Table 4. Correlations between SOC content/stock and variables.
VariablesSOCCSOCSLandSlopeAltitudeManagementSWCTN
SOCS0.90 **
Land0.34 **0.46 **
Slope−0.19 **−0.10−0.18 **
Altitude0.030.01−0.100.27 **
Management0.810.14 *0.40 **0.060.35 **
SWC0.56 **0.43 **0.22 **−0.47 **0.23 **−0.02
TN0.84 **0.76 **0.27 **0.090.030.16 *0.39 **
RFC0.10−0.16 *0.05−0.40 **0.10−0.18 *0.37 **−0.05
Notes: SOCC, soil organic carbon content; SOCS, soil organic carbon stock; * indicates a significant difference under p < 0.05, ** under p < 0.01.
Disclaimer/Publisher’s Note: The statements, opinions and data contained in all publications are solely those of the individual author(s) and contributor(s) and not of MDPI and/or the editor(s). MDPI and/or the editor(s) disclaim responsibility for any injury to people or property resulting from any ideas, methods, instructions or products referred to in the content.

