Article

The Impact of Digitization to Ensure Competitiveness of the Ha’il Region to Achieve Sustainable Development Goals

1
Department of Business Administration, Applied College, Ha’il University, P.O. Box 2440, Ha’il 55424, Saudi Arabia
2
Department of Computer Science, Applied College, Ha’il University, P.O. Box 2440, Ha’il 55424, Saudi Arabia
3
Department of Economics and Finance, College of Business and Economics, Qassim University, P.O. Box 6640, Buraidah 51452, Saudi Arabia
*
Author to whom correspondence should be addressed.
Sustainability 2023, 15(2), 1661; https://doi.org/10.3390/su15021661
Submission received: 11 November 2022 / Revised: 2 January 2023 / Accepted: 10 January 2023 / Published: 14 January 2023
(This article belongs to the Section Environmental Sustainability and Applications)

Abstract

:
The Kingdom of Saudi Arabia is one of the countries that seek to achieve sustainable development through Vision 2030. The objective of this research is to study the impact of digitization to ensure the competitiveness of the Ha’il region to achieve sustainable development goals. To do this, we applied two techniques in two steps. The first step is based on artificial intelligence through a machine learning technique. The second step is the vector auto-regressive model and impulse response functions. The results show that digitization has a strong impact on the achievement of five sustainable development goals in the Ha’il region. These five priority objectives among 17 goals have been determined by a machine learning technique, each of which is likely to contribute in one way or another to economic, social, and environmental aspects. The results suggest that digitization promotes the acceleration of sustainable development in the Ha’il region. This study is interesting for policymakers in Saudi Arabia to use artificial intelligence and digitalization to achieve economic unification of this region with other regions of the Kingdom.

1. Introduction

In recent years, as everything revolves around the mobile Internet, the Internet of Things, and big data, most countries in the world are striving to achieve sustainable development. This is a great challenge for them to ensure a better quality of life. Hence, it is important to understand the ultimate goals of sustainable development. In effect, these goals enable individuals, organizations, and societies to reach their full potential.
Today, with the evolution of technology, several techniques have appeared, such as deep learning, machine learning, and blockchain. These technologies have been introduced in socio-economic, environmental, sustainable, and climate research. Moreover, this progress in technology options increases the use of different digital applications to achieve sustainable development goals (SDGs) [1]. This creates a very competitive environment with modern technologies. Therefore, all countries around the world are accelerating toward achieving sustainable development. Filho et al. [2] defined the digitalization (DG) process as automation and the development of artificial intelligence. At the same time, other authors consider digitalization as the integration of digital technologies into worldwide life with different approaches, especially with artificial intelligence [3,4,5]. Therefore, Ha [6] noted that digitalization is digital connectivity, Internet use, electronic business, electronic commerce, and electronic government. The entry of digitization into all areas of our daily lives has accelerated the impact of this new technological innovation. Consequently, digitalization has direct impacts on the environment and societies [7]. This impact can be direct or indirect, depending on the degree of uncertainty [8]. Additionally, digitalization has a positive competitive advantage to realize more or less sustainable development [9].
Accordingly, sustainable development is an ambiguous concept that appeared in 1987 from the United Nations Commission in Brundtland. It was related to the paradigm of equilibrium between economic, social, and environmental objectives. However, the commission defined sustainable development as the development that meets the needs of today without jeopardizing the capacity of future generations to meet them. This definition revealed a paradox in the concept of sustainable development because it did not underline the environment while highlighting the human needs to be met through development. For this reason, there is no agreed-upon definition of sustainable development. Many researchers and investors maintained several definitions but always around the goals set by the United Nations, such as in [10,11]. The authors consider sustainable development as an economic-social process that can be maintained indefinitely. Kottmeyer [12] defines sustainable development as a concept that is difficult to implement due to the vagueness of the relationship between the economic budget and social and environmental goals. Furthermore, the General Assembly of the United Nations in 2015 redefined sustainable development based on the fundamental dimensions of achieving the objectives set by the 2030 plan. The new concept of sustainable development includes three fundamental goals, namely economic, social, and environmental dimensions to improving the well-being of the population, resumed in 17 goals (see Figure 1) and termed sustainable development goals.
Nevertheless, many researchers and policymakers have been interested in studying the relationship between sustainable development goals and digitalization. Some researchers have proved that digitalization is an essential factor in achieving sustainable development goals [13,14]. Other studies demonstrate that digitalization is a complementary factor to other goals, especially industry, innovation, and infrastructure, noted as SDG9 [15,16,17]. Based on qualitative and quantitative analyses, [18] examined the relationship between SDGs and the composite index to measure digitalization. The authors proved that it is an important indicator for measuring the capabilities of digitalization to determine achieving sustainable development goals. In the same context, several authors [16,19,20,21] found that digitalization is very important and has a positive impact on sustainable development goals.
In the same line, Bieser and Hilty [22] studied the innovative approaches and actions carried out by companies in the energy sector to see their relationship with digitization and Industry 4.0. The authors used a blockchain technique to show the importance of digitalization in determining the company’s management process. The results explained that digitization has gone well beyond the ranges for improving productivity, with the potential for cost improvements. From another perspective, Ciofi et al. [23] suggest that the uses of digital transformation represented by information and communication technology (ICT) have an indirect effect on different indicators of the economic, social, and environmental axes. This idea is also advocated by Neffati and Gouider [24], who argue that artificial intelligence, especially in machine learning techniques, is important to maintain sustainable development. Innovation creates competitiveness between countries and regions but not in the same way. Therefore, it is not enough to just keep innovating, the most important thing is to use technology appropriately to achieve goals. In this context, Table 1 illustrates some case studies on the relationship between sustainable development goals and digitalization.
The Kingdom of Saudi Arabia (KSA) is considered one of the pioneers in this field as it was a forerunner in this modern trend to achieve the main goals of Vision 2030; moreover, it is essential to increase competition among all its regions to achieve sustainable development. In this context, there are many factors for achieving sustainable development but it is new to link this process with digitalization. Consequently, its advantages and threats are not well understood. Certainly, the KSA has paid attention to the standards of comprehensive development in all fields to achieve these standards. For this reason, many initiatives and programs have been launched in all regions of the KSA to create competitiveness among them. Achieving competitive sustainable development for the KSA regions is a promising program that fully integrates with the main objective of developing economically, socially, and environmentally sustainable regions; however, achieving sustainable development according to international factors of sustainable standards requires adequate infrastructure and high quality of life.
To maintain regional sustainable development, the government is trying to adopt digitization in all fields, in the context of establishing a digital economy in line with the current industrial era that is moving towards digitization and artificial intelligence tools. Indeed, we find that some regions in the KSA, such as Riyadh and Makkah, started toward the goals of sustainable development. We find sustainable buildings or “green buildings”, which are operated in a resource-efficient manner according to digital technologies. The main objective is to lay the foundations with sustainable economic and social impacts.
In this regard, this work aims to study the impact of digitization to ensure the competitiveness of the Ha’il region to achieve sustainable development. Indeed, we used a machine learning technique to reveal the indicators that influence the achievement of sustainable development of all the United Nations member countries. In addition, using the vector auto-regressive (VAR) model and impulse response functions (IRFs) to study the relationship between sustainable development goals and digitalization.
This paper is organized as follows: Section 2 exposes an overview of the Ha’il region and presents the data and methodological frameworks for this research paper; Section 3 provides a discussion of the main results; and finally, the conclusion recapitulates the main results and proposes some recommendations.

2. Data and Methodology

Recall that the objective of this research is to study the impact of digitalization to ensure the competitiveness of the Ha’il region to achieve sustainable development. Therefore, this section is divided into three parts. In the first part, we advance an overview of the Ha’il region. In the second part, we present the method used to reveal the main indicators that influence sustainable development. This method is based on the machine learning technique and uses a database collected from the World Development Indicators (WDI) website (http://wdi.worldbank.org/tables (accessed on 16 May 2022)). In the third part, we start by filtering the sustainable development goals, among the 17 goals proposed by the United Nations, related to the indicators found in the second part. Then, we apply the VAR model and IRFs to study the impact of digitalization on these sustainable development goals in the case of the Ha’il region. This model and functions use a database collected from the official statistics of KSA (General Authority for Statistics, https://www.stats.gov.sa/en/6776 (accessed on 5 August 2022); General Authority for Statistics, Ha’il region, https://www.stats.gov.sa/en/230 (accessed on 5 August 2022); Communications Space and Technology Commission, https://www.cst.gov.sa/en/indicators/Pages/saudi_internet.aspx (accessed on 5 August 2022); Education Statistics and Decision Support Center, Ha’il region, https://departments.moe.gov.sa/Statistics/Educationstatistics/Pages/GEStats.aspx (accessed on 5 August 2022); City Prosperity Index, Ha’il region, https://saudiarabia.un.org/en/40076-city-prosperity-index-hail (accessed on 5 August 2022)).

2.1. Overview of the Ha’il Region

The KSA encourages the competitiveness of its different regions in the short- and long-term to overcome economic, social, and environmental problems. In this context, the KSA has applied several measures at the level of its different regions to achieve various sustainable development goals by 2030. In this direction, the KSA has sought to increase the competitiveness of its regions individually to ensure the success of its regions, and to that end, the cities will be developed. The KSA uses six key principles to ensure the success of the economic regions: the first is a development based on a globally competitive advantage; the second is to locate state-of-the-art ‘hard’ and ‘soft’ infrastructure; the third is to create opportunities for the private sector; the fourth is attracting core jobs; the fifth is attracting people; the sixth is a business-friendly environment.
In this context, the Ha’il authorities have developed a new logistics hub in the region with an investment of almost 8 billion USD and the creation of 55,000 new jobs. The following Figure 2 presents the different dimensions realized in the Ha’il region in 2019 and 2021. These are related to different dimensions such as: productivity, infrastructure development, environmental sustainability, equity and social inclusion, and quality of life. However, in KSA, the improvement of these dimensions depends on sustainable development goals. Figure 2 shows that there have been improvements in different levels of dimensions of the Ha’il region between 2019 and 2021.
Table 2 presents the values of some dimensions measuring the development of the prosperity profile of certain regions of Saudi Arabia. The results show that the values specific to the Ha’il region are competitive with other regions (especially the capital, Riyadh), and even exceed them in terms of the social infrastructure score. Similarly, the use of ICT (66.6%), Internet connectivity (78.5%), and social infrastructure (30.6%) are close to the other regions. In our research, we are interested in ICT and Internet connectivity in the Ha’il region.

2.2. Proposed Method for Reveal of the Main Indicators

In this section, we present our method to reveal the indicators with a positive influence on achieving sustainable development goals. The proposed method is based on an unsupervised machine learning technique. This technique allows the training of a machine learning system with only the unlabeled data elements [7,28,29,30,31,32,33]. Indeed, the proposed method is based on two pillars. The first pillar is the estimation of a subset (i.e., group) of indicators by a clustering technique (i.e., grouping subsets of indicators called data points) by similarity or distance [33]. The second pillar is to determine the best data points that have a positive influence to achieve sustainable development goals using a weighted Euclidean distance.
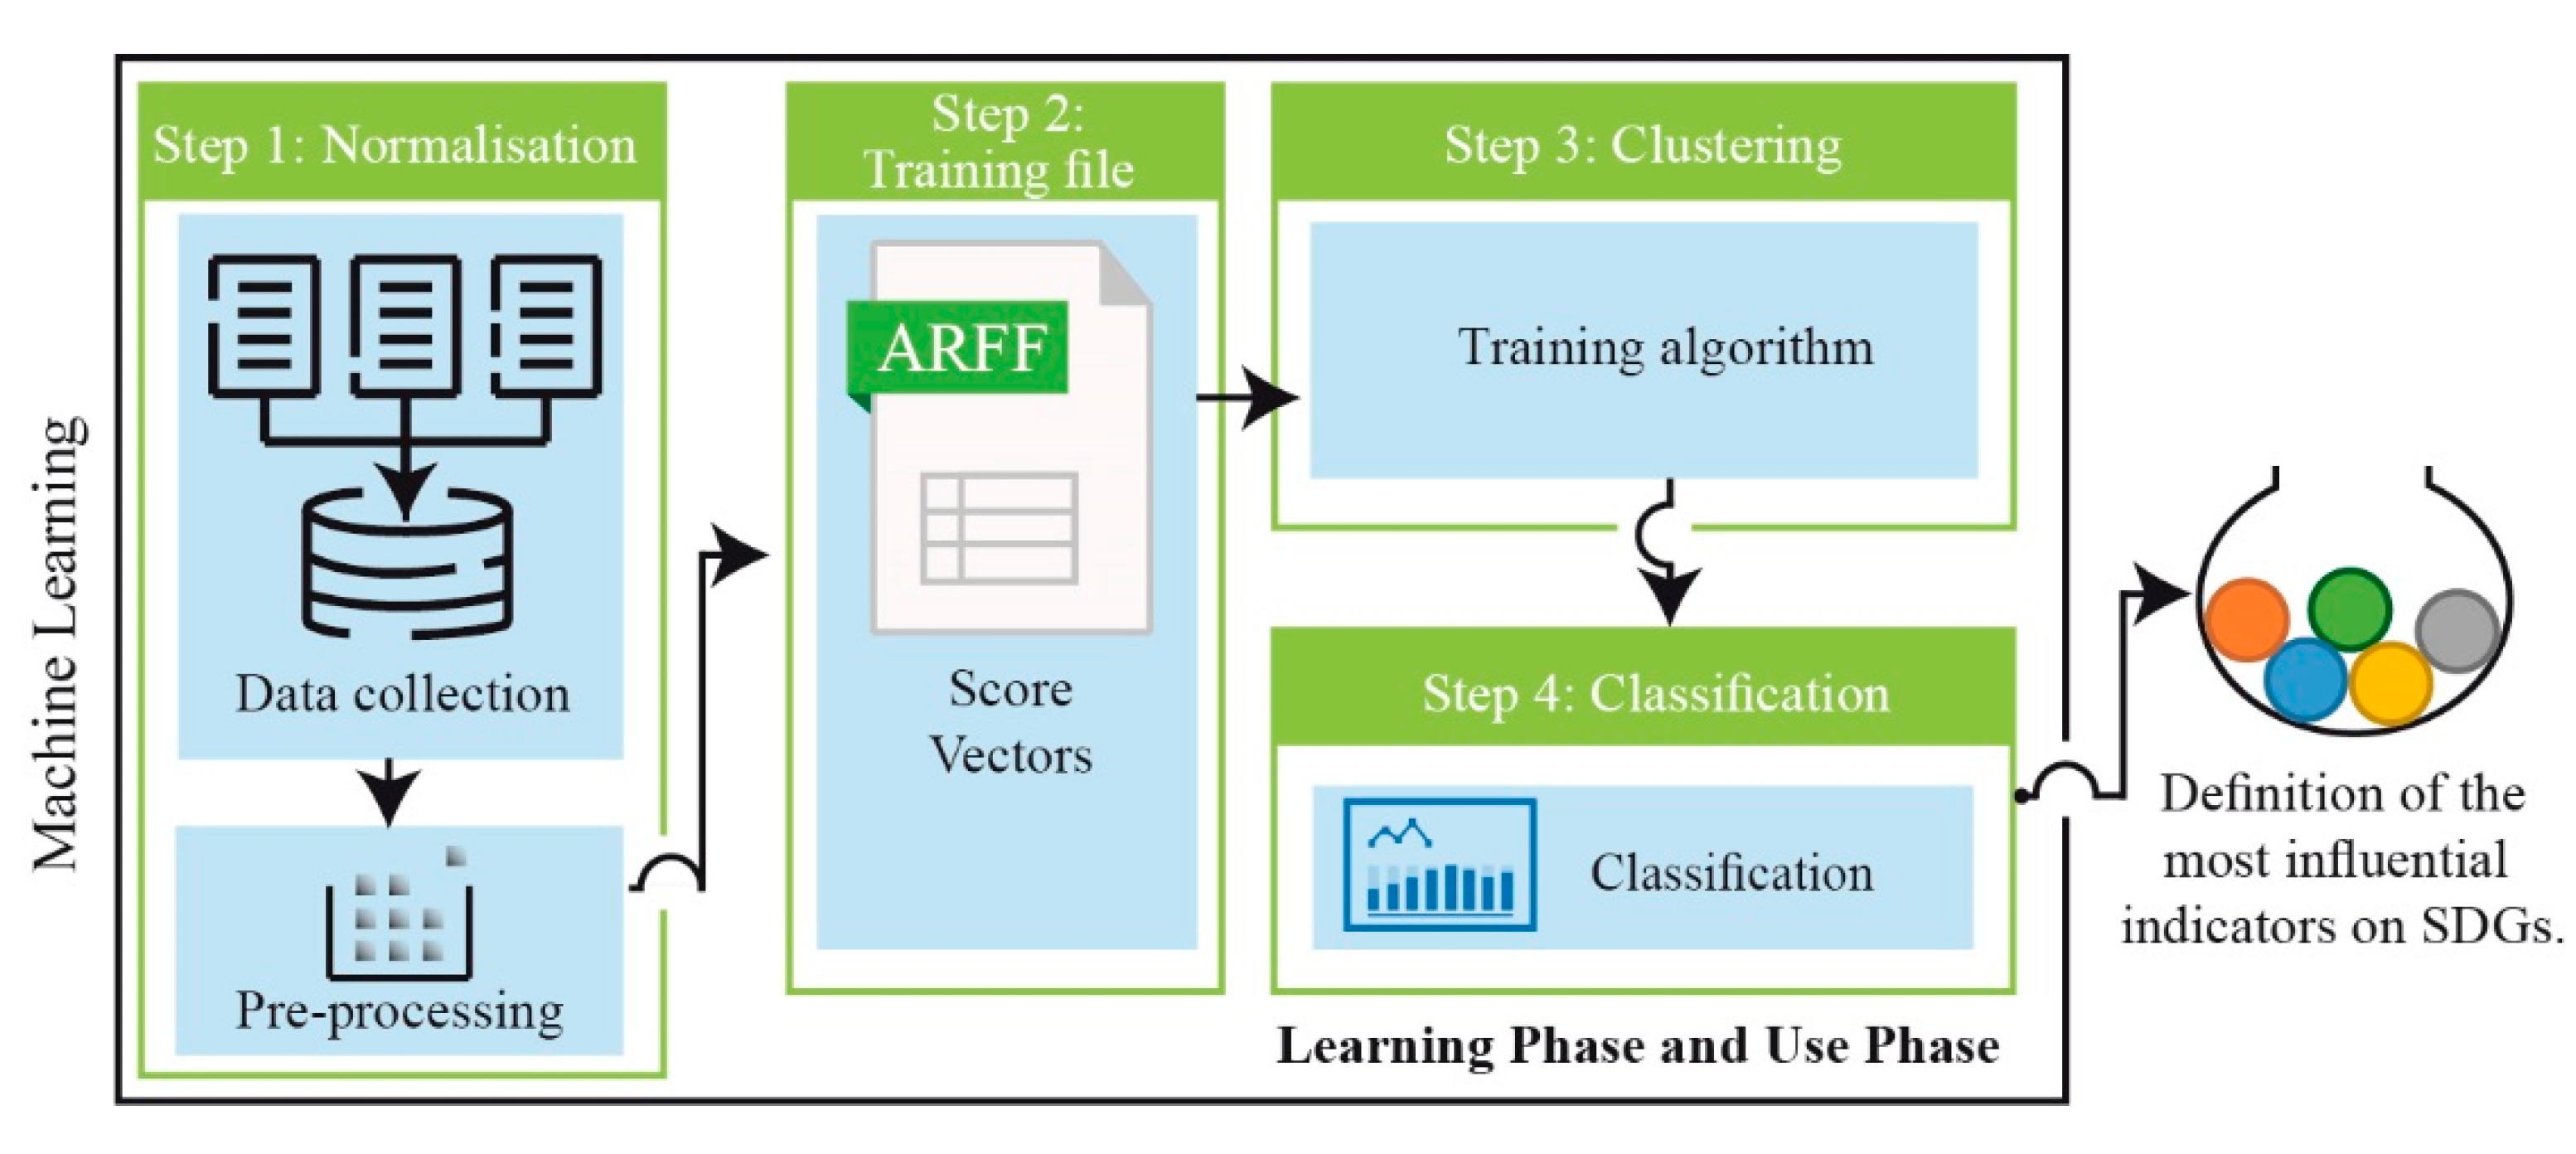
We programmed the proposed method in the Java programming language. The obtained result is a system with the architecture shown in Figure 3.
The proposed system is based on four steps. In the first step, a corpus of data collected from the WDI website is used. This corpus is built from 21,614 observations that were carried out in 214 member countries of the United Nations. It is structured around statistical calculations carried out on 101 indicators of 17 sustainable development goals (that is, each sustainable development goal has been assigned at least 6 indicators and 1284 observations).
Then, the corpus will undergo a pre-processing and a normalization phase, based on a resizing of the numerical variables so that they are comparable on a common scale. Thus, after the pre-processing phase, each indicator entity (i.e., each attribute) will be reported against some homogenized and normalized data.
The second step leads to the construction of a finite set of score vectors V corresponding to the values of the normalized indicators calculated and observed from the collected data [34]. We speak of a “vectorial description of the data”. This description will be the object of a data file (“.arff” file type) useful for the unsupervised machine learning phase. Recall that the data file is constructed from a finite set of score vectors, which have the following structure V = { v 1 , ,   v p } , such that v j ( x i ) denotes the normalized value of the indicators computed and observed in the 214 countries.
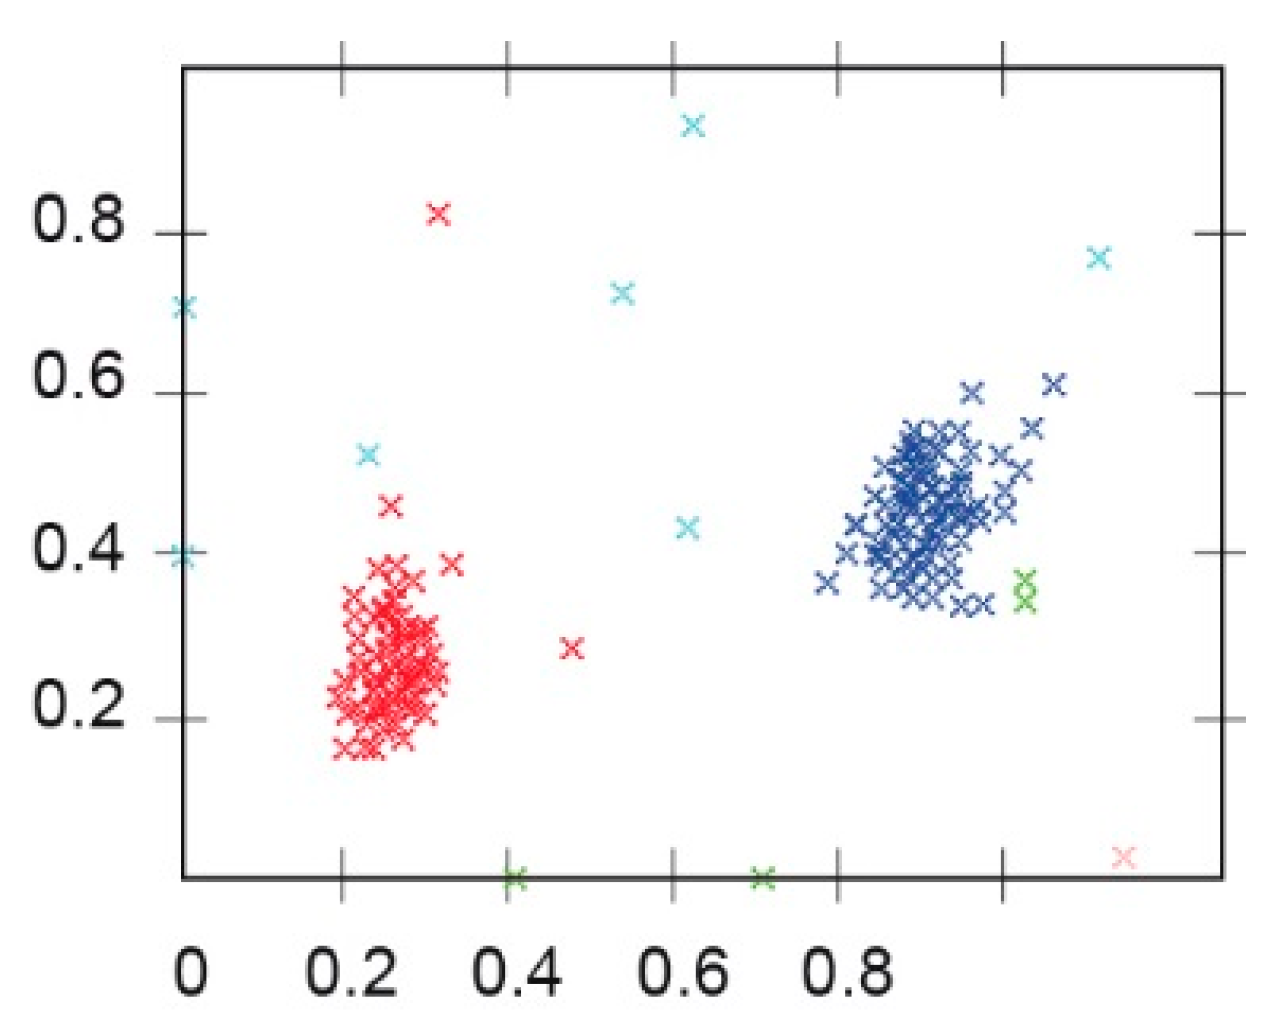
In the third step, an unsupervised machine learning algorithm is used namely the K-means clustering algorithm [35]. This algorithm tries, by successive iterations, to determine the centroids (one centroid per cluster) around which it is possible to group the data. These groups (i.e., clusters) are achieved by calculating the distance of each score vector from a central grouping point called the centroid (i.e., center of gravity). Figure 4 shows that the K-means clustering algorithm classifies the score vectors, V, into two clusters.
Following what is illustrated in Figure 4, we observe that the K-means clustering algorithm (with K = 2) has defined two centroids that allow dividing the score vectors V into two distinct groups, namely the Strong_indicator group and the Not_Strong_indicator group.
In the fourth step, our system evaluates the importance of a score vector representing the remainder by a weighted Euclidean distance. The weighted Euclidean distance (the Euclidean distance is a geometric distance in this multidimensional space. In a 2D space, it is calculated as follows:   D 2 ( x , y ) = i = 1 n ( x i y i ) 2 ) is performed between the score vectors and the centroid of the Strong_indicator group. Recall that the weighted Euclidean distance is performed between two score vectors x and y ; where x represents the centroid of the Strong_indicator group and y represents a vector belonging to the same group of the centroid x [34,35,36]. Thus, distances will determine the score vectors for indicators that are more influential in achieving the SDGs than other indicators. The list of these indicators is presented in Table 3.

2.3. Model Specification

In the previous section, the machine learning step resulted in the indicators mentioned in Table 3. According to the state-of-the-art, we were able to classify these indicators into five SDGs (see Table 4). Additionally, we introduced the DG variable measured by the ICT indicator into our model to measure its impact, to ensure the competitiveness of the Ha’il region to achieve SDGs. Data are collected from the official KSA statistical file.
Therefore, we used a VAR model with the operation of EViews 12 to understand the relationship between sustainable development goals and digitalization in the Ha’il region. However, before applying the VAR model, we started with the stationarity study using the Augmented Dickey–Fuller test (ADF) and the Phillips–Perron test (PP). In addition, we applied Johansen’s cointegration test to detect if there is a long-term relationship. Then, we adopted the Granger causality to test the causality between the variables. Finally, we tested the effect of the sudden variation of the digitization variable on the other variables and on the sustainable development of the Ha’il region; moreover, the VAR model considers every endogenous variable in the system as a function to verify the above relationships [40]. The VAR model is as follows:
Y t =   ϕ t     y t 1 + +   ϕ p       y t p + µ x t   + ε t
where: t = 1, 2,…, T
where:
  • Y t : is the column vector of the K-dimensional endogenous variable ( S D G s H ) ;
  • x t : is the column vector of the d-dimensional exogenous variable ( S D G 4 ,   S D G 5 ,   S D G 8 ,   S D G 9 ,   S D G 12 ,   D G ) ;
  • P: is the lag intervals for exogenous variables;
  • t: is the number of samples K*d dimension;
  • ϕ t   : is the matrix;   ϕ 1   ,……   ϕ p   ;
  • µ : is the matrix to be estimated;
  • ε t : is the K-dimensional perturbed column vector [40].
Nevertheless, in Table 5, we have determined the descriptive statistics of the time series of the variables (mentioned in Table 4) for the Ha’il region. Consequently, Table 5 shows that all series are normally distributed, as exposed by the statistics of the Jarque–Bera test. Sample statistics indicate that the mean value of SDGsH (logarithmic) is 4.6976, while the standard deviation (Std. Dev.) is 0.7812, meaning great variability throughout the year. Additionally, the average value of DG is 5.4820 which is positive and less volatile (Std. Dev. is 1.1388). However, the mean value of the other variables is positive, as indicated in Table 5. Furthermore, the results of the correlation coefficients indicate that all variables are less than 0.7. We conclude the absence of a bi-variable multicollinearity problem. Furthermore, by reviewing the literature, we can see that there are dynamic relationships between quality education, decent work and economic growth, gender equality, innovation and infrastructure, industry, renewable consumption and production, and digitalization.

3. Results and Discussion

In this section, we present the results of the different tests referred to as the methodology. First, we apply the Augmented Dickey–Fuller (ADF) test followed by the PP test to verify the order of integration of the variables used. In the second step, after the integration order validation, we select the appropriate criterion. Generally, Akaike’s information criterion (AIC) is appropriate before the VAR estimation. In fact, the choice of the value of the AIC depends on the delay length. If it is minimal and reduces the loss of one degree of freedom, then the values are preserved. In addition, AIC, which allows capturing the dynamic results, was found to be superior and more efficient when compared to the Schwarz information criterion (SIC), which is fixed. So, we pass the test of the cointegration between the variables of our study.
Table 6 summarizes the results of the stationarity tests. All variables are integrated in order 1 (I (1)). This means that the variables are stationary in the first difference. Note that the null hypothesis for the PP test is that the series are non-stationary. Using the ADF test, the results were the same. Therefore, after applying the Granger causality test to test causality between different variables, we verified that all the variables cause each other.
Based on the results given in Table 7, we added the number of lag p = 1 (according to the information criteria AIC, SIC, FPE, HQ, and log-likelihood). The null hypothesis of absence is accepted based on the results of previous tests in Table 6 (lag p = 1). We proceed to the Granger causality test. The efficient way to analyze possible significant interactions among all study variables is to estimate a VAR model with a lag (p = 1) with the generalized method of moments (GMM) for all the variables in the first differences.
Table 8 reports the estimation of the results of the VAR model. The outcomes of this test indicate that the first lag of most variables is negatively correlated with its current level. The estimated coefficient associated with the first lag of sustainable development goals in the Ha’il region is −1.23 and significant at the rate of 1%. In addition, the first delay of SDG4 positively affects the effective level of sustainable development goals in the Ha’il region at the level of 5%; this indicates that the use of modern technologies in education, especially intensification, such as during the spread of the COVID-19 epidemic, improved education in the region and this is due to the return of many to study. Many people searched for modern learning methods in order to shorten time and effort. Furthermore, the lag of SDG5 positively affects the current level of sustainable development goals in Ha’il at a rate of 1%. This result indicates that gender equality for women and girls has been included in order to achieve development in the Ha’il region to promote and strengthen equality. This point is in accordance with Vision 2030, pursued through comprehensive empowerment in all sectors, including the ascension of positions for women in different domains. For the impact of the first lag of DG, the result is more interesting. Indeed, the DG is represented by Internet use and has a significant and strong positive impact at the 1% level on the current sustainable development goals in Ha’il. This is due to the application of high techniques in the marketing sector and investment in services that make the region of Ha’il independent. In fact, the development of trade via the internet promotes trade in the region and at the same time outside the territory. Therefore, the development of digitalization promotes expansion.
Similarly, the first lag in SDG8 positively influences the effective level of sustainable development goals in Ha’il at the level of 10%. Consequently, the lag value of SDG9, which is represented by industry innovation and infrastructure, has a significant and positive impact at a rate of 5% on the development of the Ha’il region. This result explained the importance of preparing and developing the Ha’il region among the four principal regions in KSA. Finally, the lag value of SDG12, which is represented by responsible consumption and production, has a significant and positive impact at the rate of 10% on the current sustainable development goals in the Ha’il region. The positive impact of this variable is explained, on the one hand, by the improvement of the level of rational consumption control, and on the other hand, by the improvement of efficient production. This is within the framework of alignment with an effective system of environmental protection. Therefore, the application of new technologies adapted to the environment helps to achieve this goal.
Indeed, the response functions of the VAR group’s variables detect the effects (i.e., positive or negative) following the shocks of variable DG (see Figure 5). These IRFs described the response of a system to an endogenous variable shock or an innovation. Specifically, IRFs allow us to study the reaction between the variation of DG and their interactions with the other variables.
According to Figure 5, the IRFs report through Monte Carlo simulations with a thousand repetitions. We focus on the reaction of all variables that explained   SDGs H . In addition, there is a strong link between DG and SDGs H . Therefore, if we focus on SDG4, there are common dealings for quality in education and digitization. This has been explained by the fact that horizontal trend lines are very robust. Similarly, goal 5 (SDG5) represents a gap that increased rapidly compared to the movement of the DG variable. Respectively, SDG8 alternatively changes with DG. Other variables, SDG9 and SDG12, have obvious medium- and long-term effects. Additionally, the Cholesky decomposition confirms the analysis of the model dynamics. The trend indicates that there are still some issues that need more attention and should be solved in high quality for any stage of development in the Ha’il region.

4. Conclusions and Recommendations

In conclusion, this paper studied the impact of digitization, to ensure the competitiveness of the Ha’il region to achieve SDGs. First, we applied the machine learning technique to reveal indicators that have more influence on the achievement of sustainable development in all member countries of the United Nations. Second, we classified these indicators into five SDGs (five variables). These five SDGs are considered the main indicators for achieving competitiveness in the Ha’il region. Third, we used a VAR model to examine the impact of digitalization on the various variables. We can approve that digitalization has a significant impact on the SDGs to ensure the competitiveness of the Ha’il region. Finally, we used IRFs to confirm the nature of the variation in the different variables that occurred as a result of the digitization variation. As a result, the findings revealed that key factors influence the achievement of sustainable development in the Ha’il region and its competitiveness. These factors are manifested in the quality of education, decent work and economic growth, gender equality, innovation in industry and infrastructure, renewable consumption, and production. For this reason, this study is interesting for policymakers in the KSA to use digitalization to achieve the SDGs in the Ha’il region as well as for its competitiveness.
In fact, referring to the results, we propose some recommendations to be adopted in the Ha’il region. First, sustainable urbanization must be accelerated by pursuing the same development policy as that of the Riyadh region. It is also important to promote investment diversification management policies in the Ha’il region. In addition, increasing investment in the development of education in the Ha’il region. Similarly, strengthening research and development efforts in terms of controlling energy consumption, in particular, the consumption of electricity. Furthermore, it is recommended to encourage the adoption of new technologies in all sectors of the Ha’il region. This is so the government can also put in place the necessary support to achieve economic support for the Ha’il region. With regard to gender equity, it is important to support women in the region to contribute to the development of the region. In addition, encouraging women to be leaders by ascending to leadership positions and promoting investment policies in the region. It is also recommended to build understanding and development by integrating community support activity areas into multiple areas. Additionally, maintaining the urban growth of villages in the Ha’il region and controlling their expansion. It is also necessary to use development plans with a regional vision that respects regional ecosystems and normal functions.
In this context, the government can emphasize the action levers of the public authorities in favor of a coherent policy at the service of sustainable development in the region. In the same way, the government can harmonize the action of the different levels of administration and mitigate the evaluation of the effects on the Ha’il region; thus, strengthening the system to collect qualitative as well as quantitative results of the different measures adopted. In general, policymakers should implement these policy instruments to promote sustainable development in the Ha’il region.

Author Contributions

Conceptualization, methodology, writing—Original draft and validation, writing—review and editing, R.T. and M.K.; data curation, software, writing-Original draft and validation, writing—review and editing, M.H.M. and Y.B. All authors have read and agreed to the published version of the manuscript.

Funding

This research has been funded by Scientific Research Deanship at University of Ha’il—Saudi Arabia through project number “RD-21 010”.

Data Availability Statement

The datasets used during the current study are available from the corresponding or first author on reasonable request.

Conflicts of Interest

The authors declare no conflict of interest.

References

  1. Gupta, S.; Langhans, S.D.; Domisch, S.; Fuso-Nerini, F.; Felländer, A.; Battaglini, M.; Tegmark, M.; Vinuesa, R. Assessing whether artificial intelligence is an enabler or an inhibitor of sustainability at indicator level. Transp. Eng. 2021, 4, 100064. [Google Scholar] [CrossRef]
  2. Filho, W.L.; Yang, P.; Eustachio, J.H.P.P.; Azul, A.M.; Gellers, J.C.; Gielczyk, A.; Dinis, M.A.P.; Kozlova, V. Deploying digitalisation and artificial intelligence in sustainable development research. Environ. Dev. Sustain. 2022. [Google Scholar] [CrossRef]
  3. Del Río Castro, G.; Fernández, M.C.G.; Colsa, U. Unleashing the convergence amid digitalization and sustainability towards pursuing the Sustainable Development Goals (SDGs): A holistic review. J. Clean. Prod. 2021, 280, 122204. [Google Scholar] [CrossRef]
  4. Martinez, F. Process excellence the key for digitalization. Bus. Process Manag. J. 2019, 25, 1716–1733. [Google Scholar] [CrossRef]
  5. Ávila-Gutiérrez, M.J.; Suarez-Fernandez de Miranda, S.; Aguayo-González, F. Occupational Safety and Health 5.0—A Model for Multilevel Strategic Deployment Aligned with the Sustainable Development Goals of Agenda 2030. Sustainability 2022, 14, 11. [Google Scholar] [CrossRef]
  6. Ha, L.T. Are digital business and digital public services a driver for better energy security? Evidence from a European sample. Environ. Sci. Pollut. Res. 2022, 29, 27232–27256. [Google Scholar] [CrossRef]
  7. Sovacool, B.K.; Upham, P.; Monyei, C.G. The “whole systems” energy sustainability of digitalization: Humanizing the community risks and benefits of Nordic datacenter development. Energy Res. Soc. Sci. 2022, 88, 102493. [Google Scholar] [CrossRef]
  8. Hadjikhani, A.I.; Lindh, C. Digital love—Inviting doubt into the relationship: The duality of digitalization effects on business relationships. J. Bus. Ind. Mark. 2020, 36, 1729–1739. [Google Scholar] [CrossRef]
  9. Knudsen, E.S.; Lien, L.B.; Timmermans, B.; Belik, I.; Pandey, S. Stability in turbulent times? The effect of digitalization on the sustainability of competitive advantage. J. Bus. Res. 2021, 128, 360–369. [Google Scholar] [CrossRef]
  10. Reyers, B.; Selig, E.R. Global targets that reveal the social–ecological interdependencies of sustainable development. Nat. Ecol. Evol. 2020, 4, 1011–1019. [Google Scholar] [CrossRef]
  11. Bengo, I.; Boni, L.; Sancino, A. EU financial regulations and social impact measurement practices: A comprehensive framework on finance for sustainable development. Corp. Soc. Responsib. Environ. Manag. 2022, 29, 809–819. [Google Scholar] [CrossRef]
  12. Kottmeyer, B. Digitisation and Sustainable Development: The Opportunities and Risks of Using Digital Technologies for the Implementation of a Circular Economy. J. Entrep. Innov. Emerg. Econ. 2021, 7, 17–23. [Google Scholar] [CrossRef]
  13. Sachs, J.D.; Schmidt-Traub, G.; Mazzucato, M.; Messner, D.; Nakicenovic, N.; Rockström, J. Six Transformations to achieve the Sustainable Development Goals. Nat. Sustain. 2019, 2, 805–814. [Google Scholar] [CrossRef]
  14. Yang, W.; Chen, Q.; Guo, Q.; Huang, X. Towards Sustainable Development: How Digitalization, Technological Innovation, and Green Economic Development Interact with Each Other. Int. J. Environ. Res. Public Health 2022, 19, 12273. [Google Scholar] [CrossRef] [PubMed]
  15. Lichtenthaler, U. Digitainability: The Combined Effects of the Megatrends Digitalization and Sustainability. J. Innov. Manag. 2021, 9, 64–80. [Google Scholar] [CrossRef]
  16. Burinskiene, A.; Seržante, M. Digitalization as the Indicator of the Evidence of Sustainability in the European Union. Sustainability 2022, 14, 8371. [Google Scholar] [CrossRef]
  17. Jovanović, M.; Dlačić, J.; Okanović, M. Digitalization and society’s sustainable development—Measures and implications. J. Econ. Bus. 2018, 36, 905–928. [Google Scholar]
  18. Mondejar, M.E.; Avtar, R.; Diaz, H.L.B.; Dubey, R.K.; Esteban, J.; Gómez-Morales, A.; Hallam, B.; Mbungu, N.T.; Okolo, C.C.; Prasad, K.A.; et al. Digitalization to achieve sustainable development goals: Steps towards a Smart Green Planet. Sci. Total Environ. 2021, 79, 148539. [Google Scholar] [CrossRef]
  19. Velden, M.V.D. Digitalisation and UN sustainable development goals: What role for design. Interact. Des. Archit. J. 2018, 37, 160–174. [Google Scholar] [CrossRef]
  20. Holzinger, A.; Malle, B.; Saranti, A.; Pfeifer, B. Towards multi-modal causability with Graph Neural Networks enabling information fusion for explainable AI. Inf. Fusion 2021, 71, 28–37. [Google Scholar] [CrossRef]
  21. Borowski, P.F.; Patuk, I. Environmental, social and economic factors in sustainable development with food, energy and eco-space aspect security. Present. Environ. Sustain. Dev. 2021, 15, 153–169. [Google Scholar] [CrossRef]
  22. Bieser, C.T.; Hilty, L.M. Assessing Indirect Environmental Effects of Information and Communication Technology (ICT): A Systematic Literature Review. Sustainability 2018, 10, 2662. [Google Scholar] [CrossRef] [Green Version]
  23. Cioffi, R.; Travaglioni, M.; Piscitelli, G.; Petrillo, A.; Felice, F.D. Artificial Intelligence and Machine Learning Applications in Smart Production: Progress, Trends, and Directions. Sustainability 2020, 12, 492. [Google Scholar] [CrossRef] [Green Version]
  24. Neffati, M.; Gouider, A. Socioeconomic Impacts of Digitisation in Saudi Arabia. Int. J. Econ. Financ. Issues 2019, 9, 65–72. [Google Scholar] [CrossRef]
  25. Kunkel, S.; Tyfiled, D. Digitalisation, sustainable industrialisation and digital rebound—Asking the right questions for a strategic research agenda. Energy Res. Soc. Sci. 2021, 82, 102295. [Google Scholar] [CrossRef]
  26. Tulchynska, S.; Olha, P.; Garafonova, O.; Yaroshenko, I.; Semyhulina, I. Modeling the influence of innovative factors on sustainable development of regions in the context of digitalization. J. Manag. Inf. Decis. Sci. 2021, 24, 1–8. [Google Scholar]
  27. Garkushenko, M. Institute of Industrial Economics of the NAS of Ukraine System-dynamic model for assessing the digitalization impact on sustainable development. Econ. Ind. 2021, 1, 20–45. [Google Scholar] [CrossRef]
  28. Popescu, L.; Lancu, A.; Avram, M.; Avram, D.; Popescu, V. The Role of Managerial Skills in the Sustainable Development of SMEs in Mehedinti County, Romania. Sustainability 2020, 12, 1119. [Google Scholar] [CrossRef] [Green Version]
  29. Latoszek, E. Fostering sustainable development through the European Digital Single Market. Econ. Bus. Rev. 2021, 7, 68–89. [Google Scholar] [CrossRef]
  30. Kushnir, A.M.; Dianova, T.V.; Rudakova, E.N. The Contradiction of the Sustainable Development of the Modern Economy in the Conditions of Digitalization: Flexibility and Innovation versus Security and Stability. In Sustainable Development of Modern Digital Economy: Perspectives from Russian Experiences; Springer International Publishing: Berlin/Heidelberg, Germany, 2021; pp. 13–21. [Google Scholar] [CrossRef]
  31. Farooq, M.; Hussain, A.; Masood, T.; Habib, M. Supply Chain Operations Management in Pandemics: A State-of-the-Art Review Inspired by COVID-19. Sustainability 2021, 13, 2504. [Google Scholar] [CrossRef]
  32. Vishnevsky, V.; Harkushenko, O.; Zanizdra, M.; Kniaziev, S.; Lypnytskyi, D.; Chekina, V. Digitalization of the Economy: How to Improve the Country’s Competitiveness; PH “Akademperiodyka”: Kyiv, Ukraine, 2021. [Google Scholar] [CrossRef]
  33. Vannieuwenhuyze. Intelligence Artificielle Vulgarisée—Le Machine Learning et le Deep Learning par la Pratique; ENI: Strasbourg, France, 2019. [Google Scholar]
  34. Malik, A.; Tuckfield, B. Applied Unsupervised Learning with R, 1st ed.; Packt Publishing Ltd.: Birmingham, UK, 2019. [Google Scholar]
  35. Vyas, S.; Prasad, A. Analysis of Algorithms K-Means and Apriori for Data Mining. In Rising Threats in Expert Applications and Solutions; Springer: Singapore, 2020; pp. 187–191. [Google Scholar] [CrossRef]
  36. Vouros, A.; Langdell, S.; Croucher, M.; Vasilaki, E. An empirical comparison between stochastic and deterministic centroid initialisation for K-means variations. Mach. Learn. 2021, 110, 1975–2003. [Google Scholar] [CrossRef]
  37. Martín, M.G.; Álvarez, A.P.; Ordieres-Meré, J.; Villalba-Díez, J.; Morales-Alonso, G. New Business Models from Prescriptive Maintenance Strategies Aligned with Sustainable Development Goals. Sustainability 2020, 13, 216. [Google Scholar] [CrossRef]
  38. Rai, S.M.; Brown, B.D.; Ruwanpura, K.N. SDG 8: Decent work and economic growth—A gendered analysis. World Dev. 2018, 113, 368–380. [Google Scholar] [CrossRef]
  39. de Visser-Amundson, A. A multi-stakeholder partnership to fight food waste in the hospitality industry: A contribution to the United Nations Sustainable Development Goals 12 and 17. J. Sustain. Tour. 2020, 30, 2448–2475. [Google Scholar] [CrossRef]
  40. Li, H.; Liu, S. Higher Education, Technological Innovation, and Regional Sustainable Development: Insights from a VAR Model. Discret. Dyn. Nat. Soc. 2021, 2021, 8434528. [Google Scholar] [CrossRef]
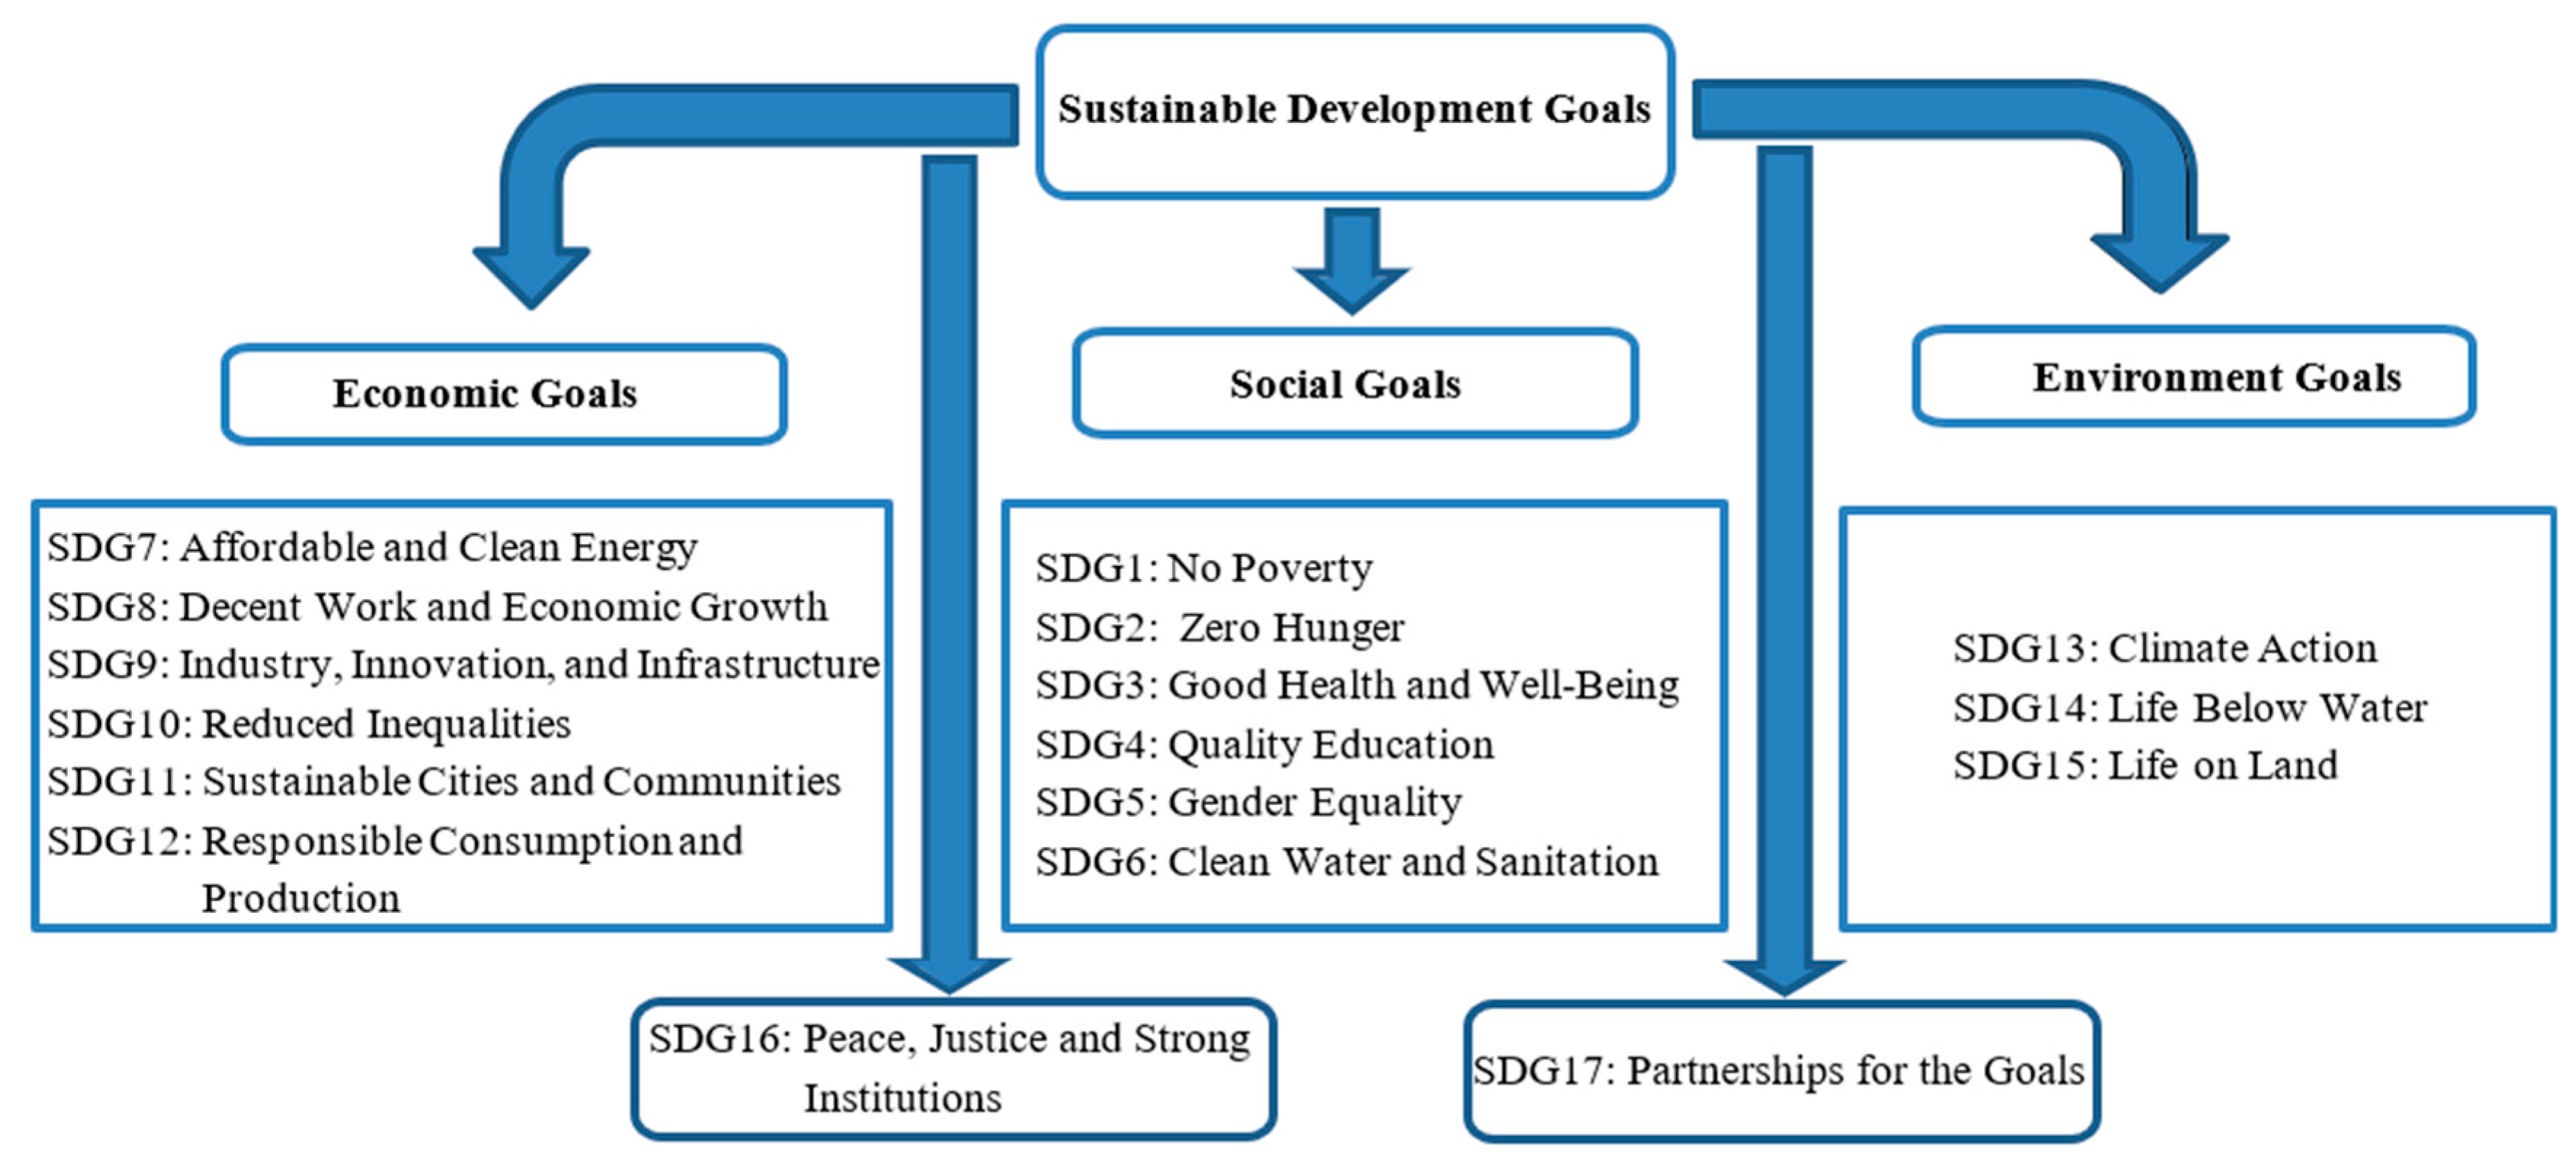
Figure 1. The dispatching of the SDGs.
Sustainability 15 01661 g001
Figure 2. Ha’il region’s dimensions in 2019 and 2021.
Sustainability 15 01661 g002
Figure 3. The architecture of the proposed system.
Sustainability 15 01661 g003
Figure 4. Classification of score vectors by the two-means clustering algorithm.
Sustainability 15 01661 g004
Figure 5. Impulse response functions.
Sustainability 15 01661 g005
Table 1. Case studies on the relationship between SDGs and DG.
Ref.Country/RegionPeriodMethodFinding
[24]Saudi Arabia Kingdom1981–2016The autoregressive distributed lag with least squares approachesA significant relationship between the DG and socioeconomic variables permits the transition and promotion of sustainable development
[25]Different Countries by RegionsDifferent period Machinic micro efficiency model: CPERI and CPSK approachesDG is susceptible to macro-level growth and mitigates sustainable development
[26]Kyiv Region2013–2020Non-linear dynamics model (Kutta method)DG stimulus innovative factors and promotes SDGs
[27]Different Countries of the WorldForecast 2019–2024Scenario with different national indicatorsDG is a principal tool for achieving sustainable development
[16]European Union Countries2011–2020A linear regression modelThe results showed that only SDGs are statistically valid. DG indicators, in part, affect the sustainable development indicators sought
[2]Different Countries of the World1977–2021Artificial intelligence (machine learning technique)The deployment of DG and AI support SDGs inter alia contributes to more development
Table 2. Region prosperity profile of the KSA regions.
DimensionHa’ilRiyadhMakkahQassimDammamMadinah
Use of ICT66.6%68%71.1%52.1%73.2%59%
Internet Connectivity78.5%83%77.3%80.4%73.4%83.3%
Employment Rate59.8%65.7%75.7%52.8%76.2%48.8%
Mean Household Income72.5%73.470.3%51.5%100%36.8%
Urban Mobility50%54.2%33.33%51.3%56.3%87.4%
Social Infrastructure30.6%28%25.2%28.9%22%27.4%
Source: Authors, inspired by Saudi documents from the Prosperity Profile 2019–2022.
Table 3. The indicator details.
IndicatorDescription
LPGDPLabor productivity: GDP per person employed
RLGM2015Reaching the last grade of primary education: Male students in 2015
RLGM2019Reaching the last grade of primary education: Male students in 2019
RLGF2015Reaching the last grade of primary education: Female students in 2015
RLGF2019Reaching the last grade of primary education: Female students in 2019
AERP2019Access to the electricity of the rural population in 2019
REC2000Renewable energy consumption in 2000
FSEM11-17Female share of employment in senior and middle management in 2011–2017
Table 4. Classification of indicators into variables with references.
IndicatorVariableRef.
RLGM2015SDG4[13,37]
RLGM2019SDG4[13,37]
RLGF2015SDG4[13,37]
RLGF2019SDG4[13,37]
FSEM11-17SDG5[13,37]
LPGDPSDG8[37,38]
AERP2019SDG9[18,25]
REC2000SDG12[21,39]
ICTDG[22,25]
Table 5. Descriptive analysis of the variables and pair-wise correlations.
SDGsHSDG4SDG5SDG8SDG9SDG12DG
Mean4.69762.62709.465011.87573.42929.22585.4820
Median4.72442.43599.440011.47473.43692.44245.2570
Maximum6.09703.100016.722016.76534.138219.00007.0900
Minimum2.38802.34301.87506.64821.10331.99003.8286
Std. Dev.0.78120.30402.92403.95610.65282.97001.1388
Skewness0.92270.61600.30650.24001.98814.36400.1229
Kurtosis4.7181.62375.26961.11248.295320.04761.5025
Jarque–Bera5.8283.13065.06633.268340.196736.24332.1110
Probability0.05420.20900.07940.19501.86819.67590.3480
SDGsH1
SDG40.402283471
SDG50.090810100.687080001
SDG80.025407340.066696620.084471781
SDG90.395665820.559615230.730561310.084471781
SDG120.45758724−0.20776500.57941810.066696620.79537001
DG0.3918021830.946218720.733526790.066696620.671040650.23589891
Notes: Max., Min., and Std. Dev. are maximum, minimum, and standard deviation, respectively.
Table 6. Unit root tests analysis.
VariablesADF TestPP TestOrder of Integration
LevelFirst DifferenceLevelFirst Difference
ln S D G s H −2.345
(0.1689)
−5.130
(0.003) *
−2.322
(0.2012)
−5.041
(0.000) *
I(1)
lnSDG4−2.412
(0.044)
−5.232
(0.001) *
−2.543
(0.187)
−6.354
(0.006) *
I(1)
LnSDG5−2.012
(0.2805)
−6.19
(0.009) *
−1.079
(0.337)
−6.084
(0.000) *
I(1)
lnSDG8−0.599
(0.807)
−5.047
(0.006) *
−2.338
(0.601)
−7.433
(0.000) *
I(1)
ln SDG90.143
(0.963)
−7.388
(0.000) *
−2.302
(0.243)
−4.065
(0.007) *
I(1)
ln SDG120.154
(0.963)
0.154
(0.963)
−2.542
(0.287)
−6.122
(0.963) *
I(1)
ln DG0.158
(0.704)
0.164
(0.360)
0.176
(0.946)
−7.322
(0.963) *
I(1)
Note: * indicates the level of significance at 1% and 10%.
Table 7. Lag order for the VAR model.
LagLogLLRFPEAICSCHQ
043.395NA2.87 × 10−74.7995.147774.875
195.22476171.6255 *7.47 × 10−11 *−3.735691 *−0.950928 *−3.131190 *
Note: * indicates lag order selected by the criterion.
Table 8. VAR (1) model estimation results.
Response toResponse of
D(SDGH)SDG4SDG5SDG8SDG9SDG12DG
D( S D G s H (-1))−1.2314420.011669−0.402576−0.042059−0.0440820.3630500.226239
(0.35904)(0.04543)(0.50824)(0.51422)(0.30215)(0.57308)(0.86252)
[−3.42986] ***[0.25687][−0.79210][−0.08179][−0.14589][0.63351][0.26230] *
D(SDG4(-1))16.948201.338912−2.329524−15.23057−5.505570−1.0276280.858480
(7.53950)(0.95398)(10.6727)(10.7983)(6.34496)(12.0343)(18.1122)
[2.24792] **[1.40351] *[−0.21827][−1.41046] *[−0.86771][−0.08539][0.04740]
D(SDG5(-1))0.9308030.0182020.501752−0.208951−0.3280110.0558430.057295
(0.30087)(0.03807)(0.42590)(0.43091)(0.25320)(0.48024)(0.72278)
[3.09371] **[0.47814][1.17809] *[−0.48490][−1.29546] *[0.11628][0.07927]
D(SDG8(-1))−0.697242−0.015564−0.130422−0.5463940.1821690.2898330.152189
(0.38072)(0.04817)(0.53894)(0.54529)(0.32040)(0.60770)(0.91462)
[−1.83135] *[−0.32308][−0.24199][−1.00203]*[0.56856][0.47693][0.16640] *
D(SDG9(-1))−1.3005320.0156971.112498−0.4764320.278282−0.0770220.207935
(0.51157)(0.06473)(0.72416)(0.73269)(0.43052)(0.81655)(1.22895)
[−2.54224] **[0.24250][1.53625]*[−0.65025][0.64639][−0.09433][0.16920] *
D(SDG12(-1))−0.671714−0.045360−0.2941440.4693900.162634−0.5541090.212034
(0.35034)(0.04433)(0.49593)(0.50176)(0.29483)(0.55920)(0.84162)
[−1.91734] *[−1.02327] *[−0.59312][0.93548][0.55162][−0.99090][0.25194] **
D(DG(-1))−1.073301−0.041713−0.9260170.6414890.011190−0.4502310.314974
(0.32464)0.04108)(0.45956)(0.46496)(0.27321)(0.51818)(0.77989)
[−3.30610] ***[−1.01547] *[−2.01503] **[1.37966] *[0.04096][−0.86886][0.40387] **
Note: The significance level is shown in (.) and the t-statistic [.]; ***, **, and * denote the significance levels of 1%, 5%, and 10%, respectively; D (.) denotes the first difference.
Disclaimer/Publisher’s Note: The statements, opinions and data contained in all publications are solely those of the individual author(s) and contributor(s) and not of MDPI and/or the editor(s). MDPI and/or the editor(s) disclaim responsibility for any injury to people or property resulting from any ideas, methods, instructions or products referred to in the content.