
Non-Invasive SWIR Monitoring of White Marble Surface of the Cathedral of Santa Maria del Fiore (Florence, Italy)

 ,
,  , ,
, , 
 , , , ,
Abstract
:1. Introduction
- The possibility to attain information on the degree of sulfation of carbonate stone surfaces through the set-up of artificial alteration experiments of carbonate stone specimens under laboratory conditions [27];
- The capability of SWIR hyperspectral technique to on-site monitor the most effective cleaning procedures for black crusts on marble surfaces [28].
2. Materials and Methods
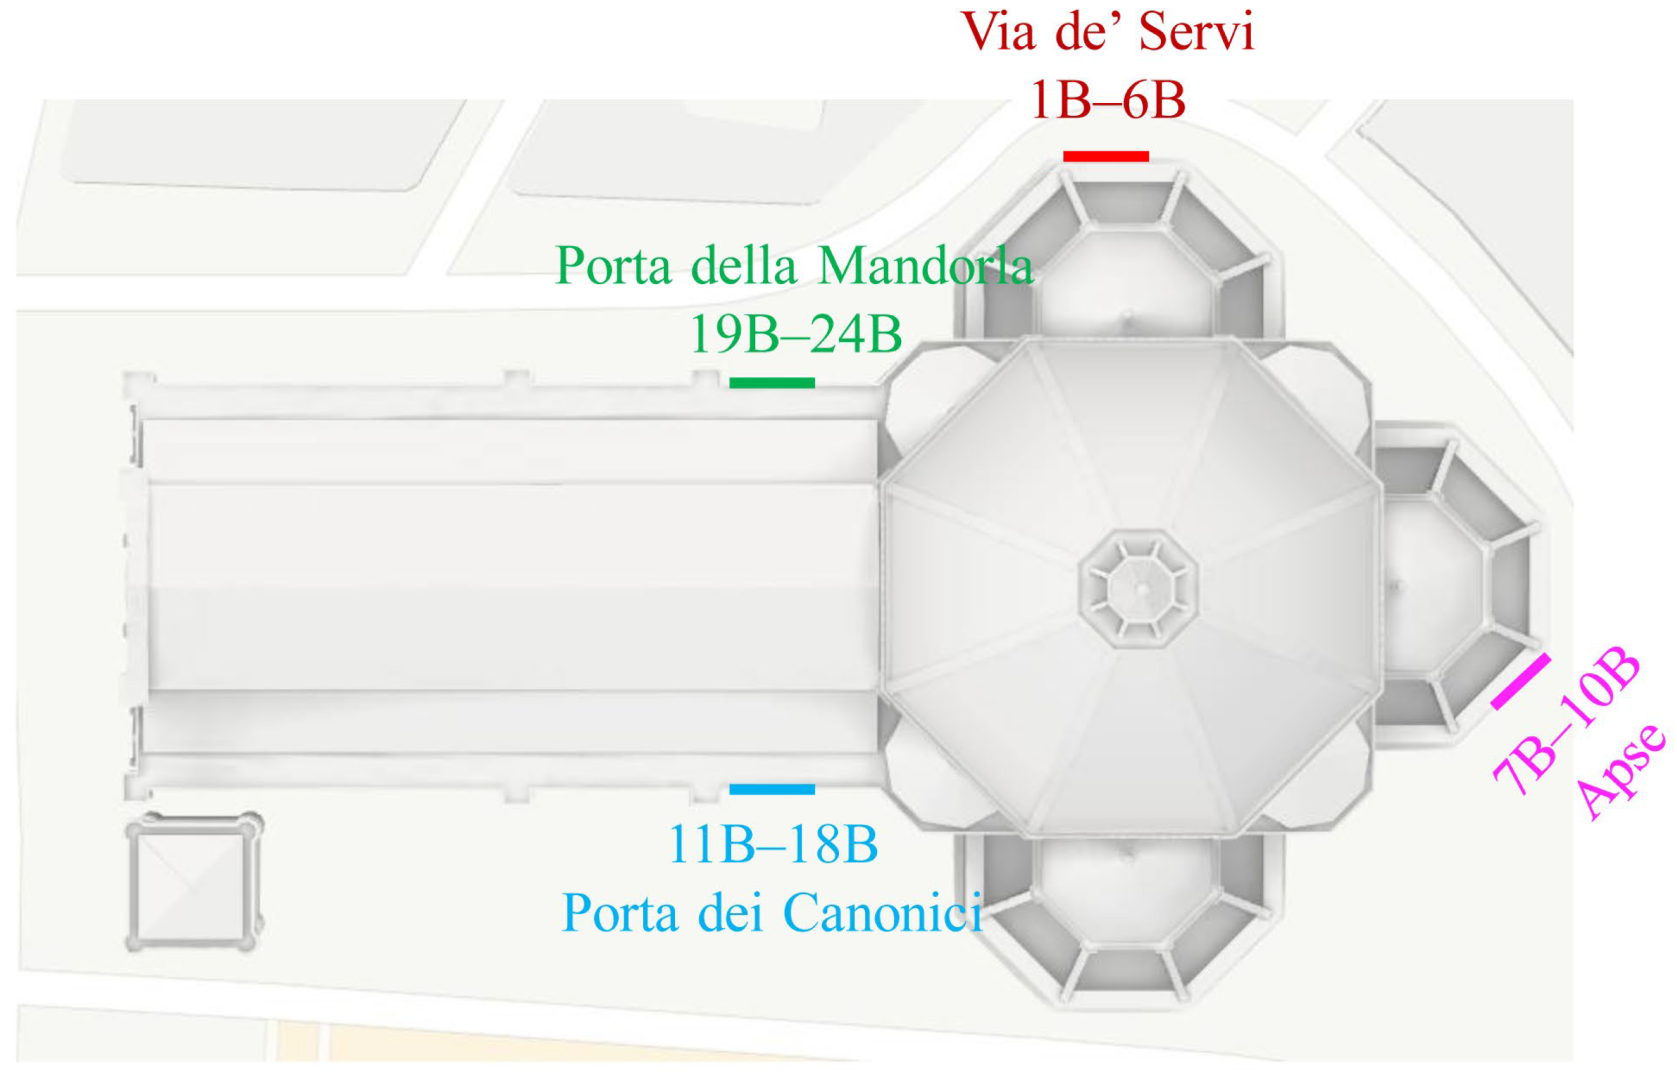
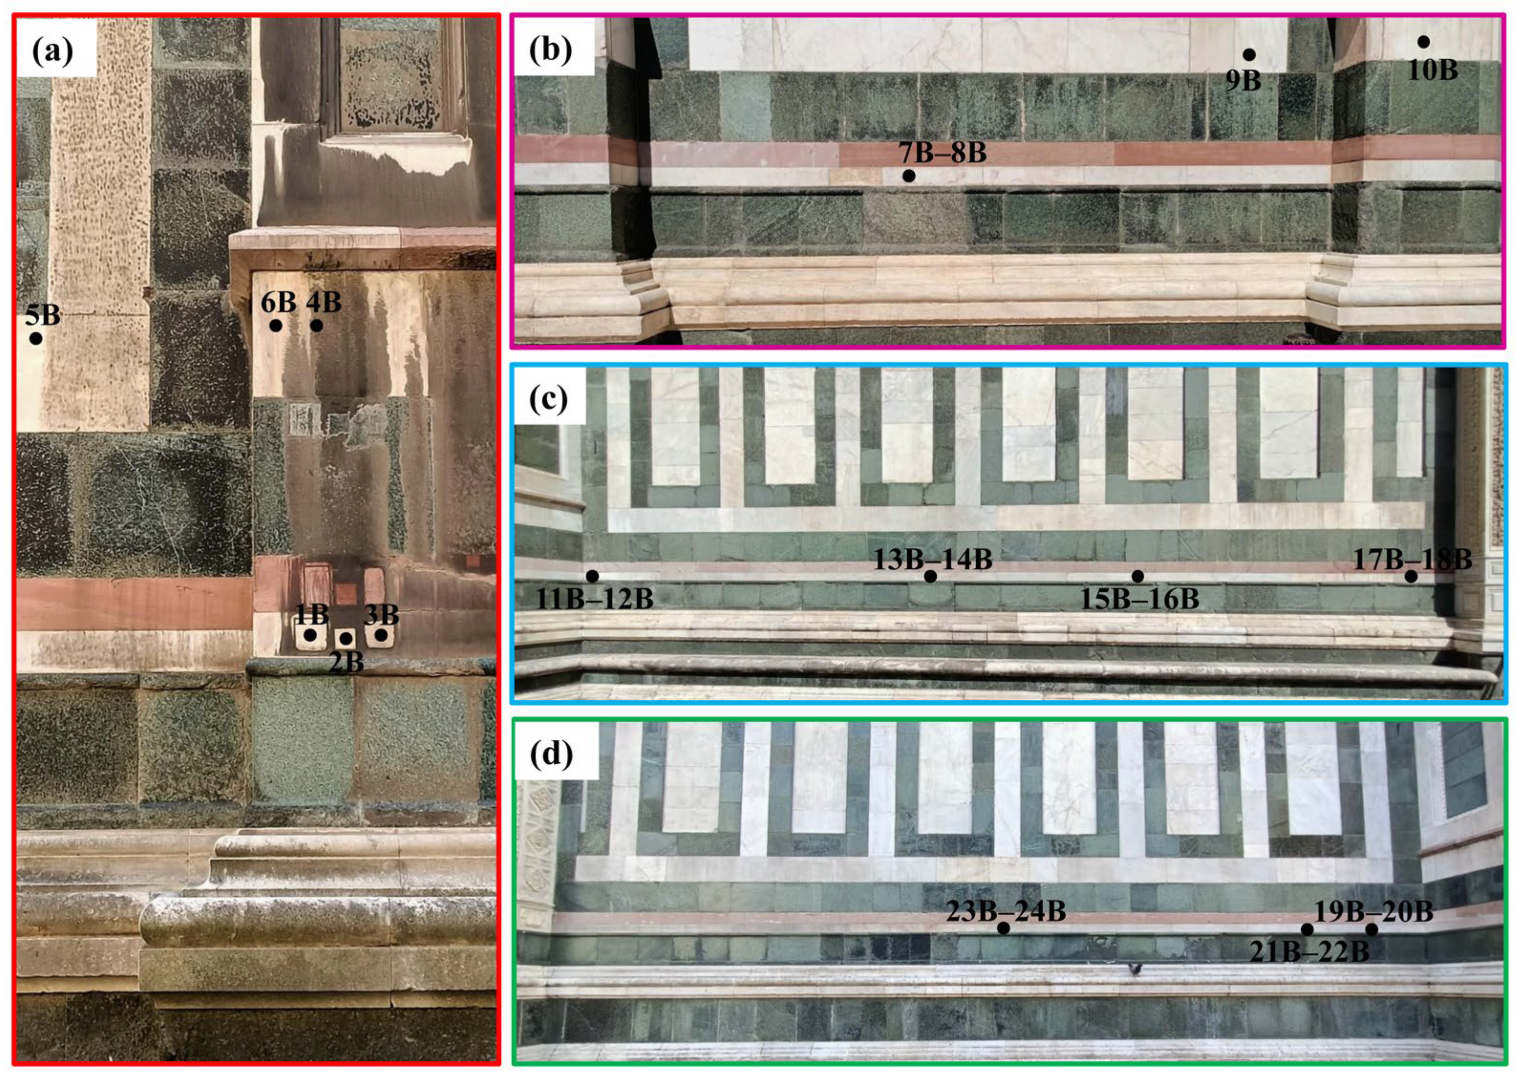
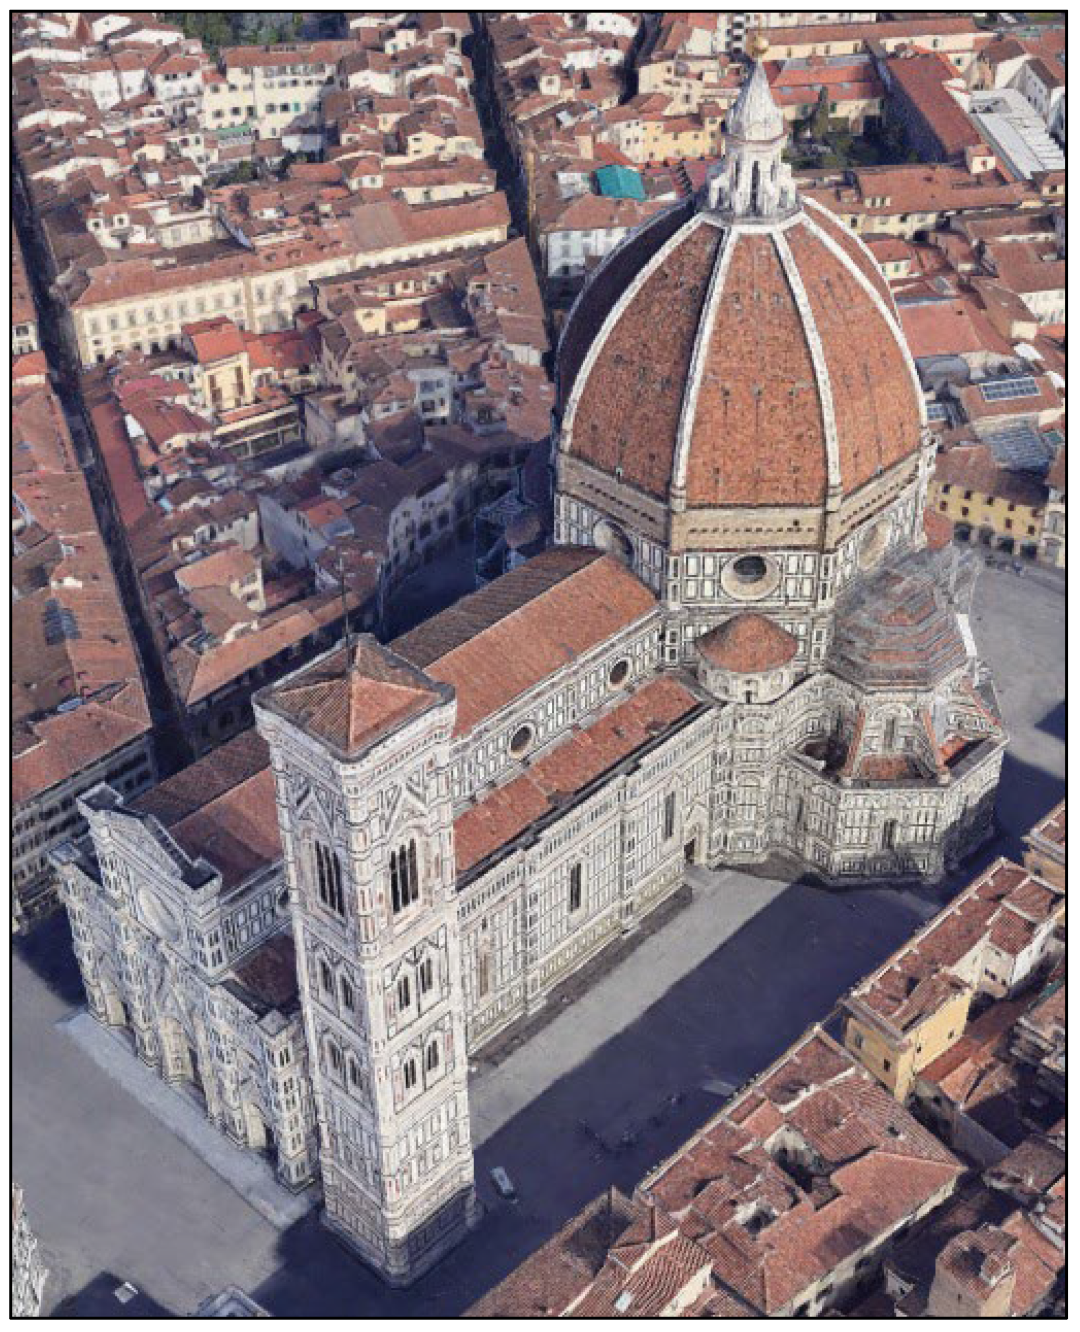
2.1. Site Description
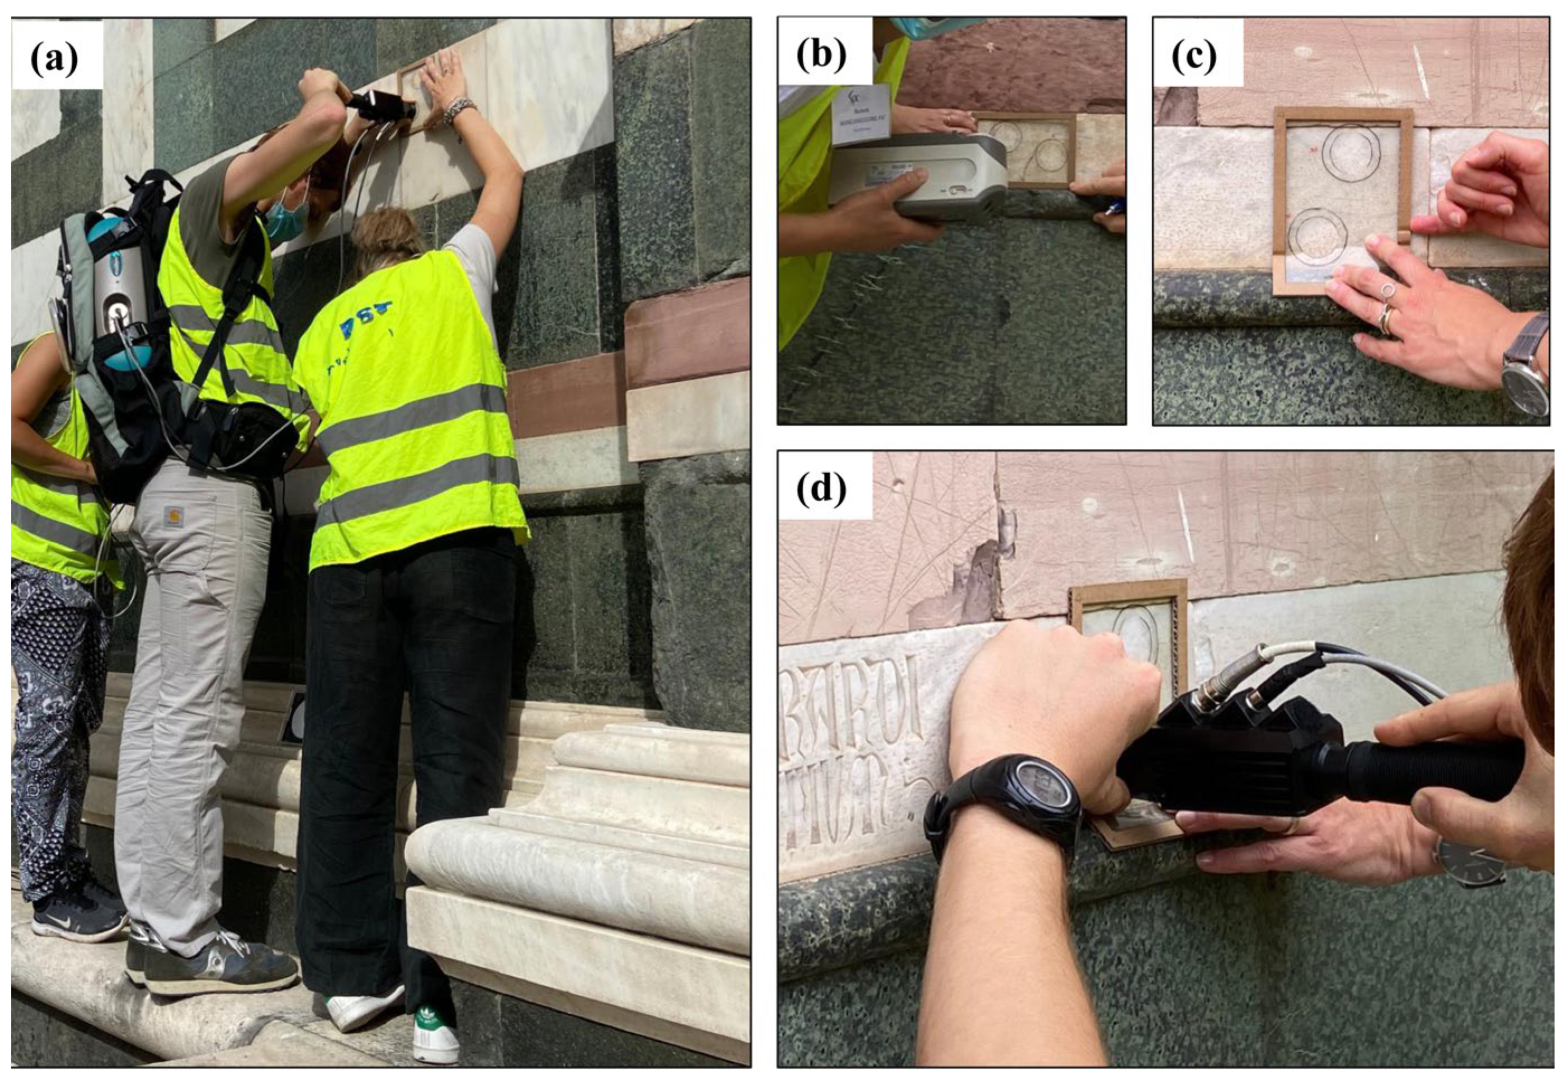
2.2. Acquisition Data Procedure
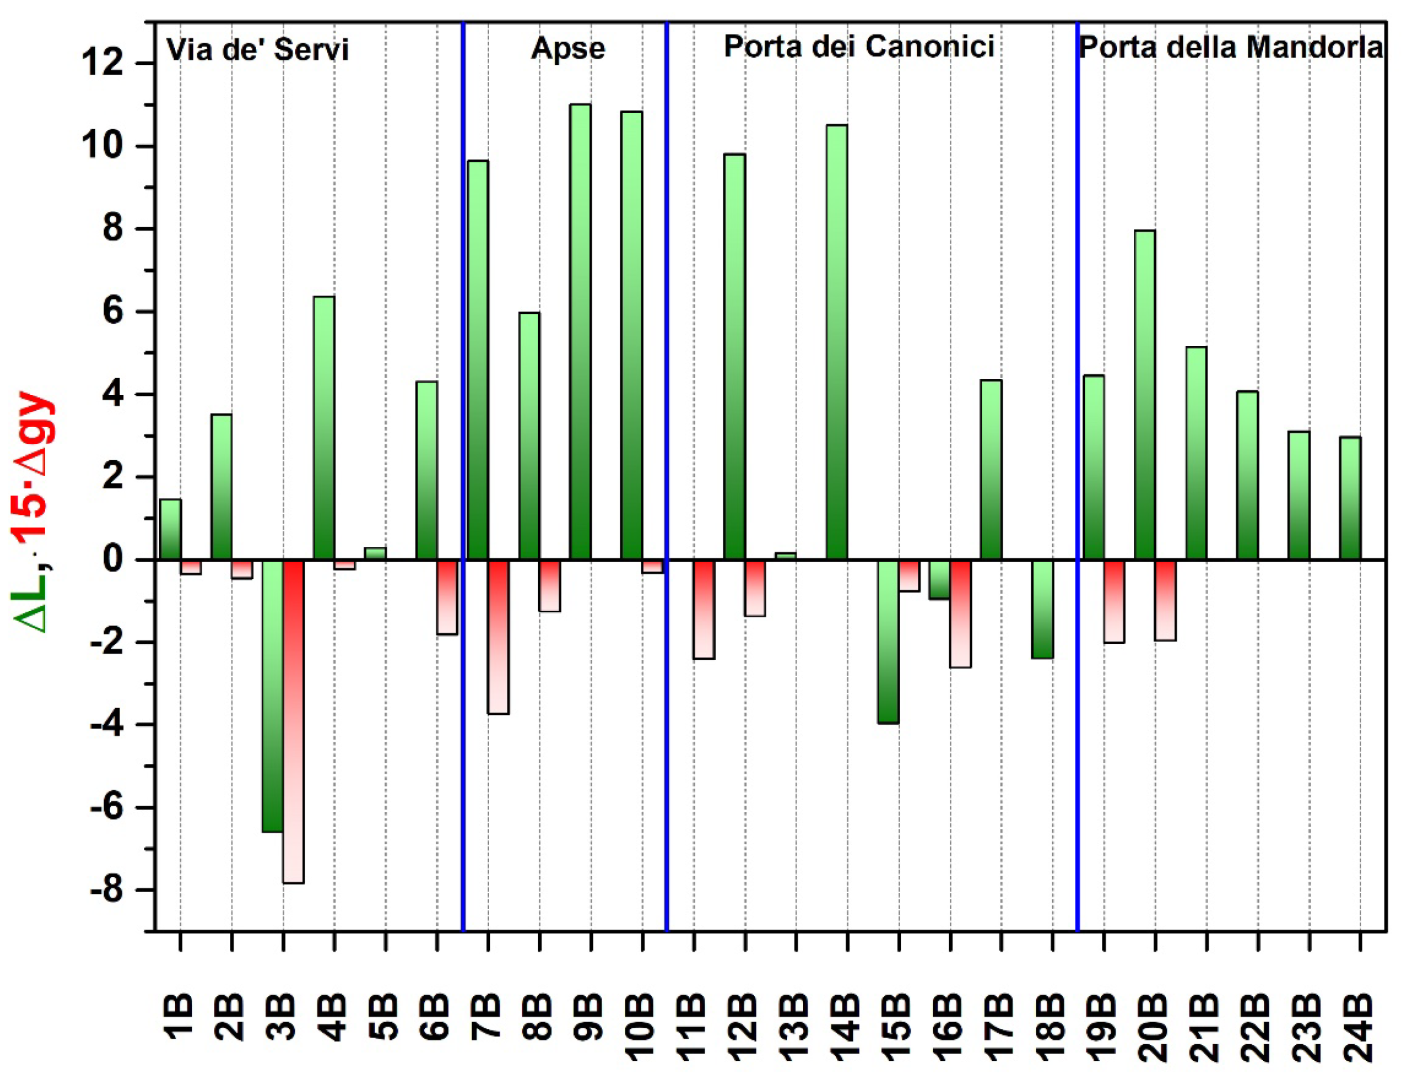
- from 1B to 6B in front of Via de’ Servi street on the north side of the building;
- from 7B to 10B on the Apse on the south-east side;
- from 11B to 18B on the Porta dei Canonici on the south side;
- from 19B to 24B on the north side.
2.3. Colorimetric and Spectroscopic Investigations
3. Results
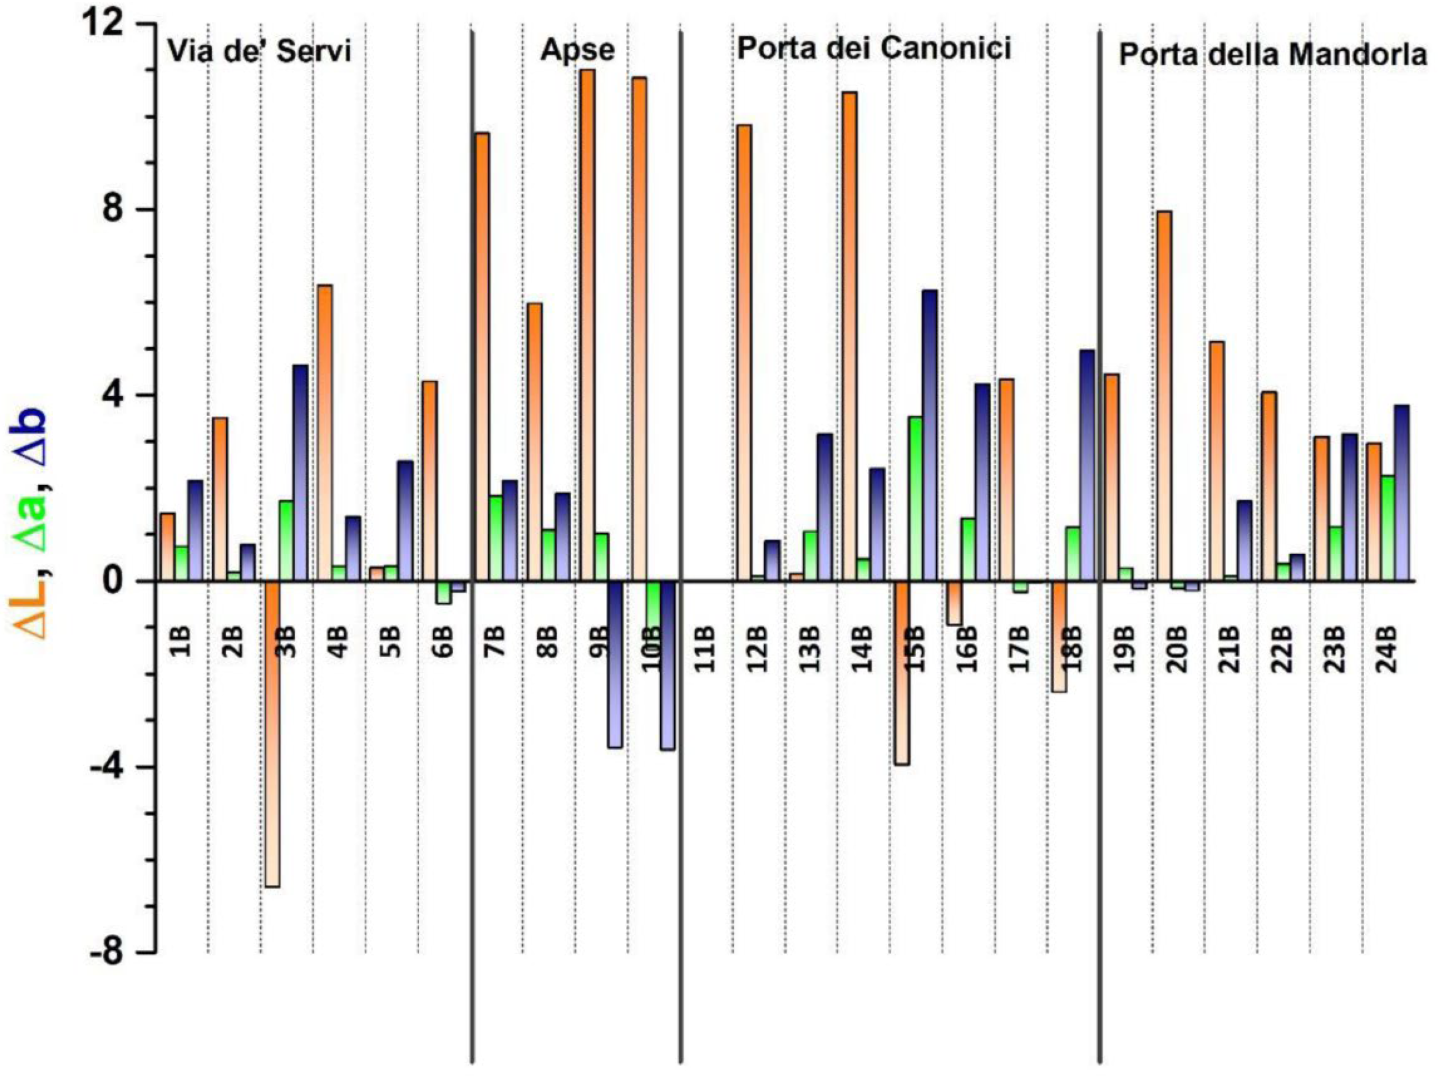
3.1. Colorimetry
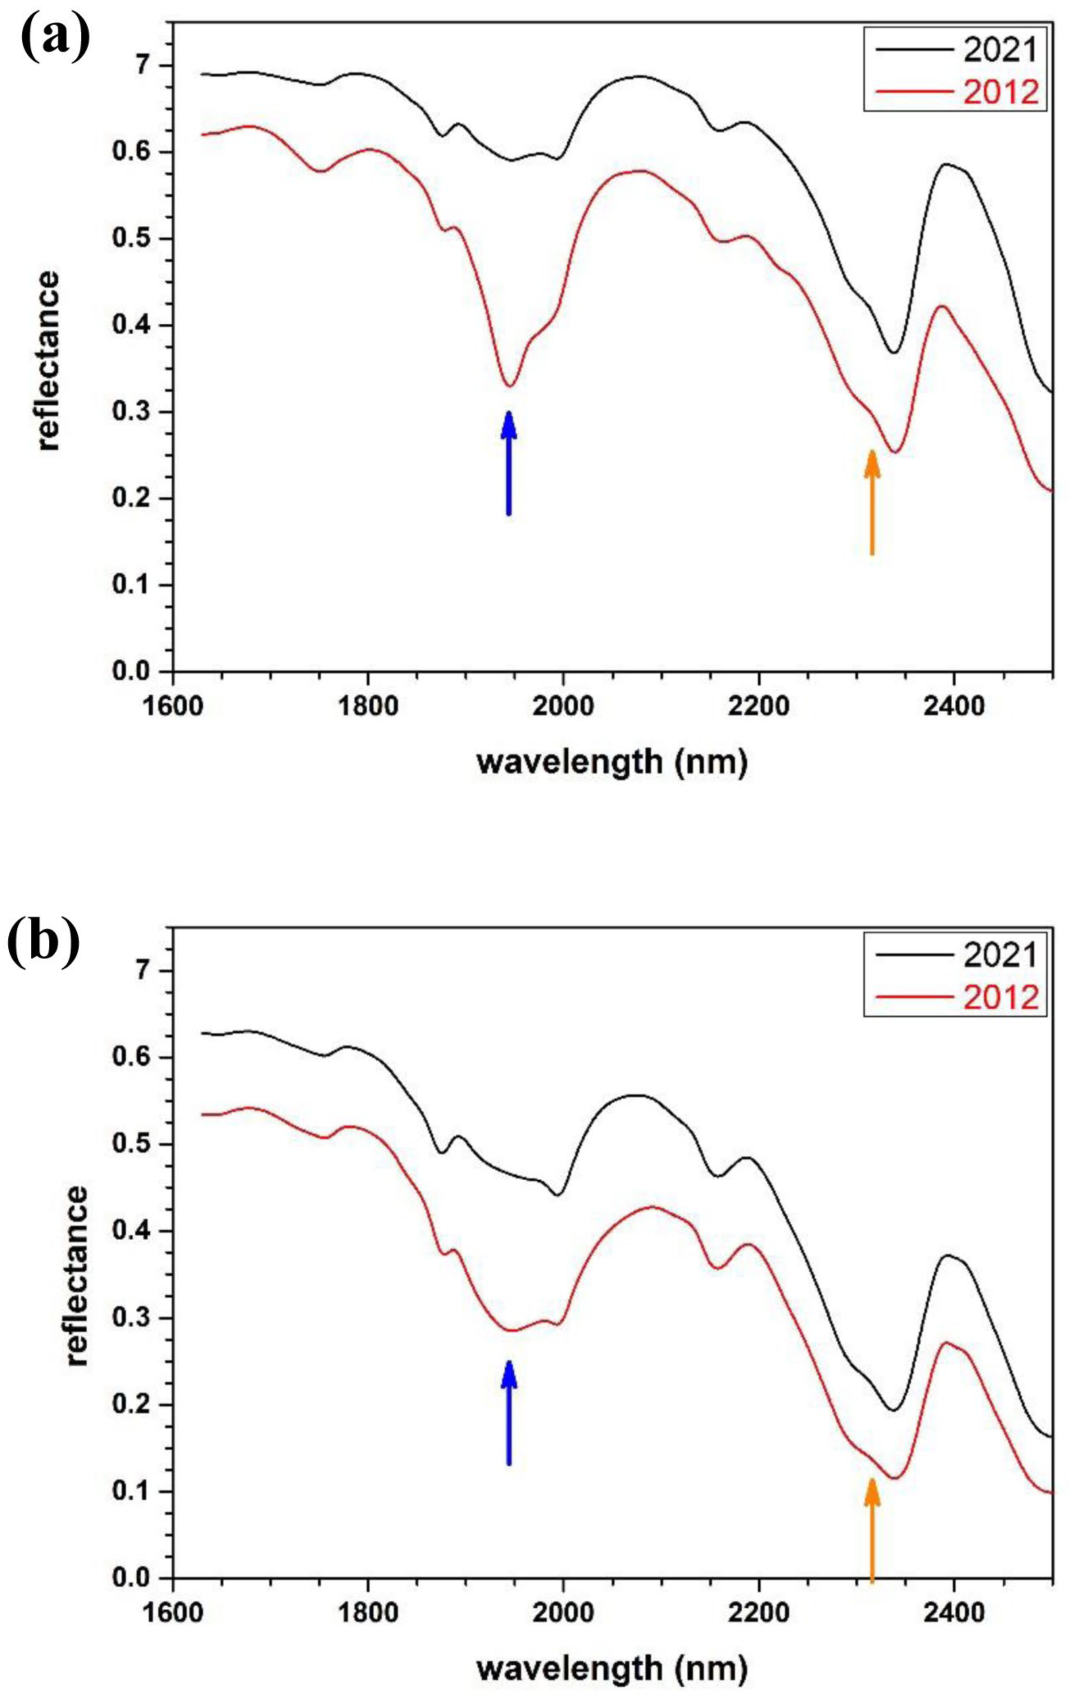
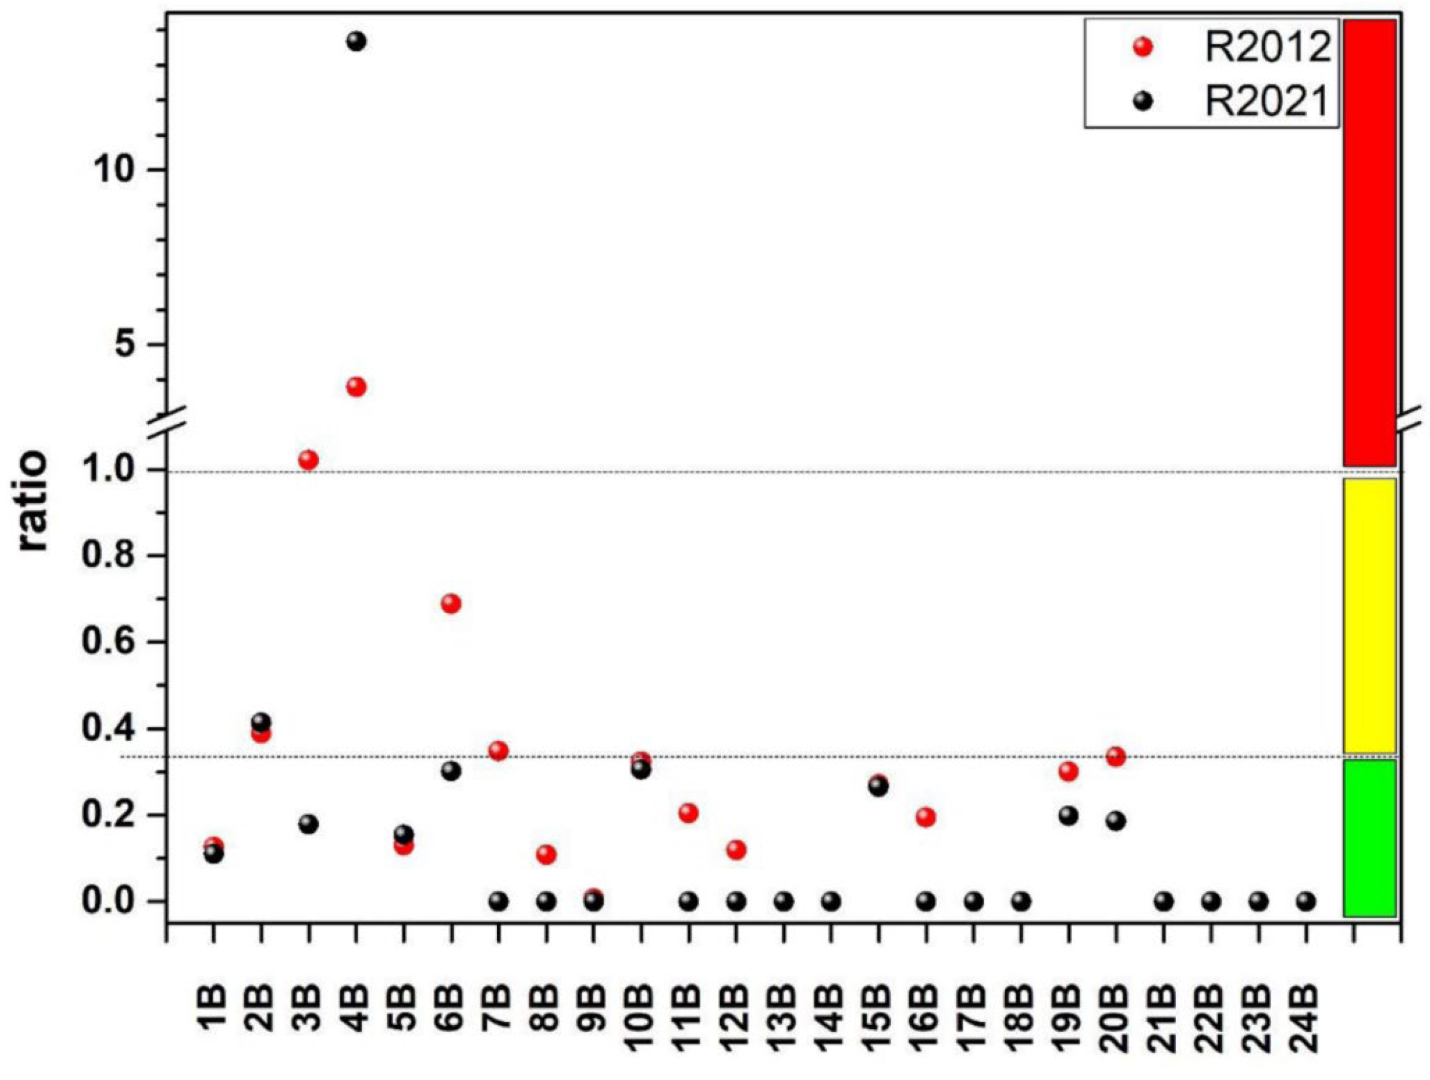
3.2. SWIR Spectrometry
4. Discussion and Conclusions
- from the colorimetric investigations, a general increase in ΔL*;
- from the SWIR investigations, a general decrease in the gypsum content.
Supplementary Materials
Author Contributions
Funding
Institutional Review Board Statement
Informed Consent Statement
Data Availability Statement
Acknowledgments
Conflicts of Interest
References
- Del Fà, R.M.; Casciani, A.; Vettori, S.; Cuzman, O.A.; Tiano, P.; Rosa, P.; Riminesi, C. Sustainable Conservation and Restoration of Historical Gardens. In Handbook of Cultural Heritage Analysis; D’Amico, S., Venuti, V., Eds.; Springer: Cham, Switzerland, 2022; pp. 1745–1762. [Google Scholar] [CrossRef]
- EN 17429:2020; Conservation of Cultural Heritage—Procurement of Conservation Services and Works. BSI: London, UK, 2020.
- Gulotta, D.; Toniolo, L. Preliminary Investigations, Condition Assessment, and Mapping of the Deterioration Patterns. In Conserving Stone Heritage. Cultural Heritage Science; Gherardi, F., Maravelaki, P.N., Eds.; Springer: Cham, Switzerland, 2022; pp. 1–36. [Google Scholar]
- Bracci, S.; Cagnini, A.; Colombini, M.; Cuzman, O.; Fratini, F.; Galeotti, M.; Magrini, D.; del Fà, R.M.; Porcinai, S.; Rescic, S.; et al. A multi-analytical approach to monitor three outdoor contemporary artworks at the Gori Collection (Fattoria di Celle, Santomato, Pistoia, Italy). Microchem. J. 2016, 124, 878–888. [Google Scholar] [CrossRef]
- Honeyborne, D.B. Weathering and decay of Masonry. In Conservation of Building and Decorative Stones; Ashurst, J., Dimes, F.G., Eds.; Butterworth-Heinemann: London, UK, 1990; pp. 153–184. [Google Scholar]
- Brimblecombe, P. Air Pollution and Architecture: Past, Present and Future. J. Arch. Conserv. 2000, 6, 30–46. [Google Scholar] [CrossRef]
- Tyndall, G.S.; Ravishankara, A.R. Atmospheric oxidation of reduced sulfur species. Int. J. Chem. Kinet. 1991, 23, 483–527. [Google Scholar] [CrossRef]
- Camuffo, D.; Del Monte, M.; Sabbioni, C.; Vittori, O. Wetting, deterioration and visual features of stone surfaces in an urban area. Atmos. Environ. 1982, 16, 2253–2259. [Google Scholar] [CrossRef]
- Del Monte, M.; Sabbioni, C.; Vittori, O. Airborne carbon particles and marble deterioration. Atmos. Environ. 1981, 15, 645–652. [Google Scholar] [CrossRef]
- Del Monte, M.; Sabbioni, C. Gypsum crusts and fly ash particles on carbonatic outcrops. Arch. Meteorol. Geophys. Bioclimatol. Ser. B 1984, 35, 105–111. [Google Scholar] [CrossRef]
- Nord, A.G.; Tronner, K. Stone Weathering, Air Pollution Effects Evidenced by Chemical Analysis; Conservation Institute of National Antiquities; The Central Board of National Antiquities and the National Historical Museums; Conservation Institute, Rapport. RIK 4; Gotab: Stockholm, Sweden, 1991; p. 80. [Google Scholar]
- Charola, A.E.; Pühringer, J.; Steiger, M. Gypsum: A review of its role in the deterioration of building materials. Environ. Geol. 2007, 52, 339–352. [Google Scholar] [CrossRef]
- Török, A.; Licha, T.; Simon, K.; Siegesmund, S. Urban and rural limestone weathering; the contribution of dust to black crust formation. Environ. Earth Sci. 2011, 63, 675–693. [Google Scholar] [CrossRef]
- Fermo, P.; Turrion, R.G.; Rosa, M.; Omegna, A. A new approach to assess the chemical composition of powder deposits damaging the stone surfaces of historical monuments. Environ. Sci. Pollut. Res. 2015, 22, 6262–6270. [Google Scholar] [CrossRef]
- Pozo-Antonio, J.; Pereira, M.; Rocha, C. Microscopic characterisation of black crusts on different substrates. Sci. Total. Environ. 2017, 584-585, 291–306. [Google Scholar] [CrossRef]
- La Russa, M.F.; Fermo, P.; Comite, V.; Belfiore, C.M.; Barca, D.; Cerioni, A.; De Santis, M.; Barbagallo, L.F.; Ricca, M.; Ruffolo, S.A. The Oceanus statue of the Fontana di Trevi (Rome): The analysis of black crust as a tool to investigate the urban air pollution and its impact on the stone degradation. Sci. Total. Environ. 2017, 593-594, 297–309. [Google Scholar] [CrossRef]
- Rodríguez, M.C.; Dupont-Courtade, L.; Oueslati, W. Air pollution and urban structure linkages: Evidence from European cities. Renew. Sustain. Energy Rev. 2016, 53, 1–9. [Google Scholar] [CrossRef]
- Comite, V.; Álvarez de Buergo, M.; Barca, D.; Belfiore, C.M.; Bonazza, A.; La Russa, M.F.; Pezzino, A.; Randazzo, L.; Ruffolo, S.A. Damage monitoring on carbonate stones: Field exposure tests contributing to pollution impact evaluation in two Italian sites. Constr. Build. Mater. 2017, 152, 907–922. [Google Scholar] [CrossRef]
- Comite, V.; Miani, A.; Ricca, M.; La Russa, M.; Pulimeno, M.; Fermo, P. The impact of atmospheric pollution on outdoor cultural heritage: An analytic methodology for the characterization of the carbonaceous fraction in black crusts present on stone surfaces. Environ. Res. 2021, 201, 111565–111575. [Google Scholar] [CrossRef]
- Thornbush, M.J.; Viles, H.A. Simulation of the dissolution of weathered versus unweathered limestone in carbonic acid solutions of varying strength. Earth Surf. Process. Landf. J. Br. Geomorphol. Res. Group 2007, 32, 841–852. [Google Scholar] [CrossRef]
- Cardell-Fernández, C.; Vleugels, G.; Torfs, K.; Van Grieken, R. The processes dominating Ca dissolution of limestone when exposed to ambient atmospheric conditions as determined by comparing dissolution models. Environ. Geol. 2002, 43, 160–171. [Google Scholar]
- Bonazza, A.; Messina, P.; Sabbioni, C.; Grossi, C.M.; Brimblecombe, P. Mapping the impact of climate change on surface recession of carbonate buildings in Europe. Sci. Total Environ. 2009, 407, 2039–2050. [Google Scholar] [CrossRef]
- Hunt, G.R.; Salisbury, J.W. Visible and near-infrared spectra of minerals and rocks: II. Carbonates. Mod. Geol. 1971, 2, 23–30. [Google Scholar]
- Gaffey, S.J. Spectral reflectance of-carbonate minerals in the visible and near infrared (0.35–2.55 microns): Calcite, aragonite, and dolomite. Am. Miner. 1986, 71, 151–162. [Google Scholar]
- Cloutis, E.A.; Hawthorne, F.C.; Mertzman, S.A.; Krenn, K.; Craig, M.A.; Marcino, D.; Methot, M.; Strong, J.; Mustard, J.F.; Blaney, D.L.; et al. Detection and discrimination of sulfate minerals using reflectance spectroscopy. Icarus 2006, 184, 121–157. [Google Scholar] [CrossRef]
- Camaiti, M.; Vettori, S.; Benvenuti, M.; Chiarantini, L.; Costagliola, P.; Di Benedetto, F.; Moretti, S.; Paba, F.; Pecchioni, E. Hyperspectral sensor for gypsum detection on monumental buildings. J. Geophys. Eng. 2011, 8, S126–S131. [Google Scholar] [CrossRef]
- Suzuki, A.; Vettori, S.; Giorgi, S.; Carretti, E.; Di Benedetto, F.; Dei, L.; Benvenuti, M.; Moretti, S.; Pecchioni, E.; Costagliola, P. Laboratory study of the sulfation of carbonate stones through SWIR hyperspectral investigation. J. Cult. Herit. 2018, 32, 30–37. [Google Scholar] [CrossRef]
- Vettori, S.; Verrucchi, M.; Di Benedetto, F.; Gioventù, E.; Benvenuti, M.; Pecchioni, E.; Costagliola, P.; Cagnini, A.; Porcinai, S.; Rimondi, V.; et al. Hyperspectral sensor: A handy tool to evaluate the efficacy of cleaning procedures. J. Cult. Herit. 2021, 49, 79–84. [Google Scholar] [CrossRef]
- Malesani, P.; Pecchioni, E.; Cantisani, E.; Fratini, F. Geolithology and provenance of the materials of the some historical buildings and monuments of Firenze centre (Italy). Episodes 2003, 26, 250–255. [Google Scholar] [CrossRef] [PubMed]
- Guasti, C. Santa Maria del Fiore: La Costruzione della Chiesa e del Campanile; Ricci, M., Ed.; Adamant Media Corporation : Firenze, Italy, 1887; p. 452. [Google Scholar]
- Rodolico, F. Le Pietre Delle Città d’Italia; Lambertini, D., Ed.; Le Monnier Press: Firenze, Italy, 1995; p. 501. [Google Scholar]
- Acidini Luchinat, C. La Cattedrale di Santa Maria del Fiore a Firenze. Giunti, M., Ed.; Cassa di Risparmio di Firenze: Firenze, Italia, 1995; p. 389. [Google Scholar]
- Cantisani, E.; Pecchioni, E.; Fratini, F.; Garzonio, C.A.; Malesani, P.; Molli, G. Thermal stress in the Apuan Marble: Relationship between microstructure and petro-physical characteristics. Int. J. Rock Mech. Min. 2009, 46, 128–137. [Google Scholar] [CrossRef]
- UNI EN ISO 18314-1:2019; Analytical Colorimetry—Part 1: Practical Colour Measurement. UNI: Milano, Italia, 2019.
- Clark, R.N.; Swayze, G.A.; Gallagher, A.J.; King, T.V.V.; Calvin, W.M. The U.S. Geological Survey, Digital Spectral Library. Version 1: 0.2 to 3.0 Microns. U.S. Geological Survey Open File Report 93-592; 1993; p. 1340. Available online: https://pubs.usgs.gov/of/1993/0592/report.pdf (accessed on 8 November 2022).
- UNI EN ISO/CIE 11664-4:2019; Colorimetria—Parte 4: Spazio Colore L* a* b* CIE 1976. UNI: Milano, Italia, 2019.
- Grossi, C.; Esbert, R.; Díaz-Pache, F.; Alonso, F. Soiling of building stones in urban environments. Build. Environ. 2003, 38, 147–159. [Google Scholar] [CrossRef]
- García, O.; Malaga, K. Definition of the procedure to determine the suitability and durability of an anti-graffiti product for application on cultural heritage porous materials. J. Cult. Herit. 2012, 13, 77–82. [Google Scholar] [CrossRef]
- Becherini, F.; Pastorelli, G.; Valotto, G.; Gambirasi, A.; Bianchin, S.; Favaro, M. Effects of protective treatments on particle deposition and colour variation in stone surfaces exposed to an urban environment. Prog. Org. Coat. 2017, 112, 75–85. [Google Scholar] [CrossRef]
- Mahy, M.; Van Eycken, L.; Oosterlinck, A. Evaluation of uniform color spaces developed after the adoption of CIELAB and CIELUV. Color Res. Appl. 1994, 19, 105–121. [Google Scholar]
- Sharma, G. Digital Color Imaging Handbook; CRC Press: Boca Raton, FL, USA, 2003. [Google Scholar]
- Mokrzycki, W.S.; Tatol, M. Colour difference ΔE—A survey. Mach. Graph. Vis. 2011, 20, 383–411. [Google Scholar]


| Spot Areas | ΔL* | Δa* | Δb* | ΔE |
|---|---|---|---|---|
| 1B | 1.45 | 0.74 | 2.15 | 2.7(7) |
| 2B | 3.51 | 0.18 | 0.78 | 3.6(7) |
| 3B | −6.59 | 1.71 | 4.63 | 8(1) |
| 4B | 6.36 | 0.31 | 1.38 | 7(1) |
| 5B | 0.28 | 0.32 | 2.57 | 3(2) |
| 6B | 4.29 | −0.49 | −0.23 | 4(1) |
| 7B | 9.64 | 1.83 | 2.16 | 10(3) |
| 8B | 5.97 | 1.09 | 1.88 | 6(2) |
| 9B | 11.01 | 1.02 | −3.59 | 12(1) |
| 10B | 10.83 | −1.48 | −3.63 | 12(2) |
| 11B | - | - | - | - |
| 12B | 9.80 | 0.10 | 0.86 | 10(6) |
| 13B | 0.15 | 1.06 | 3.16 | 3(3) |
| 14B | 10.51 | 0.47 | 2.41 | 11(2) |
| 15B | −3.96 | 3.52 | 6.25 | 8(3) |
| 16B | −0.96 | 1.34 | 4.24 | 5(3) |
| 17B | 4.34 | −0.24 | −0.03 | 4(2) |
| 18B | −2.39 | 1.15 | 4.96 | 6(5) |
| 19B | 4.45 | 0.27 | −0.16 | 4.5(4) |
| 20B | 7.95 | −0.16 | −0.21 | 8(1) |
| 21B | 5.14 | 0.10 | 1.72 | 5(2) |
| 22B | 4.06 | 0.36 | 0.56 | 4(2) |
| 23B | 3.10 | 1.16 | 3.16 | 5(1) |
| 24B | 2.95 | 2.26 | 3.78 | 5(1) |
Disclaimer/Publisher’s Note: The statements, opinions and data contained in all publications are solely those of the individual author(s) and contributor(s) and not of MDPI and/or the editor(s). MDPI and/or the editor(s) disclaim responsibility for any injury to people or property resulting from any ideas, methods, instructions or products referred to in the content. |
© 2023 by the authors. Licensee MDPI, Basel, Switzerland. This article is an open access article distributed under the terms and conditions of the Creative Commons Attribution (CC BY) license (https://creativecommons.org/licenses/by/4.0/).
Share and Cite
Vettori, S.; Romoli, D.; Salvatici, T.; Rimondi, V.; Pecchioni, E.; Moretti, S.; Benvenuti, M.; Costagliola, P.; Manganelli Del Fà, R.; Coppola, M.; et al. Non-Invasive SWIR Monitoring of White Marble Surface of the Cathedral of Santa Maria del Fiore (Florence, Italy). Sustainability 2023, 15, 1421. https://doi.org/10.3390/su15021421
Vettori S, Romoli D, Salvatici T, Rimondi V, Pecchioni E, Moretti S, Benvenuti M, Costagliola P, Manganelli Del Fà R, Coppola M, et al. Non-Invasive SWIR Monitoring of White Marble Surface of the Cathedral of Santa Maria del Fiore (Florence, Italy). Sustainability. 2023; 15(2):1421. https://doi.org/10.3390/su15021421
Chicago/Turabian StyleVettori, Silvia, Davide Romoli, Teresa Salvatici, Valentina Rimondi, Elena Pecchioni, Sandro Moretti, Marco Benvenuti, Pilario Costagliola, Rachele Manganelli Del Fà, Michele Coppola, and et al. 2023. "Non-Invasive SWIR Monitoring of White Marble Surface of the Cathedral of Santa Maria del Fiore (Florence, Italy)" Sustainability 15, no. 2: 1421. https://doi.org/10.3390/su15021421
APA StyleVettori, S., Romoli, D., Salvatici, T., Rimondi, V., Pecchioni, E., Moretti, S., Benvenuti, M., Costagliola, P., Manganelli Del Fà, R., Coppola, M., Agostini, B., & Di Benedetto, F. (2023). Non-Invasive SWIR Monitoring of White Marble Surface of the Cathedral of Santa Maria del Fiore (Florence, Italy). Sustainability, 15(2), 1421. https://doi.org/10.3390/su15021421