Article

Study on the MOF Frame Pt-TiO2 Hybrid Photocatalyst and Its Photocatalytic Performance

College of Chemistry and Chemical Engineering, Ocean University of China, 238 Songling Road, Laoshan District, Qingdao 266100, China
*
Author to whom correspondence should be addressed.
Sustainability 2023, 15(2), 1403; https://doi.org/10.3390/su15021403
Submission received: 28 November 2022 / Revised: 3 January 2023 / Accepted: 8 January 2023 / Published: 11 January 2023
(This article belongs to the Section Sustainable Engineering and Science)

Abstract

:
As the efficient catalysts are synthesized by a simple strategy, photocatalysis offers a sustainable route to solve the problem of environmentally sound treatment of industrial dye wastewater. Herein, Pt-doped TiO2 with MIL-125 as the backbone has been fabricated using thermal synthesis. The photocatalytic efficiency of the synthesized catalyst samples was tested using Rhodamine B (RhB) as the contaminant model. The physicochemical properties of the solid specimens were characterized using XRD, SEM, TEM, BET and EDX techniques. The photocatalytic degradation experiments showed that the photocatalytic degradation of RhB by M-Pt-TiO2 was 98.97% after 30 min of degradation. The radical capture experiments showed that superoxide radicals and conduction band electrons as reactive oxygen species played a major role in the degradation process. After four cycles, the photocatalytic activity of M-Pt-TiO2 decreased from 98.4% to 94.9%, indicating that the photocatalyst sample had good photocatalytic stability.

1. Introduction

With rapid social and economic development, the question of how to treat industrial wastewater in a rational and efficient manner has to be addressed [1]. As one of the major types of industrial wastewater, dye wastewater is characterized by complex composition, high chromaticity and its difficulty with biodegradation. Some of the dye wastewater is also highly toxic and has “tritogenic” effects (mutagenesis, carcinogenesis and teratogenesis), which can cause serious harm to the ecological environment and human health. Once a large amount of dye wastewater enters an aquatic ecosystem, it can be very harmful to the ecosystem. Photocatalytic oxidation technology provides a green and sustainable way to purify air and bodies of water. It mainly uses semiconductor materials as a medium to convert light energy into chemical energy and produces oxygen-containing groups with a certain oxidation capacity to achieve the effective degradation of pollutants in water bodies. Due to its high efficiency, safety and environmental friendliness, photocatalytic oxidation is now widely used in industrial wastewater treatment [2,3,4].
Metal-organic frameworks (MOFs) is a generic term for a class of organic–inorganic hybrid materials, which usually form a multidimensional spatial lattice structure linking different metal ions or groups through multidentate organic groups [5,6]. MOFs are characterized by high pore volume, high specific surface area and variable pore size and functional groups and have gained widespread interest in gas adsorption and storage, catalysis and optoelectronics [7,8,9]. MOFs have been widely used in the field of photocatalysis. The band gap of MOFs is closely related to their HOMO-LUMO energy levels and their photo-responsiveness can be improved by modulating the central metal or organic ligands [10,11]. As a typical Ti-based MOF material with photocatalytic activity, MIL-125 uses TiO2 octahedra as the metal framework and is linked by p-phenylene dimethyl (BDC) organic groups to form a three-dimensional spatial lattice structure with good water/light stability, which has promising applications in photocatalysis [12,13]. However, MIL-125 has a forbidden band width of approximately 3.6 eV and its weak spectral absorption and slow carrier transport limit its catalytic performance [14]. It needs to be compounded with other low-bandwidth materials to effectively enhance its photocatalytic performance. The advantage of MOFs compared to other solid state synthesis precursors of metal oxides is their porosity and long-term orderliness, which provides unique opportunities for the synthesis of unusual metal oxide morphologies. In order to obtain TiO2 materials, the Ti-containing MOFs (e.g., MIL-125) can be used as sacrificative precursors. Zhao et al. [15] reported a series of TiOx/C composites, prepared by pyrolyzing MIL-125, which exhibited excellent catalytic activities towards the photodegradation of methylene blue (MB) in aqueous solution. Khaletskaya et al. [16] reported that a series of gold/titania nanocomposites GNP/TiO2, fabricated through the pyrolysis of GNP/NH2-MIL-125 nanocrystals, has significantly increased the photocatalytic activity for the reduction of CO2 to CH4.
Noble metals are generally not involved in chemical reactions and, distributed in a specific form and size, they can improve the photo-response range and photocatalytic reaction rate of catalysts. Thus, noble metals are often used for photocatalytic modification of MOF frameworks. The most commonly used noble metals at this stage are Pt, Pd, Ru, Au, etc. Currently, research on the noble metal Pt is extensive because the outermost D d-orbital electrons of Pt are unfilled with transition states (or active intermediates), creating noble metal catalysts endowed with excellent catalytic activities [17]. Tai et al. [18] reported a series of photocatalysts CdS/Pt/MIL-125 fabricated using γ-ray irradiation and the hydrogen generation rate was measured to 6783.5 μmol/(g·h) under visible-light illumination, much higher than similar non-ternary catalysts.
In this work, we prepared Pt-MIL-125 by a one-step method and, based on this, Pt-TiO2 with MIL-125 as the backbone was prepared by thermal synthesis. The internal structure, elemental composition and morphology of the catalysts were characterized using XRD, XPS, SEM, EDS and BET. The organic pollutant Rhodamine B (RhB) was selected as the degradation target and the effects of catalyst input and light conditions on the photodegradation ability of the catalyst were investigated. Finally, the photocatalytic degradation mechanism of M-Pt-TiO2 on the target degradation products was investigated by trapping agent experiments.

2. Experimental Section

2.1. Experimental Reagents

Details of reagents and related parameters required for the experiments are shown in Table 1. In order to meet the next step in the preparation of the experimental material, the reagents in Table 1 need to be pre-treated to some extent, i.e., impurities and unwanted substances are filtered out and the reagents are mixed with an aqueous or ethanol solution to prepare the desired liquid.

2.2. Experimental Instruments

The instruments and parameters used to prepare the photocatalytic composites are shown in Table 2.

2.3. Experimental Methods and Conditions

2.3.1. Preparation of Catalysts

Schematic representation of M-Pt-TiO2 is shown in Figure 1. First, 0.5 g of terephthalic acid and 0.26 mL of tetra-butyl titanate were added to 10 mL of DMF solution mixed with 1 mL of methanol and stirred for 30 min, after which they were poured into a 20 mL reaction tank and reacted in an oven at 150 °C for 36 h. The reaction solution was removed and centrifuged and the solid part was washed 3 times with DMF and ethanol and dried at 80 °C for 10 h to obtain MIL-125.
Eight grams of MIL-125 were dispersed in 30 mL of ethanolic solution dissolved with 0.5 g of chloroplatinic acid, stirred for 20 min and then centrifuged to dry at 60 °C for 12 h to obtain Pt-doped MIL-125.
M-Pt-TiO2 was obtained by placing Pt-doped MIL-125 in an alumina crucible which was placed in a muffle furnace and sintered at 530 °C for 30 min. The furnace was cooled at a rate of 2 °C/min.
M-TiO2 was prepared by MIL-125 using the same method.

2.3.2. Characterization of Catalysts

The catalyst was subjected to physical phase analysis, diffraction pattern indexing and grain size determination by X-ray diffraction (XRD; Bruker, D8-ADVANCE, 40 kV, 40 mA, Cu Ka, Billerica, MA, USA). Scanning electron microscopy (SEM; Hitachi, S-4800, Tokyo, Japan) was used to observe the surface morphology and loading of the catalyst carriers and transmission electron microscopy (TEM; FEI-Tencai G2 F20S-TWIN, Hillsboro, OR, USA) was used to characterize the microscopic morphology as well as the two-dimensional geometry of the catalysts using electrons as the illumination beam. A gas adsorption analyzer and N2 adsorption-desorption isotherm curves were used to characterize the specific surface area and pore structure of the solid catalysts. Fourier transform infrared spectroscopy (FTIR) was used to detect changes in the molecular structure and functional groups in the range of 400–4000 cm−1. Solid UV–Vis was used for the characterization of the catalyst surface light absorption capacity at 200~800 nm; X-ray photoelectron spectroscopy (XPS) was used to characterize elemental composition, valence distribution and elemental content of the material.

2.3.3. Photocatalyst Performance Testing

The molecular and structural formulae of Rhodamine B (RhB) are shown in Table 3. As a classical water-soluble cationic dye, RhB has large molecular weight and structures such as heteroatomic benzene rings and nitrogen-containing groups that are not easily degraded by conventional means, so is well suited as a model compound of dye wastewater for photocatalytic degradation. In this paper, the photocatalytic performance of samples was determined using RhB as the target degradant.
A 40 W UV lamp (wavelength 254 nm) was used as the light source for the photocatalytic degradation of RhB. During the experiment, 50 mg of the sample was added to 100 mL of RhB solution at a concentration of 5 ppm and stirred for 30 min in the dark. Then, the light source was switched on and 3 mL of the sample solution was taken at 5 min intervals for measurement.
The RhB concentration was measured by UV spectrophotometry: the light absorption intensity of the supernatant of the above 5 mL solution was measured using a UV spectrophotometer at 554 nm according to Lambert–Beer’s law,
A = lg ( 1 / T ) = ε × b × c
where A represents the absorbance of the sample and T is the transmission ratio (transmittance), which is the intensity of the outgoing light (I) over the intensity of the incoming light (I0). ε represents the molar absorption coefficient, b represents the thickness of the cuvette when light is transmitted through it and c represents the molar concentration of the degradation solution. The absorbance of the sample is proportional to its concentration and therefore, the degradation rate of the degradate can be obtained from the following equation:
X = ( C 0 C t ) / C o × 100 %
where X represents the degradation rate, C0 is the initial concentration of the degradation solution and Ct represents the molar concentration of the solution at different times.

3. Results and Discussion

3.1. Characterisation of M-Pt-TiO2 Photocatalysts

3.1.1. X-ray Diffraction Pattern

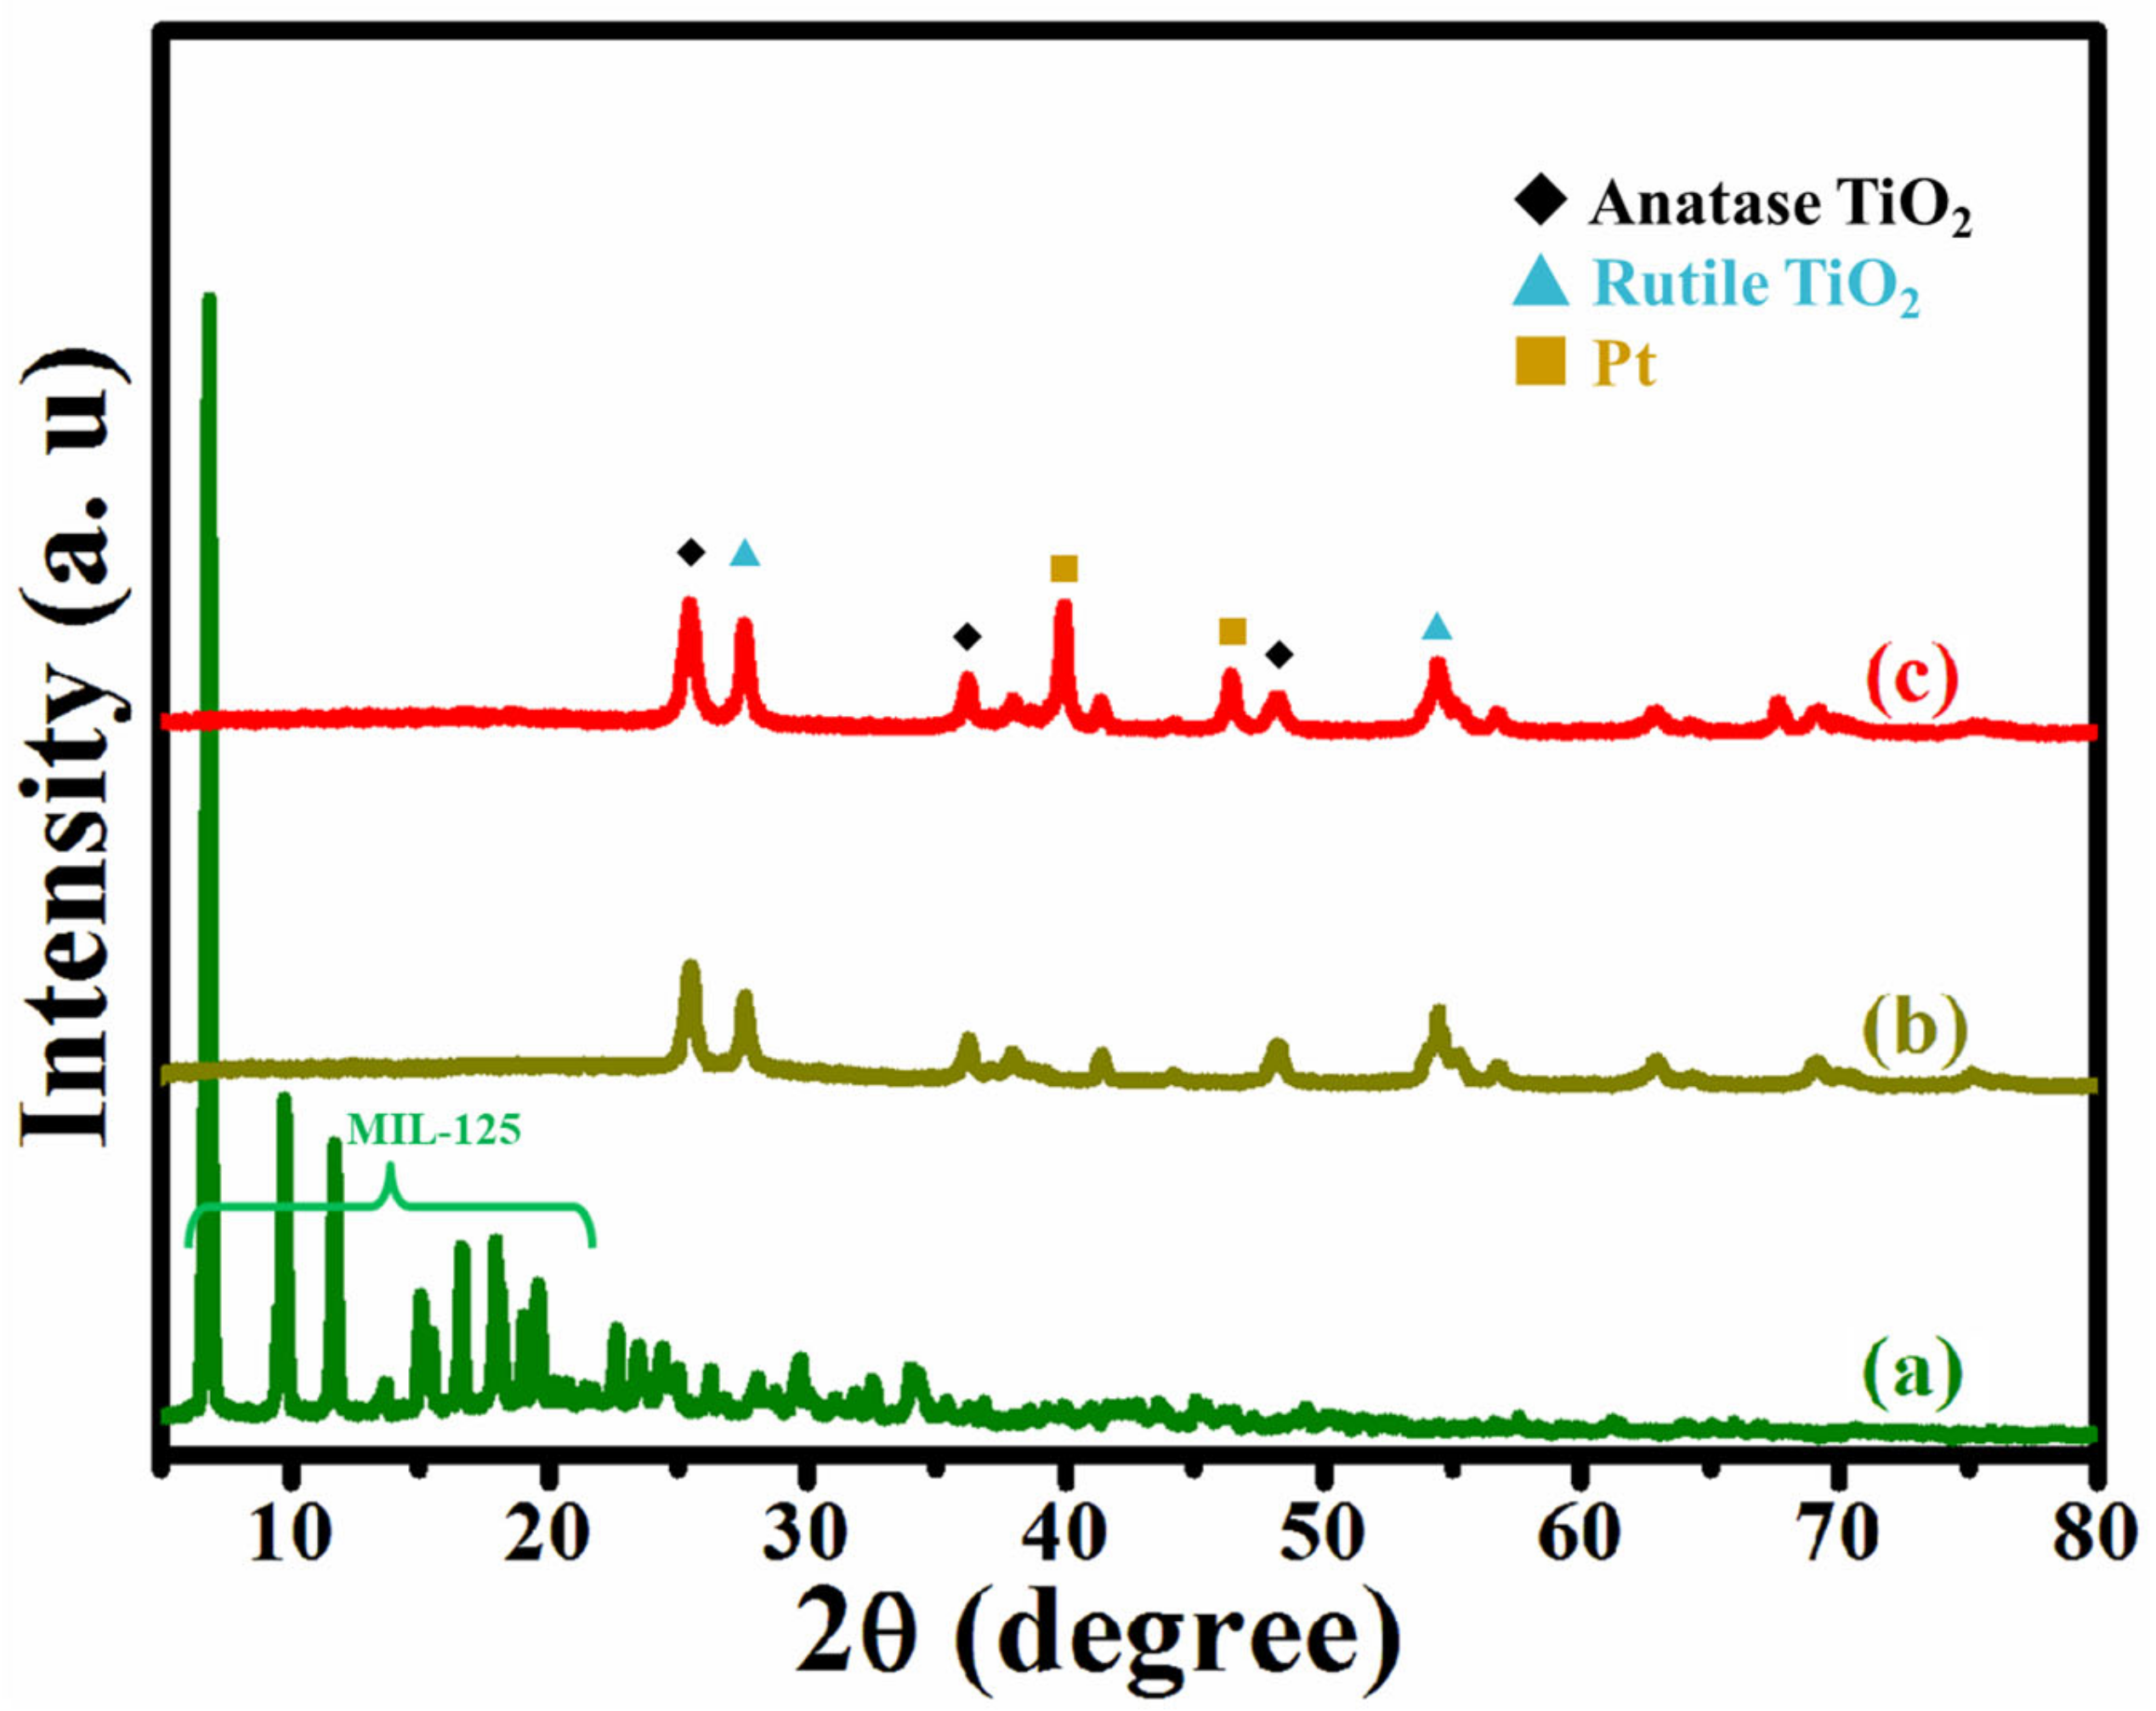
As seen from Figure 2, the diffraction peaks of MIL-125 are consistent with the simulated MIL-125 peaks, demonstrating the successful synthesis of MIL-125 by the solvothermal method. No characteristic peaks of MIL-125 were observed for the M-TiO2 or M-Pt-TiO2 curves, indicating that the MOF structure was completely decomposed. The diffraction peaks at 25.48, 37.96 and 48.32 correspond to the (101), (004) and (200) crystallographic planes of anatase phase TiO2, respectively and 27.64 and 54.48 correspond to the (110) and (211) crystallographic planes of rutile phase TiO2, respectively [19]. This indicates that the TiO2 in the sample is a composite state of anatase and rutile phases and, after the calcination process, the internal structure is that of MIL-125. In the M-Pt-TiO2 curve, the diffraction peaks at 39.94 and 46.44 correspond to the (111) and (200) crystallographic planes of the face-centred cubic crystal Pt (JCPDS no. 87-0644), respectively, demonstrating the successful loading of Pt nanoparticles onto TiO2.

3.1.2. SEM and TEM Analysis

As shown in Figure 3, the MIL-125 prepared in Figure 3a had a circular cake particle shape with a diameter of approximately 500 nm. Figure 3b,c show the catalysts prepared by calcination and the original shape of the MIL-125 precursor was kept intact from the microtopography. The particle size of M-TiO2 in Figure 3b is reduced compared with that of MIL-125 before treatment, while defects and clefts appear on the surface, indicating that, after calcination treatment, the internal structure of MIL-125 has a certain degree of shrinkage, which results from the thermal decomposition of the framework of organic ligands serving as the supporting crystal structure. There are obvious defects on the surface of catalyst particles compared with the former two in Figure 3c; meanwhile, nano Pt particles attachment on the surface can be observed and the average diameter was measured as 24 nm.
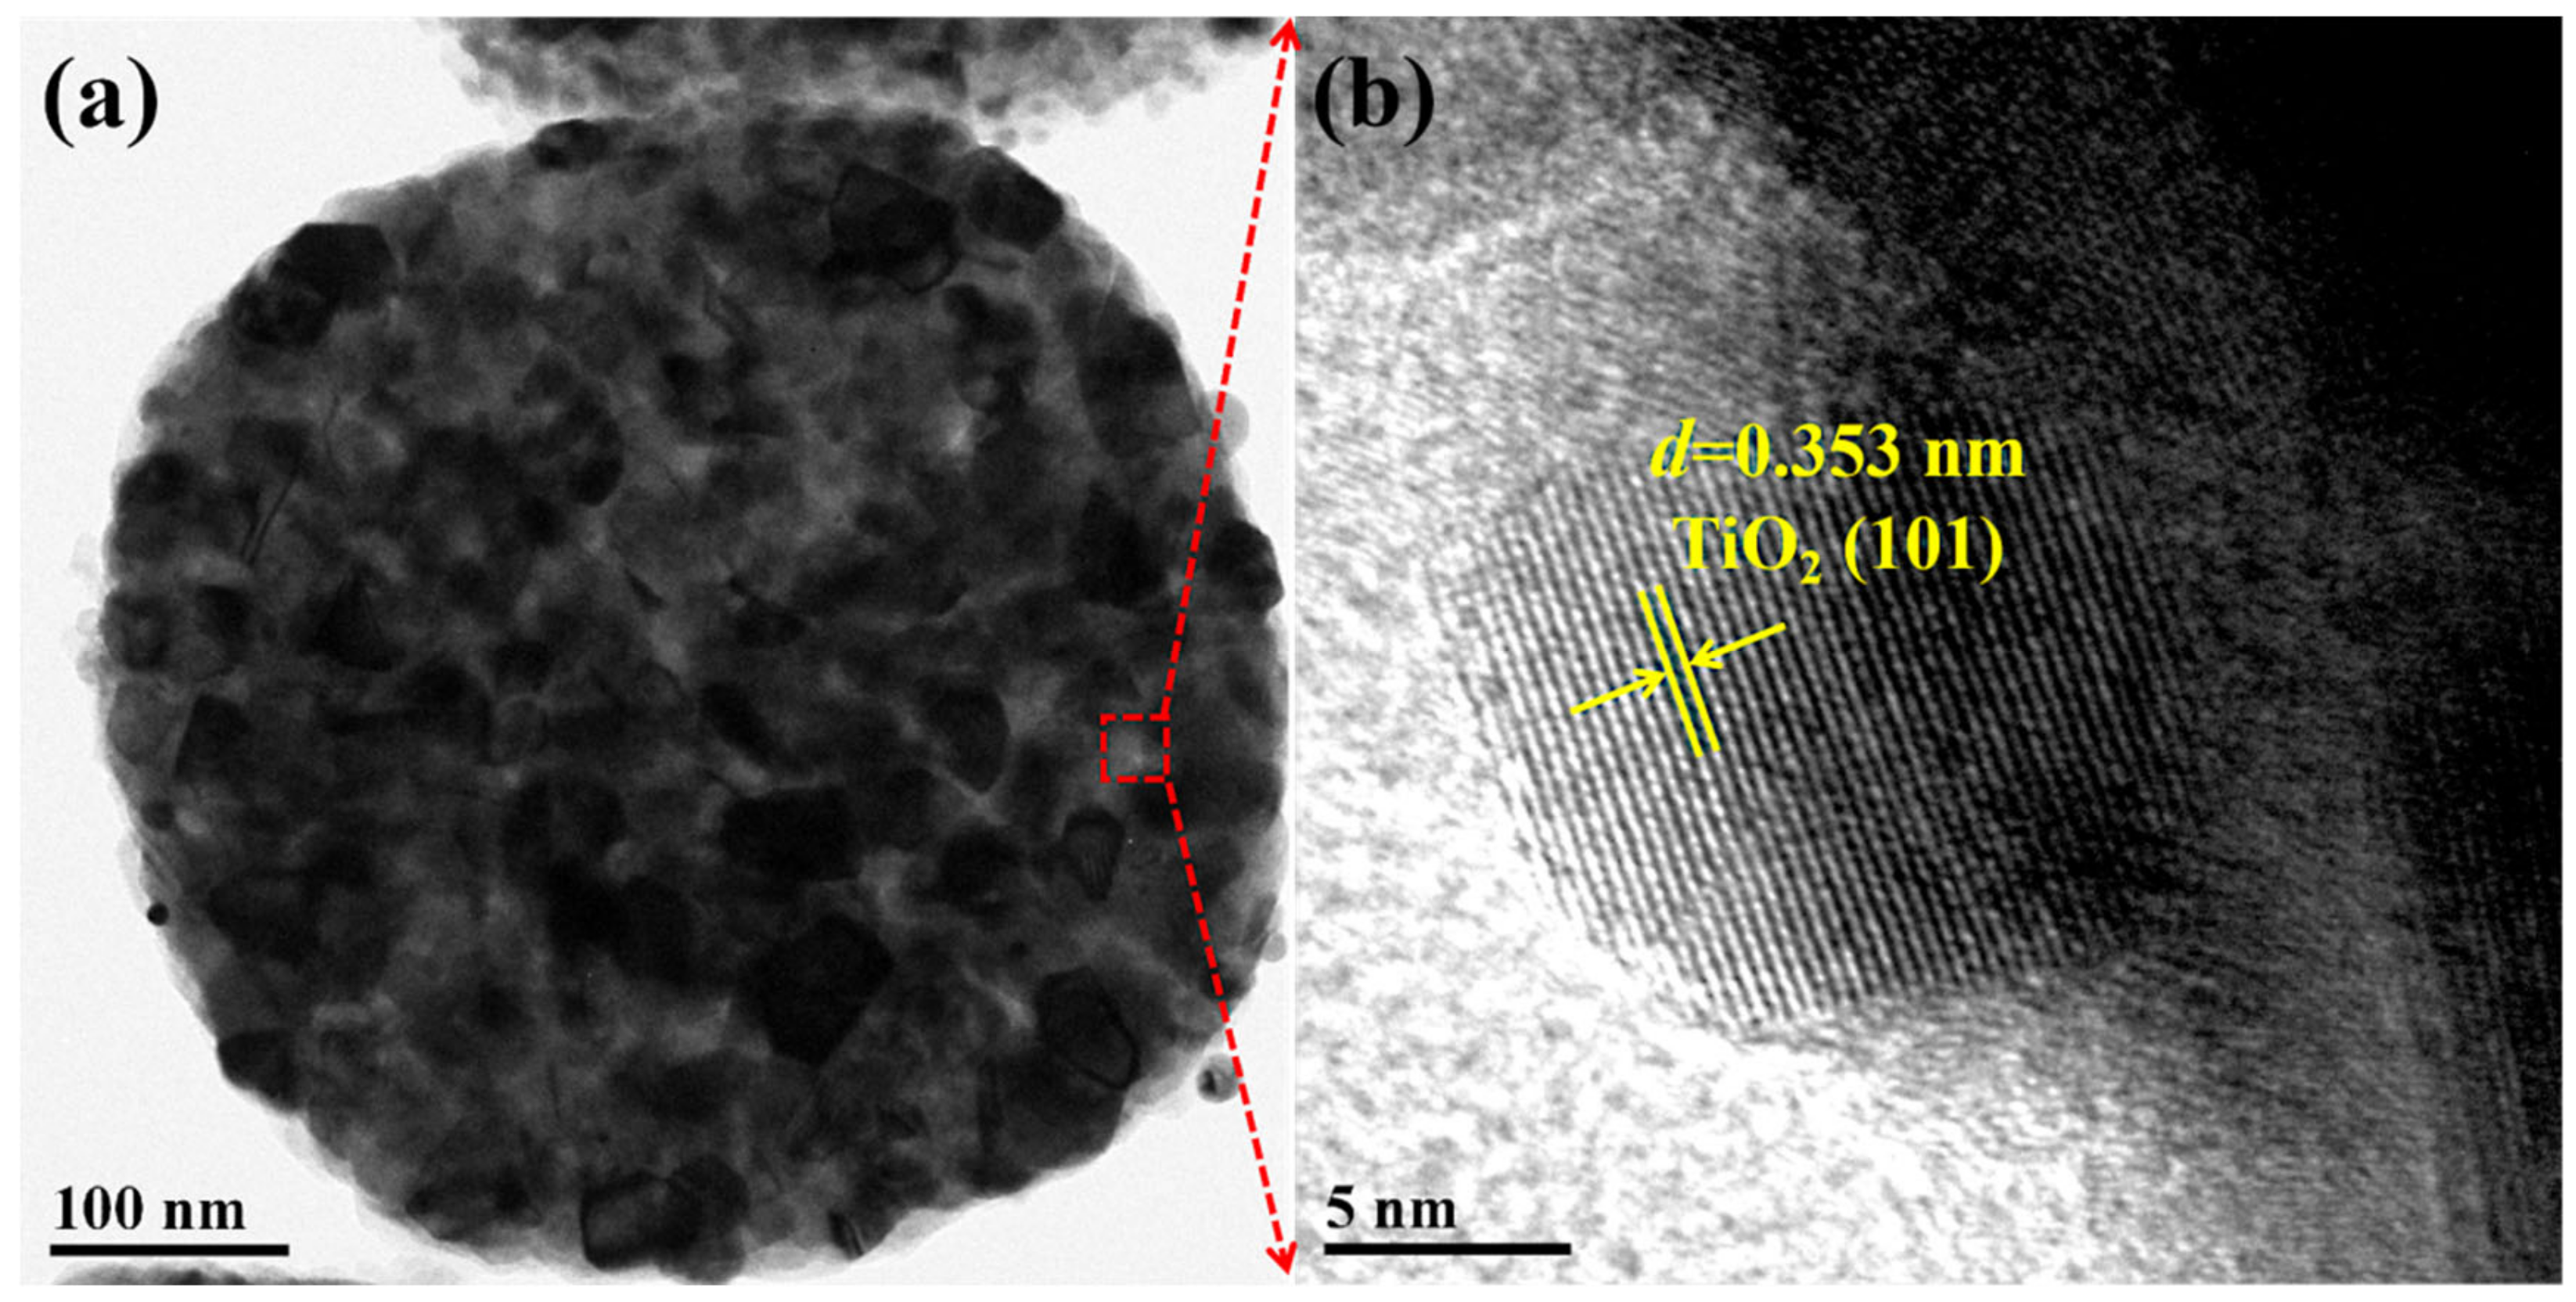
HRTEM images showed that the interplanar spacing was 0.353 nm, corresponding to the (101) interplanar distance of TiO2 nanoparticles [20]. It is clear from Figure 4 that the dark part is Pt and the light part is TiO2 because the platinum atoms are heavier than Ti and O atoms. At the same time, it can be observed that there is no obvious interface between the nano Pt particles and TiO2, which demonstrates that the catalysts prepared by calcination have tighter binding between different elements.
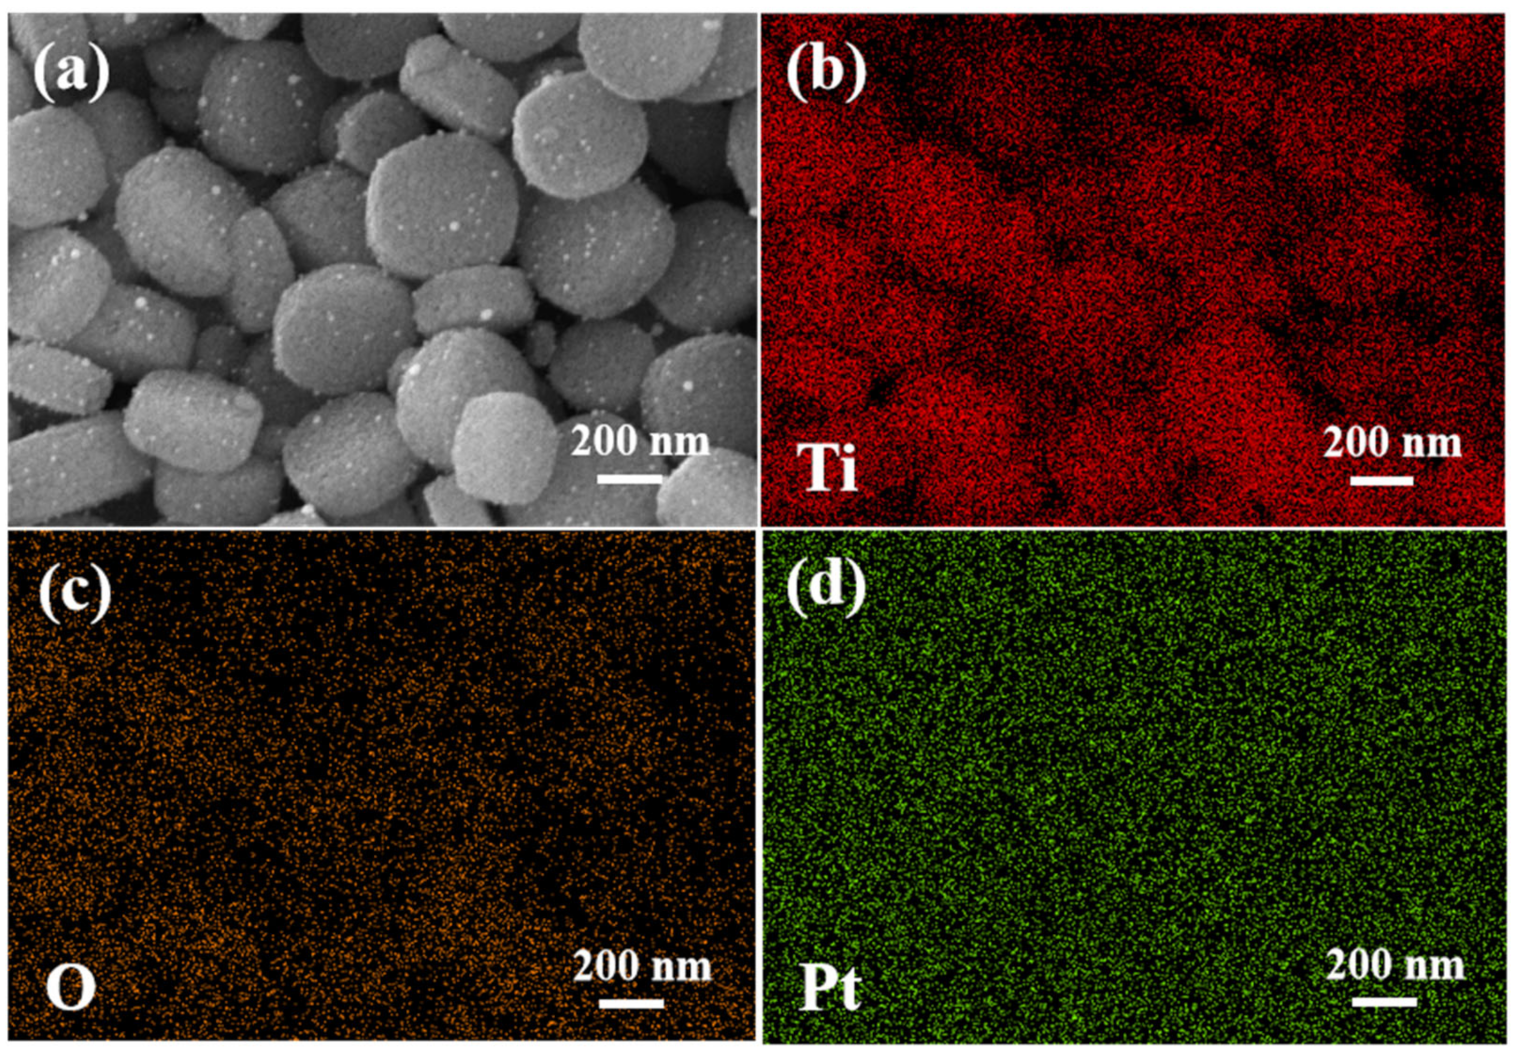
Figure 5 is the mapping summary diagram and elemental profiles of O, Ti and Pt of the M-Pt-TiO2 catalyst, in which the elements are distributed uniformly. Figure 5 shows that Ti, O and Pt elements are randomly distributed and the Ti element distribution is not uniform and shows a stacking phenomenon, which is because the nano-TiO2 primary particles are small and have a high specific surface energy and tend to form larger, metastable particles at high temperature; thus, some agglomeration appears. The newly formed sheets of TiO2 separates O2 from the unreacted species, thus preventing further oxidation by Ti3C2, so that the TiO2 crystals are mostly distributed in the Ti3C2 two-dimensional sheet structure, causing the Ti elements in the TiO2 elements to pile up between the layers.

3.1.3. FTIR Infrared Spectroscopy

Fourier infrared spectroscopy was used to detect the functional groups contained in the samples. In Figure 6, the absorption peaks at 1439 and 1536 cm−1 seen in the FT-IR curve (a) of MIL-125 correspond to the symmetric stretching vibration of carboxylate groups and the vibration bands in the range of 400–800 cm−1 are attributed to the stretching vibration of Ti-O and Ti-O-Ti clusters. The absorption peaks at 1400–1600 cm−1 completely disappeared from the FT-IR curves of M-TiO2 and M-Pt-TiO2 in Figure 6b,c. This indicates that carboxylate groups were completely decomposed in MIL-125 due to high-temperature calcination. The MIL-125 framework collapse at high temperature also brings about the strengthening of the Ti-O stretching vibration at 500 cm−1 and the decrease of M-Pt-TiO2 relative to the M-TiO2 curve strength originates from the effect of the Pt loading on the Ti-O bonding energy.

3.1.4. BET Analysis

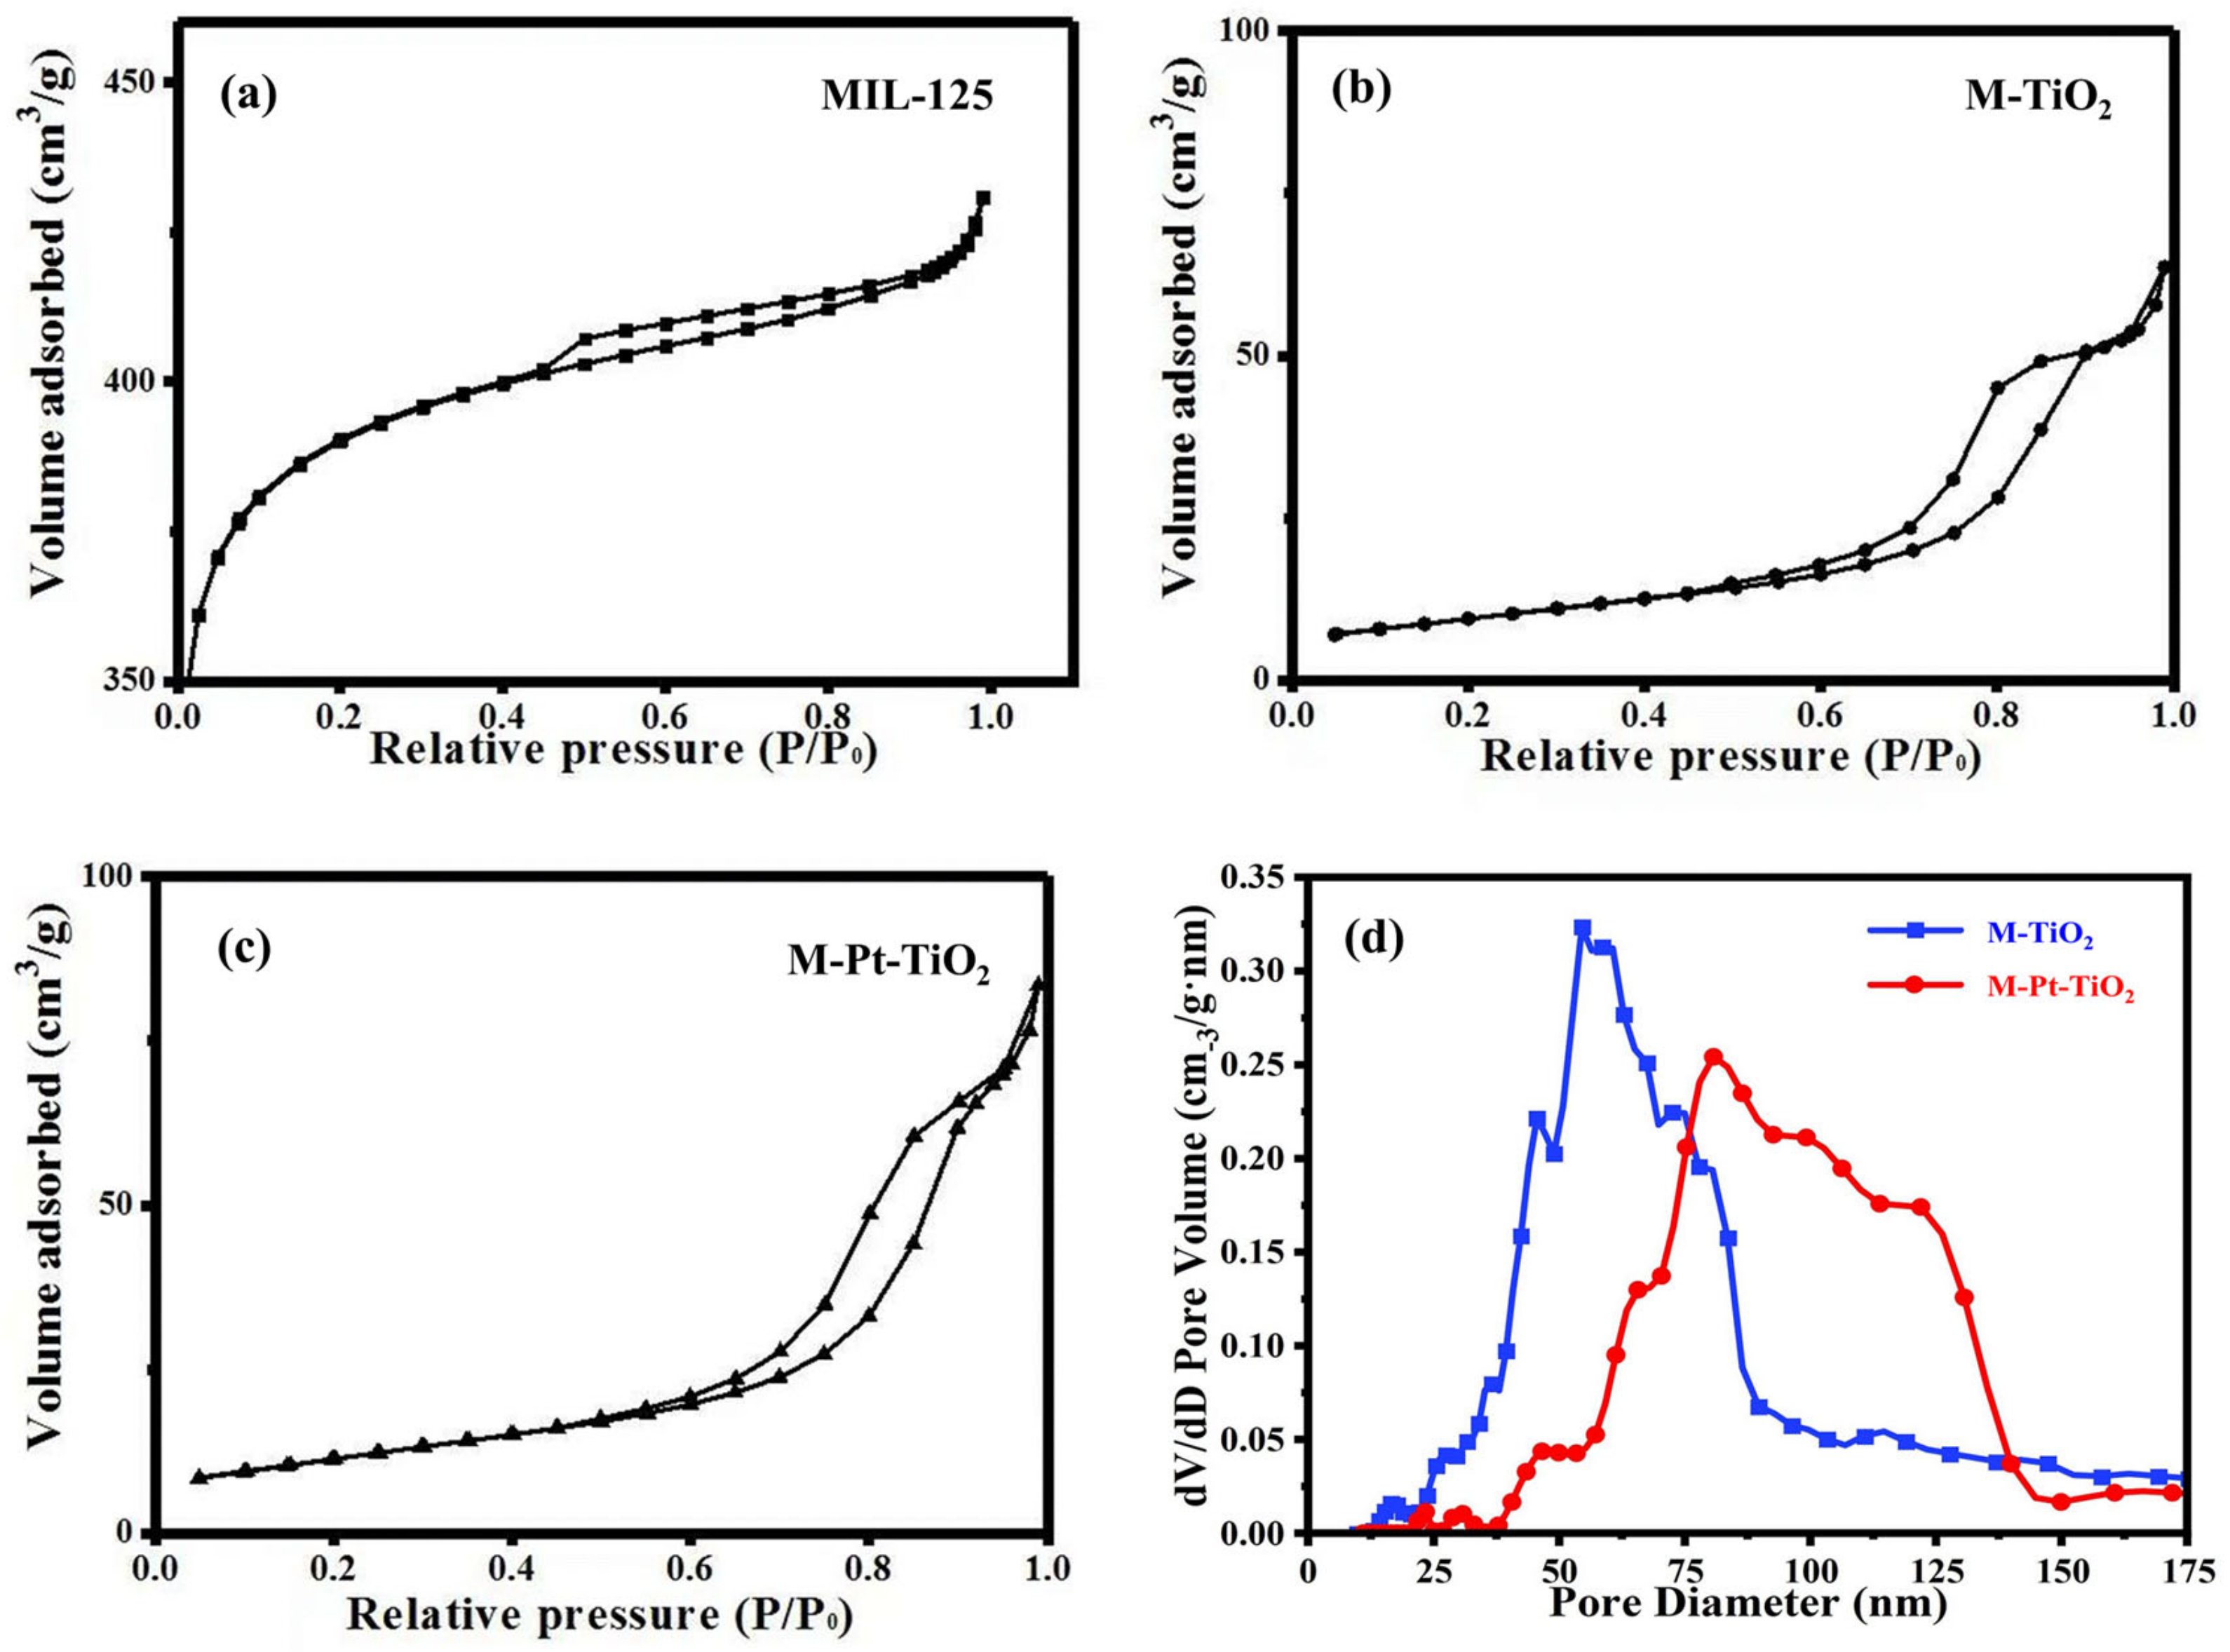
From Figure 7, both M-TiO2 and M-Pt-TiO2 exhibited type IV isotherms according to the Brunauer-Deming-Deming-Teller classification and the pore size was mainly mesoporous and macro-porous [21,22], as known from the shape of the hysteresis loop, with discrete hysteresis loops (H3 type) in the range of higher relative pressure (P/P0, 0.47–1.0), implying the existence of slit-like pores and capillary condensation in the mesopores and large hysteresis between adsorption and desorption branches, confirming the presence of mesoporous pores. Combined with SEM, it is known that this is related to the stacking of the 3D cake-shaped structure of MIL-125 and the collapse of calcination at high temperature to form pore channels. The specific surface area and average pore size of MIL-125, M-TiO2 and M-Pt-TiO2 are shown in Table 4. MIL-125 possesses a larger specific surface area, but the specific surface areas of both M-TiO2 and M-Pt-TiO2 which are 34.288 and 41.199 m2/g, respectively, decrease greatly due to the high-temperature collapse effect. Brunauer-Emmet-Teller (BET) and Barrett-Joyner-Halenda (BJH) were used to analyze the specific surface area and pore size distribution of M-TiO2 and M-Pt-TiO2, result shown in Figure 7d. It can be seen that the loading of Pt improves the pore size distribution of M-TiO2 and in the range of 75–100 nm, the pore size distribution of M-Pt-TiO2 is much higher than that of M-TiO2, can be attributed to the loading dispersion of Pt, not only does not cause blockage to the TiO2 mesopores but also improves the pore size distribution of the catalyst and increases the specific surface of the catalyst, thus exposing more active sites for photocatalytic reactions, which is beneficial to the further improvement of the photocatalytic activity of the catalyst.

3.1.5. Solid UV–Vis

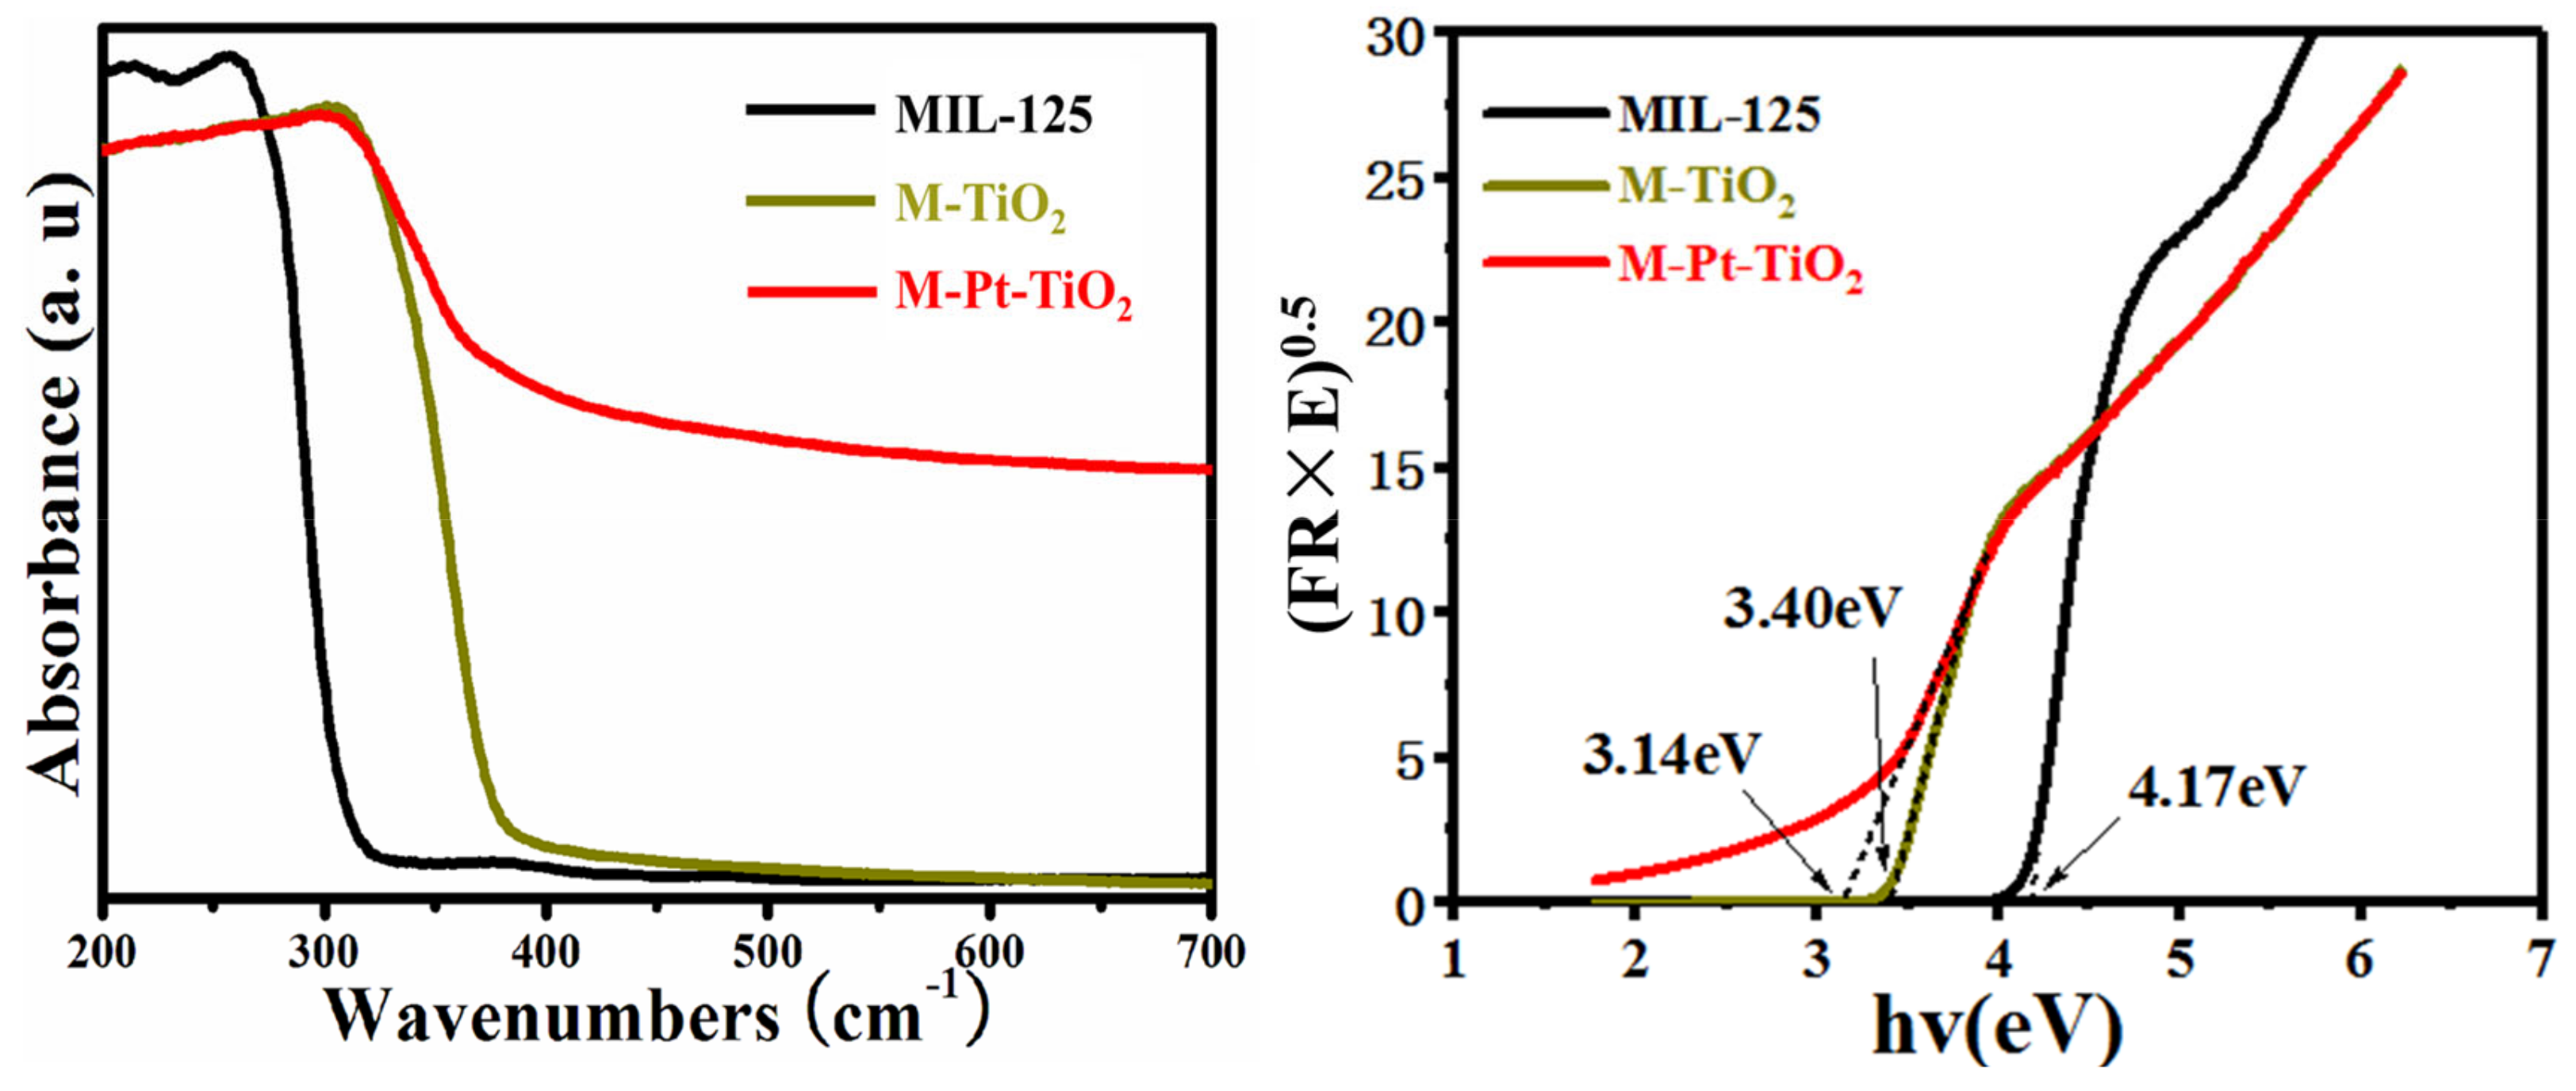
From Figure 8, the UV–Vis curves of the samples modified by TiO2 showed a larger redshift than the original samples due to the formation of Ti3+ and Ov in the range of 0.75–1.18 eV below the CB of TiO2, indicating a significant change in the absorption wavelength. As the energy change caused by the surface effect of Pt is greater than that caused by the spatial effect, the optical band gap of the catalyst particles is reduced, which shows a certain degree of redshift in the M-Pt-TiO2 curve compared to the M-TiO2 curve and a large improvement in the intensity of light absorption in the visible region. In addition, the M-Pt-TiO2 catalyst absorbs visible light more strongly than M-TiO2, which further improves the visible light catalytic performance.
The forbidden band width (Eg) of a semiconductor is negatively correlated with the absorbance and the performance of a semiconductor photocatalyst depends, in many cases, on the width of the forbidden band; the narrower the forbidden band width, the greater the redshift in the absorbance spectrum. Therefore, the forbidden band width (Eg) of a catalyst can be calculated by extrapolating the UV–vis absorption spectrum to the Kubelka-Munk function. The calculated Eg of M-Pt-TiO2 is 3.14 eV, which is narrower than the forbidden band width of M-TiO2 and thus also makes the electron leap easier.

3.1.6. XPS Analysis

The XPS spectrum of M-Pt-TiO2 with C 1s, O 1s, Ti 2p and Pt 4f for its chemical composition, and elemental chemical states is shown in Figure 9. The double peak 2p of Ti is located at 458.4 and 464.15 eV and assigned to the Ti (IV) oxidation state in the Ti-O cluster, typical of the MIL-125 structure. The O 1s diagram at 529.8, 529.5 and 530.9 eV corresponds to the Ti-O clusters, C=O clusters and hydroxyl groups in the MIL-125 backbone and TiO2, respectively. The characteristic double peaks of Pt 4f are located at 70.5 and 73.8 eV, indicating the presence of Pt0 in the catalyst. The peaks at 284.7 eV and 288. 2 eV in the C 1s spectrum correspond to the O–C=O bond. All the above results confirm the successful synthesis of M-Pt-TiO2 materials.

3.2. Analysis of the Photocatalytic Degradation Effect of M-Pt-TiO2

3.2.1. Experimental Results and Analysis of M-Pt-TiO2 Photocatalytic Degradation of Rhodamine B

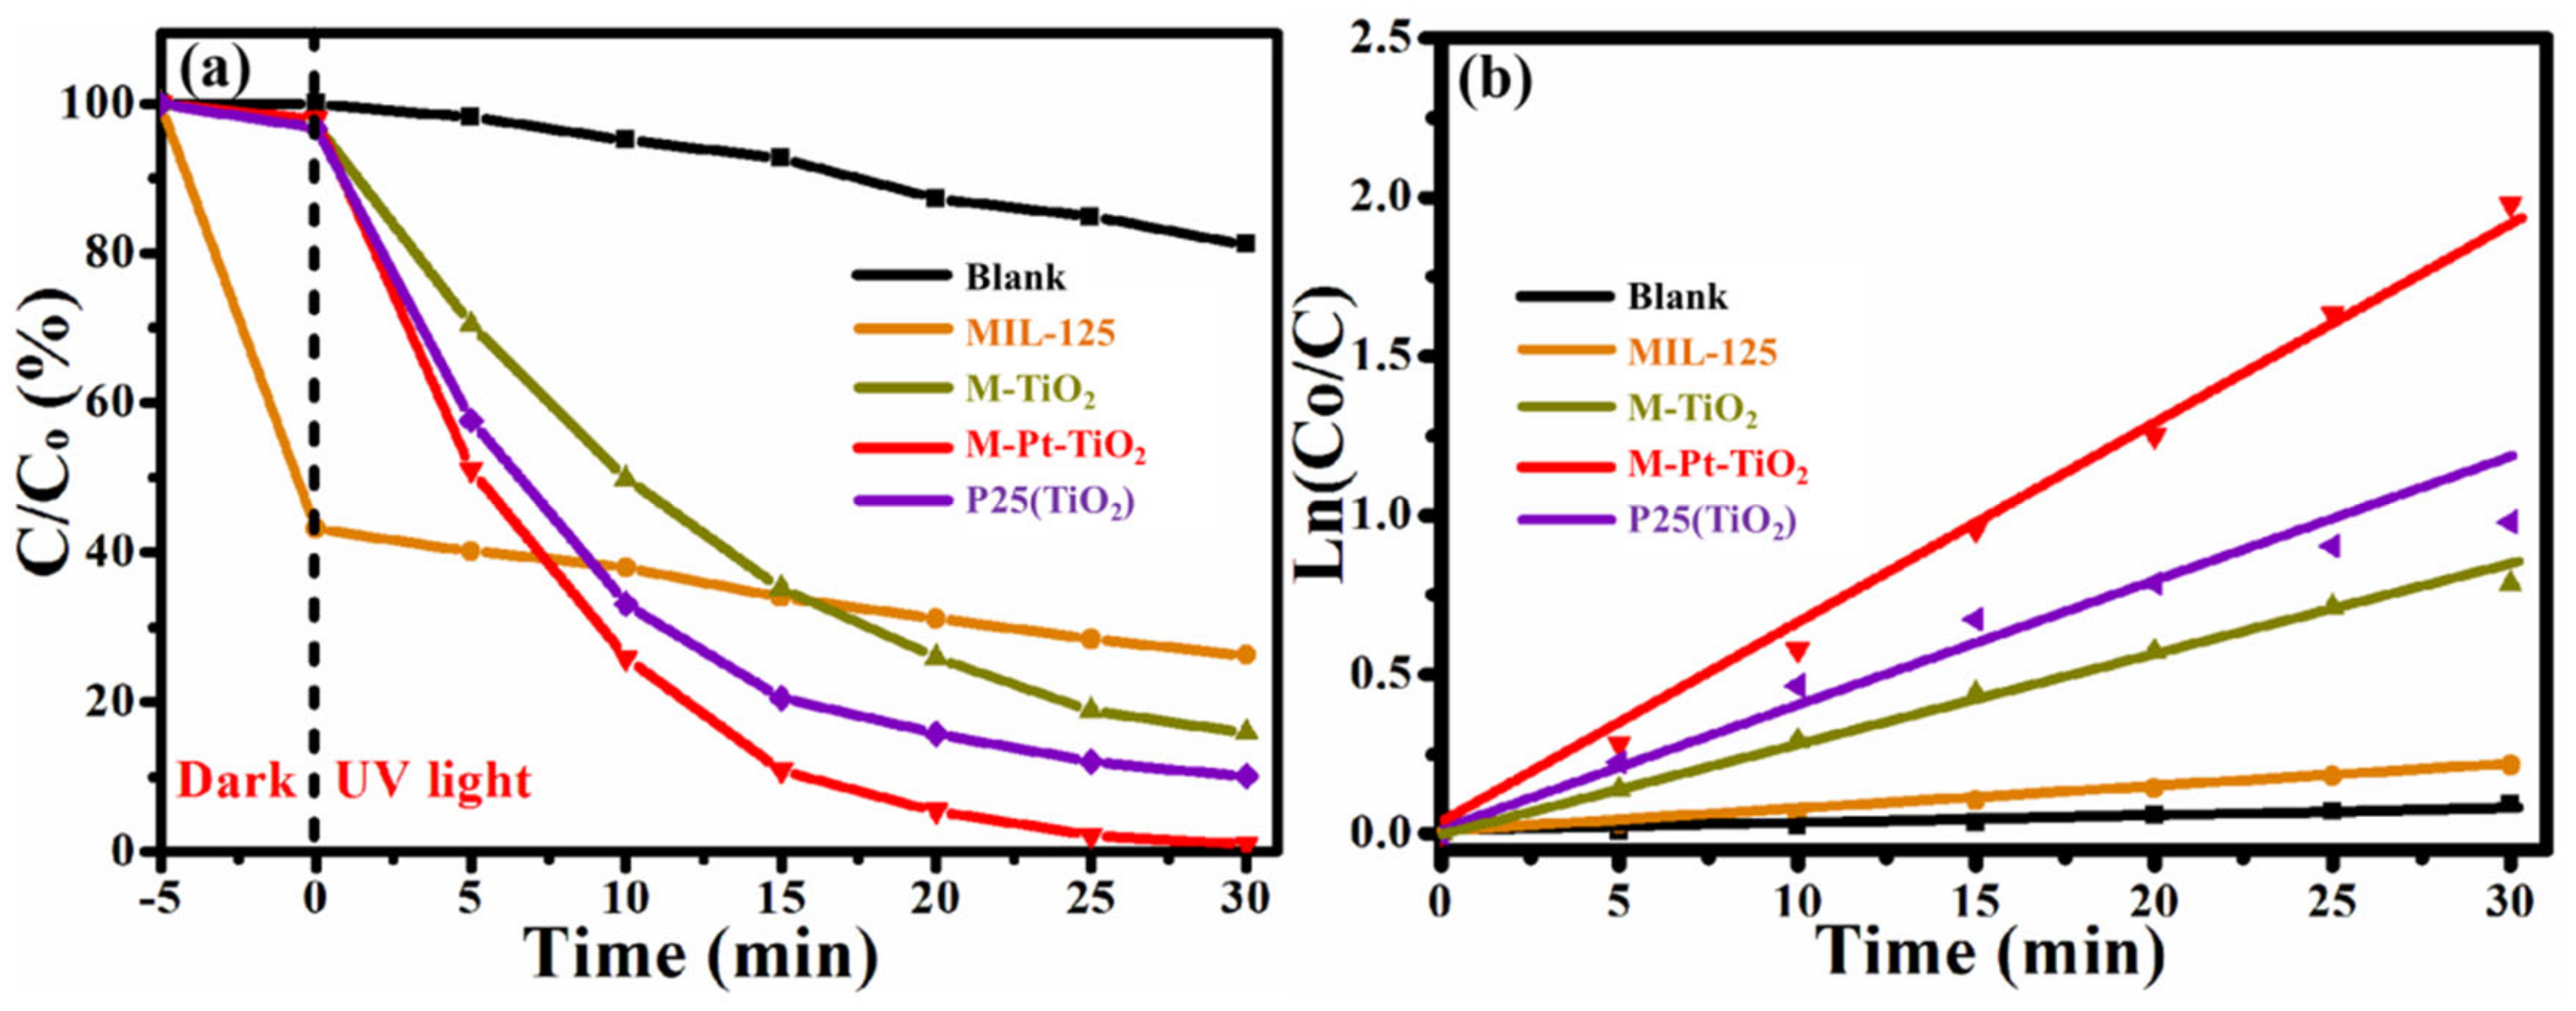
The photocatalytic effect of M-Pt-TiO2 was evaluated by the degradation of Rhodamine B (RhB) under the light condition of a 40 W UV lamp and the results of the degradation efficiency of the catalyst are shown in Figure 10. The self-degradation rate of RhB without the addition of photocatalyst was 18.86%; the photocatalytic efficiencies of M-TiO2 and TiO2 (P25) was 84.05% and 89.85%, respectively, under the addition of photocatalyst, while the photocatalytic degradation rate of RhB was 98.97% after adding the M-Pt-TiO2 catalyst for 30 min. The RhB degradation rate was 73.87%, but excluding the effect of dark adsorption on the experiment, the actual photocatalytic degradation rate was essentially comparable to the self-degradation rate of RhB. The introduction of Pt enhanced the photocatalytic activity compared to commercially available P25 and M-TiO2. To investigate the photodegradation behaviour of the catalyst, a kinetic analysis of the catalytic reaction was also carried out. The kinetic curve can be calculated from the pseudo-first-rate kinetic equation ln(C0/C) = kt. The linear relationship between ln(C0/C) and (t) shows that the photocatalytic degradation reaction follows a pseudo-first-rate reaction, with the M-Pt-TiO2 photocatalyst having the largest reaction rate constant of 0.0645 min−1. In addition to the reactive radicals generated by the reaction of water with photogenerated electrons under UV irradiation, the generation of carriers as positive holes and negative electrons is also a major part of the photocatalytic process. These generated radicals decompose dye pollutants together with nitrate ions into carbon dioxide, water and inorganic nitrogen. The lower work function of Pt nanoparticles compared to TiO2 leads to the spontaneous transfer of electrons from the TiO2 conduction band to the metal Pt nanoparticles, while the Schottky barrier formed by Pt0 on the surface of the M-Pt-TiO2 catalyst reduces the complexation of photogenerated electrons with holes [23], i.e., the presence of electron traps inhibits the recombination of photogenerated electron-hole pairs, thus greatly enhancing the photocatalytic reaction efficiency.
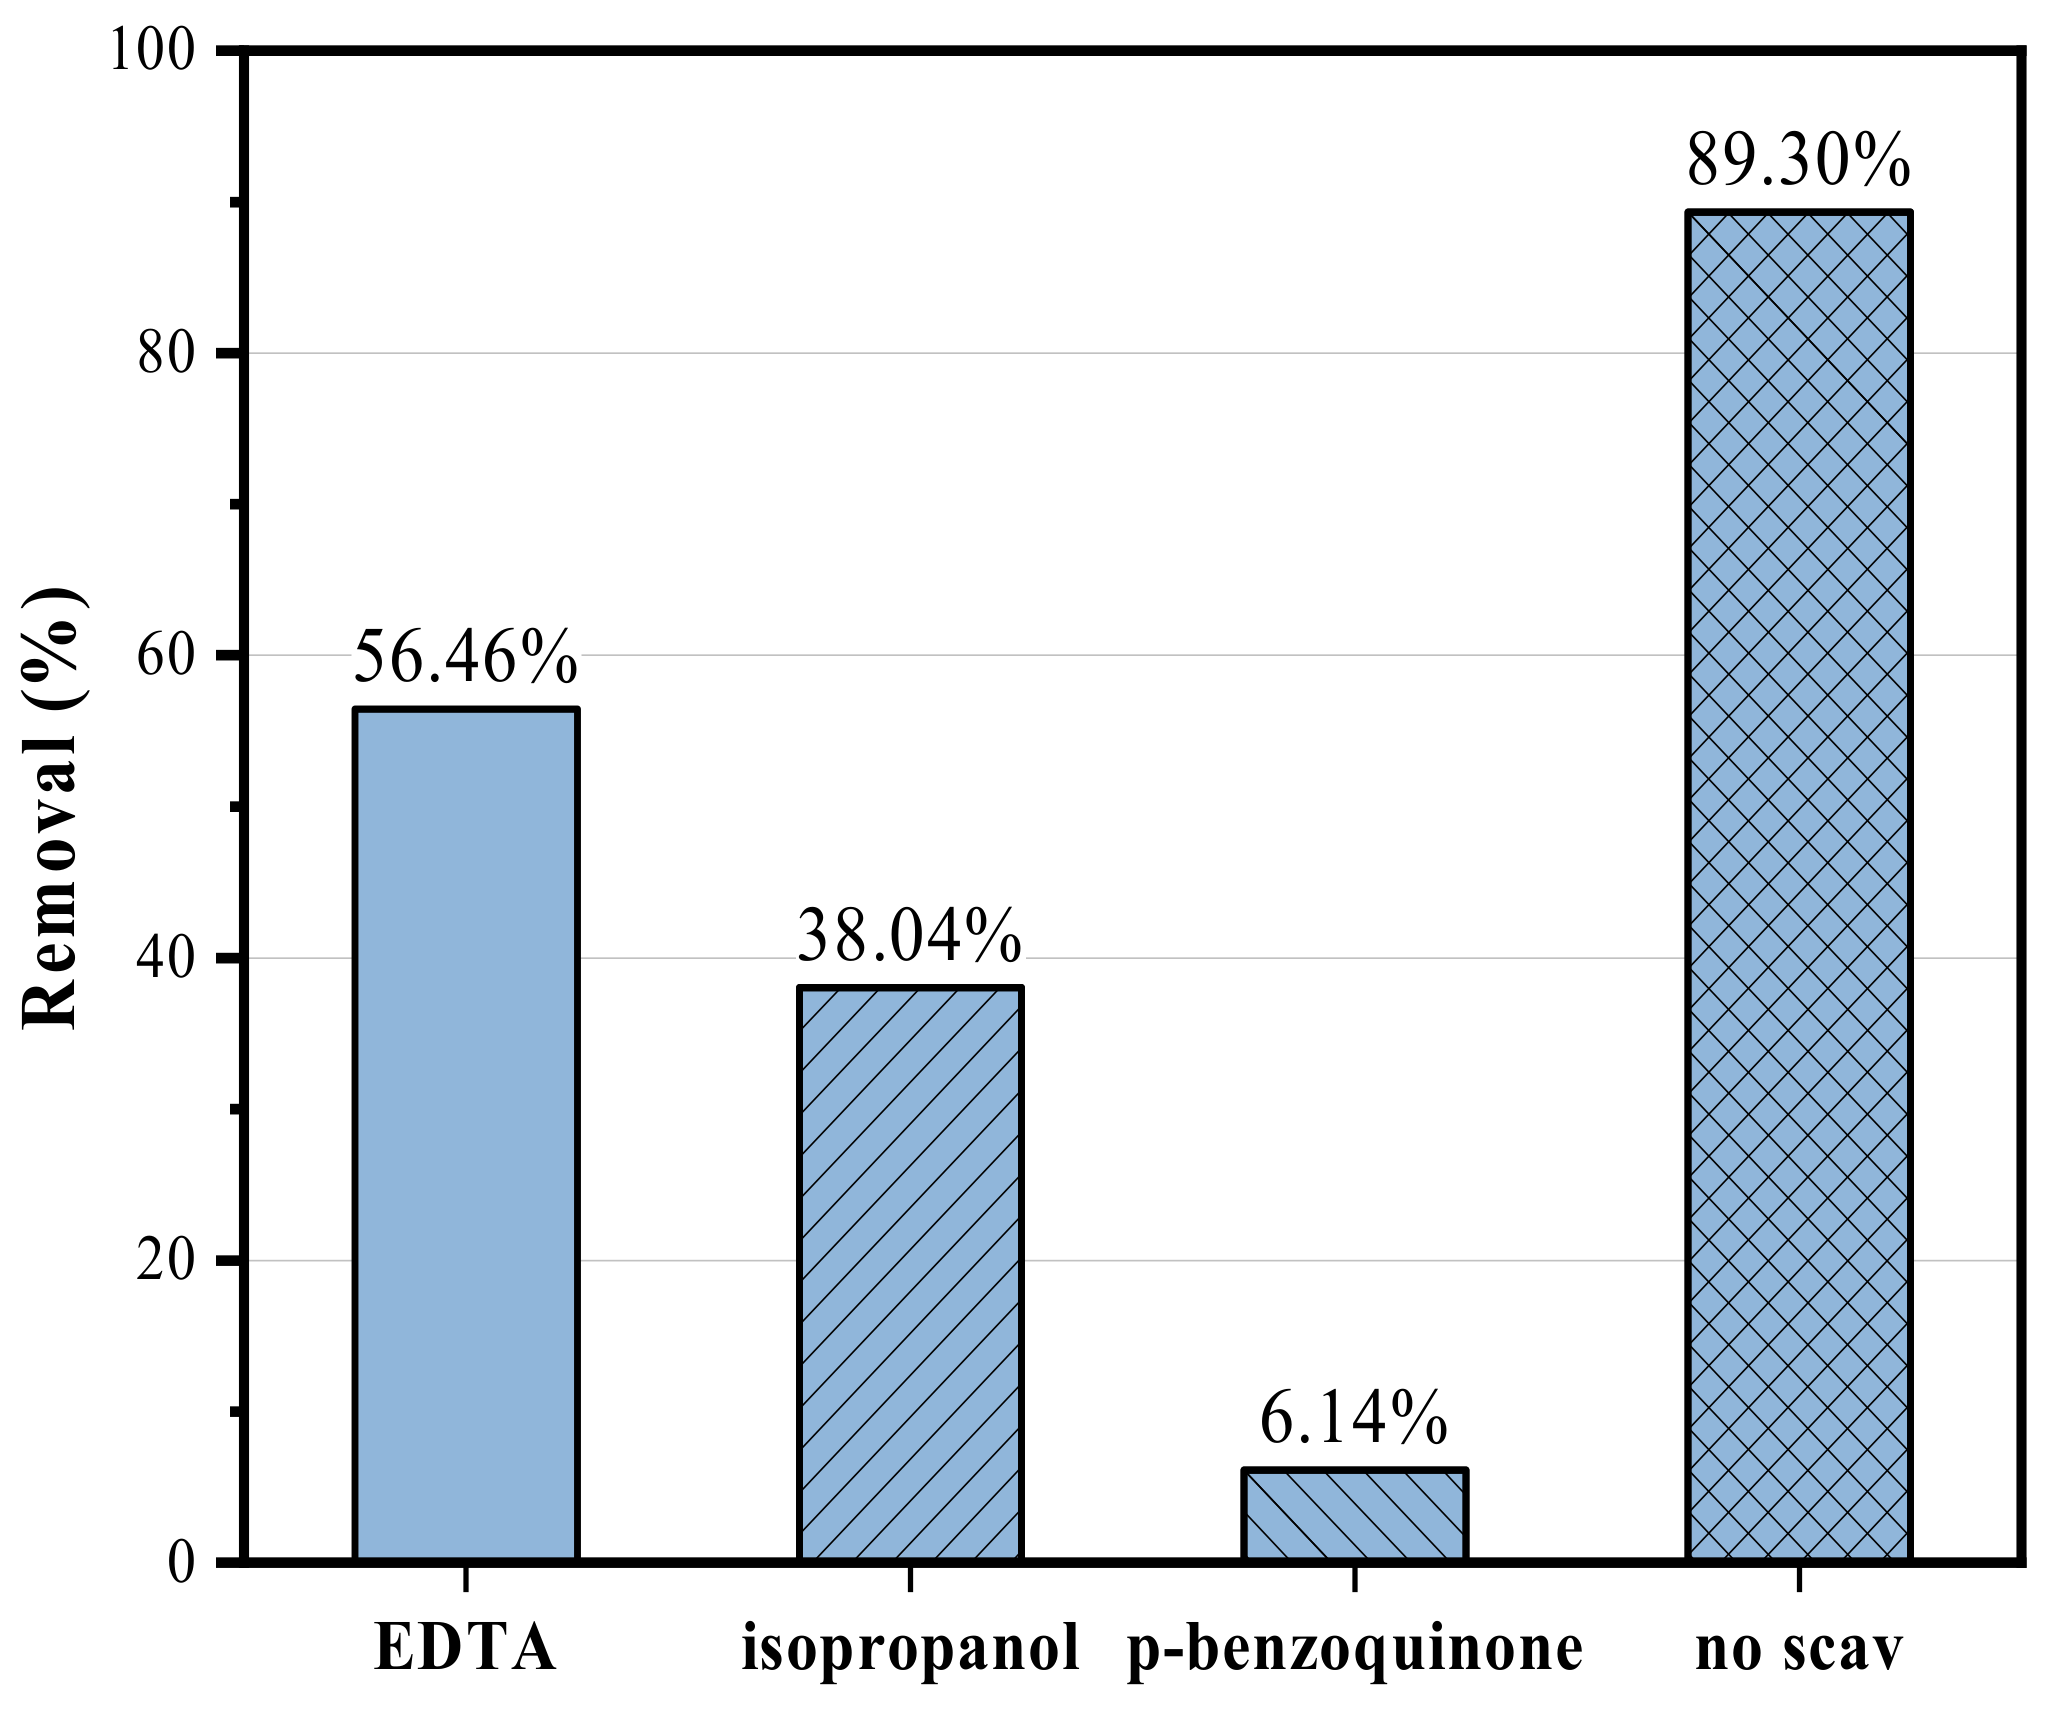
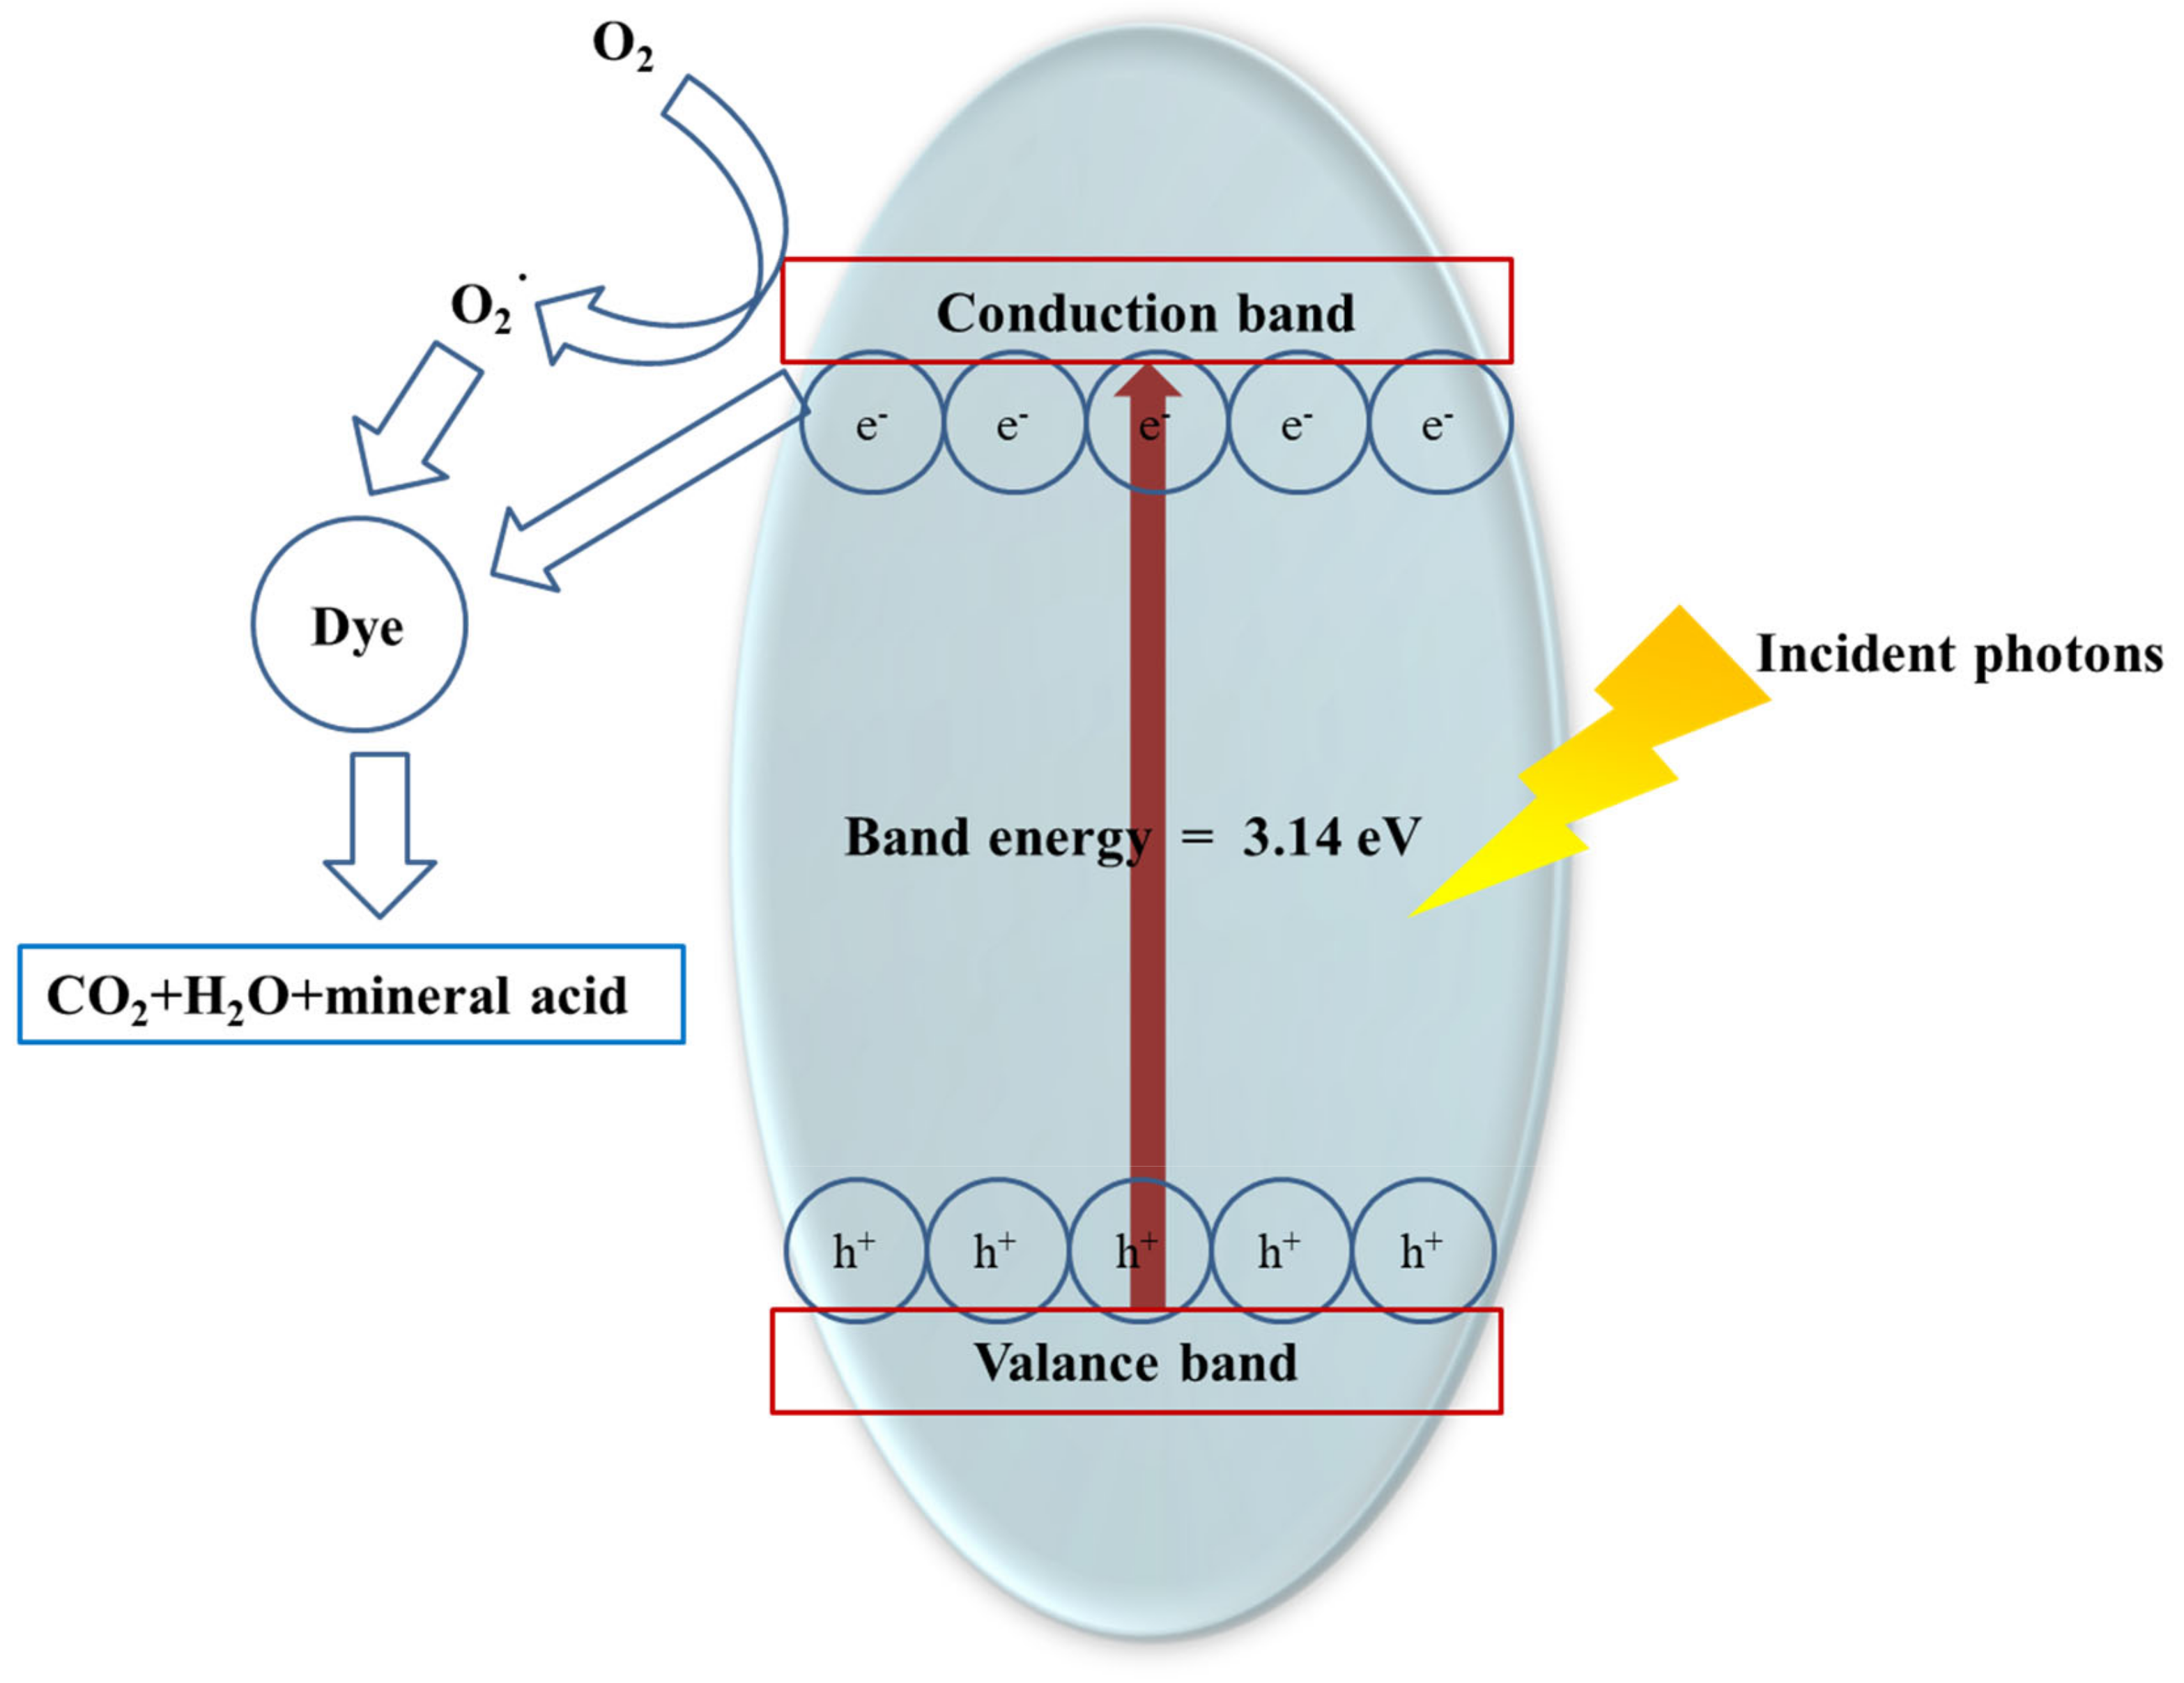
Free radical capture experiments (Figure 11) were used to quantify the role in free radical oxidation reactions using EDTA, isopropanol and p-benzoquinone for the capture of vacancies, hydroxyl radicals and superoxide radicals, respectively. The radical capture experiments showed that the photodegradation removal rate decreased from 89.3% to 56.46, 38.04 and 6.14% after the addition of EDTA, isopropanol and p-benzoquinone scavengers, respectively, in the M-Pt-TiO2 system, reflecting the greater degradation of RhB dyes by superoxide radicals. With this in mind, the degradation mechanism of M-Pt-TiO2 on RhB is shown in Figure 12. The hole transfer from the titanium dioxide valence band to the Fermi energy level of Pt is accompanied by a reduction in the electron-hole complex and more conduction band electrons and superoxide radicals provide opportunities for the degradation of RhB.

3.2.2. Experimental Analysis of the Recyclability of M-Pt-TiO2 Photocatalytic Degradation of Rhodamine B

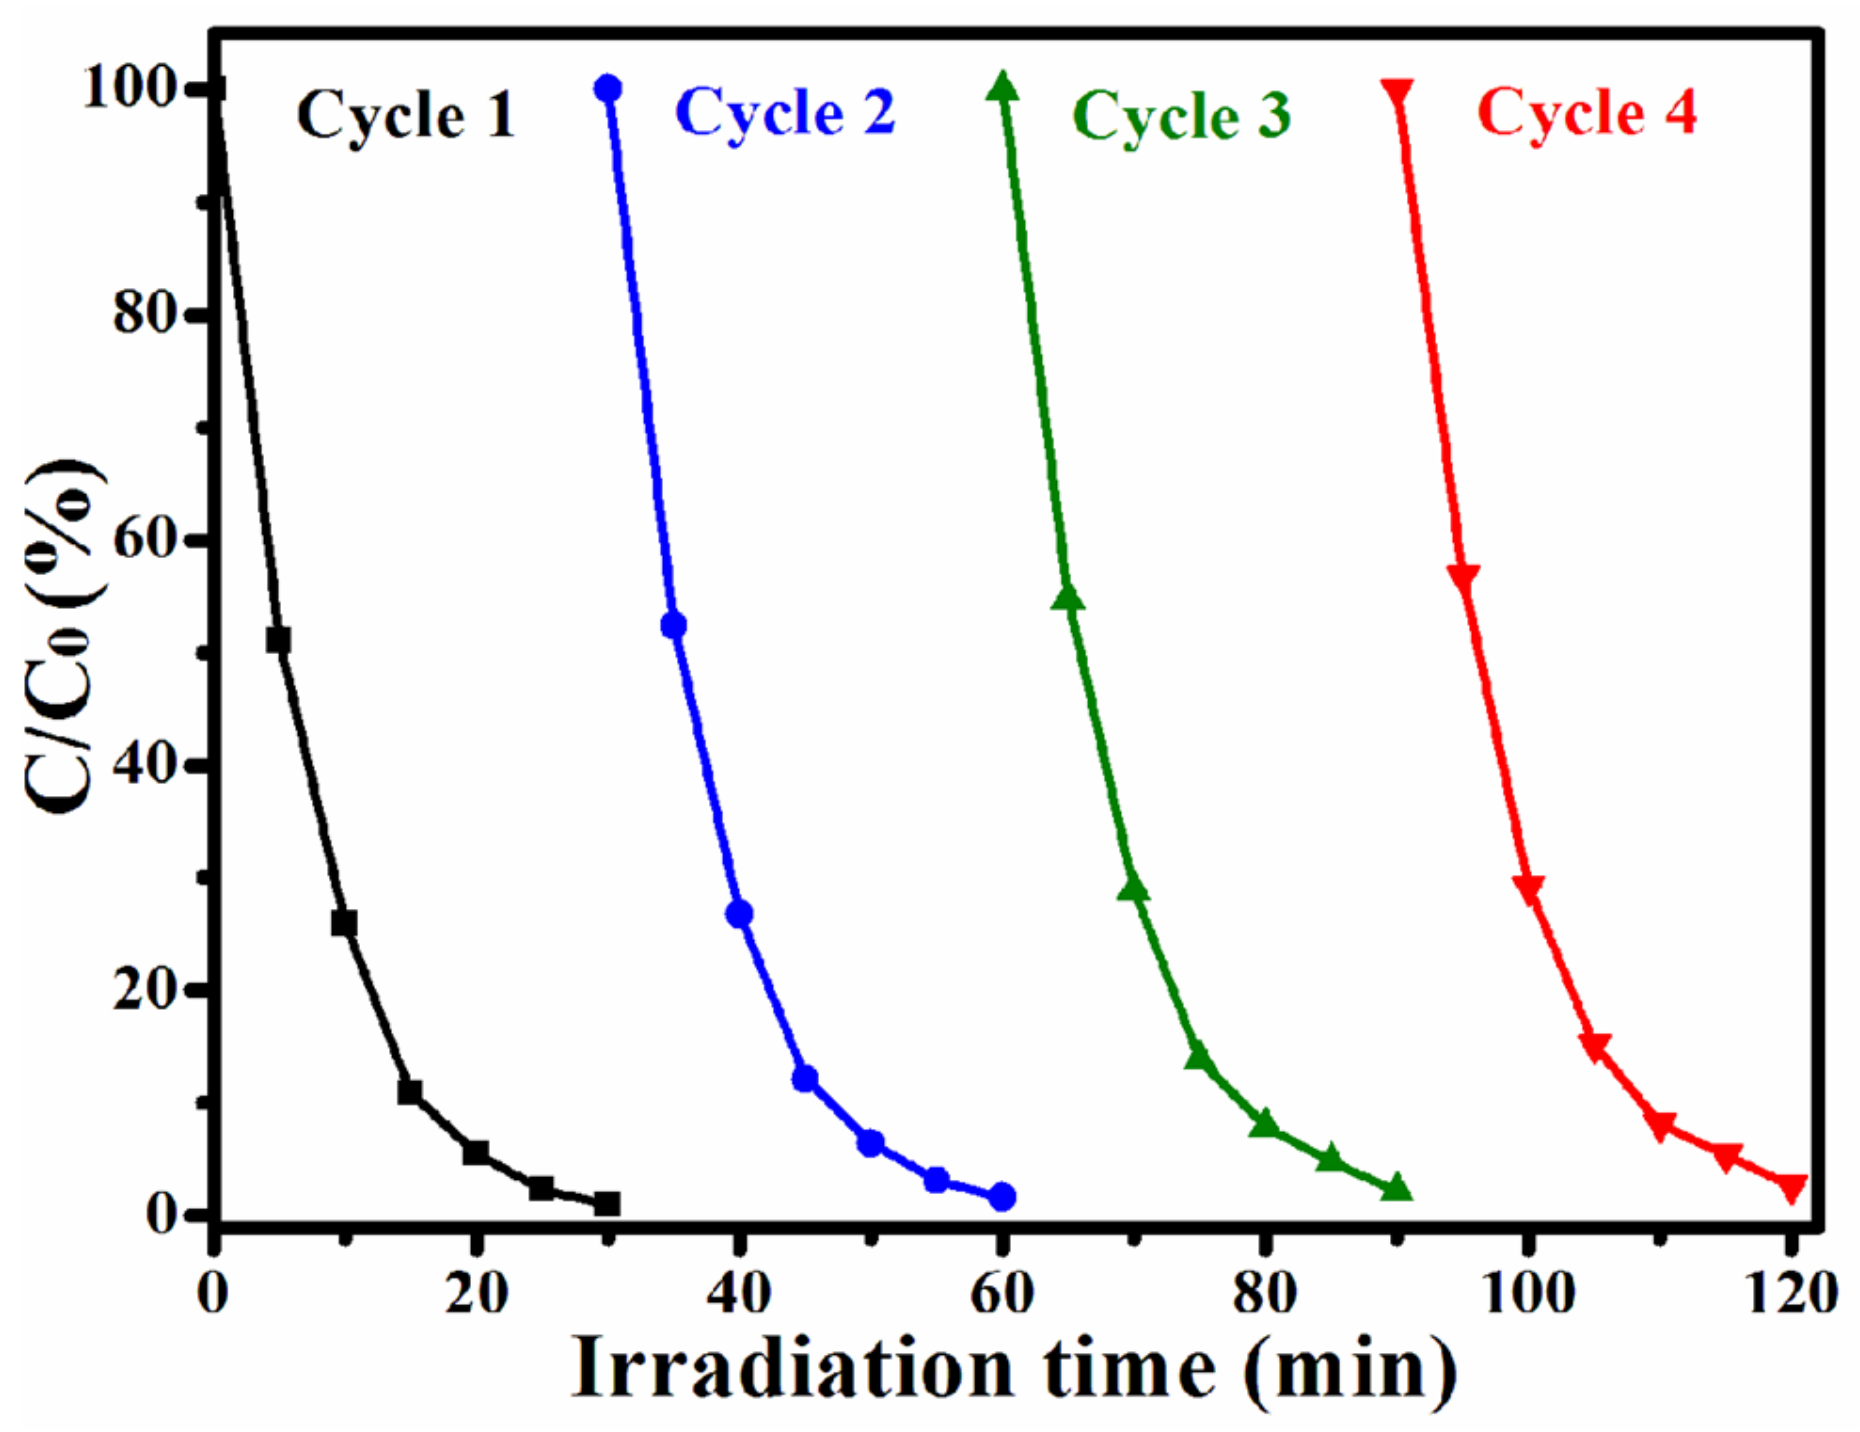
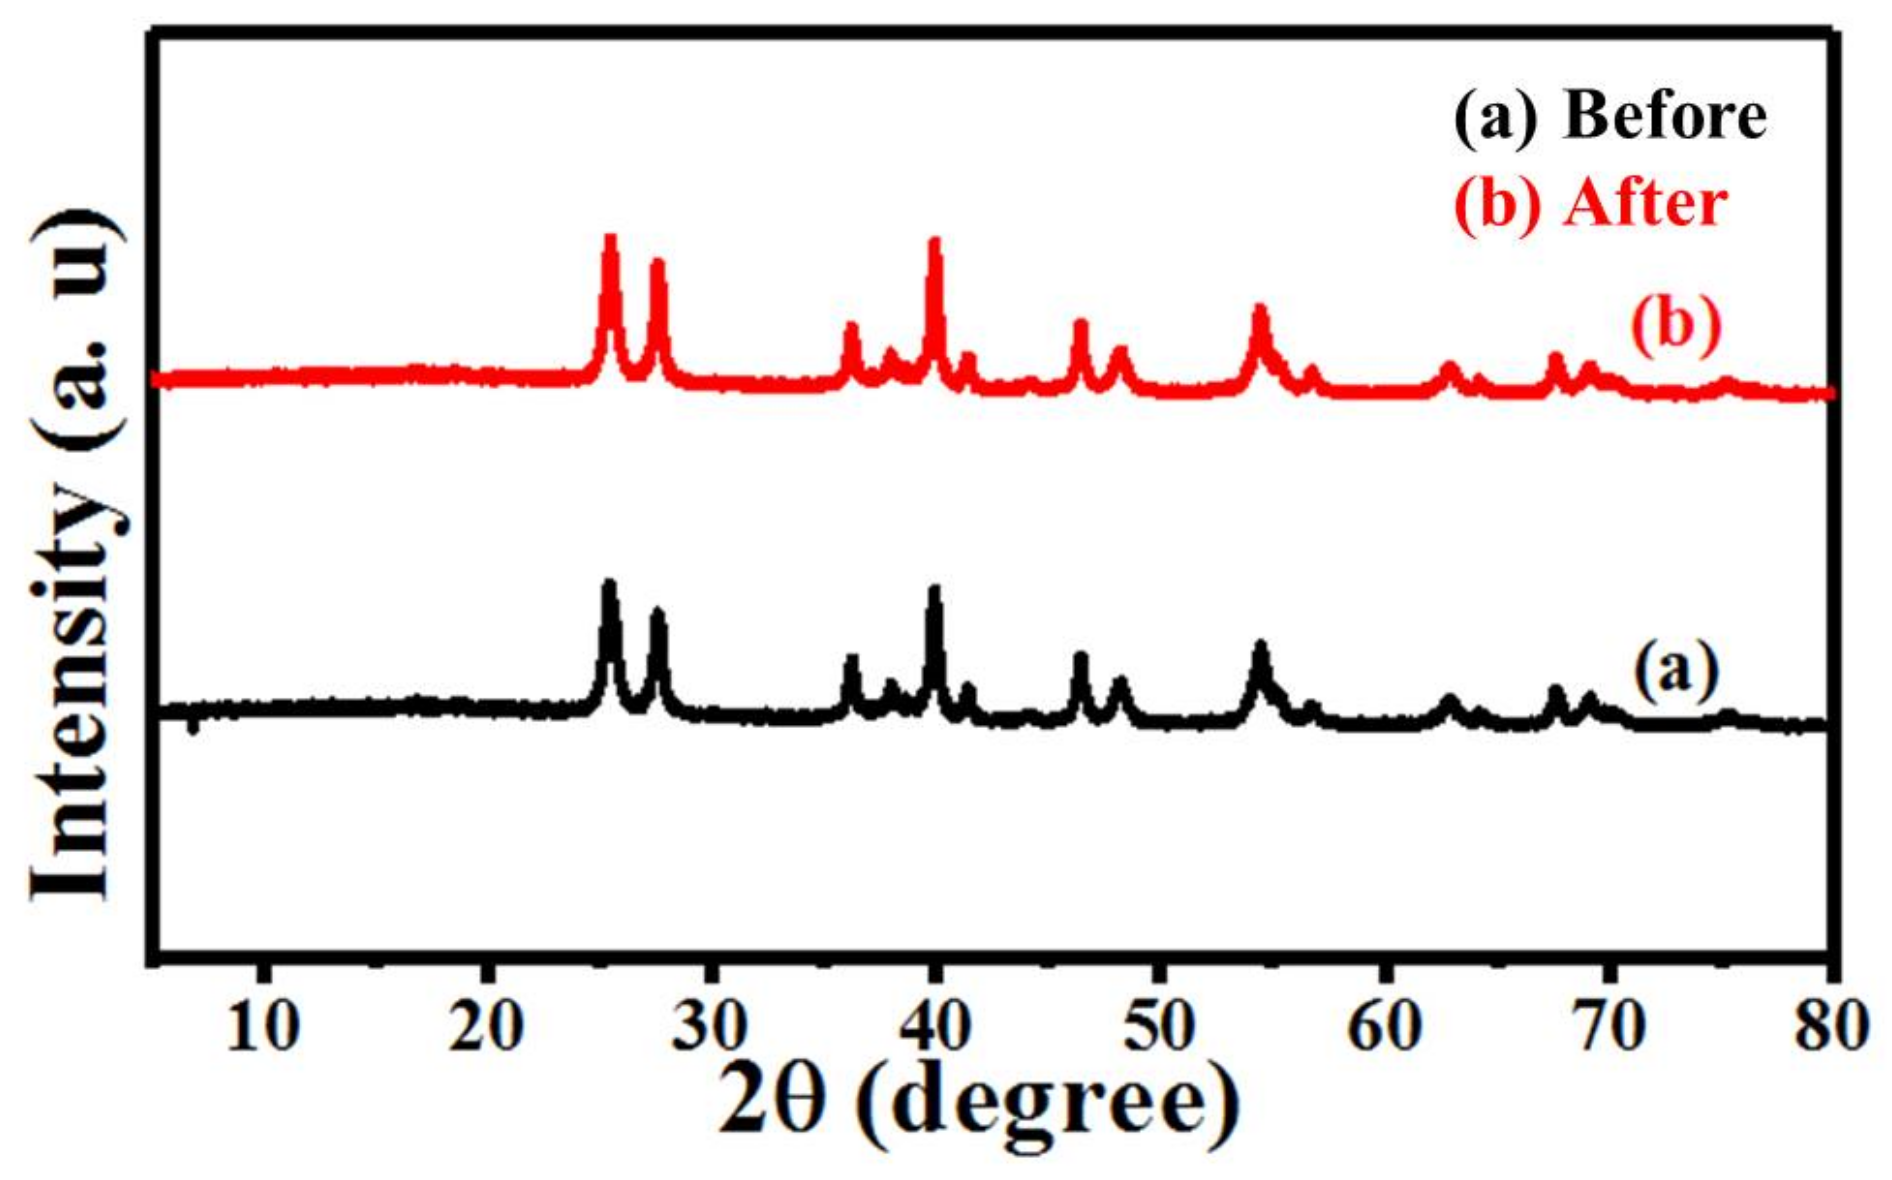
As a green technology, waste disposal is usually not considered in the photocatalytic degradation reaction cycle, so it is necessary to investigate the recyclability of the M-Pt-TiO2 photocatalyst. Four-cycle degradation test of M-Pt-TiO2 are shown in Figure 13. After four cycles, the photocatalytic activity of the M-Pt-TiO2 catalyst for RhB decreased from 98.4% to 94.9%, indicating that the photocatalyst sample has good stability of photocatalytic activity under UV irradiation. In addition, no significant changes were observed in the XRD pattern (Figure 14) after four cycles. The prepared M-Pt-TiO2 nanocrystals maintained a robust structure during the long cycling process, which was related to the reasonable layered porous structure of the nanocrystals and the strong van der Waals force interactions between neighboring nanocrystals. The slight decrease in photocatalytic activity during recycling may be due to the accumulation of organic intermediates on the catalyst surface that affect dye adsorption. In summary, M-Pt-TiO2 can be considered a promising photocatalyst for practical applications.

4. Conclusions

In this work, Pt-doped TiO2 was prepared by thermal synthesis using MIL-125 as the template. XRD and SEM characterization results showed that Pt nanoparticles were uniformly loaded onto the pancake-shaped TiO2. XPS characterization demonstrated the presence of Pt0 and BET results showed that the loading of Pt improved the pore size distribution and increased the specific surface of the catalyst. After 30 min of degradation, the photocatalytic degradation of RhB by M-Pt-TiO2 was 98.97% and the Schottky barrier formed by Pt nanoparticles on the surface of the M-Pt-TiO2 catalyst inhibited the recombination of photogenerated electron-hole pairs, thus greatly enhancing the photocatalytic reaction efficiency. Radical trapping experiments showed that superoxide radicals and conduction band electrons played a major role in the degradation process. After four cycles, the photocatalytic activity of the M-Pt-TiO2 catalyst for RhB decreased from 98.4% to 94.9%, indicating that the photocatalytic sample had good photocatalytic stability under UV light irradiation, which was related to the reasonable layered porous structure of the nanocrystals and the strong van der Waals force interactions between adjacent nanocrystals.

Author Contributions

Conceptualization, C.L. and X.M.; methodology, C.L. and X.M.; formal analysis, X.M.; investigation, X.M.; resources, C.L.; data curation, C.L. and X.M.; writing—original draft preparation, X.M. and H.Y.; writing—review and editing, X.M.; visualization, H.Y.; supervision, H.Y.; project administration, H.Y. All authors have read and agreed to the published version of the manuscript.

Funding

This research received no external funding.

Institutional Review Board Statement

Not applicable.

Informed Consent Statement

Not applicable.

Data Availability Statement

The data that support the findings of this study are available on request from the corresponding author, upon reasonable request.

Conflicts of Interest

The authors declare no conflict of interest.

References

  1. Tian, S.-Y.; Guo, J.-H.; Zhao, C.; Peng, Z.; Gong, C.-H.; Yu, L.-G.; Liu, X.-H.; Zhang, J.-W. Preparation of Cellulose/Graphene Oxide Composite Membranes and Their Application in Removing Organic Contaminants in Wastewater. J. Nanosci. Nanotechnol. 2019, 19, 2147–2153. [Google Scholar] [CrossRef] [PubMed]
  2. Leena, V.B.; Rajubhai, K.M. Visible/solar light active photocatalysts for organic effluent treatment: Fundamentals, mechanisms and parametric review. Renew. Sustain. Energy Rev. 2017, 76, 1393–1421. [Google Scholar]
  3. Zheng, Q.; Durkin, D.P.; Elenewski, J.E.; Sun, Y.; Banek, N.A.; Hua, L.; Chen, H.; Wagner, M.J.; Zhang, W.; Shuai, D. Visible-Light-Responsive Graphitic Carbon Nitride: Rational Design and Photocatalytic Applications for Water Treatment. Environ. Sci. Technol. 2016, 50, 12938–12948. [Google Scholar] [CrossRef]
  4. Kakarla, R.R.; Mahbub, H.; Vincent, G.G. Hybrid nanostructures based on titanium dioxide for enhanced photocatalysis. Appl. Catal. A Gen. 2015, 489, 1–16. [Google Scholar]
  5. Nasalevich, M.A.; van der Veen, M.; Kapteijn, F.; Gascon, J. Metal–organic frameworks as heterogeneous photocatalysts: Advantages and challenges. CrystEngComm 2014, 16, 4919–4926. [Google Scholar] [CrossRef] [Green Version]
  6. Li, H.; Eddaoudi, M.; O’Keeffe, M.; Yaghi, O.M. Design and synthesis of an exceptionally stable and highly porous metal-organic framework. Nature 1999, 402, 276–279. [Google Scholar] [CrossRef] [Green Version]
  7. Benyan, X.; Xu, B.; Liu, Y.; Wang, Z.; Wang, P.; Dai, Y.; Qin, X.; Zhang, X.; Huang, B. Photocatalytic Overall Water Splitting over MIL-125(Ti) upon CoPi and Pt Co-catalyst Deposition. ChemistryOpen 2017, 6, 701–705. [Google Scholar] [CrossRef]
  8. Maurin, G.; Serre, C.; Cooper, A.; Férey, G. The new age of MOFs and of their porous-related solids. Chem. Soc. Rev. 2017, 46, 3104–3107. [Google Scholar] [CrossRef]
  9. An, Y.; Liu, Y.; An, P.; Dong, J.; Xu, B.; Dai, Y.; Qin, X.; Zhang, X.; Whangbo, M.; Huang, B. NiII Coordination to an Al-Based Metal-Organic Framework Made from 2-Aminoterephthalate for Photocatalytic Overall Water Splitting. Angew. Chem. Int. Ed. 2017, 56, 3036–3040. [Google Scholar] [CrossRef]
  10. An, Y.; Li, H.; Liu, Y.; Huang, B.; Sun, Q.; Dai, Y.; Qin, X.; Zhang, X. Photoelectrical, photophysical and photocatalytic properties of Al based MOFs: MIL-53(Al) and MIL-53-NH2(Al). J. Solid State Chem. 2016, 233, 194–198. [Google Scholar] [CrossRef]
  11. Shen, L.; Liang, S.; Wu, W.; Liang, R.; Wu, L. Multifunctional NH2-mediated zirconium metal–organic framework as an efficient visible-light-driven photocatalyst for selective oxidation of alcohols and reduction of aqueous Cr(vi). Dalton Trans. 2013, 42, 13649–13657. [Google Scholar] [CrossRef]
  12. Salimi, M.; Esrafili, A.; Jafari, A.J.; Gholami, M.; Sobhi, H.R.; Nourbakhsh, M.; Akbari-Adergani, B. Photocatalytic degradation of cefixime with MIL-125(Ti)-mixed linker decorated by g-C 3 N 4 under solar driven light irradiation. Colloids Surf. A Physicochem. Eng. Asp. 2019, 582, 123874. [Google Scholar] [CrossRef]
  13. Kampouri, S.; Nguyen, T.N.; Spodaryk, M.; Palgrave, R.G.; Züttel, A.; Smit, B.; Stylianou, K.C. Concurrent Photocatalytic Hydrogen Generation and Dye Degradation Using MIL-125-NH2 under Visible Light Irradiation. Adv. Funct. Mater. 2018, 28, 1806368. [Google Scholar] [CrossRef]
  14. Chambers, M.B.; Wang, X.; Ellezam, L.; Ersen, O.; Fontecave, M.; Sanchez, C.; Rozes, L.; Mellot-Draznieks, C. Maximizing the Photocatalytic Activity of Metal-Organic Frameworks with Aminated-Functionalized Linkers: Substoichiometric Effects in MIL-125-NH2. J. Am. Chem. Soc. 2017, 139, 8222–8228. [Google Scholar] [CrossRef] [PubMed] [Green Version]
  15. Guo, Z.; Cheng, J.K.; Hu, Z.; Zhang, M.; Xu, Q.; Kang, Z.; Zhao, D. Metal-organic frameworks (MOFs) as precursors towards TiOx/C composites for photodegradation of organic dye. Rsc Adv. 2014, 4, 34221–34225. [Google Scholar] [CrossRef] [Green Version]
  16. Khaletskaya, K.; Pougin, A.; Medishetty, R.; Rösler, C.; Wiktor, C.; Strunk, J.; Fischer, R.A. Fabrication of Gold/Titania Photocatalyst for CO2 Reduction Based on Pyrolytic Conversion of the Metal–Organic Framework NH2-MIL-125(Ti) Loaded with Gold Nanoparticles. Chem. Mater. 2015, 27, 7248–7257. [Google Scholar] [CrossRef]
  17. Wang, Z.; Ren, X.; Luo, Y.; Wang, L.; Cui, G.; Xie, F.; Wang, H.; Xie, Y.; Sun, X. An ultrafine platinum–cobalt alloy decorated cobalt nanowire array with superb activity toward alkaline hydrogen evolution. Nanoscale 2018, 10, 12302–12307. [Google Scholar] [CrossRef]
  18. Tai, C.; Liu, H.; Hu, Y. Fabrication of CdS/Pt/MIL-125 with Effective Spatial Separation for Improved Visible-Light Catalytic H-2 Evolution Using gamma-Ray Irradiation. ACS Sustain. Chem. Eng. 2020, 8, 18196–18205. [Google Scholar] [CrossRef]
  19. Jiang, F.; Zeng, L.; Li, S.; Liu, G.; Wang, S.; Gong, J. Propane Dehydrogenation over Pt/TiO2-Al2O3 Catalysts. ACS Catal. 2015, 5, 438–447. [Google Scholar] [CrossRef]
  20. Zhou, L.; Wei, Y.; Zhang, H.; Zhao, Q.; Zhao, Z.; Guo, Y.; Zhu, S.; Fu, H.; Cai, W. Pt-TiO2 Bilayered Hemispherical Nanoshells with Tunable Pt Distribution for Chemically Self-Propelled Colloidal Motors. ACS Appl. Nano Mater. 2022, 5, 18469–18478. [Google Scholar] [CrossRef]
  21. Fang, J.; Shi, F.; Bu, J.; Ding, J.; Xu, S.; Bao, J.; Ma, Y.; Jiang, Z.; Zhang, W.; Gao, C.; et al. One-Step Synthesis of Bifunctional TiO2 Catalysts and Their Photocatalytic Activity. J. Phys. Chem. C 2010, 114, 7940–7948. [Google Scholar] [CrossRef]
  22. Peng, C.; Wang, H.; Yu, H.; Peng, F. (111) TiO2-x/Ti3C2: Synergy of active facets, interfacial charge transfer and Ti3+ doping for enhance photocatalytic activity. Mater. Res. Bull. 2017, 89, 16–25. [Google Scholar] [CrossRef]
  23. Zhang, N.; Liu, S.; Fu, X.; Xu, Y. Synthesis of M@TiO2 (M = Au, Pd, Pt) Core–Shell Nanocomposites with Tunable Photoreactivity. J. Phys. Chem. C 2011, 115, 9136–9145. [Google Scholar] [CrossRef]
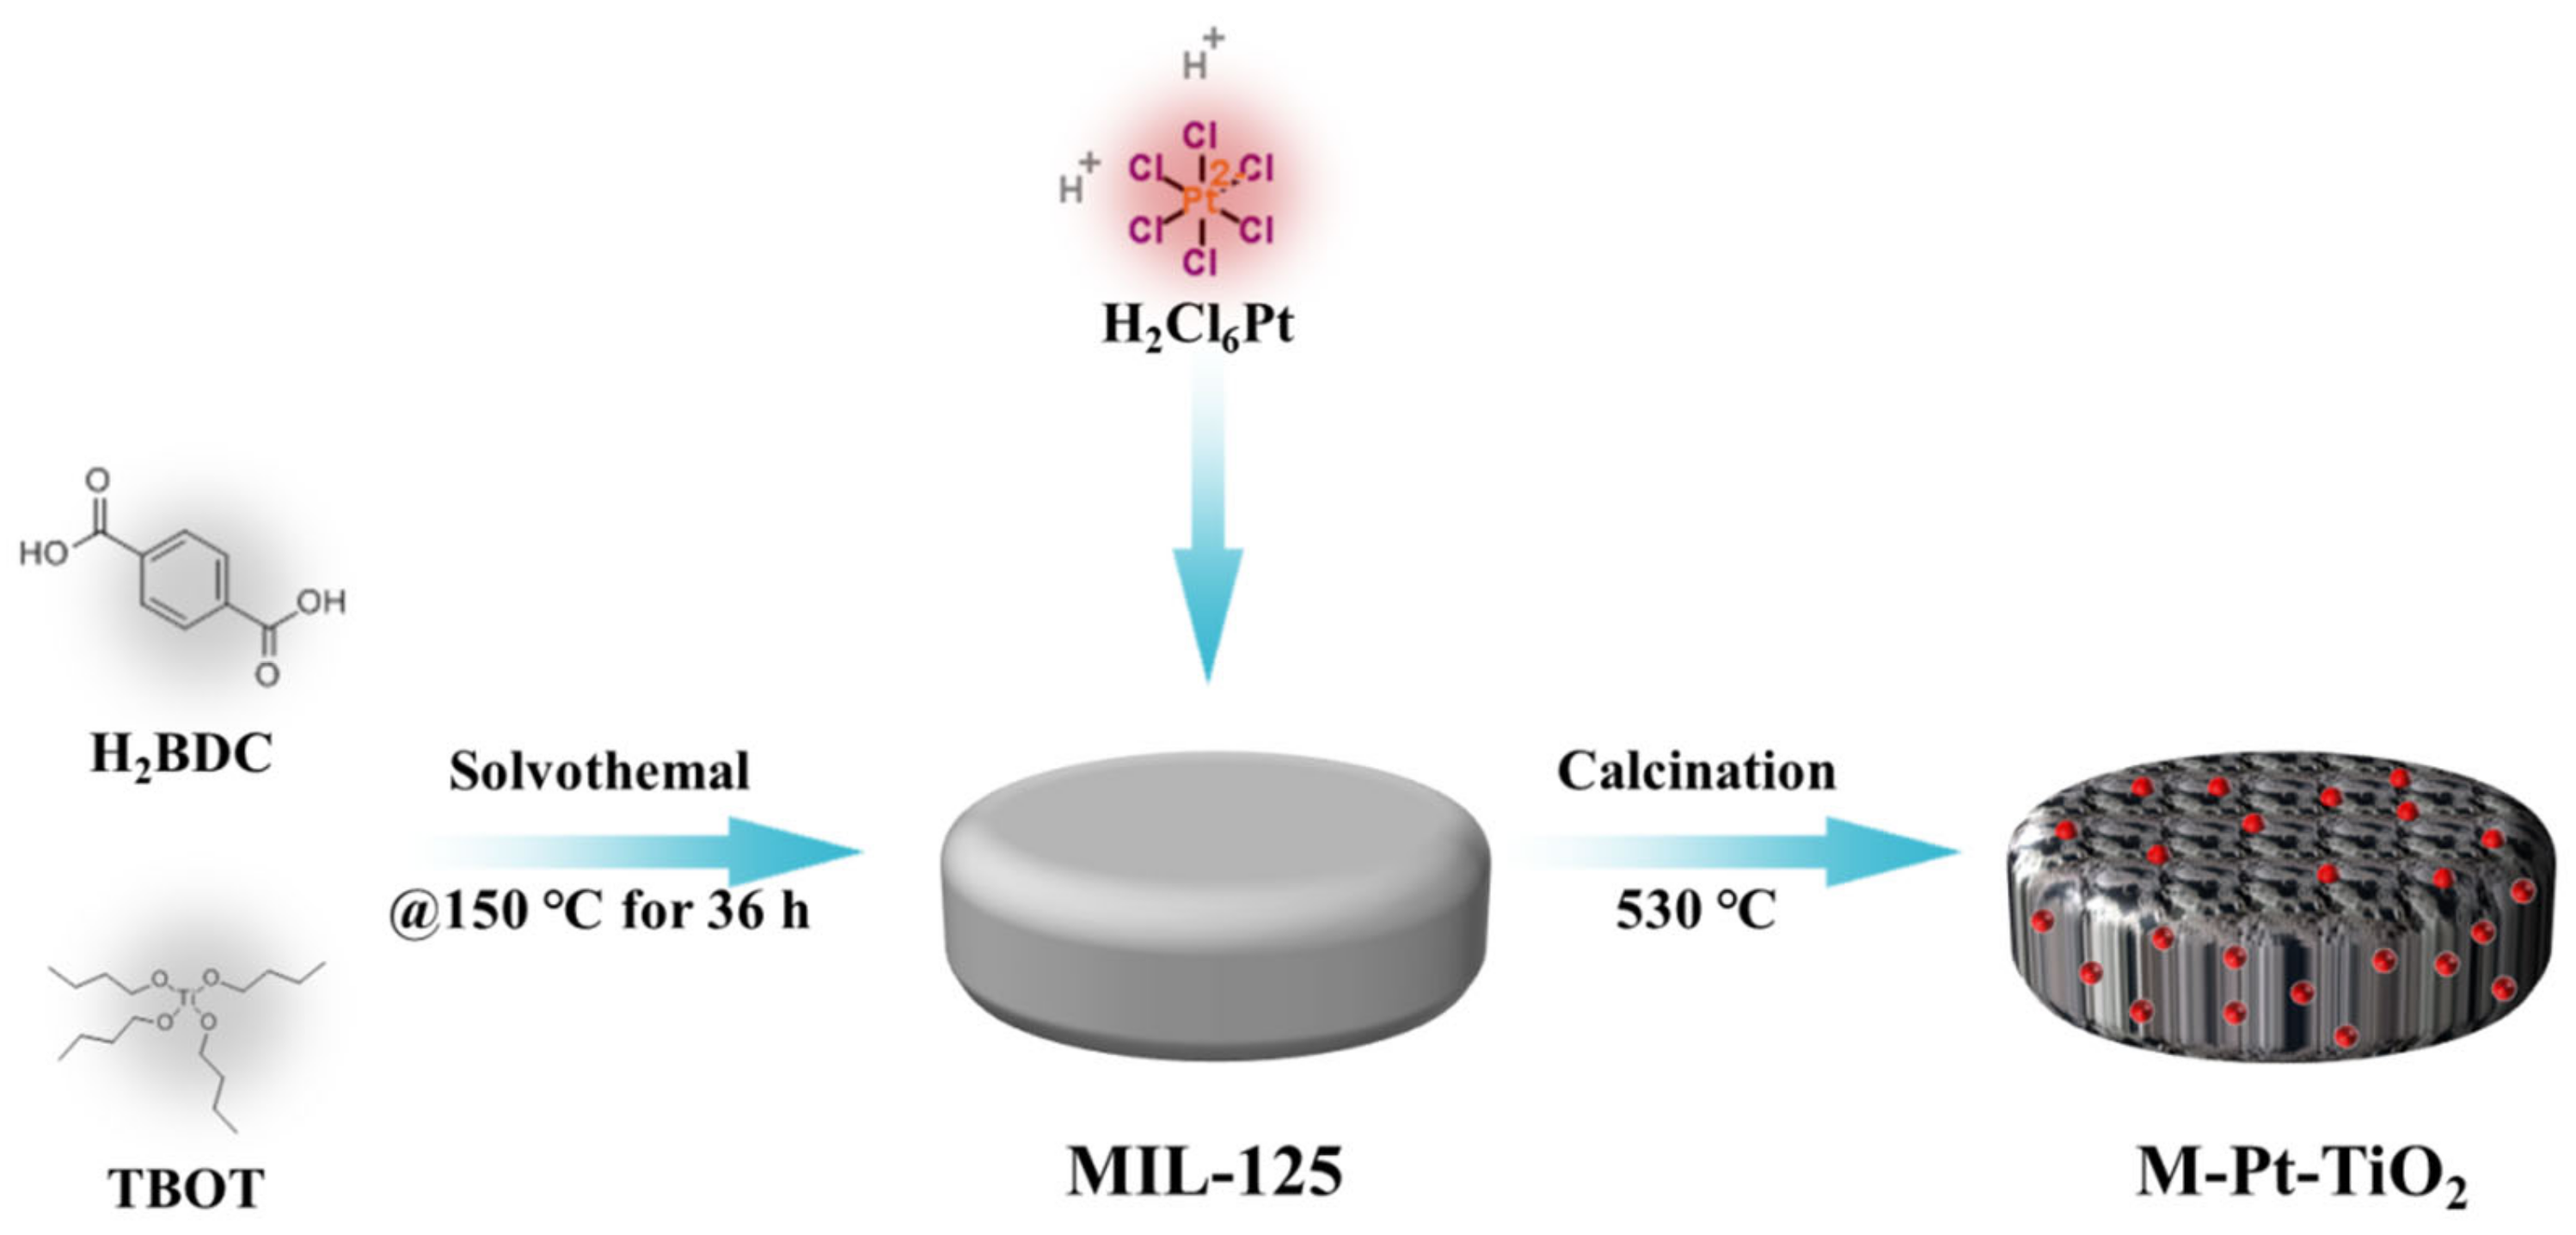
Figure 1. Schematic representation of M-Pt-TiO2.
Sustainability 15 01403 g001
Figure 2. XRD patterns of (a) MIL-125, (b) TiO2 and (c) M-Pt-TiO2.
Sustainability 15 01403 g002
Figure 3. SEM images of (a) MIL-125, (b) M-TiO2, (c) M-Pt-TiO2.
Sustainability 15 01403 g003
Figure 4. Low magnification TEM image (a) and HRTEM image (b) of M-Pt-TiO2.
Sustainability 15 01403 g004
Figure 5. Mappings of M-Pt-TiO2. (a) Mapping plot. (b) Ti distribution. (c) O distribution. (d) Pt distribution.
Sustainability 15 01403 g005
Figure 6. FT-IR spectra of MIL-125, M-TiO2 and M-Pt-TiO2.
Sustainability 15 01403 g006
Figure 7. N2 adsorption–desorption isotherms of (a) MIL-125 (b) M-TiO2 (c) M-Pt-TiO2 and (d) pore size distributions of M-TiO2 and M-Pt-TiO2 recorded at 77 K.
Sustainability 15 01403 g007
Figure 8. UV–vis absorbance spectra and Tauc plot of MIL-125, M-TiO2 and M-Pt-TiO2.
Sustainability 15 01403 g008
Figure 9. XPS data for M-Pt-TiO2.
Sustainability 15 01403 g009
Figure 10. Photocatalytic degradation of all synthesized samples under UV light. (a) Degradation diagram, (b) Kinetic diagram.
Sustainability 15 01403 g010
Figure 11. Free radical capture experiments of M-Pt-TiO2.
Sustainability 15 01403 g011
Figure 12. Suggested mechanism for photocatalytic degradation of RhB over M-Pt-TiO2.
Sustainability 15 01403 g012
Figure 13. Four-cycle degradation test of M-Pt-TiO2.
Sustainability 15 01403 g013
Figure 14. XRD comparison of catalysts before and after cycling: (a) before cycling degradation test and (b) after cycling degradation test.
Sustainability 15 01403 g014
Table 1. Reagents and their parameters.
ReagentsSpecificationsManufacturer
Ammonium chlorideARHangzhou Gopin Fine Chemicals Co.; Hangzhou, China
MethanolARHangzhou Gopin Fine Chemicals Co.
Anhydrous ethanolARHangzhou Gopin Fine Chemicals Co.
Isopropyl alcoholARShanghai Aladdin Reagent Co.; Shanghai, China
2-MethylimidazoleARShanghai Aladdin Reagent Co.
Tetra-butyl titanateARSigmar Aldridge, Miamisburg, OH, USA
DimethylformamideARShanghai Aladdin Reagent Co.
Chloroplatinic acidACS, ≥99.0%Shanghai Aladdin Reagent Co.
Titanium dioxide (P25)ARHangzhou Gopin Fine Chemicals Co.
Terephthalic acidARHangzhou Gopin Fine Chemicals Co.
Rhodamine BARShanghai Aladdin Reagent Co.
EDTAARShanghai Aladdin Reagent Co.
p-BenzoquinoneStrong, ARHangzhou Gopin Fine Chemicals Co.
Deionised waterAR
Table 2. Experimental instruments and their parameters.
InstrumentsModelsManufacturer
Ultrasonic cleanersJP-040SShenzhen United Cleaning Equipment Co., Shenzhen, China
Constant temperature and pressure drying ovensDHG-9035AShanghai Heng Yi Technology Co.; Shanghai, China
High-speed centrifugesH-1850Hunan Xiang Yi Experimental Instrument Development Co.; Changsha, China
Digital magnetic stirrerSZCL-24AHangzhou Youning Instrument Co.; Hangzhou, China
Muffle FurnacesKSL-II00XXHefei Kepin Materials Technology Co.; Hefei, China
Table 3. Molecular formulae, structural formulae and molecular weights of target degradate.
NameMolecular FormulaStructural FormulaMolecular Weight
Rhodamine B (RhB)C28H31C1N2O3Sustainability 15 01403 i001479.01
Table 4. BET and pore size of samples.
NameSpecific Surface Area (m2.g−1)Average Pore Size (nm)
MIL-1251366.937/
M-TiO234.28847.856
M-Pt-TiO241.19947.988
Disclaimer/Publisher’s Note: The statements, opinions and data contained in all publications are solely those of the individual author(s) and contributor(s) and not of MDPI and/or the editor(s). MDPI and/or the editor(s) disclaim responsibility for any injury to people or property resulting from any ideas, methods, instructions or products referred to in the content.