Article

Solid and Liquid Phases of Anaerobic Digestate for Sustainable Use of Agricultural Soil

by
Alvyra Slepetiene
*,
Jurgita Ceseviciene
,
Kristina Amaleviciute-Volunge
,
Audrone Mankeviciene
,
Irmantas Parasotas
,
Aida Skersiene
,
Linas Jurgutis
,
Jonas Volungevicius
,
Darijus Veteikis
and
Ieva Mockeviciene
Institute of Agriculture, Lithuanian Research Centre for Agriculture and Forestry, Akademija, 58344 Kedainiai, Lithuania
*
Author to whom correspondence should be addressed.
Sustainability 2023, 15(2), 1345; https://doi.org/10.3390/su15021345
Submission received: 5 December 2022 / Revised: 24 December 2022 / Accepted: 8 January 2023 / Published: 10 January 2023

Abstract

:
Given the growth in the number of biogas power plants and the increase in the generation of waste from energy production, it is relevant to study the sustainable nature of this waste. Digestate is a product of the anaerobic digestion process, and is a valuable bio-fertilizer containing organic matter and nutrients necessary for agricultural plants’ growth. The study showed that different rates of liquid and solid phases of anaerobic digestate influenced the contents of carbon and nitrogen in genetically young soil in alluvial deposits—Fluvisol. The application of solid digestate (SD) considerably increased soil organic carbon content (SOC) in the 0–10 cm soil layer; however, SOC did not reach the 20–30 cm layer. Liquid digestate (LD) significantly increased SOC in the deeper layers. The levels of mineral nitrogen (Nmin) and water extractable organic carbon (WEOC) increased in the 0–10 cm soil layer soon after fertilization with LD and SD. The mobile components of the soil (Nmin and WEOC) were characterized by high variability during the growing season. Within the 2-month period, their concentrations decreased drastically and were close to those of unfertilized soil. The research indicates that anaerobic digestate had a greater effect on mobile forms of carbon and nitrogen in the soil than on their total amounts.

1. Introduction

The concept of the “Thematic Strategy on Soil” [1] requires EU countries to monitor and evaluate soil quality. The strategy encourages the stakeholders to use the soil in a way that prevents the loss of its quality and overall productivity, as well as the deterioration of its physical, chemical, and biological characteristics. Recently, focus has been on the loss of agricultural soil area and the degradation in soil quality in many countries all over the world, including in the EU [2].
The existing legislation in Europe categorically supports anaerobic digestion of organic wastes [3]. The volume of digestate has increased in recent years as a result of increased biogas generation. For example, each year, in Germany, more than 50 million tons of digestate are generated [4]. Anaerobic digestate (AD) is rich in nitrogen, including high levels of mineral nitrogen (Nmin), especially in the form of ammonium (N-NH4), which is available for plants; its amount depends on the freshness of the digestate [5,6]. Moreover, AD contains other macro- and microelements necessary for plant growth [4,5,6]. It is also rich in labile organic compounds [6] and contains high amounts of volatile fatty acids (C2-C5), which can be easily degraded within a short perriod of time in the soil [7]. The highest rate of carbon compounds degradation has been observed on the first day after treatment [8], but the rate of mineralization remains high for the following 30 days [9]. Moreover, the carbon mineralization values obtained in a soil incubation study show that the results for raw slurry resemble those for compost at the beginning of the composting process; the mineralization rate of digested slurry in the soil was similar to that of matured compost [8].
Although biogas is a promising, sustainable and renewable energy resource, the ability to control the significant volumes of byproducts produced during the biogas production process is crucial for the anaerobic digestion process to operate sustainably [10]. Based on the application’s technological capabilities, AD might be employed in both its solid and liquid phases. Therefore, studies on the chemical composition of digestate fractions are important, showing that the impacts on soil of wet and dry digestate components are distinct [4,11].
Depletion of soil organic matter (SOM), a vital component of the soil–plant ecosystem, results in decreased soil biological and enzymatic activity, poor aggregation, accelerated soil erosion, and loss of water-holding ability [12]. Soil organic matter is an important component of both managed and unmanaged terrestrial ecosystems; it also has a crucial influence on soil erosion [13]. Therefore, it remains important and relevant to find a means to maintain and increase SOM and its main constituent—soil organic carbon (SOC).
The use of mineral fertilizers usually increases plant yield. However, in rare cases, as shown by Dong et al. [14], the application of mineral NPK fertilizers results in an increase in SOC and total nitrogen (TN) levels in the soil by 22% and 17.8%, respectively, compared to unfertilized soil. The use of AD in agriculture as a fertilizer and, especially, for soil improvement can replace the manure previously used for this purpose [15], as well as mineral fertilizers. According to Bermejo Domínguez [4], farmyard manure with a dry matter (DM) content of 25% applied to the soil allows the formation of 40 kg of humus-C per tonne of substrate; a liquid manure with 4–10% DM will produce 6–12 kg, and solid digestate (SD) with 25–35% DM can produce 36–50 kg. Liquid digestate (LD) with 4–10% DM produces 6–12 kg humus-C per ton of digestate. These results suggest that the most stable fertilizer, depending on the potential CO2 emission, as well as the lignin and cellulose content of the fertilizers, is farmyard manure, and the most unstable is liquid manure. Digestates hold an important position, and SD is less stable than LD. This means that the potential for humus formation in farmyard manure and SD is higher compared to that of liquid manure and LD. Humic substances in the soil perform various functions, and their sorption and ion exchange capacity reduce nutrients, e.g., nitrates leaching from the soil [16,17]. By incorporating digestate into the soil, organic matter and nitrogen can be added, which can accelerate the humification process [18]. Part of SOM, the water extractable organic matter includes nitrogen and labile organic carbon molecules that are vulnerable to soil management. As compared to the control and LD-treated soil, a substantial increase in N-containing microbial biomass was seen in soil treated with SD, proving that N was immobilized in that soil. The authors concluded that these findings imply that the liquid–solid separation and pelletization of the solid AD fraction yield an organic biomass with decreased soil biodegradability for organic matter [19]. However, there is not sufficient evidence that demonstrates the impact clearly of different phases of digestates used as bio-fertilizers on changes in SOC, labile carbon and nitrogen compounds, as well as their seasonal dynamics under real field conditions in low-fertility soil—Fluvisol.
Anaerobic digestate is a fertilizer rich in nutrients, including nitrogen, phosphorus and potassium [18]. Lu and S. Xu (2021) [20] compared the reported results for a peat substrate, and the physical and chemical properties of the digestate from different feedstocks. In terms of nitrogen, 23–327 g kg−1 total solids (TS) was reported. The concentrations of 2.2–18.5 g kg −1 TS and 5.8–46.4 g kg −1 TS were found for phosphorus and potassium, respectively. The lowest NPK amounts were identified for the pig manure-based digestate, while the highest nitrogen concentration was for food waste-based digestate [20]. The exact composition of digestate depends on many different aspects, such as biogas plant process operation conditions, digestate storage strategy and, mainly, the feedstock used. Risberg et al. [21] concluded that the digestate’s nutritional quality varies depending on the substrate that was processed in the biogas plant, and may include substances that either promote or inhibit soil microbial activity. Tambone et al. [22] studied the anaerobic digestion process in a full-scale plant. Anaerobic digestion, according to fiber analysis and spectroscopic methods (13C CPMAS NMR), proceeds by the concentration of more resistant molecules and the breakdown of more labile molecules (lignin and non-hydrolysable lipids). Due to these changes, the digestate was shown to be more biologically stable than the initial feedstock mixture. Giulio et al. [23] compared the fertilizing properties of two liquid and two dewatered sewage sludge digestates, which were tested on tomato plants (Solanum lycopersicum L.). Under greenhouse conditions, pot tests were conducted with a digestate fertilization rate of 170 kg N ha−1 over a three-month period on sandy soil and peat substrate. Different growth parameters showed significant affects on the outcomes of the digestates, showing an increase in biomass and height of up to 37.5- and 6-fold over the untreated control, respectively. Plants that were treated with digestate showed no phytotoxic effects.
The use of digestates results in a reduced requirement for mineral fertilizers [24], making it a cost-efficient approach. Lošák et al. [17] emphasized the positive effect of digestate because the anaerobic digestate (AD) application led to yields and qualitative indicators that were on par with or better than those of mineral fertilizers. For example, compared to both treatments with mineral fertilizer, the nitrate level of kohlrabi bulbs fertilized with digestate was almost three times lower. Many studies are often limited to assessing the effects of AD on plant growth [17,25,26]. Nevertheless, there are different published research papers that have reported the changes of soil properties after digestate application. However, there are insufficient data on changes in the properties of infertile soils, including sandy soils, and Fluvisols. According Makádi [26], in comparison to loamy textured soils, irrigation and digestate treatments had a better influence on sandy soils.
Diverse studies are required to determine an appropriate digestate fertilization application rate and frequency. There are also fewer works comparing the influence of different phases of digestate not only on total C and N, but also on mobile C and N forms, and on their dynamics in individual years and during a single season [27]. According to Alburquerque et al. [27], in the short term, nitrogen from the digestate is quickly and readily available for plant growth, but it can also be lost easily. This, in addition to the slow rate of microbial processes driven by low temperatures, could diminish the digestate’s fertilizing capacity. Finally, the present research is different compared to the other published studies in the way that it is performed under real environmental conditions in a field experiment approach.
The effects of fertilizers, as well as digestates, depends on the type, chemical composition, layers of soil profile and its individual properties. According to Arbačauskas et al. [28] nitrogen concentrations in lightly textured agricultural soils (sand, sandy loam) are lower compared to those of heavily textured soils (loam, clay). The improving of soil properties is especially important for Fluvisols, which are formed in an accumulative landscape and form a small but geo-systemically important part of all European and Lithuanian agricultural soils. They have a significant impact on the natural geochemical sorption of micro- and macro-elements, and are also an important reservoir of SOC [29]. There are few studies on the use of Fluvisols in agriculture and the impacts of such use on the agro-ecological properties of the soil [30,31,32]. Fluvisols occupy about 6% of the total European soil cover, and are one of the predominant soil groups in Europe [33]. In Lithuania, Fluvisols cover about 2.6% of the territory. Compared to other soils, Fluvisols usually have a relatively high organic carbon content in the subsoil [34]. As the predominant soil-forming rock of Fluvisols is sand, it is important to use the soil sustainably to preserve SOC and SOM content, and thus soil fertility. However, soil properties such as temperature [35] or moisture regime [36] affect the ability of soil to accumulate SOC and WEOC because of long-term organic fertilization.
Anaerobic digestate is considered a bio-fertilizer that can restore the fertility of eroded soils and low-fertility soils [37]. According to a previous study, digestate fertilization has advantages, such as lower nitrate leaching, compared with mineral fertilizers [38], and can therefore been regarded as a sustainable fertilizer. Additonally, organic matter in the digestate can build up the humus content and SOC in the soil, a characteristic that only benefits organic fertilizers and is particularly crucial for eroded soils with a low carbon content. Based on published data, the effects of AD on soil are comparable to those of mineral fertilizers [4], but there are no studies on the use of SD and LD phases and their effects on the properties of the individual soil typological unit—Fluvisol.
The main purpose of this research paper was the investigation of the digestate‘s impact on the soil properties. The digestate‘s application as a bio-fertilizer or soil improver can be analyzed from many points of view, and one of them is economic feasibility. Digestate-based fertilization will make it possible to follow trends in the circular economy and sustainability [39]. Czekala et al. [40] estimated the economic value of digestate. According to their research, the value of digestate was calculated to be between EUR 6.08 and 15.36 Mg−1. It is noteworthy that the logisitics of converting the liquid fraction of the digestate from the biogas plant to application in a field plays an important role in terms of the economic feasibility of the digestate-based fertilization approach [41].
In this context, the aim of this study was to find out how different rates of separated liquid and solid fractions of anaerobic digestate influence the carbon and nitrogen changes in different layers of Fluvisol.

2. Materials and Methods
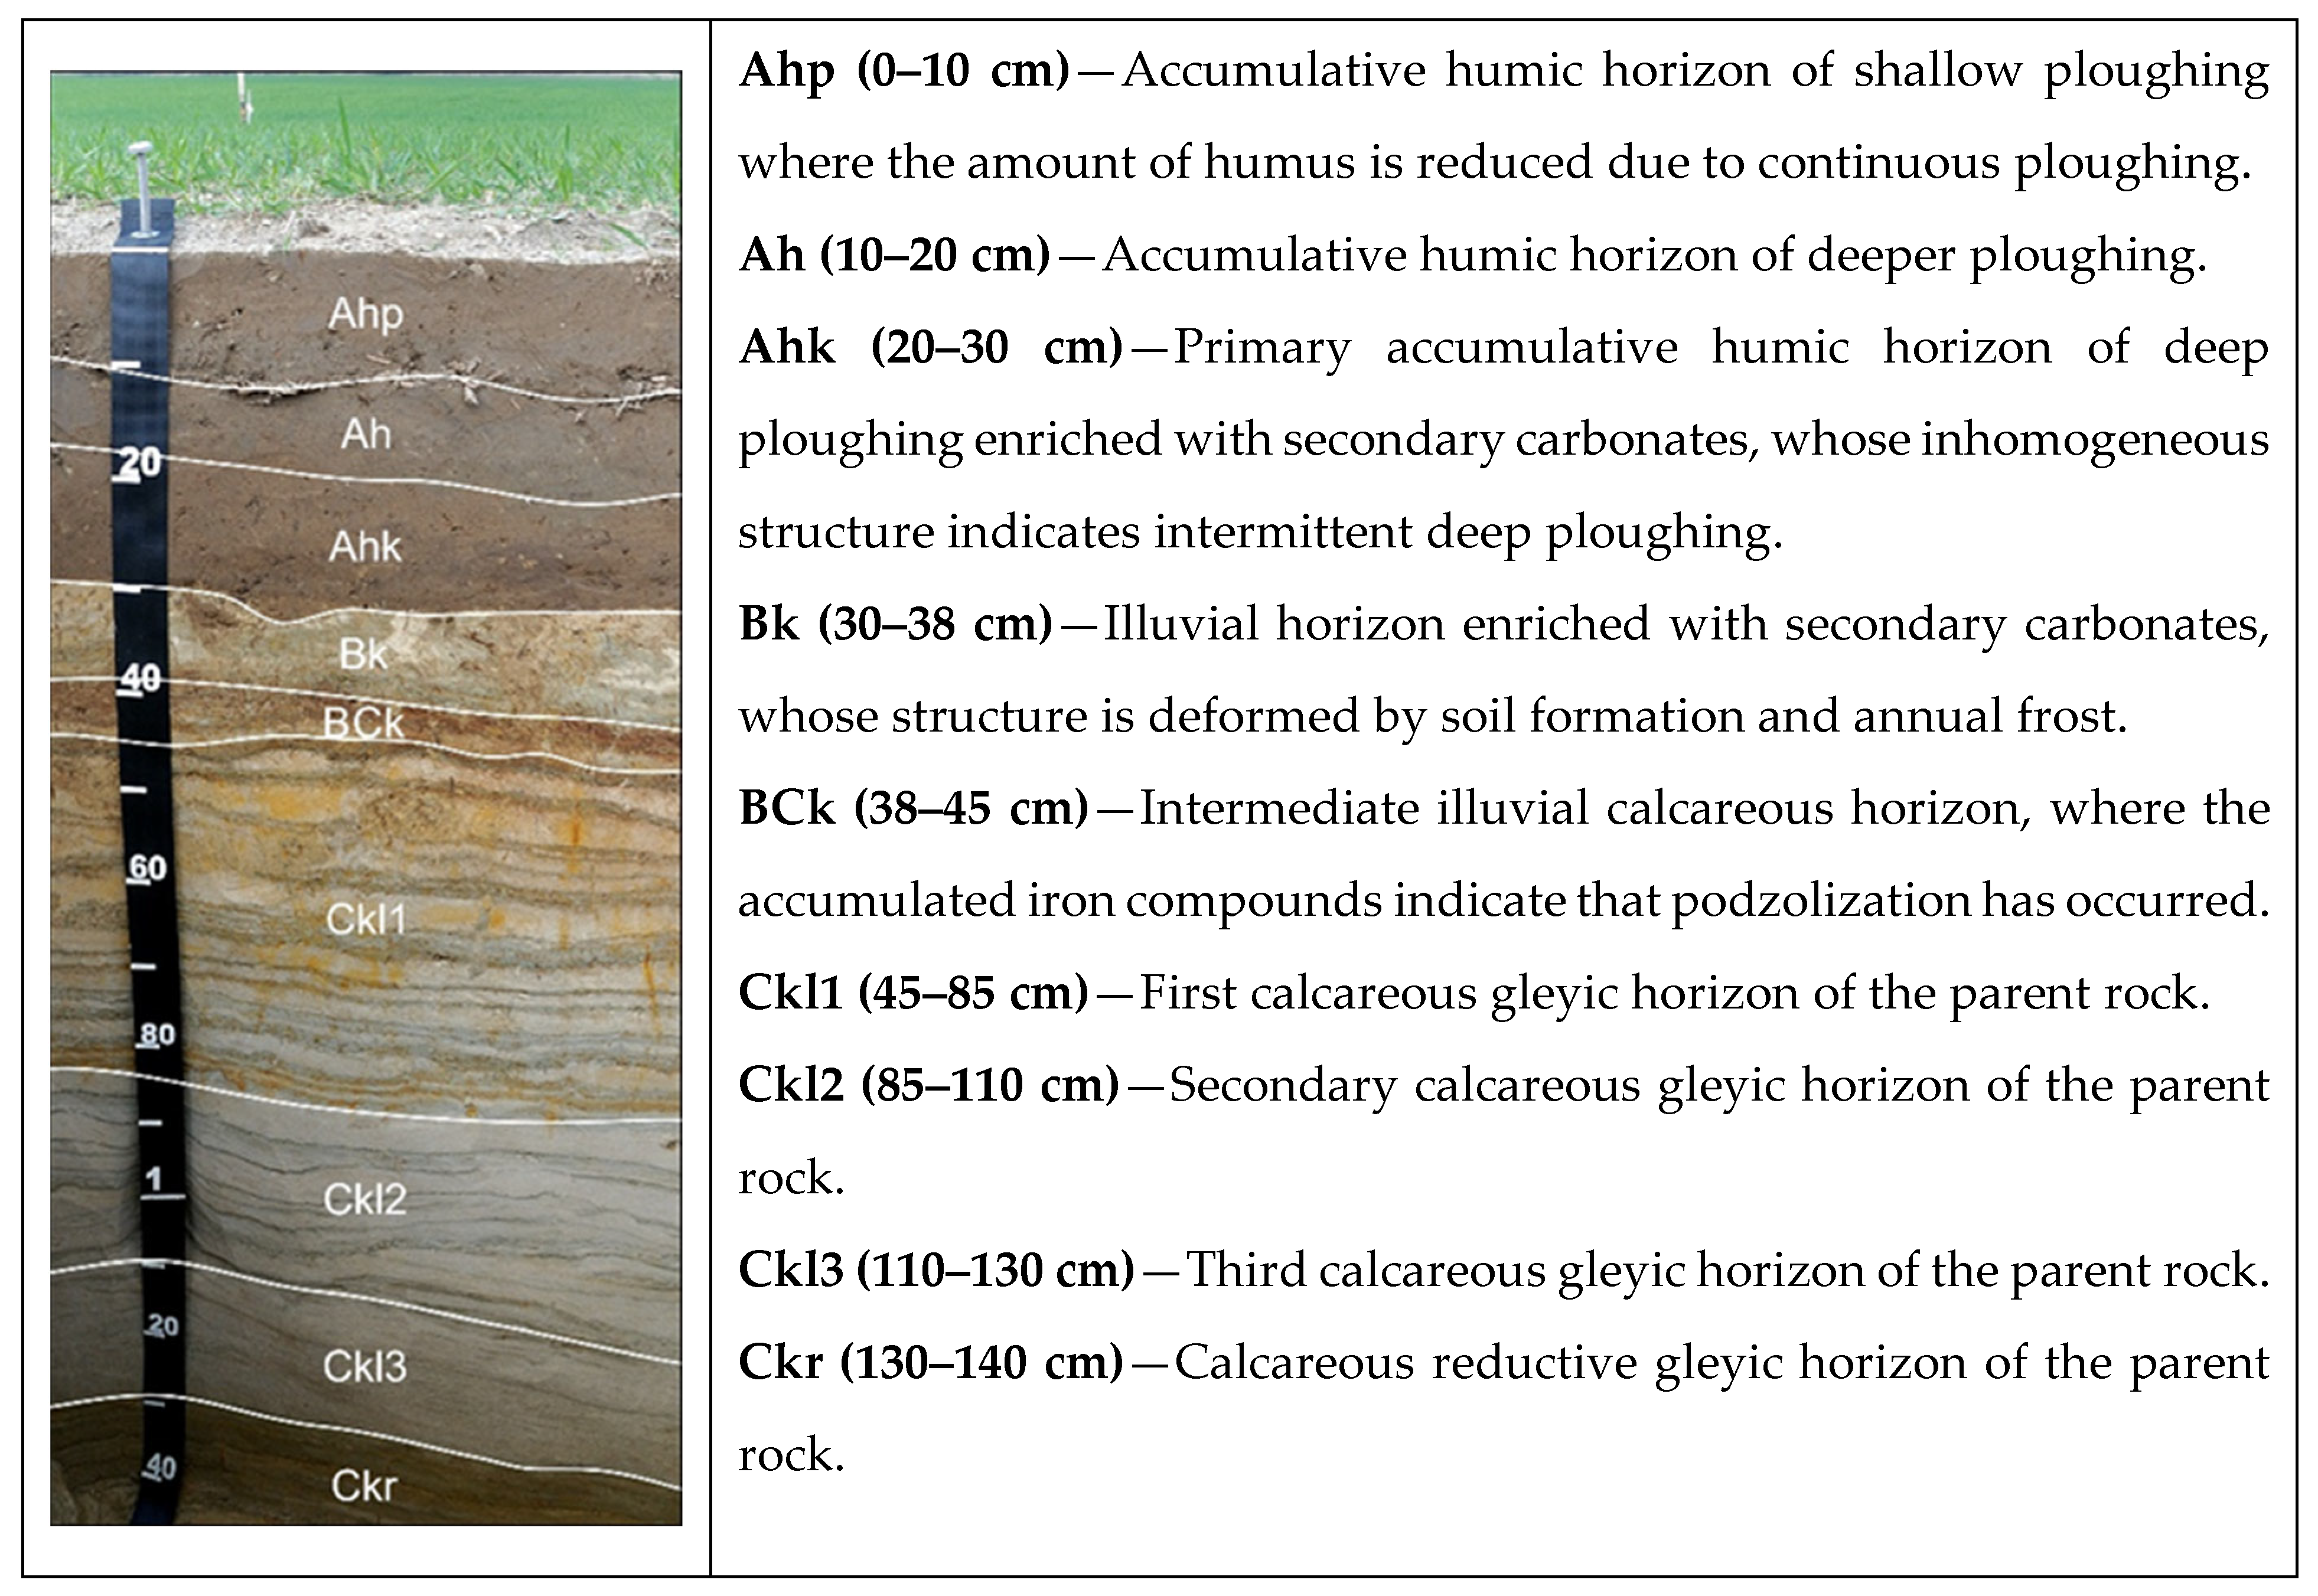
2.1. Study Area

The field experiment was performed near Surviliskis, Kedainiai distr., in the first alluvial terrace of the Nevezis River, which is in the middle part of Central Lithuania’s lowland (55°26′08.37′′ N, 24°02′27.75′′ E). The surface drainage system is 250 m from the experimental site and 35 m away is the natural drainage, the Nevezis riverbed. The predominant soil has formed in alluvial sand deposits. The soil typological unit was identified according to World Reference Base—WRB 2014 guidelines [42]—Eutric Pantocalcaric Endogleyic Pantofulvic Fluvisol (Arenic/Siltic, Aric, Densic).
The semi-natural grassland in the experimental site was ploughed in 1993, and research was conducted in the crop rotation in 2018—winter triticale (Triticum × secale)—and in 2019—mistute of oat (Avena sativa L.) and vetch (Vicia sativa L.). The conventional soil tillage method was used. Prior to the experiment in April 2018, the topsoil (0–30 cm) characteristics were as follows: pH between 6.25 and 6.64, humus content between 2.48 and 2.02%, plant available phosphorus (P2O5) and potassium (K2O) 464 and 508 mg kg−1, respectively; the subsoil (30–50 cm) pH was about 6.8 and humus content was 0.43%.
Five fertilization treatments were applied: (1) control (no fertilizer was applied); (2) separated liquid digestate 85 kg ha−1 N (85N LD); (3) separated liquid digestate 170 kg ha−1 N (170N LD); (4) separated solid digestate 85 kg ha−1 N (85N SD); (5) separated solid digestate 170 kg ha−1 N (170N SD). The application rates of LD and SD were calculated based on the total Kjeldahl nitrogen (TKN) content in the digestate. SD was evenly spread outside by hand, and the LD was poured from a watering can. A randomized experimental design with three field replicates was used, and the plots were 2 × 3 = 6 m2. Fertilizers were applied on 18 April 2018, and on 2 April 2019.
For the soil profile description, a composite sample was taken from the 3 profile walls/sides. The aim of the profile description was to identify the soil typological unit and to present general trends in the soil profile. The Fluvisol profile description is provided in Figure 1. Fluvisol was characterized by a thick (0–30 cm) topsoil (Ahp-Ah-Ahk) and a calcareous subsoil (Bk-BCk-Ckl).
The soil Ah horizon (Figure 1, Table 1) was moderately rich in SOC, TN and TP, with concentrations decreasing significantly with layer. The concentrations of TK, which migrates sufficiently, were similar in both the topsoil and subsoil. The concentrations of N-NH4 and N-NO3 were not high.

2.2. Digestate Sampling and Analysis Methods

The digestates of solid and liquid fractions were obtained direct from the biogas plant located in Krekenava, Panevezys distr., Lithuania. This biogas plant uses pig slurry and plant materials (vegetables, grain mill bran, starch production waste, beet root pulp) for biogas production. The installed power plant‘s capacity is 1000 kW in electricity. The biogas plant operated for 8200 full-load hours in 2020. The biogas plant operates at 30 days of hydraulic retention time with an average 2.2 kg volatile solids/m3/day regime. The operational temperature is set to 39 +/− 1 °C. A screw press is used for digestate separation in the biogas plant. Many of the biogas plants in Lithuania and the Baltic Sea Region separate the digestate prior to the post-fermentation storage in the storage lagoons. In our study this is done by a solid–liquid separator, mostly a screw press separator. Therefore, the reference of the whole (SD + LD) digestate was not chosen due so as to replicate the realistic conditions of the anaerobic digestion industry in our region. For the digestate separation in two phases the Agrometer AGM Screw Press (250 m3/24 h) was used. Prior to fertilization, 5 kg of separated SD and 5 L of LD were collected and stored in a PTFE bottle without headspace. The pH was determined by the potentiometric method immediately after the homogenization of the fresh sample for LD and after extraction with deionized water (1:10, w:v) for SD; the dry matter (DM) content was measured using the gravimetric method after drying at 105 °C for 24 h. The total nitrogen (TKN) content was measured by the Kjeldahl method (Kjeltec system 1002, Foss Tecator, Sweden), and the N-NH4 concentration was determined by the standard spectrophotometric procedure using a cuvette test LCK 302. For N-NO3, we used the same procedure, but with the cuvette test LCK 339 (DR 3900, HACH Lange, Germany). The content of organic matter (OM) was determined by loss on ignition at 550 °C for 24 h. The total organic carbon (OC) content was determined after wet combustion with potassium dichromate and sulfuric acid by spectrophotometric measurement at the wavelength of 590 nm, using glucose as standard [43]. The total phosphorus (TP) content was determined spectrophotometrically at the wavelength of 430 nm, and the total potassium (TK) content was measured via atomic absorption spectrometry after wet digestion with sulfuric acid.

2.3. Soil Sampling and Analysis Methods

Soil samples for chemical analyses were collected twice per year: in 2018 on May 24, 5 weeks after fertilization, and on July 19, after harvesting, and in 2019 on May 16, 6 weeks after fertilization, and on July 8, after harvesting. Five subsamples per plot were taken randomly. Soil samples were collected using a standard hand steel auger. As fertilization was carried out according to the N fertilization rate, the N analysis of digestate was carried out on the same day as the sampling, and the digestate was used in the field experiment according to the analysis results.
Soil moisture was determined gravimetrically via oven-drying at 105 °C for 24 h. For chemical analyses, soil samples were air-dried and visible roots and plant residues were manually removed. N-NH4 and N-NO3 analyses were performed on fresh soil samples. Subsequently, the samples were crushed and sieved through a 2 mm sieve and mixed. For the analysis of SOC and water-extractable organic carbon (WEOC), an aliquot of the samples was passed through a 0.25 mm sieve. Soil pH was determined by the potentiometric method in 1M KCl (1:5, w:v). The content of SOC was determined according to the Nikitin-modified Tyurin method with spectrophotometric measurement at a wavelength of 590 nm [43]. WEOC was measured by the IR detection method after UV-catalyzed persulphate oxidation, using the ion chromatograph SKALAR, Netherlands. Total nitrogen (TN) was determined by the Kjeldahl method using the spectrophotometric procedure at the wavelength of 655 nm. The total phosphorus (TP) content was determined spectrophotometrically at the wavelength of 430 nm, and the TK concentration was measured using atomic absorption spectrometry after wet digestion with sulfuric acid. The content of N-NH4 was determined spectrophotometrically at the wavelength of 655 nm after extraction with 1M KCl (1:2.5, w: v), and N-NO3 was measured via the ionometric method after extraction with 1% KAl(SO4)2 12H2O (1:2.5, w:v). The sum of N-NH4 and N-NO3 was presented as mineral nitrogen (Nmin).

2.4. Climatic and Meteorological Conditions

The study area is located within the agro-climatic region, where the sum of active temperatures (t > 10 °C) is 2190–2250 °C in the air and 2500–2600 °C in the soil. Frosts on the soil surface generally last for 142–143 days [36]. The spring meteorological conditions varied during the experiment; dry and windy weather prevailed. The average air temperatures in April and May were above 3.9 and 4.5 °C in 2018, respectively, and 0.5 and 2.9 °C in 2019, respectively, compared to the long-term average (Table 2).
A precipitation amount of 92.3 mm fell in April and May, which corresponded to the long-term average (88.6 mm), but nearly one-third of the precipitation (38.2 mm) fell in the first decade of April, prior to the experiment. In the third week of May, precipitation was below 1.1 mm. The average air temperature in June and July was 2.2 °C higher than the long-term mean (16.8 °C during 1924–2019). Precipitation during these months was 117.4 mm, which is only 85% compared to the average of 137.8 mm in 1924–2019. The drought period was recorded from late May to early July in 2018, and from early April to early July in 2019.

2.5. Statistical Analysis

The experimental data on soil parameters are presented as mean and standard error (SE), and three field replicates were used for calculations. For statistical analysis, we used the software package STATISTICA 7.1 for Windows (StatSoft Inc., Tulsa, OK, USA). Four-way analysis of variance (ANOVA) was performed. Variance parameters calculations were performed using Univariate Tests of Significance, Effect Sizes, and Powers with Sigma-restricted parameterization and effective hypothesis decomposition. Significant differences among treatment means were assessed by Fisher’s test, where p-values were calculated, and a value of p < 0.05 was considered statistically significant.

3. Results and discussion

3.1. Analysis of Variance for Soil Characteristics

The soil layer factor showed the strongest effect on the variability of all analyzed soil properties individually (the largest effect was detected on SOC) or in sub-groups of other factors (Table 3). The sampling time factor had a significant effect on the dispersion of N-NO3 and Nmin concentrations, both of which were strongly affected when the layer factor was combined with the sampling time factor. The year factor significantly affected mobile forms of soil organic carbon, such as WEOC, and had a definite but weaker effect on the levels of SOC, TN, Nmin and N-NH4 in soil, but no effect on the concentration of N-NO3.
Regarding individual soil properties, the soil layer factor determined the largest part of the variance of SOC concentration, and during the growing season, we observed the largest variation in soil N-NO3 content. The largest variation in soil N-NH4 content was a result of layer and year factors, whereas the variation in Nmin concentration was mainly influenced by soil layer and sampling time.

3.2. Comparison of Chemical Composition of Liquid and Solid Phases of Digestate

Digestate from anaerobic digestion can be processed or used as a fertilizer in agriculture. Complex organic nitrogen compounds from feedstocks are mineralized to ammonia during anaerobic digestion. The microorganisms in the digester consume some of the N-NH4 for growth, and the remaining ammonia reacts to form struvite and ammonium carbonate; less than 1% traces of volatile ammonia are present in the biogas [44]. The benefit of using AD as a fertilizer or amendment depends on the composition and quality of feedstocks [45]. In our research, the amount of TN in LD was higher compared to SD, and N-NH4 accounted for 47.5 and 61.4% of TN. The N-NH4 content of the digestate was approximately 60–80% of its TN content, but Furukawa and Hasegawa [46] reported that 99% of TN in the digestate originated from kitchen food wastes in the N-NH4 form, whereas the N-NH4 concentration is usually increased due to protein-rich feedstock [6,47]. The N-NH4 in SD accounted for only about 4% of TN. In our study the SD showed stronger alkaline properties (8.19 and 8.54) compared to LD (up to pH = 8) (Table 4), which could affect soil pH and nutrient availability. LD had higher concentrations of phosphorus and potassium, compared with SD. The SD showed higher levels of OM, TC and TC-to-TN ratio.

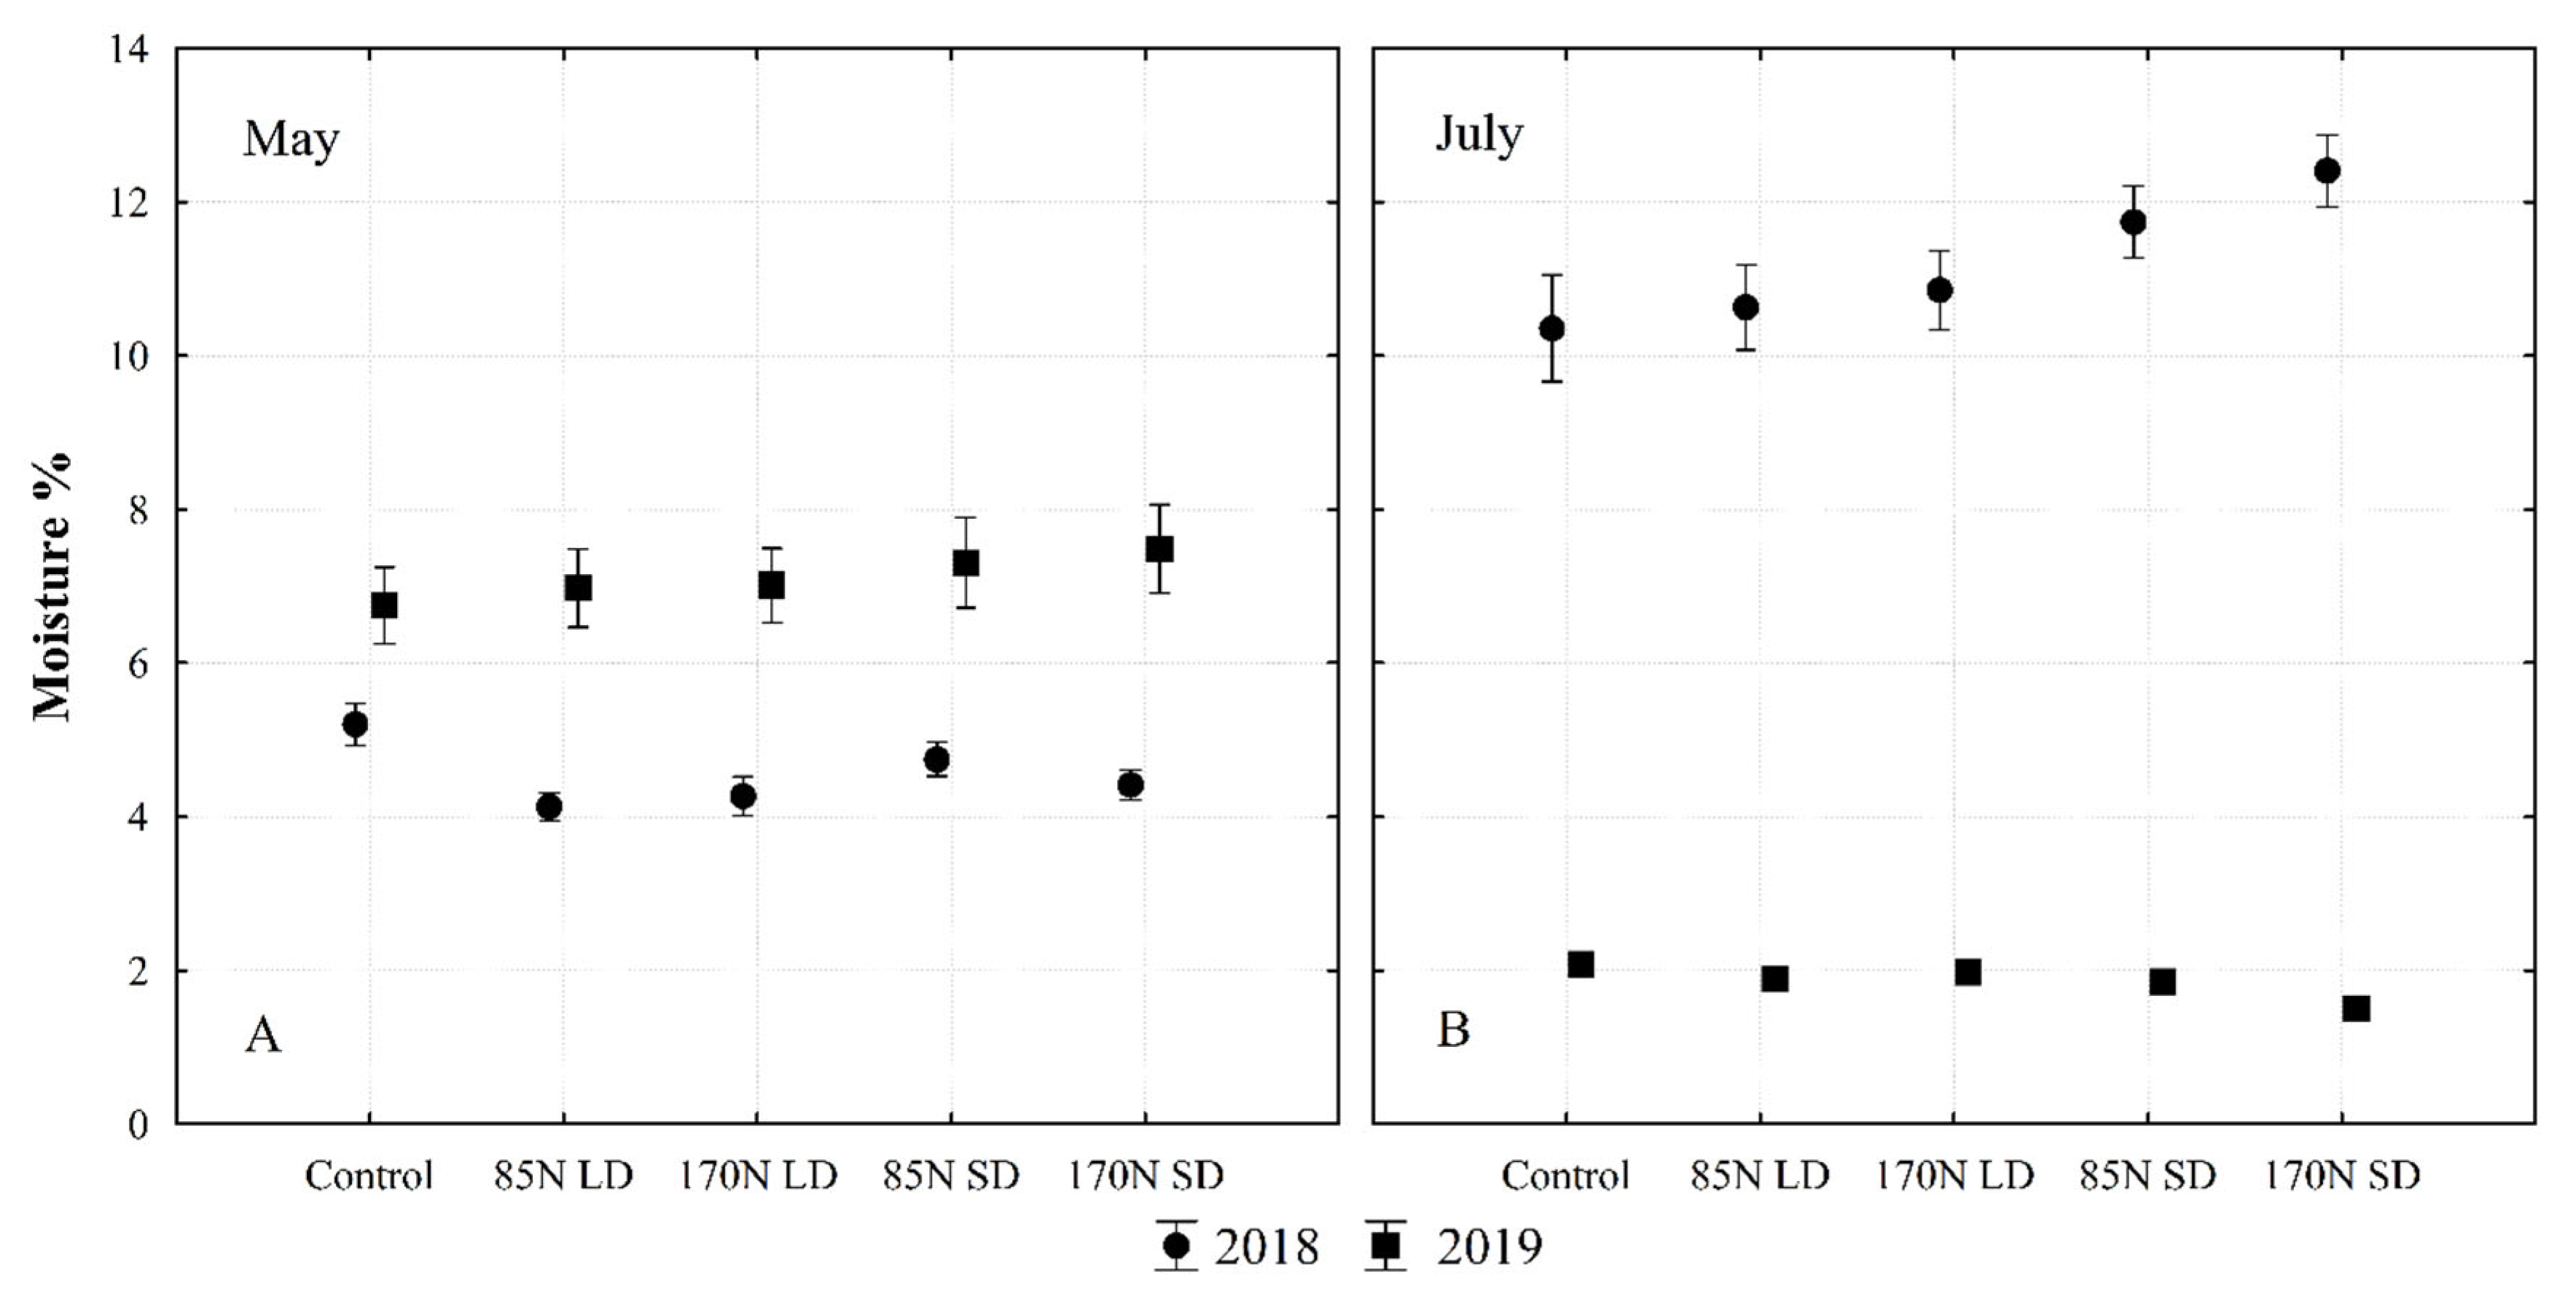
3.3. Changes in Soil Moisture Content during the Field Experiment

During the growing season, the soil moisture content varied: in 2019, the soil was drier compared to 2018 (Figure 2). In the wetter 2018, the use of SD slightly reduced soil moisture losses in all studied layers (Table 5).
It is obvious that the moisture content at the sampling time in July in the arable layer after fertilization with SD is higher compared to the level after fertilization with LD (Figure 2, Table 5). The use of SD provided some protection against moisture loss in the 0–30 cm soil layer in 2018, which became apparent in July. At the highest SD rate of fertilization N170, the moisture content in the 0–30 cm soil layer at the sampling time in July was 19% (in relative values) higher than that in the unfertilized control treatment (Figure 2). This suggests that higher levels of dry matter and organic matter in SD compared to LD affect soil moisture retention. The direct effect of ploughing on soil moisture losses in dry years has been confirmed in other studies [48]. This is important for Fluvisol, especially in the context of maintaining stable organic compounds and promoting humification processes [44].

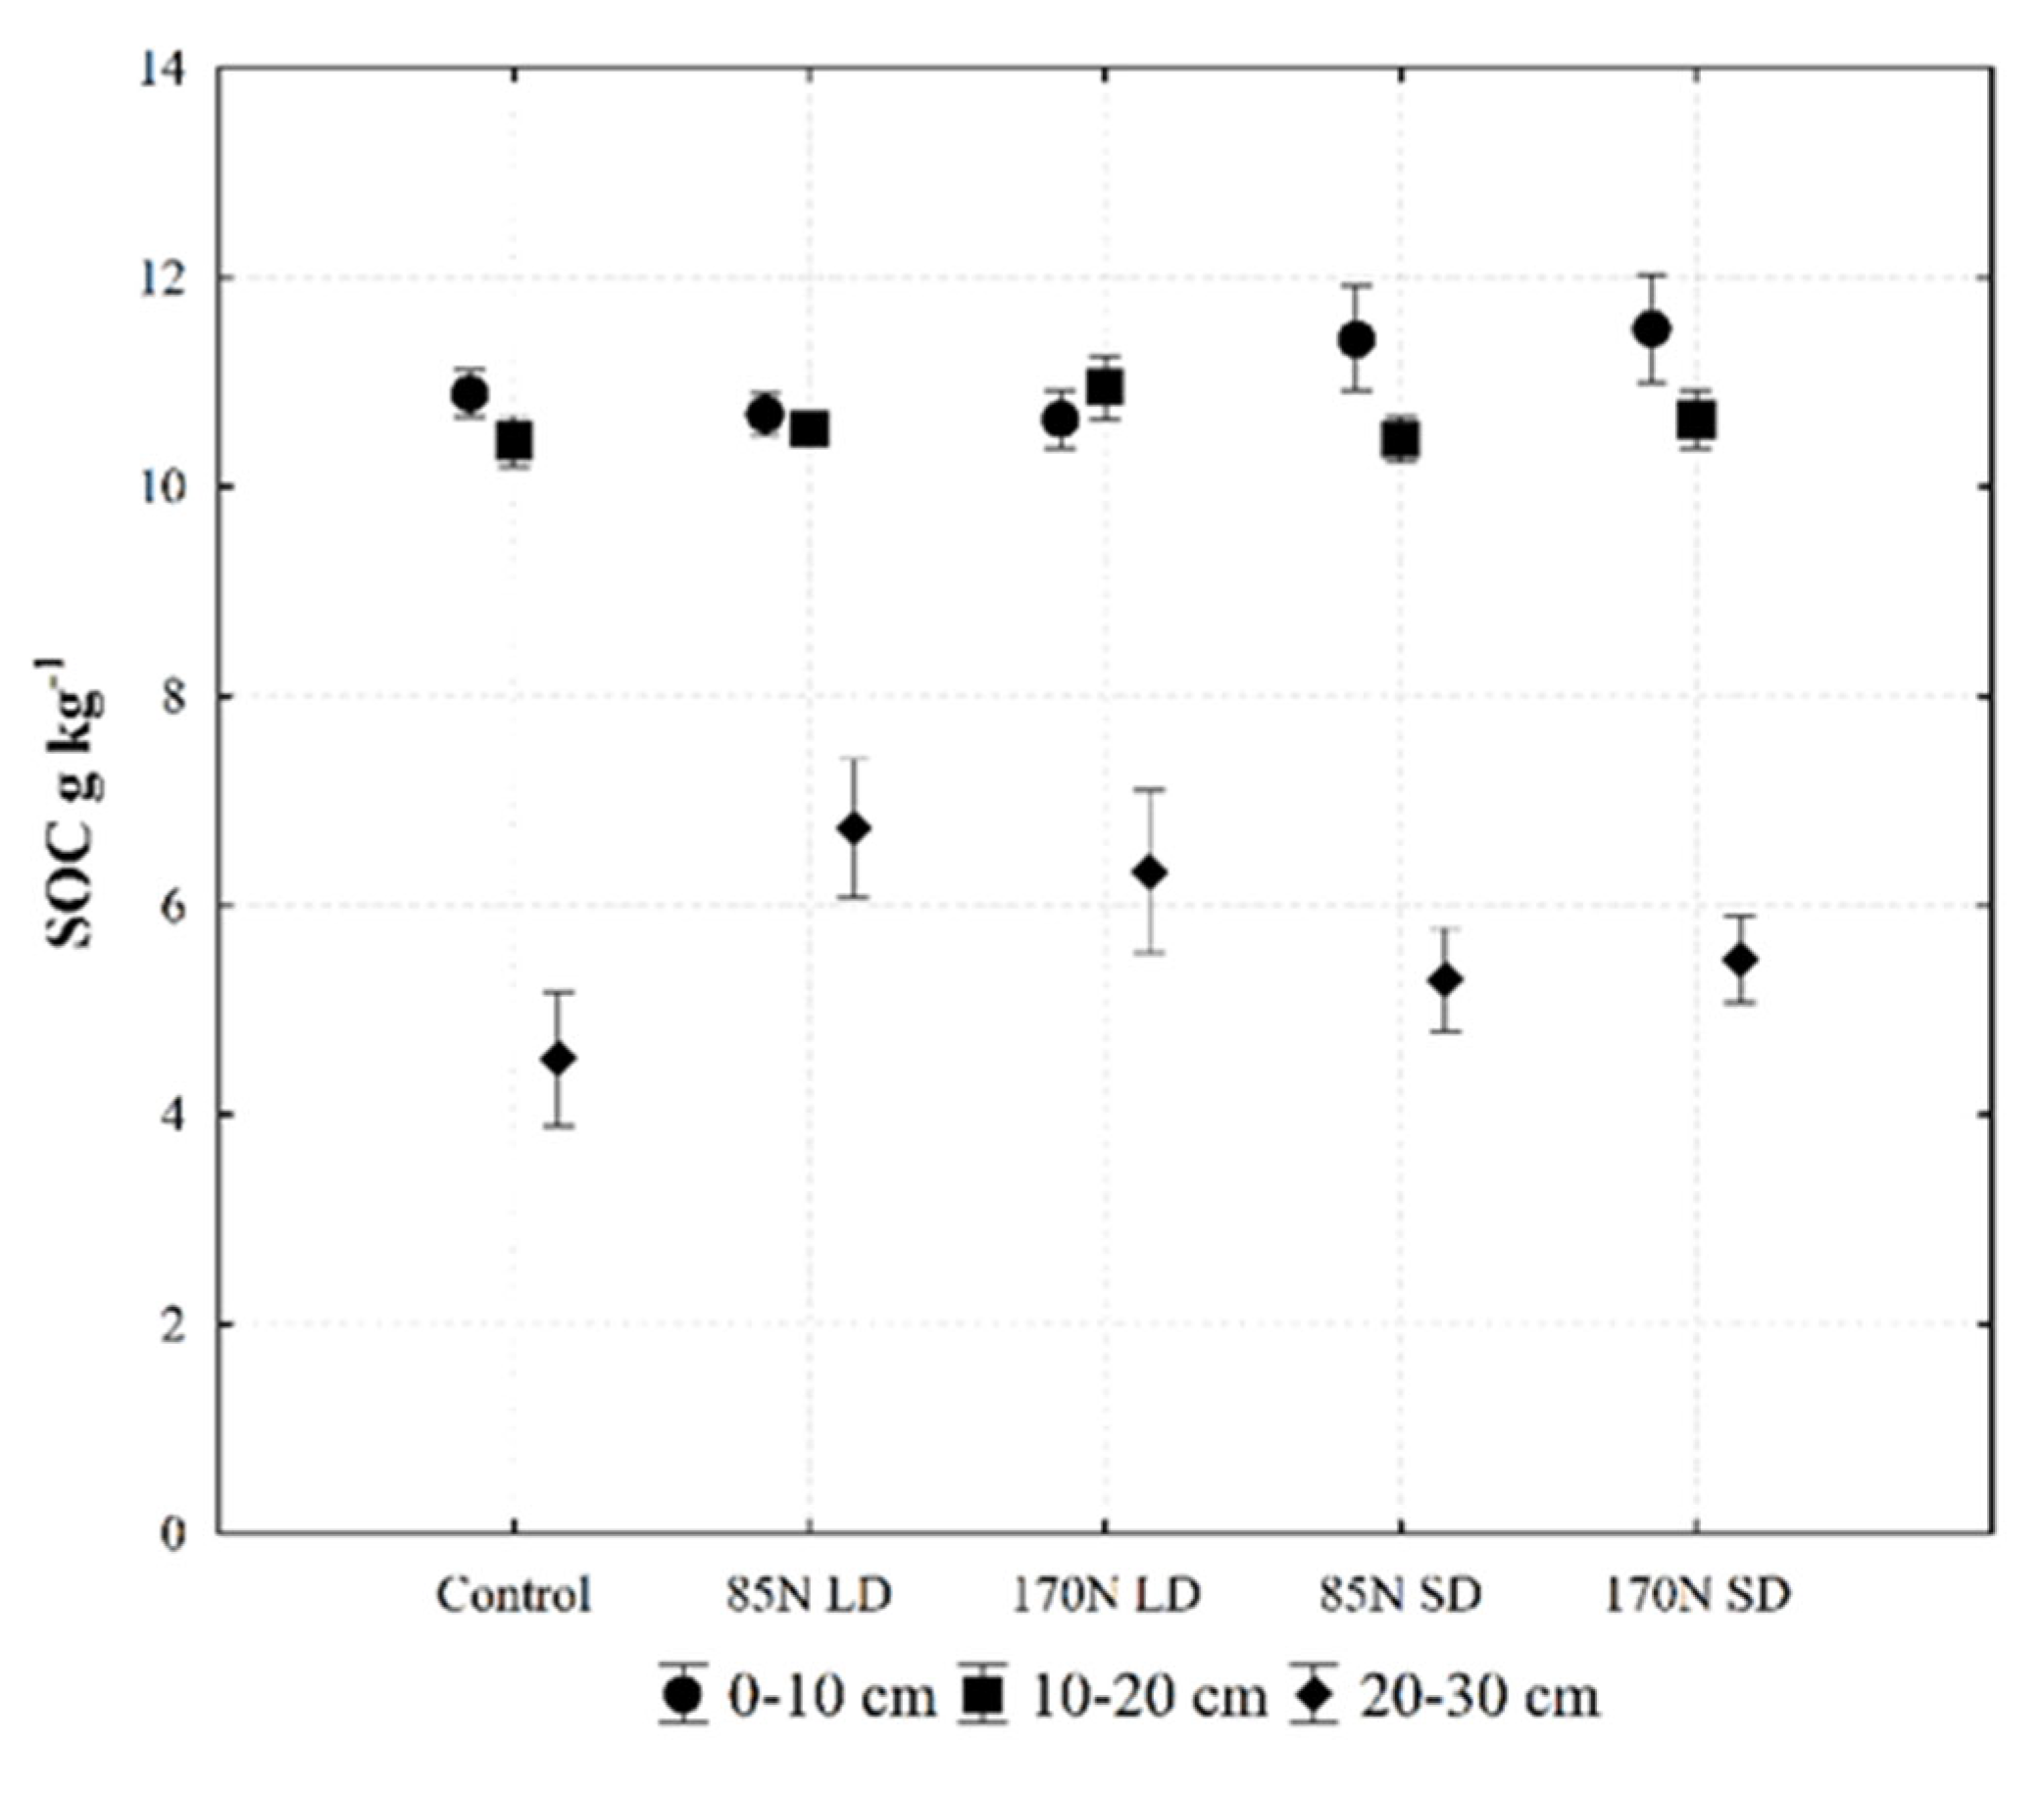
3.4. Soil Organic Carbon (SOC)

A generally accepted technique to prevent desertification and soil degradation and to guarantee food security in a changing climate is managing SOC through sustainable agricultural and land use practices [49]. Summarized data from Fluvisol profile analysis show that such soils have slightly lower than average SOC contents in the topsoil (16 g kg−1) and the subsoil (12 g kg−1) [28]. In our study, the SOC content in Fluvisol at the beginning of the experiment was low in the topsoil in different layers of the Ah horizon (Ahp-Ah-Ahk) (Figure 1)—14.4, 12.4 and 1.7 g kg−1, respectively (Table 1). Our data show that the significantly higher SOC concentration in the investigated soil layer (0–30 cm) occurred in the treatment fertilized with 170 N rate of both digestates, and only a tendency of increasing SOC concentration was evident under other rates of fertilization (Table 6, Figure 3). It should be noted that the study year and soil layer also influenced the SOC content [50]. In previous studies, LD and SD had different effects on non-fertile soil [4,11].
The digestates can be distinguished based on their DM contents [6]: LD contains less than 15% DM and SD more than 15% DM. Assessing the effect of fertilization on the SOC content, we found that fertilization with SD, which was rich in dry matter (DM) (26.5 and 28.4 g kg−1 in 2018 and 2019, respectively) and organic matter (87 to 88 g kg−1), most significantly increased SOC concentration in the upper 0–10 cm layer (Table 6, Figure 3). Both rates of LD fertilization (85 N and 170 N) did not significantly increase the SOC content in the 0–10 cm layer. Increasing the LD fertilization rate from 85 N to 170 N reduced the difference in SOC content between the 0–10 and 10–20 cm layers compared to fertilization in SD, where SOC stratification occurred. An obvious difference in SOC content was also observed between fertilization with LD and SD in the 20–30-cm layer (Figure 3). Compared to the control treatment, significant differences in SOC accumulation were recorded in the 20–30 cm layer under LD fertilization and in the 0–10 cm layer under SD fertilization.
The history of the experimental site shows that the floodplains have been under water in the past, and the area is currently affected by amelioration and natural drainage. As shown by Mayer et al. [29,51], when the aim is to increase SOC resources in Fluvisols, it is necessary to maintain optimal soil moisture. However, dry weather prevailed during the experiment, which was not favorable for the accumulation of SOC and SOM in Fluvisol.
As mentioned earlier, the main factors determining SOC content were soil layer and year. Similarly, in a study by Barlóg et al. [52], year was the main factor determining SOC accumulation. Our study shows that soil depth also had a significant effect on SOC (Table 3 and Table 6). We observed a clear SOC stratification in the soil: most of the SOC was accumulated in the 0–10 and 10–20 cm layers (Figure 3), and the use of LD caused an increase in SOC in the 10–20 cm soil layer. The effect of fertilization on the increase in SOC compared to the control was even observed in the 20–30 cm layer. Summarizing the changes in SOC content in the Ah horizon, changes with fertilization were noticeable, albeit relatively small. This agrees with the findings of a previous study [53], where the incorporation of anaerobic digestate into the soil in a short-term experiment had little effect on SOC and total nitrogen (TN) accumulation.

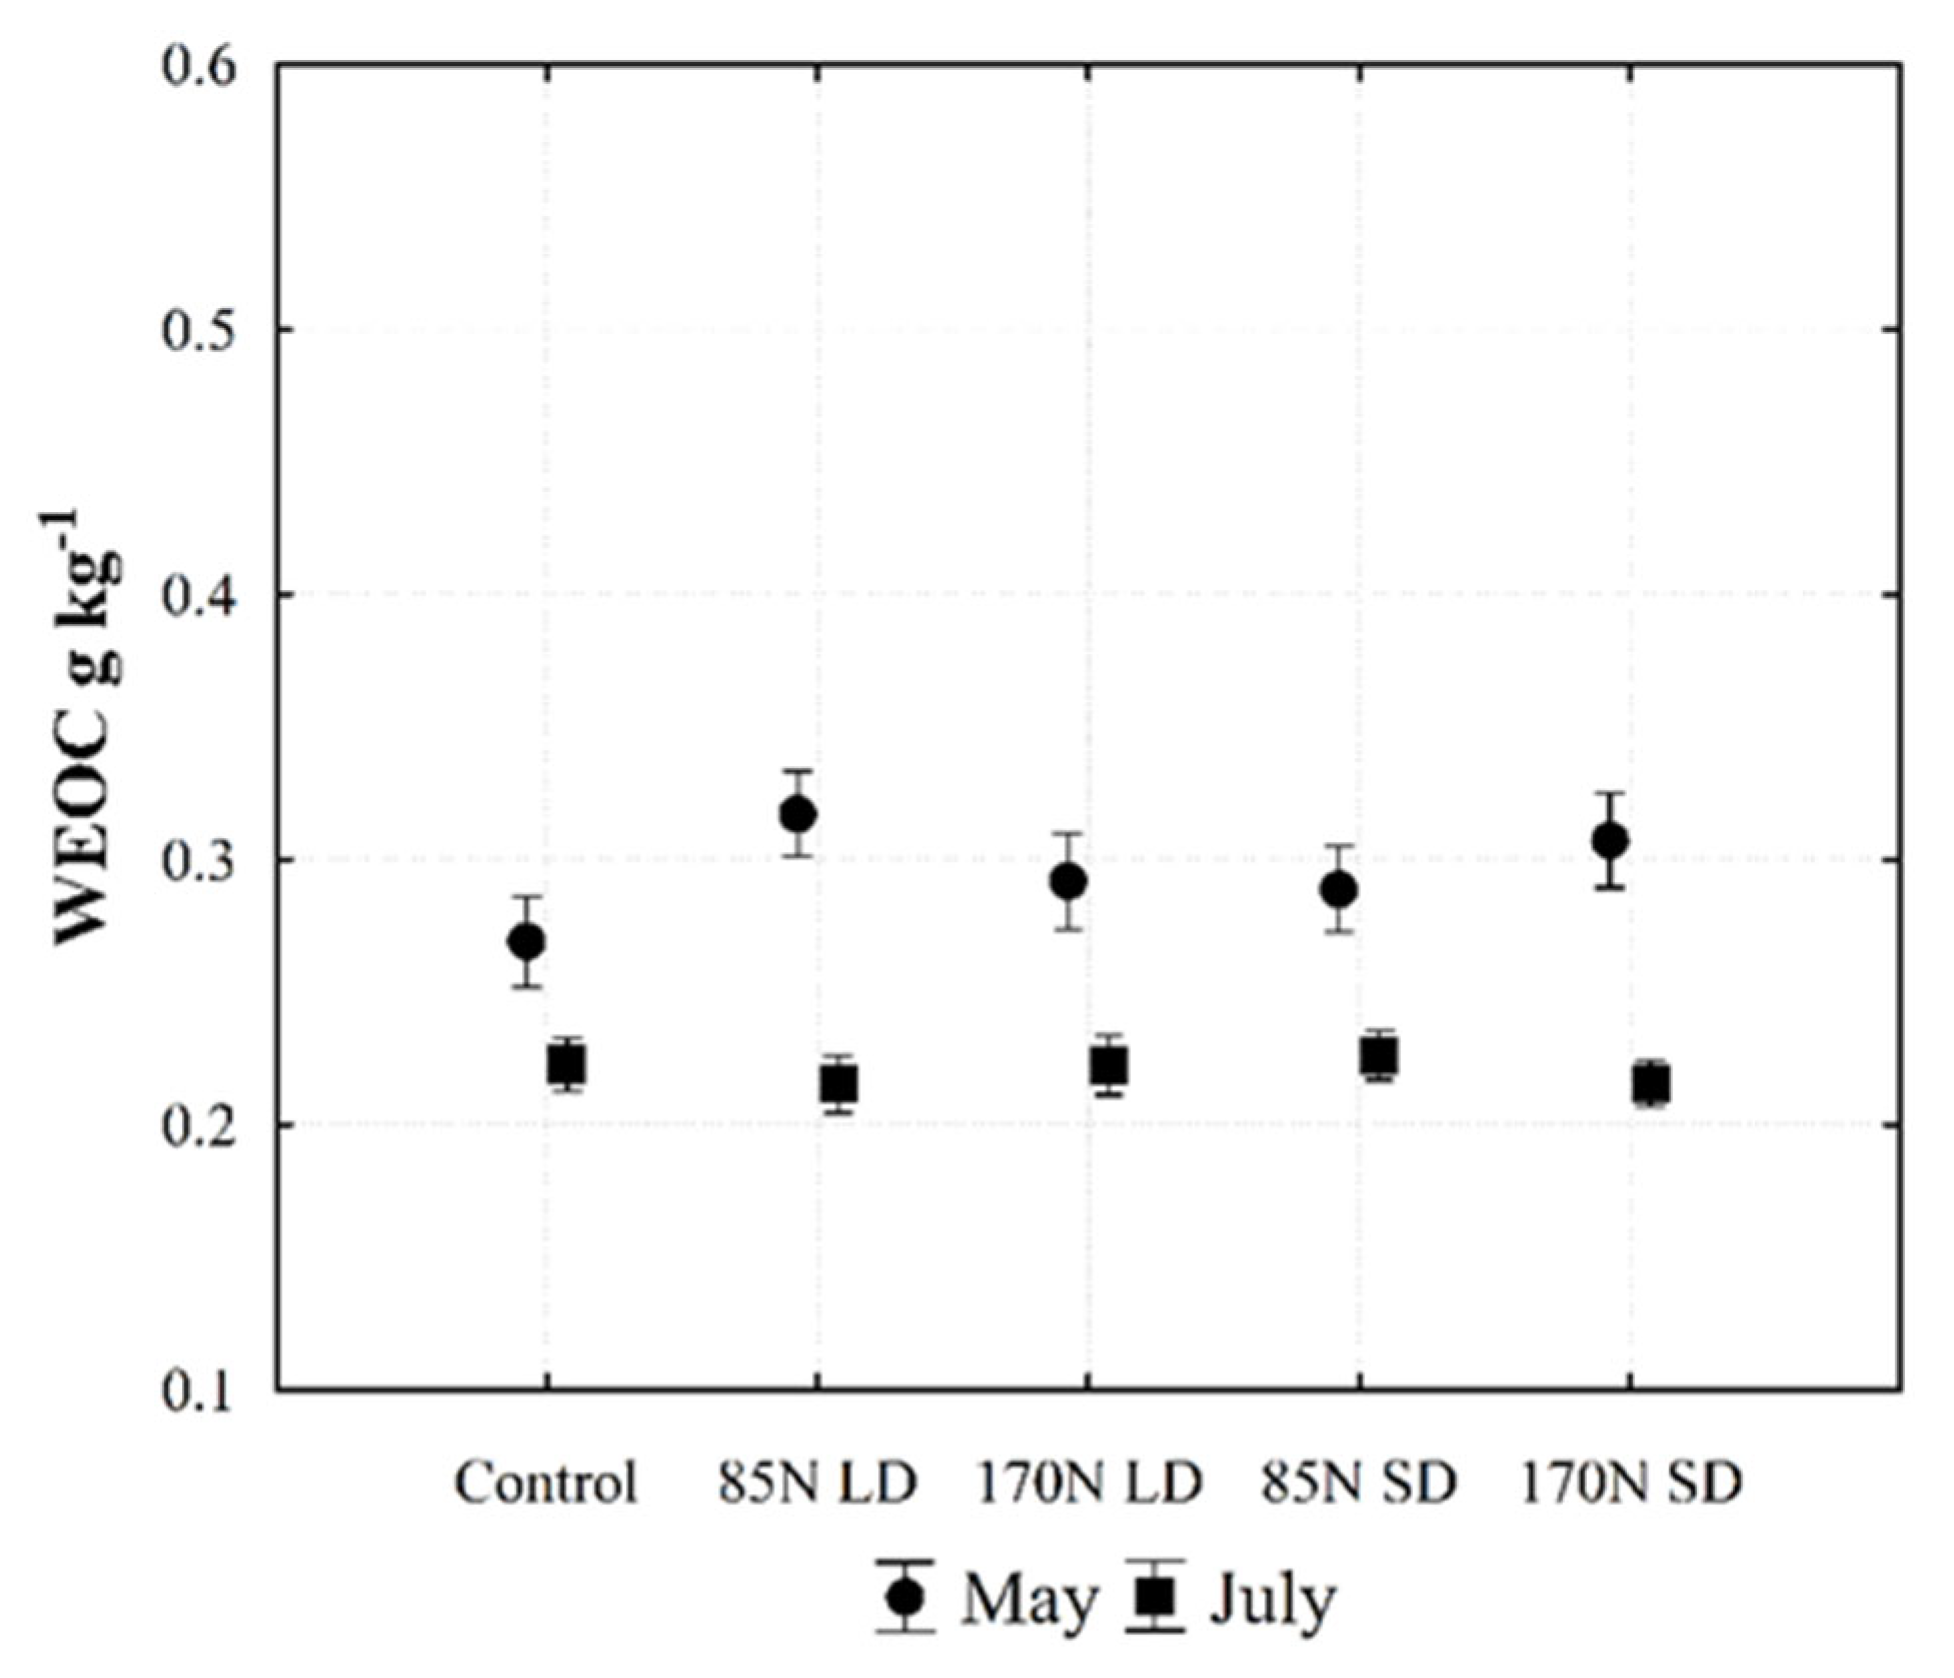
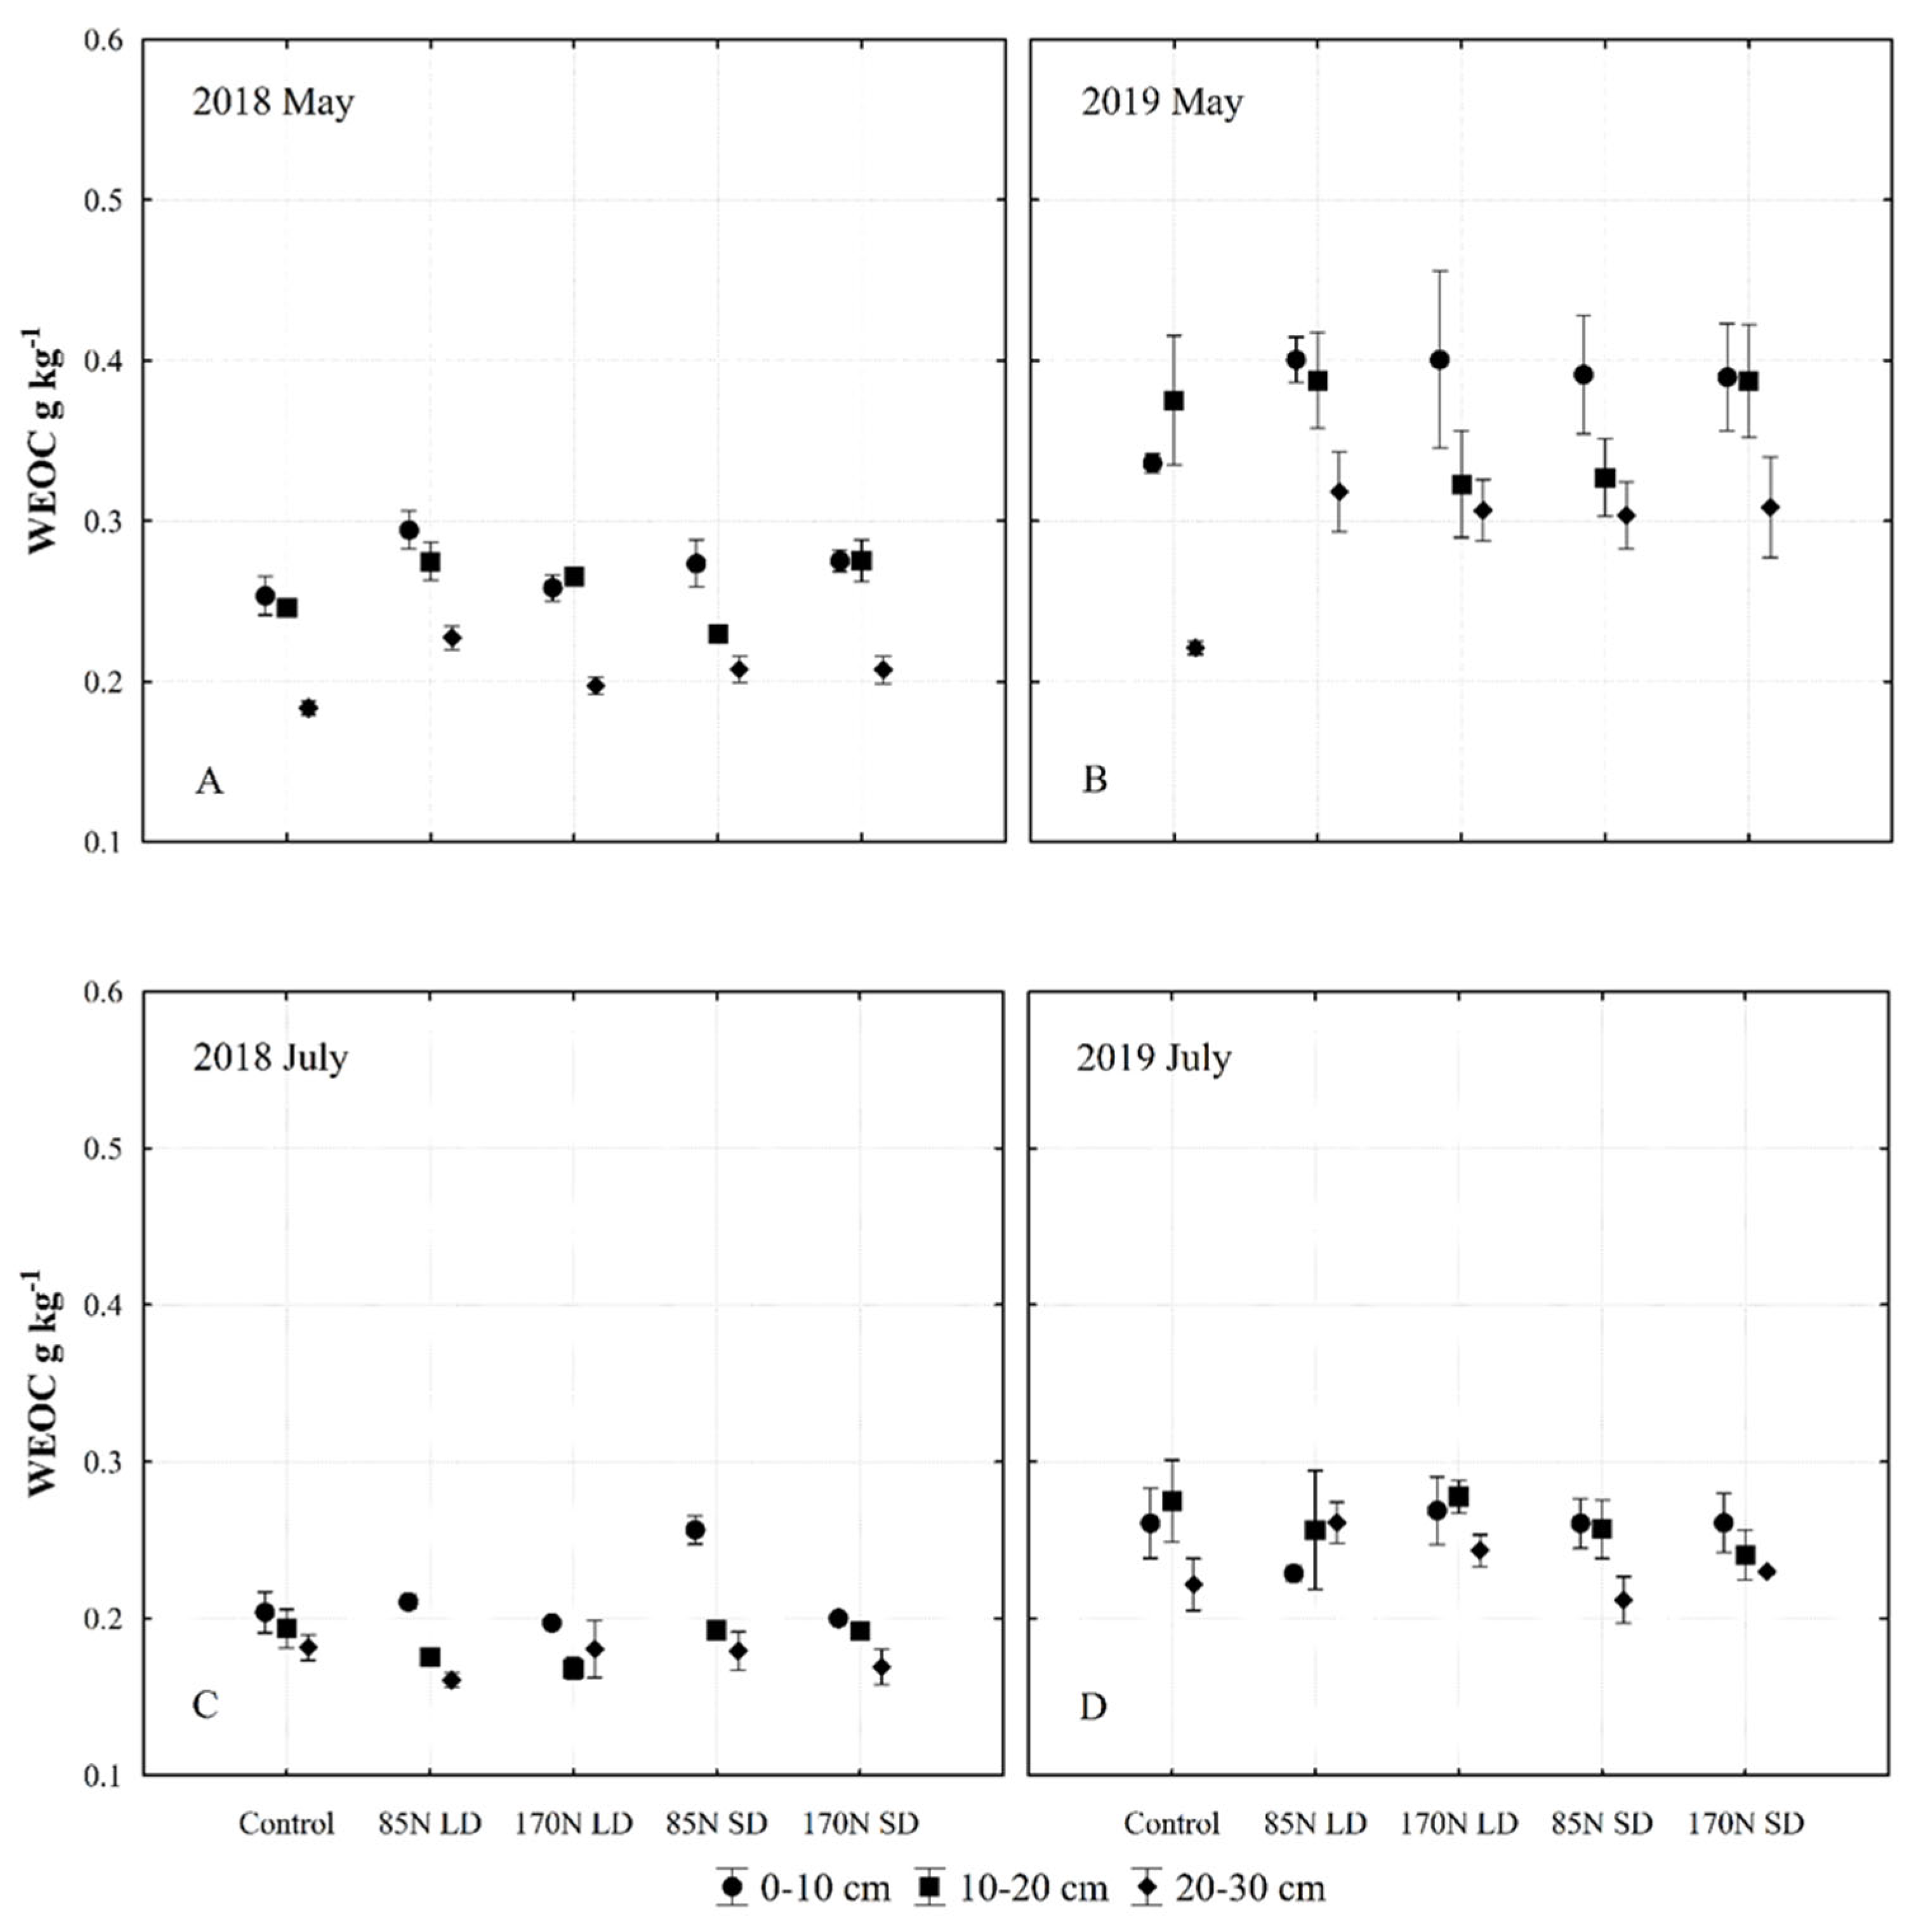
3.5. Water Extractable Organic Carbon (WEOC)

Water-extractable organic carbon is sensitive to soil management, including fertilization. It is generally regarded as the most labile fraction of SOM, whose significance in agriculture has long been acknowledged for its role in facilitating plant nutrient uptake and the activity of soil microbes [54]. In our study, year and sampling time significantly influenced the mobile forms of soil chemical parameters, including WEOC (Table 6, Figure 4). The content of WEOC in Fluvisol in the 0–30 cm layer in 2019 increased significantly compared to 2018. According to Monard et al. [55], the amount of dissolved organic carbon in the soil increases instantly after the application of slurry. Similarly, we show that fertilization with LD and SD results in changes in topsoil WEOC, and the highest content of WEOC was found in the 0–10 cm layer (Figure 5A–D). According to Zhang et al. [54], WEOC and nitrogen in the soil tend to increase over time, mostly in the 0–5 cm layer. In our study, year and sampling time significantly influenced WEOC levels; our results show that the soil samples taken in May, after fertilization with different phases and rates of digestate, had significantly more labile WEOC compared to the control without fertilizer (Table 6, Figure 4). The WEOC content in fertilized soil decreased significantly in July after the harvest (Figure 5C,D), with concentrations approaching those of unfertilized soil.

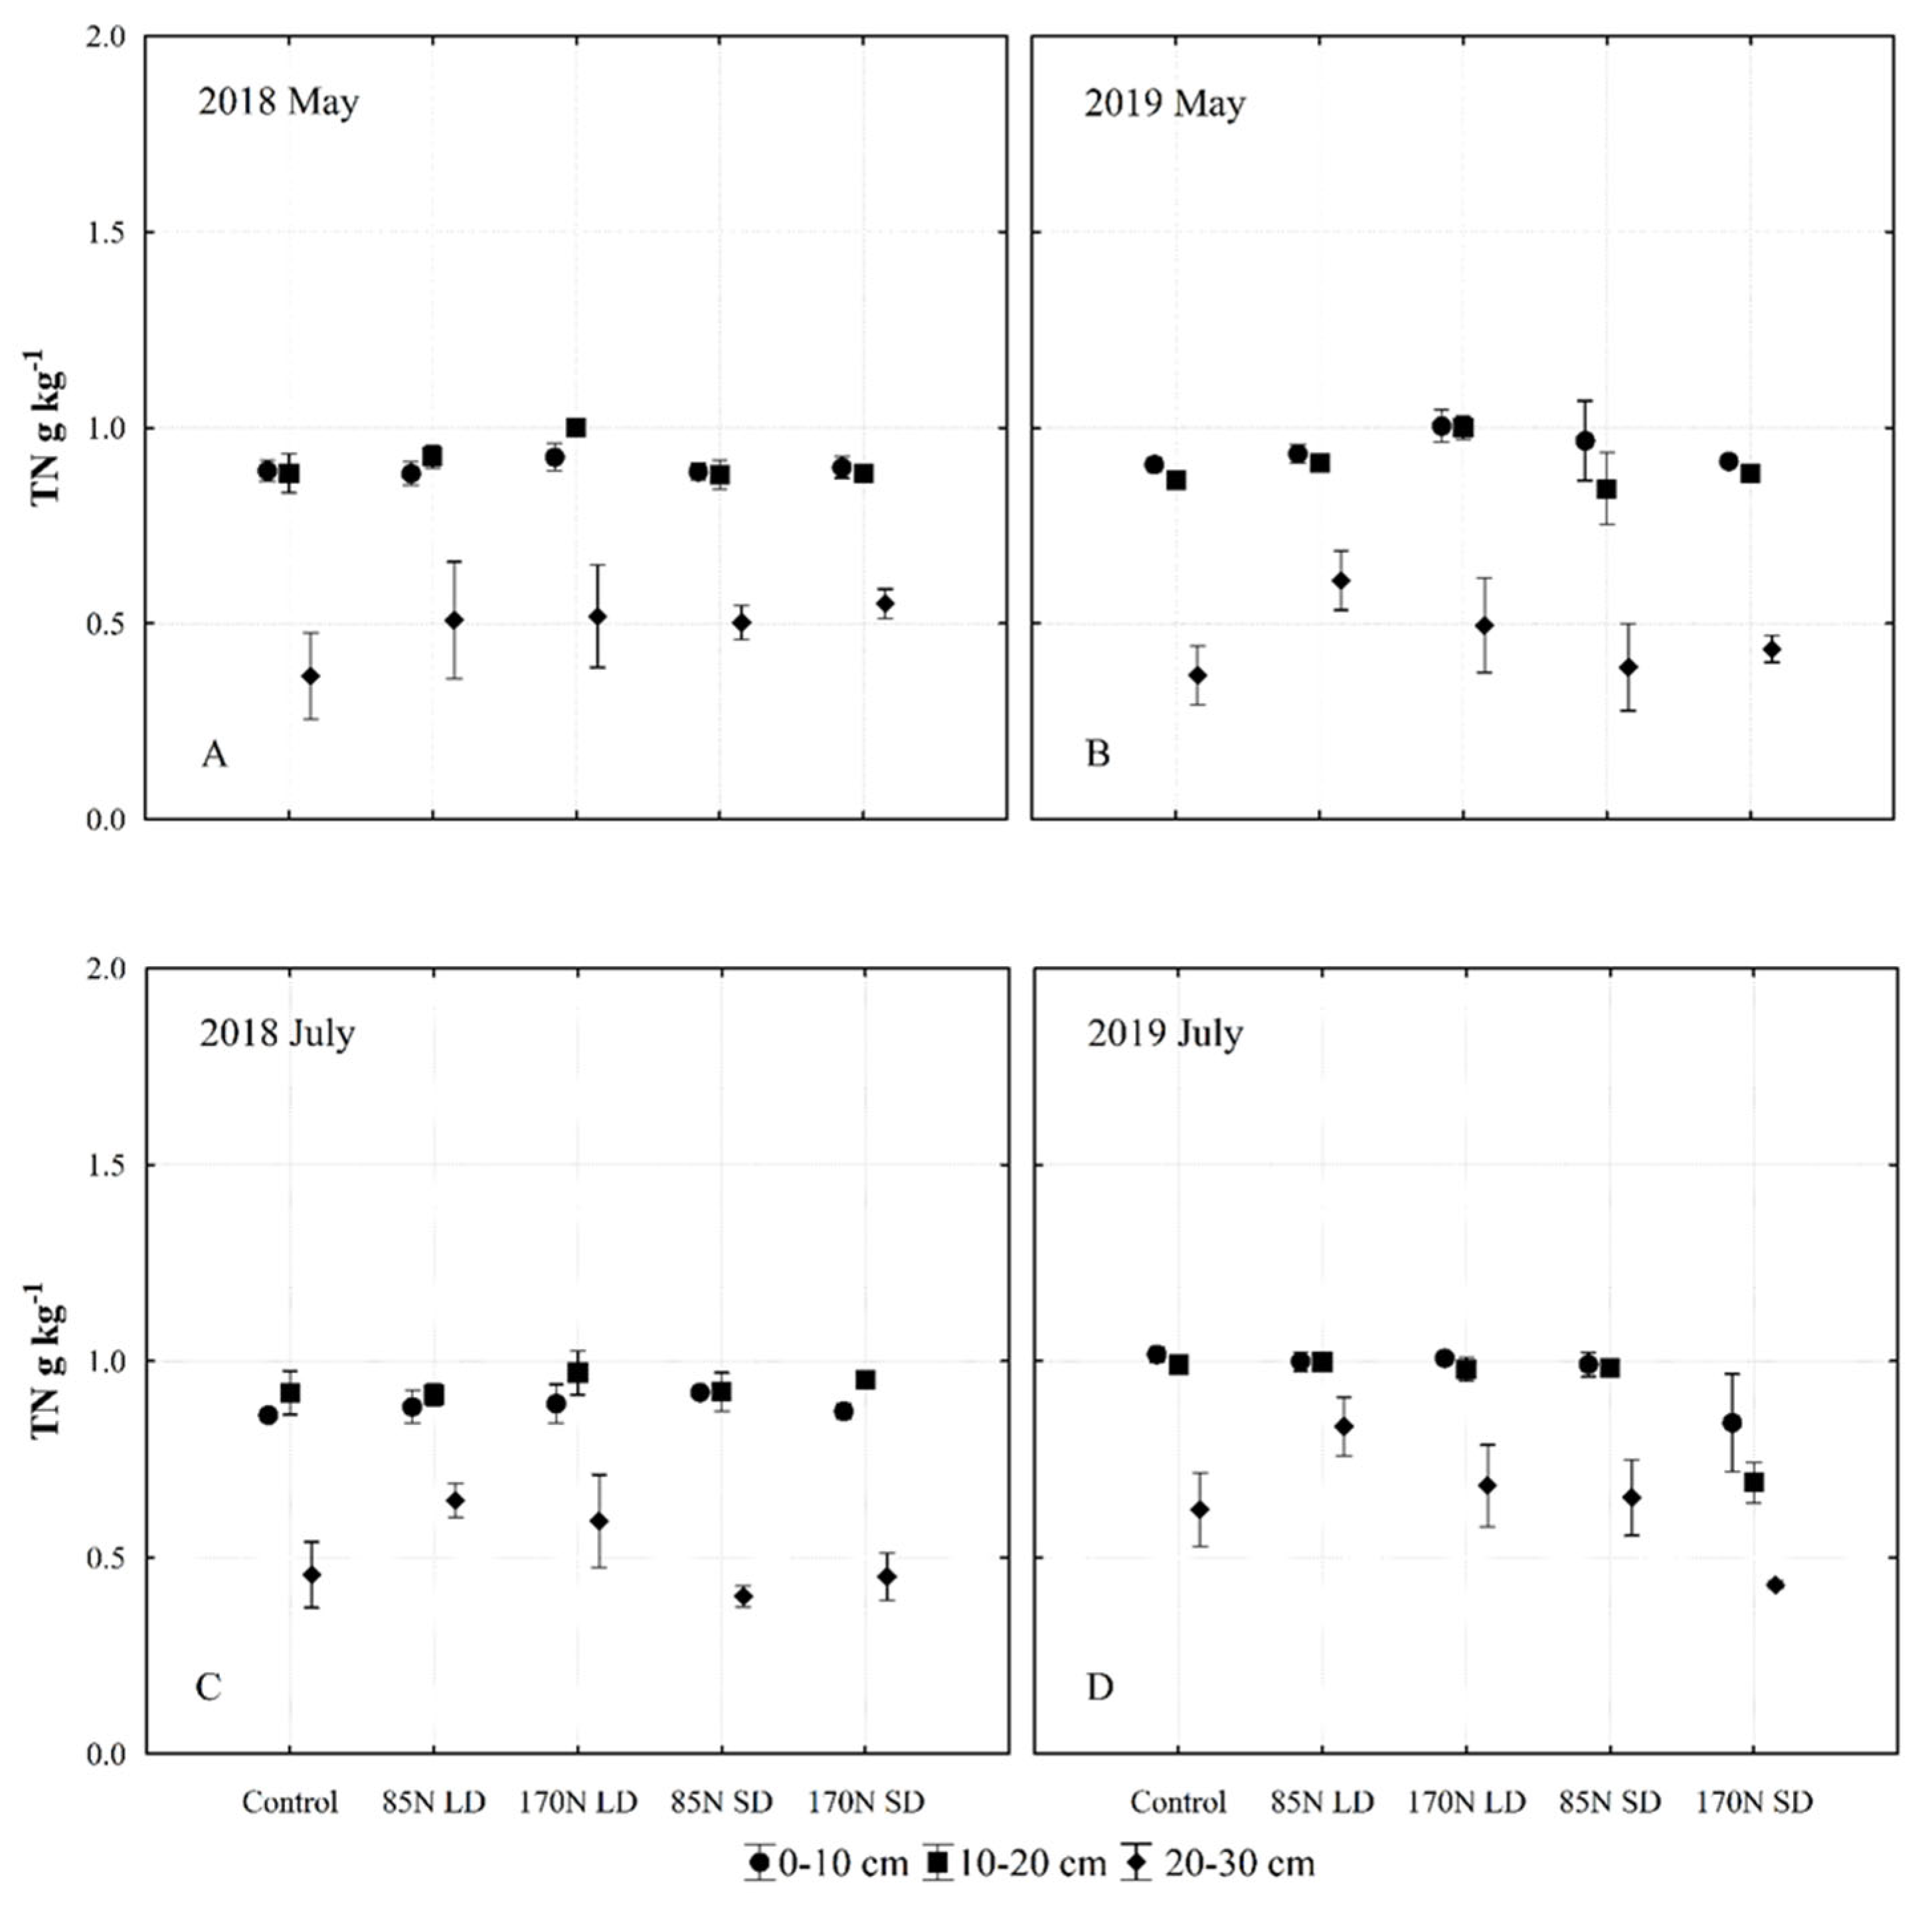
3.6. Total Nitrogen (TN)

Fertilization was one of the factors that affected the amount of TN in the soil, but the largest part of the variance in the amount of TN was determined by soil layer (Table 3). The concentration of TN in the soil was relatively low prior to the experiment (1.07 g kg−1 TN in 0–30 cm soil layer) (Table 1). Assessing the TN concentration in the investigated 0–30 cm soil layer, we observed a higher concentration under LD fertilization; the same pattern was found in both years of the experiment (Figure 6).
Our data show a clear stratification of TN in the soil: most of the TN was accumulated in the top 0–10 and 10–20 cm layers. Under SD fertilization, the TN concentration decreased most significantly in the 20–30 cm layer during the two months of the vegetation season. A possible reason for this decrease is that most of the nitrogen in the organic form remained unmineralized in the top layer, and therefore did not migrate to deeper layers (Figure 7).

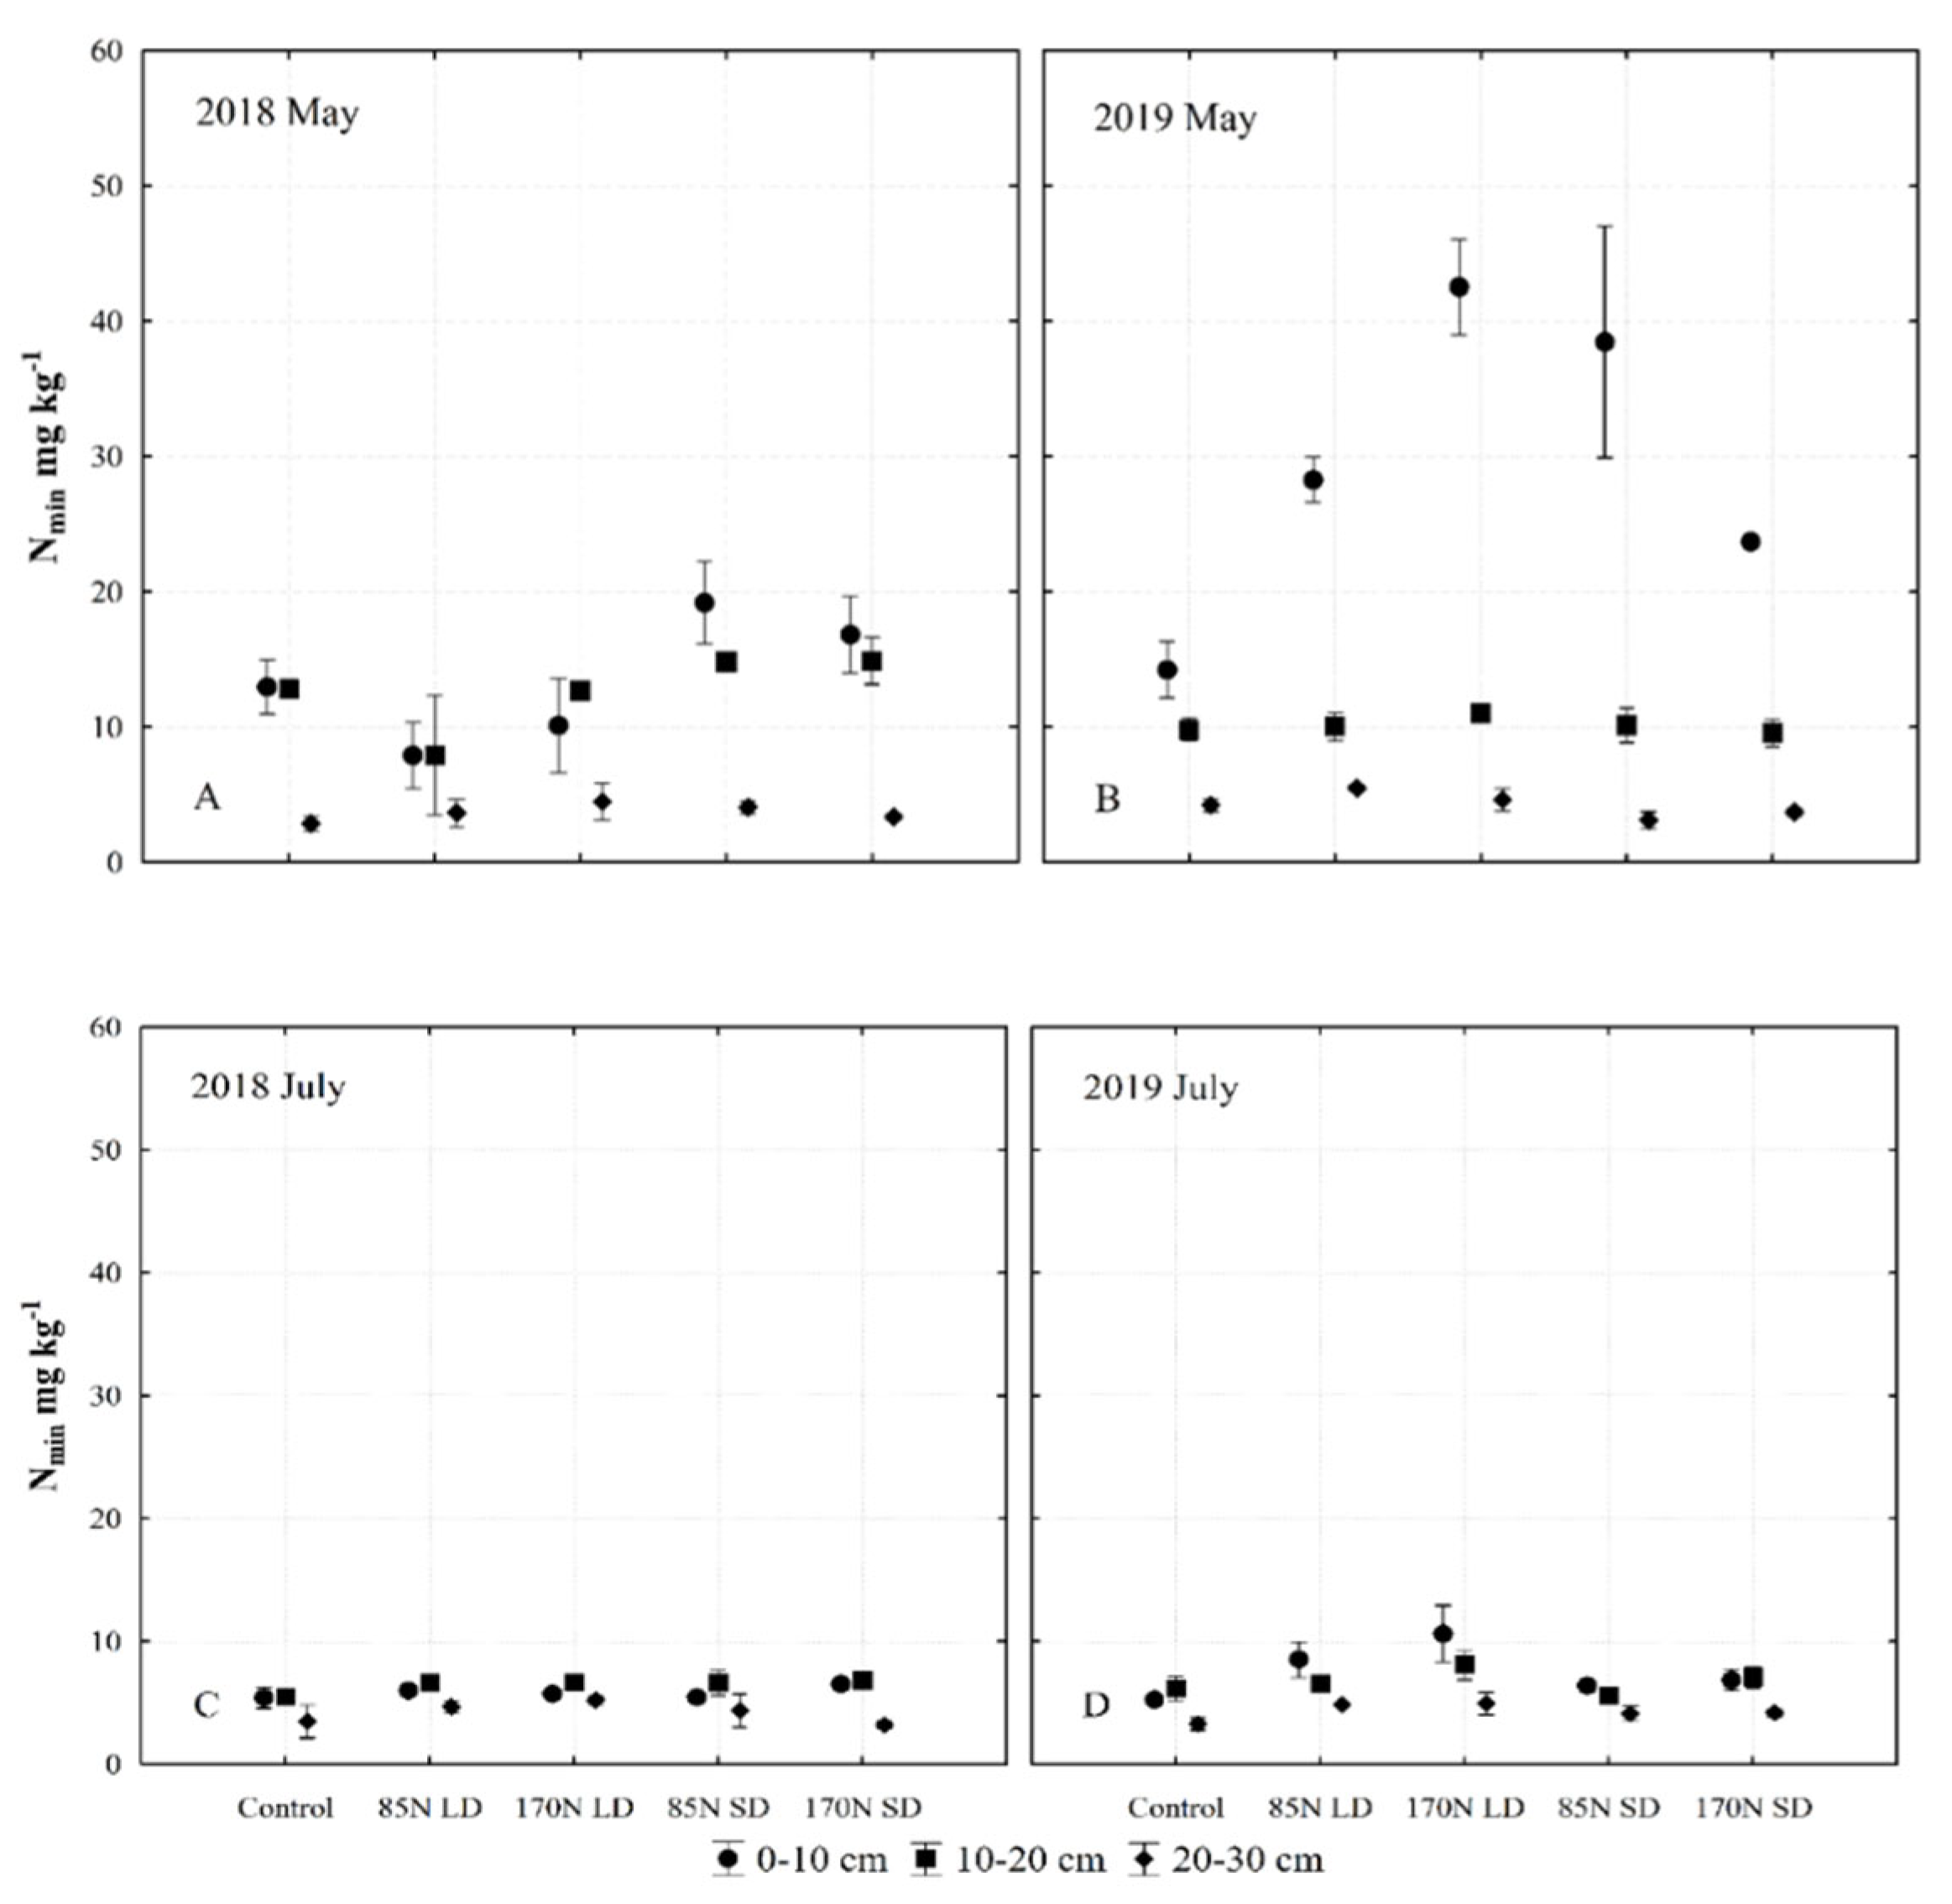
3.7. Mineral Nitrogen (Nmin)

Table 3 shows that fertilization as a single factor significantly influenced mineral nitrogen (Nmin) as well as TN. The soil layer also significantly affected the amount of nitrogen available to plants (Nmin). LD and SD fertilization influences the concentration of Nmin in the topsoil, and the highest differences were found in the 0–10 cm layer (Figure 8). At the 10–20 cm layer, the effect of fertilization on Nmin concentration was negligible during the study, and significantly higher in May in the second year of the study compared to the first year of the experiment. Sampling time significantly affected the Nmin changes.
In the second year of the experiment (2019), the concentration of Nmin in May in the upper 0–10 cm layer of fertilized soil was significantly higher compared to that of unfertilized soil. During the vegetation period, Nmin was used for plant growth over approximately 2 months and was otherwise transformed. In both experimental years, in July, the concentration of Nmin in the 0–30 cm soil layer was almost equal to that of the unfertilized soil (Figure 8C,D).

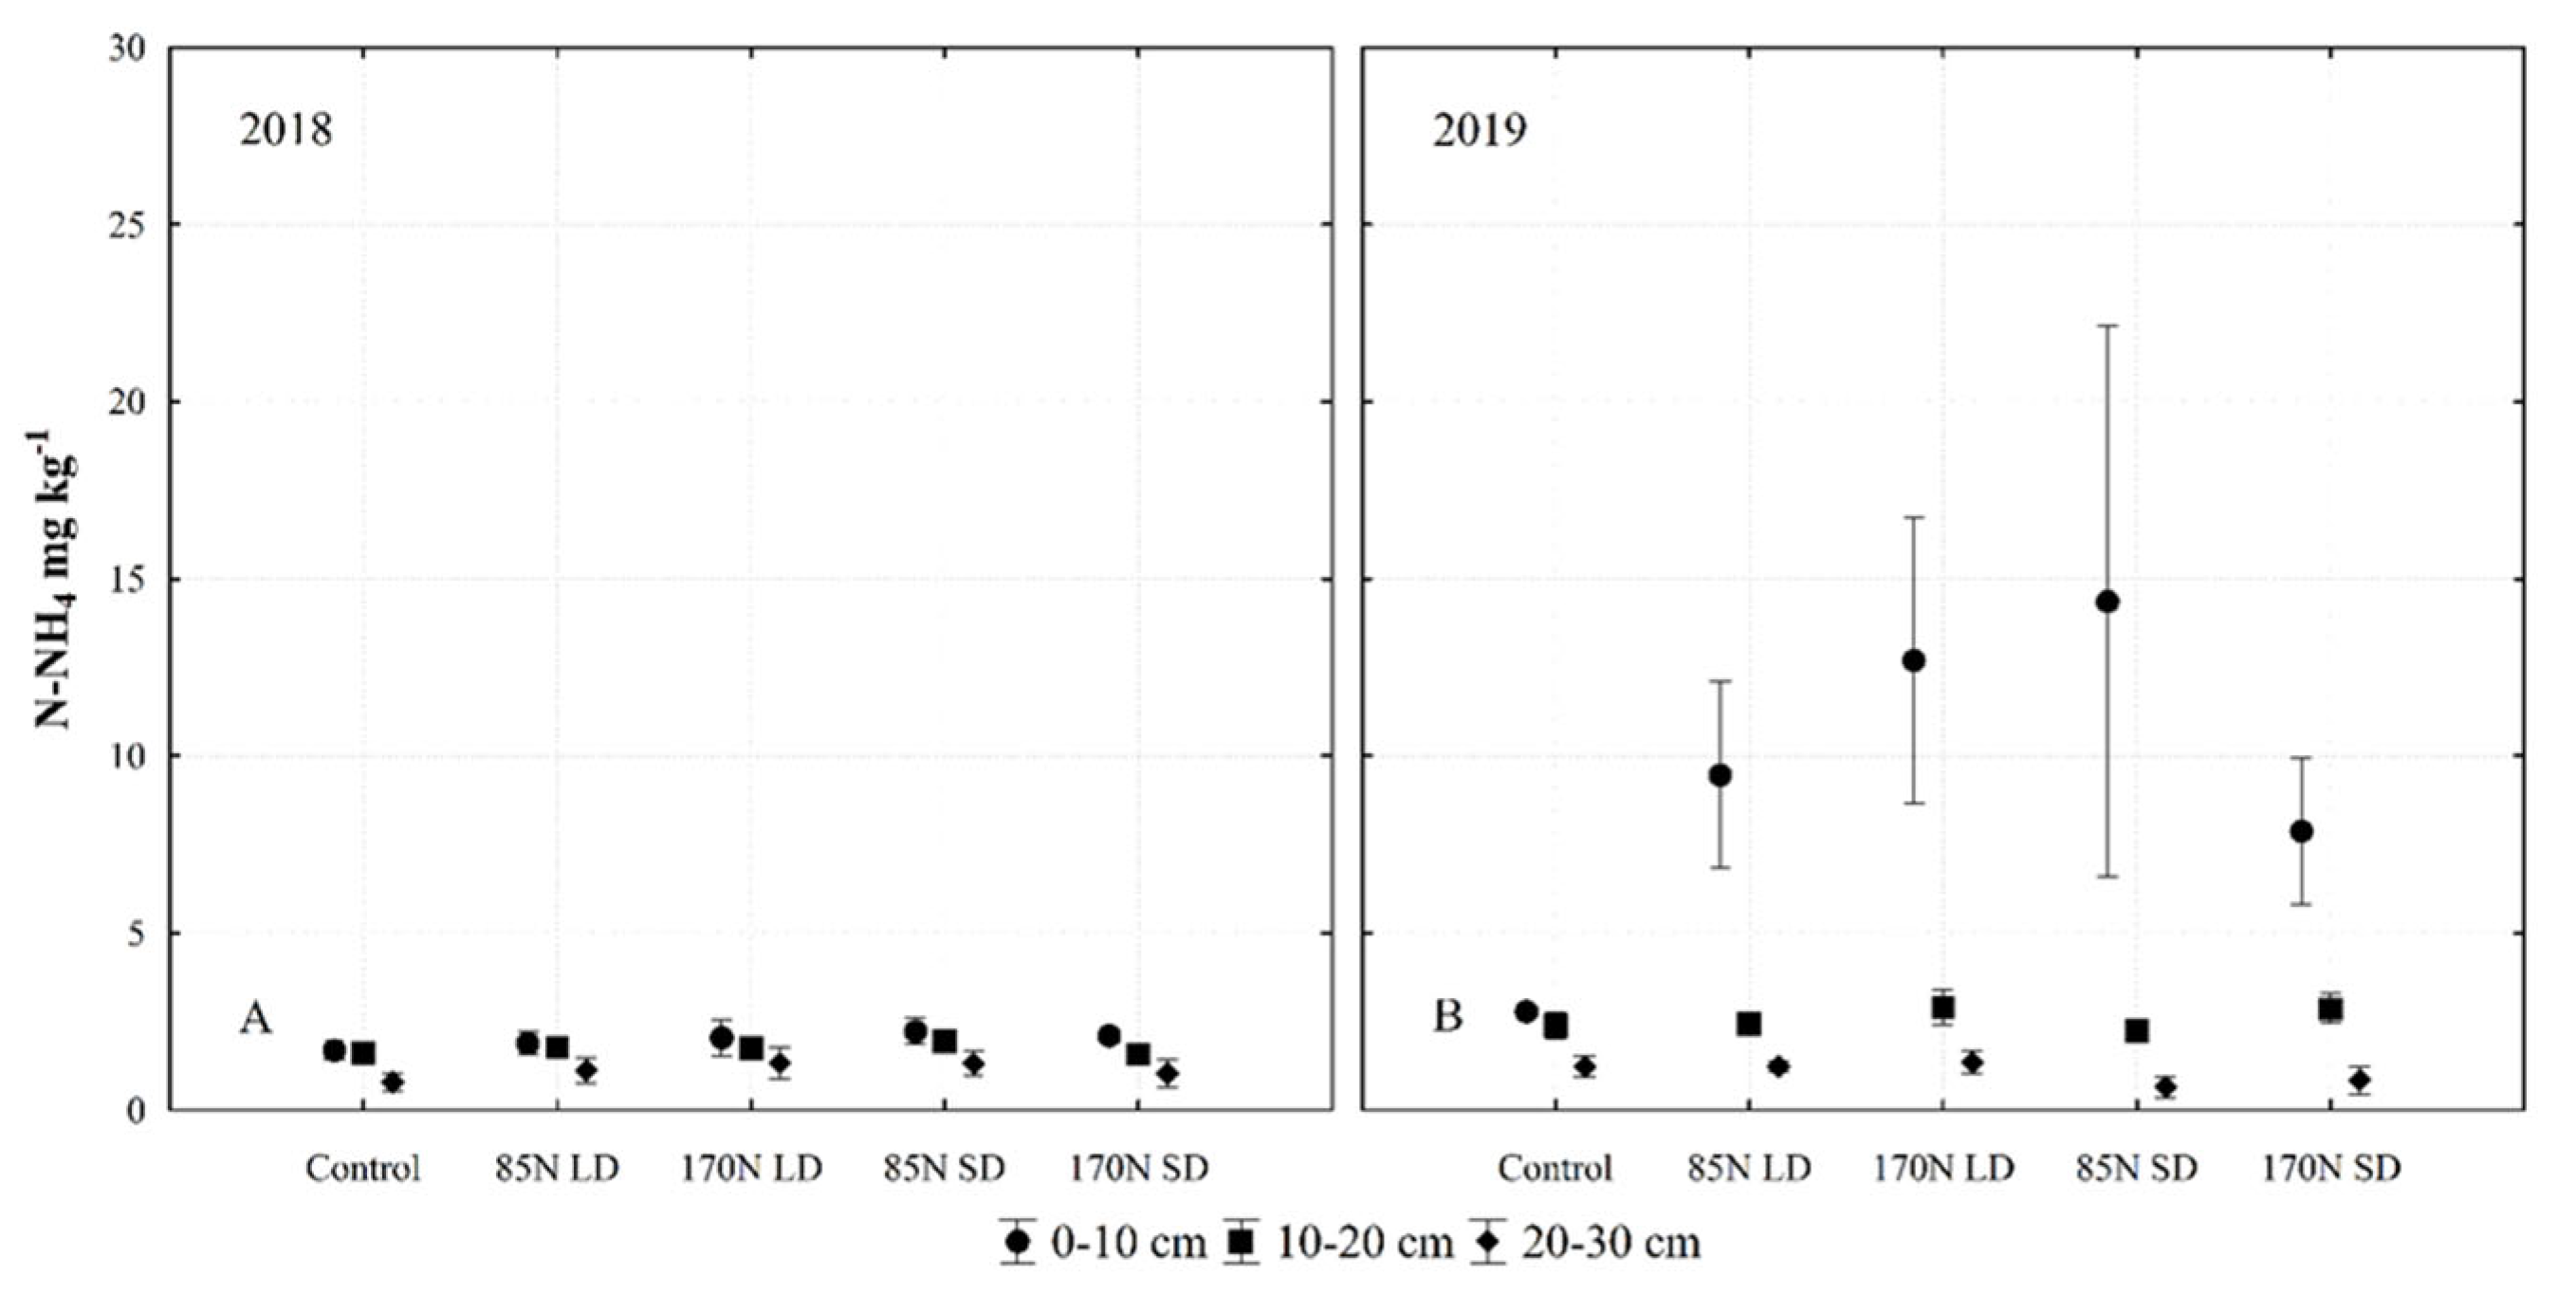
3.8. Soil Ammonium Nitrogen (N-NH4)

Our results confirm that the addition of SD and LD, obtained through anaerobic digestion of agricultural raw materials, supplies the soil with N-NH4 [37,56]. In Lithuania, crop yields correlate strongly with the soil Nmin amount measured in spring [57]. We found that fertilization with different LD and SD concentrations resulted in differences in N-NH4 contents in different soil layers (Figure 9).
According to the data on the chemical composition of digestates (Table 4), N-NH4 predominates in the TN of LD, and the concentration of N-NH4 in LD was higher (1.07–1.31 g kg−1 FM) compared to that of SD with 0.48–0.60 g kg−1 FM; this is in agreement with previous findings [6,18]. However, most N-NH4 was accumulated in the 0–10 cm soil layer under SD. The N-NH4 content decreased more significantly in the 0–20 cm and 20–30 cm soil layers under SD fertilization compared with LD fertilization. These results indicate that when LD was used as a fertilizer, N-NH4 entered deeper soil layers than when SD was used (Figure 7). This was influenced by the water content of LD, which only has a DM concentration of 1.45–2.32 g kg−1. Sampling time significantly affected the N-NH4 levels, and the concentration of N-NH4 decreased by 55–61% in LD-fertilized soil over a 2-month period and by 39–73% in SD-fertilized soil compared to unfertilized soil, where the N-NH4 concentration decreased by less than 20%.

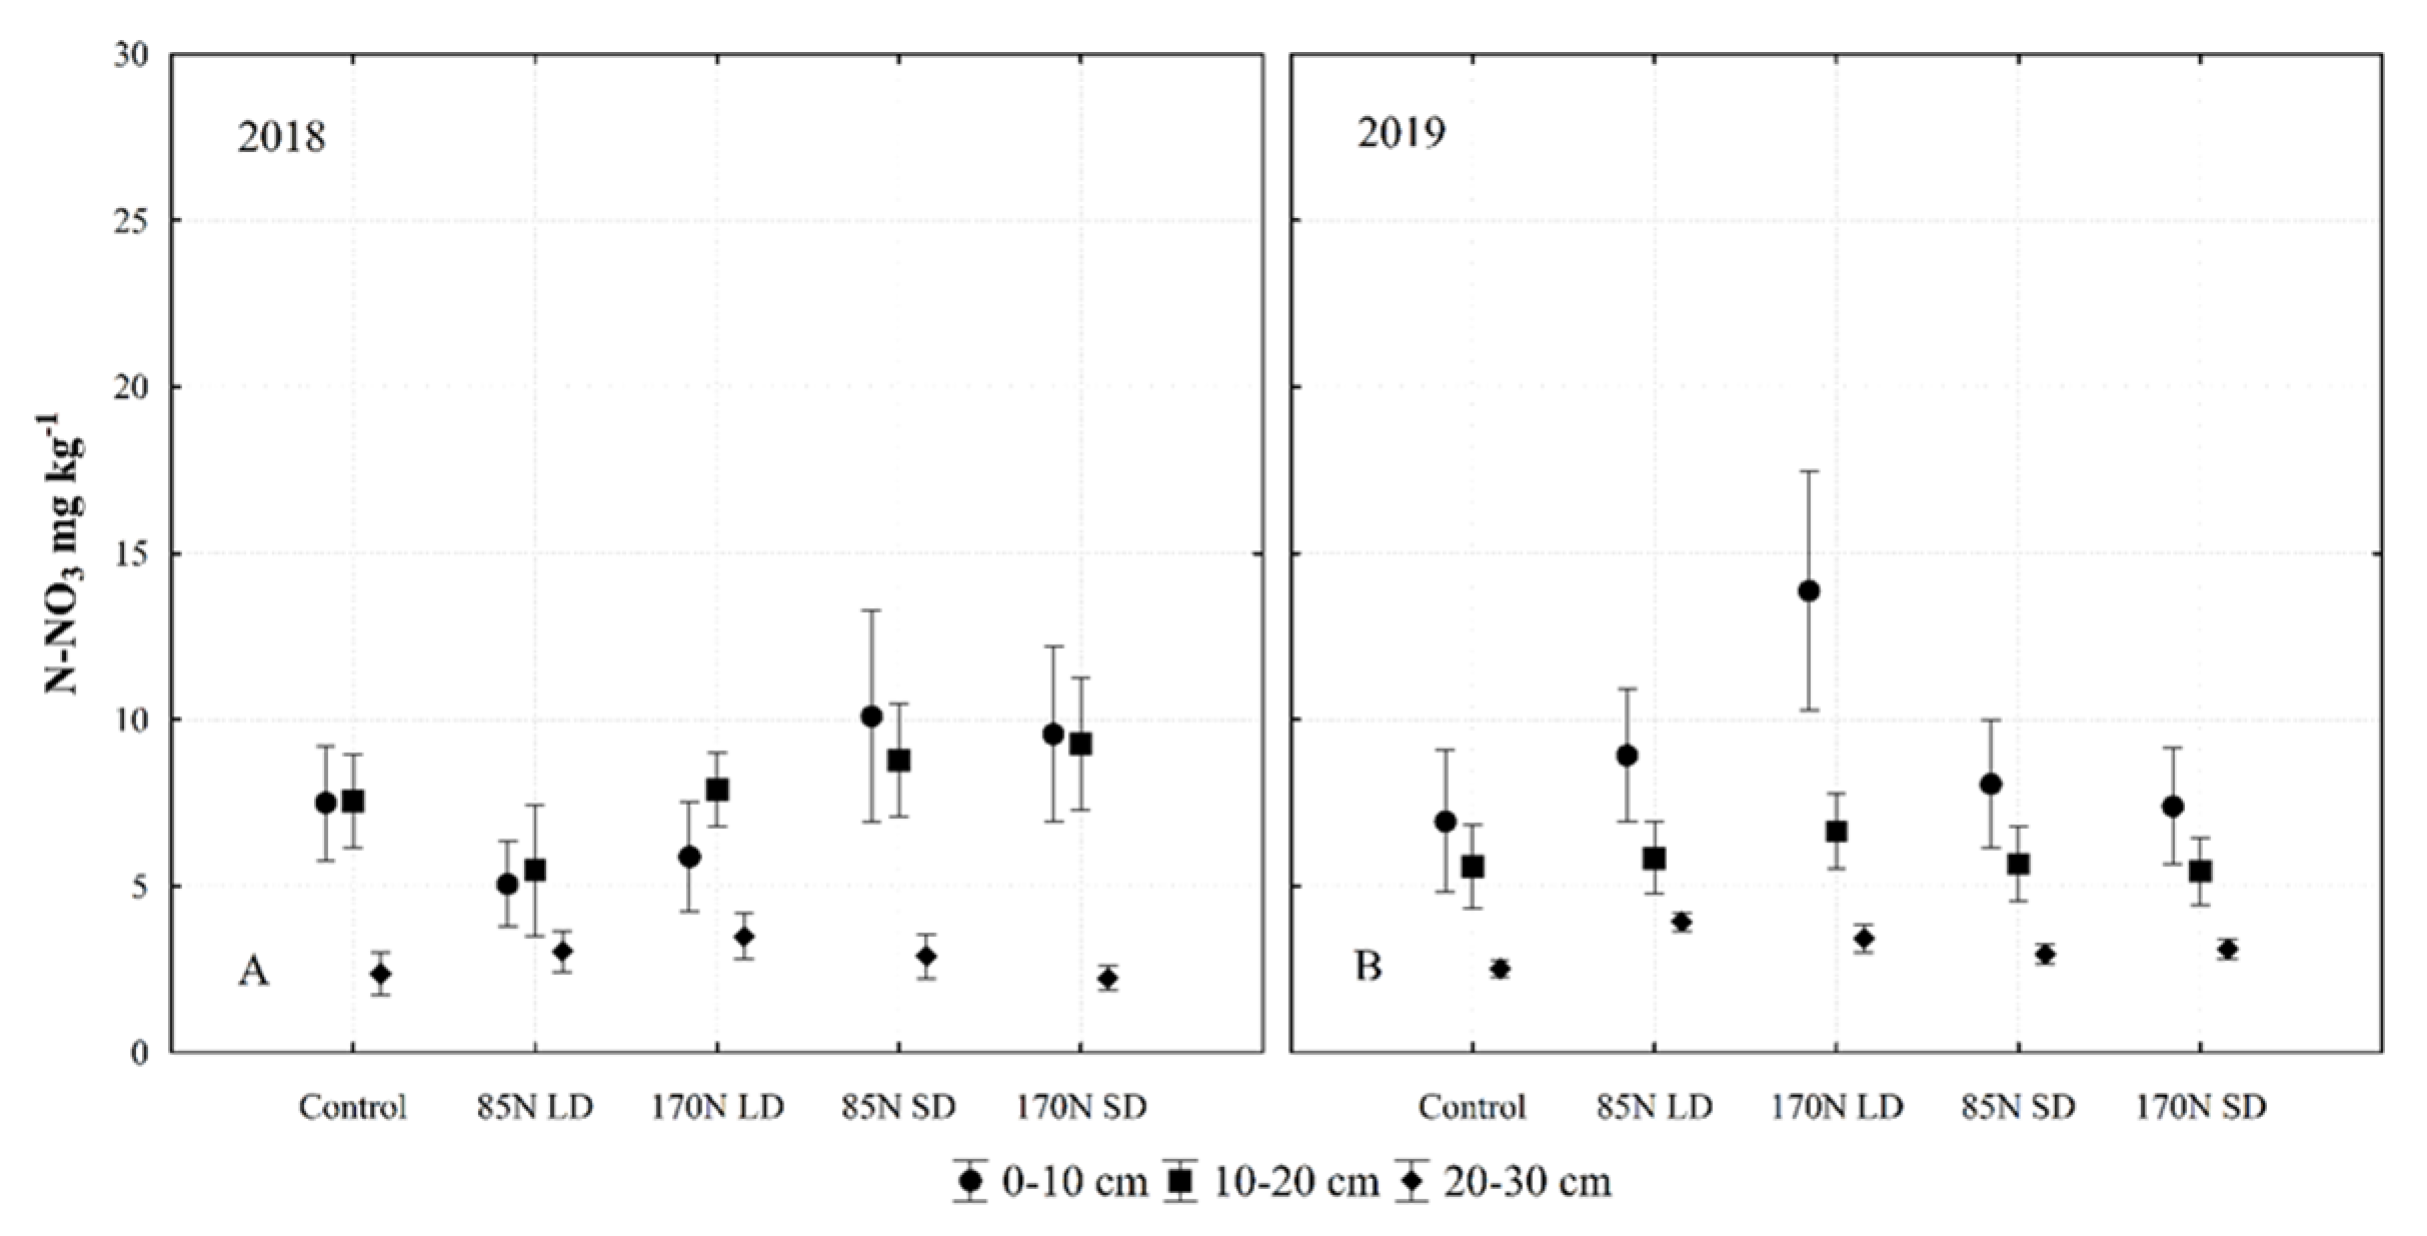
3.9. Soil Nitrate Nitrogen (N-NO3)

In our study, changes in soil N-NO3 were significantly influenced by interactions of year and layer, year and fertilization, as well as sampling time (Table 3). The addition of the anaerobic digestate supplies the soil with N-NH4, which can be transformed to the N-NO3 form during nitrification. Our data show that fertilization affects the concentration of N-NO3 in the soil. Fertilization with LD at the rate of 170 N resulted in the largest increase in N-NO3 in the 0–10 cm soil layer in the drier conditions in 2019 (Figure 10). The largest differences in N-NO3 concentrations were found in the 0–10 cm layer. The concentration of N-NO3 in the 20–30 cm soil layer was significantly lower than that in the 0–10 cm and 10–20 cm layers in both experimental years. In the second year, the N-NO3 concentration was more dependent on fertilization, and the highest N-NO3 concentration was determined after fertilization with an LD 170 N rate.

3.10. Digestate Recycling for the Utilization of Agricultural Waste Resources and Increasing Sustainability

In order to facilitate the utilization of the digestate streams in agriculture, various techniques for nutrient concentration have been assessed. To date, different techniques have been used for digestate treatment, which, depending on the objective, result in various levels of separation of nutrients or solids [58]. The most common technique applied is solid–liquid separation by a screw press, a filter press or centrifuge equipment [59]. Water removal from digestate streams increases the value of digestate. Furthermore, more concentrated digestates can be transported over longer distances in an economically feasible manner. Our research reveals possibilities for the valorization of digestates by a separation method. Firstly, we scientifically validated that separated digestates can enrich soil with SOC (Table 6, Figure 3). This is especially important in low-fertility soils such as Fluvisol. Secondly, the liquid fraction of the digestate after the mechanical separation contains mobile nutrients, including nitrogen, phosphorus and potassium, required by plants. In our field experiment with cereals, important short-term positive effects of digestates were found on the accumulation of mobile plant nutrient forms in the soil, and therefore they can be recommended to be used as bio-fertilizers for agricultural crops. Further research is needed to create a multi-stage digestate valorization system completely valorizing the digestate with the minimum impact on the capital and operational expenses of the process. Further valorization steps towards volume reduction can be taken, with evaporation under vacuum or membrane-based filtration being the most technically advanced ones [58]. Thermal treatment requires large quantities of heat [60] and membrane- based processes have the tendency to foul [61].

4. Conclusions

The study showed that the two phases of anaerobic digestate used in the field experiment as a bio-fertilizer differed in chemical composition and effect on the Fluvisol. The application of solid digestate (SD) increased soil organic carbon (SOC) content in the 0–10 cm layer; however, SOC did not reach the 20–30 cm layer. Liquid digestate (LD) increased SOC in the deeper layer. Total nitrogen accumulated in the 0–10 cm and 10–20 cm soil layers. Fertilization with LD and SD had a greater effect on mobile carbon and nitrogen forms in the soil than on their total amounts. The levels of mineral nitrogen (Nmin) and water-extractable organic carbon (WEOC) increased in the 0–10 cm soil layer immediately after fertilization with digestates of different phases. These mobile components of the soil were characterized by high variability during the growing season. Within the 2 months of the experiment, in the digestate-treated soil, the concentrations of the WEOC and Nmin decreased drastically, and were close to those of unfertilized soil. Fertilization with digestate is most efficient immediately after application, while the concentration of nutrients needed for plant growth decreases over time. The timing of digestate application should be matched to the growth stages of the plants to maximally exploit the potential of the digestate and to prevent nutrient losses.
Despite the vast body of evidence related to using digestate as a bio-fertilizer, there is still a paucity of research on the economic feasibility of its use. It is likely that with further fertilization with anaerobic digestate, the differences in the soil properties will become even more pronounced. In the future, we see value in conducting research on other soils in different natural and climatic conditions.

Author Contributions

Supervision: A.S. (Alvyra Slepetiene); conceptualization: A.S. (Alvyra Slepetiene), J.C., K.A.-V., A.M. and L.J.; methodology, writing—original draft, writing—review and editing: A.S. (Alvyra Slepetiene), J.C., K.A.-V., A.M., L.J. and J.V.; investigations: A.S. (Alvyra Slepetiene), J.C., K.A.-V., A.M., I.P., J.V., L.J. and A.S. (Aida Skersiene); formal analysis: J.C., I.P. and D.V.; review and editing: I.M. All authors have read and agreed to the published version of the manuscript.

Funding

The paper presented experimental results obtained through funding the project “Quality diagnostics of biogas production by-product (digestate) for innovative use as a biofertilizer” No. DOTSUT-217 (01.2.2-LMT-K-718-01-0053).

Institutional Review Board Statement

Not applicable.

Informed Consent Statement

Not applicable.

Data Availability Statement

Not applicable.

Acknowledgments

The first author acknowleges the research program “Productivity and sustainability of agricultural and forest soils” implemented by Lithuanian Research Centre for Agriculture and Forestry and technitians for their help in fieldwork and laboratory analyses.

Conflicts of Interest

The authors declare no conflict of interest.

References

  1. European Commission. Communication from the Commission to the Council, the European Parliament, the European Economic and Social Committee and the Committee of the Regions—Thematic Strategy for Soil Protection (COM (2006) 231 Final); European Commission: Brussels, Belgium, 2006. [Google Scholar]
  2. Comission of The European Communities. Report from the Commission to the European Parliament, the Council, the European Economic and Social Committee and the Committee of the Regions—The Implementation of the Soil Thematic Strategy and Ongoing Activities. (COM (2012) 46 Final); Comission of The European Communities: Brussels, Belgium, 2012. [Google Scholar]
  3. European Parliament. Directive 2006/12/EC of the European Parliament and of the Council of 5 April 2006 on Waste. 2006, 49, pp. 9–21. Available online: https://www.eea.europa.eu/policy-documents/2006-12-ec (accessed on 5 October 2021).
  4. Bermejo Domínguez, G. Agro-Ecological Aspects When Applying the Remaining Products from Agricultural Biogas Processes as Fertilizer in Crop Production. Ph.D. Thesis, Humboldt-Universitaet, Berlin, Germany, 2012; p. 116. [Google Scholar] [CrossRef]
  5. Fuchs, J.G.; Schleiss, K. Effects of compost and digestate on environment and plant production—Results of two research projects. In Proceedings of the Conference ORBIT 2008, Wageningen, The Netherlands, 13–16 October 2008; ISBN 3-935974-19-1 (CD). [Google Scholar]
  6. Makádi, M.; Tomócsik, A.; Orosz, V. Digestate: A new nutrient source—Review. In Biogas; Kumar, S., Ed.; IntechOpen: London, UK, 2012; pp. 295–310. [Google Scholar] [CrossRef]
  7. Kirchmann, H.; Lundvall, A. Relationship between N immobilization and volatile fatty acids in soil after application of pig and cattle slurry. Biol. Fert. Soils 1993, 15, 161–164. [Google Scholar] [CrossRef]
  8. Marcato, C.E.; Mohtar, R.; Revel, J.C.; Pouech, P.; Hafidi, M.; Guiresse, M. Impact of anaerobic digestion on organic matter quality in pig slurry. Int. Biodeter. Biodegrad. 2009, 63, 260–266. [Google Scholar] [CrossRef] [Green Version]
  9. Plaza, C.C.; García-Gil, J.C.; Polo, A. Microbial activity in pig slurry-amended soils under aerobic incubation. Biodegradation 2007, 18, 159–165. [Google Scholar] [CrossRef] [PubMed]
  10. Alrefai, R.; Benyounis, K.Y.; Stokes, J. Integration approach of anaerobic digestion and fermentation process towards producing biogas and bioethanol with zero waste: Technical. J. Fundam. Renew. Energy Appl. 2017, 7, 243. [Google Scholar] [CrossRef]
  11. Akhiar, A. Characterization of Liquid Fraction of Digestates after Solid-Liquid Separation from Anaerobic Co-Digestion Plants. Ph.D. Thesis, Chemical and Process Engineering Université Montpellier, Montpellier, France, 2017. (English, NNT:2017MONTS004). [Google Scholar]
  12. Ghani, A.; Dexter, M.; Perrott, K.W. Hot-water extractable carbon in soils: A sensitive measurement for determining impacts of fertilisation, grazing and cultivation. Soil Biol. Biochem. 2003, 35, 1231–1243. [Google Scholar] [CrossRef]
  13. Jankauskas, B.; Jankauskienė, G.; Fullen, M.A. Relationships between soil organic matter content and soil erosion severity in Albeluvisols of the Žemaičiai Uplands. Ekologija 2007, 53, 21–28. [Google Scholar]
  14. Dong, W.; Zhang, X.; Wang, H.; Dai, X.; Sun, X.; Qiu, W. Effect of different fertilizer application on the soil fertility of paddy soils in red soil region of Southern China. PLoS ONE 2012, 7, e44504. [Google Scholar] [CrossRef] [Green Version]
  15. Goberna, M.; Podmirseg, S.M.; Waldhuber, S.; Knapp, B.A.; García, C.; Insam, H. Pathogenic bacteria and mineral N in soils following the land spreading of biogas digestates and fresh manure. Appl. Soil Ecol. 2011, 49, 18–25. [Google Scholar] [CrossRef]
  16. Kolář, L.; Kužel, S.; Peterka, J.; Štindl, P.; Plát, V. Agrochemical value of organic matter of fermenter wastes in biogas production. Plant Soil Environ. 2008, 54, 321–328. [Google Scholar] [CrossRef]
  17. Lošák, T.; Zatloukalová, A.; Szostková, M.; Hlušek, J.; Fryč, J.; Vítěz, T. Comparison of the effectiveness of digestate and mineral fertilisers on yields and quality of kohlrabi (Brassica oleracea, L.). Acta Univ. Agric. Silvic. Mendel. Brun. 2011, 59, 117–122. [Google Scholar] [CrossRef] [Green Version]
  18. Teglia, C.; Tremier, A.; Martel, J.L. Characterization of solid digestates: Part 1, Review of existing indicators to assess solid digestates agricultural use. Waste Biomass Valorization 2011, 2, 43–58. [Google Scholar] [CrossRef]
  19. Chiyoka, W.L.; Zvomuya, F.; Hao, X. A bioassay of nitrogen availability in soils amended with solid digestate from anaerobically digested beef cattle feedlot manure. Soil Sci. Soc. Am. J. 2014, 78, 1291. [Google Scholar] [CrossRef]
  20. Lu, J.; Xu, S. Post-treatment of food waste digestate towards land application: A review. J. Clean. Prod. 2021, 303, 127033. [Google Scholar] [CrossRef]
  21. Risberg, K.; Cederlund, H.; Pell, M.; Arthurson, V.; Schnürer, A. Comparative characterization of digestate versus pig slurry and cow manure—Chemical composition and effects on soil microbial activity. Waste Manag. 2017, 261, 529–538. [Google Scholar] [CrossRef]
  22. Tambone, F.; Genevini, P.; D’Imporzano, G.; Adani, F. Assessing amendment properties of digestate by studying the organic matter composition and the degree of biological stability during the anaerobic digestion of the organic fraction of MSW. Bioresour. Technol. 2009, 100, 3140–3142. [Google Scholar] [CrossRef]
  23. Cristina, G.; Camelin, E.; Tommasi, T.; Fino, D.; Pugliese, M. Anaerobic digestates from sewage sludge used as fertilizer on a poor alkaline sandy soil and on a peat substrate: Effects on tomato plants growth and on soil properties. J. Environ. Manag. 2020, 269, 110767. [Google Scholar] [CrossRef]
  24. Evans, G. Biowaste and Biological Waste Treatment, 1st ed; Routledge: London, UK, 2001. [Google Scholar] [CrossRef]
  25. Stinner, W.; Möller, K.; Leithold, G. Effects of biogas digestion of clover/grass leys, cover crops and crop residues on nitrogen cycle and crop yield in organic stockless farming systems. Eur. J. Agron. 2008, 29, 125–134. [Google Scholar] [CrossRef]
  26. Makádi, M.; Szegi, T.; Tomócsik, A.; Orosz, V.; Michéli, E.; Ferenczy, A.; Posta, K.; Biró, B. Impact of digestate application on chemical and microbiological properties of two different textured soils. Commun. Soil Sci. Plant Anal. 2016, 47, 167–178. [Google Scholar] [CrossRef]
  27. Alburquerque, J.A.; de la Fuente, C.; Campoy, M.; Carrasco, L.; Nájera, I.; Baixauli, C.; Caravaca, F.; Roldán, A.; Cegarra, J.; Bernal, M. Agricultural use of digestate for horticultural crop production and improvement of soil properties. Eur. J. Agron. 2012, 43, 119–128. [Google Scholar] [CrossRef]
  28. Arbačauskas, J.; Macevičienė, A.; Žičkienė, L.; Staugaitis, G. Mineral nitrogen in soils of Lithuania’s agricultural land: Comparison of oven-dried and field-moist samples. ZEMDIRBYSTE 2018, 105, 99–104. [Google Scholar] [CrossRef] [Green Version]
  29. Mayer, S.; Kölbl, A.; Völkel, J.; Kögel-Knabner, I. Organic matter in temperate cultivated floodplain soils: Light fractions highly contribute to subsoil organic carbon. Geoderma 2019, 337, 679–690. [Google Scholar] [CrossRef]
  30. Gajic, B. Physical properties and organic matter of Fluvisol under forest, grassland, and 100 years of conventional tillage. Geoderma 2013, 200, 114–119. [Google Scholar] [CrossRef]
  31. Gajic, B.A.; Kresovic, B.J.; Dragovic, S.D.; Sredojevic, Z.J.; Dragovic, R.M. Effect of land use change on the structure of Gleyic Fluvisols in Western Serbia. J. Agric. Sci. 2014, 59, 151–160. [Google Scholar] [CrossRef] [Green Version]
  32. Ilinkin, V.V.; Dimitrov, D.; Zhelev, P. Characteristics of Fluvisols in sand and gravel deposit ‘Kriva Bara’, Sofia, Bulgaria. Ecol. Eng. Environ. Prot. 2018, 1, 58–65. [Google Scholar] [CrossRef]
  33. European Soil Bureau Network. Soil Atlas of Europe; Office of Official Publications: Luxembourg, 2005; p. 128. [Google Scholar]
  34. Hiederer, R. Distribution of Organic Carbon in Soil Profile Data; JRC Scientific and Technical Reports, EUR 23980 EN; Office for Official Publications of the European Communities: Luxembourg, 2009; p. 126. [Google Scholar]
  35. Qi, R.; Li, J.; Lin, Z.; Li, Z.; Li, Y.; Yang, X.; Zhang, J.; Zhao, B. Temperature effects on soil organic carbon, soil labile organic carbon fractions, and soil enzyme activities under long-term fertilization regimes. Appl. Soil Ecol. 2016, 102, 36–45. [Google Scholar] [CrossRef]
  36. Wang, D.; Felice, M.L.; Scow, K.M. Impacts and interactions of biochar and biosolids on agricultural soil microbial communities during dry and wet-dry cycles. Appl. Soil Ecol. 2020, 152, 103570. [Google Scholar] [CrossRef]
  37. Slepetiene, A.; Volungevicius, J.; Jurgutis, L.; Liaudanskiene, I.; Amaleviciute-Volunge, K.; Slepetys, J.; Ceseviciene, J. The potential of digestate as a biofertilizer in eroded soils of Lithuania. Waste Manag. 2020, 102, 441–451. [Google Scholar] [CrossRef]
  38. Nabel, M.; Tempotron Vicky, M.; Poorter, H.; Lücke, A.; Jablonowski, D.N. Energizing marginal soils—The establishment of the energy crop Sida hermaphrodita as dependent on digestate fertilization, NPK, and legume intercropping. Biomass Bioenergy 2016, 87, 9–16. [Google Scholar] [CrossRef]
  39. Hagman, L.; Blumenthal, A.; Eklund, M.; Svensson, N. The role of biogas solutions in sustainable biorefineries. J. Clean. Prod. 2018, 172, 3982–3989. [Google Scholar] [CrossRef] [Green Version]
  40. Czekała, W.; Lewicki, A.; Pochwatka, P.; Czekała, A.; Wojcieszak, D.; Jóźwiakowski, K.; Waliszewska, H. Digestate management in polish farms as an element of the nutrient cycle. J. Clean. Prod. 2020, 242, 118454. [Google Scholar] [CrossRef]
  41. Fuchs, W.; Drosg, B. Assessment of the state of the art of technologies for the processing of digestate residue from anaerobic digesters. Water Sci. Technol. 2013, 67, 1984–1993. [Google Scholar] [CrossRef] [PubMed] [Green Version]
  42. Group WRB. World Reference Base for Soil Resources 2014, update 2015. In International Soil Classification System for Naming Soils and Creating Legends for Soil Maps; World Soil Resources Reports No. 106; FAO: Rome, Italy, 2015; 193p. [Google Scholar]
  43. Jankauskas, B.; Jankauskiene, G.; Slepetiene, A.; Fullen, M.A.; Booth, C.A. International Comparison of Analytical Methods of Determining the Soil Organic Matter Content of Lithuanian Eutric Albeluvisols. Commun. Soil Sci. Plant Anal. 2006, 37, 707–720. [Google Scholar] [CrossRef]
  44. Möller, K.; Mülle, T. Effects of anaerobic digestion on digestate nutrient availability and crop growth: A review. Eng. Life Sci. 2012, 12, 242–257. [Google Scholar] [CrossRef]
  45. Zirkler, D.; Peters, A.; Kaupenjohann, M. Elemental composition of biogas residues: Variability and alteration during anaerobic digestion. Biomass Bioenergy 2014, 67, 89–98. [Google Scholar] [CrossRef]
  46. Furukawa, Y.; Hasegawa, H. Response of spinach and komatsuna to biogas effluent made from source-separated kitchen garbage. J. Environ. Qual. 2006, 35, 1939–1947. [Google Scholar] [CrossRef]
  47. Kryvoruchko, V.; Machmüller, A.; Bodiroza, V.; Amon, B.; Amon, T. Anaerobic digestion of by-products of sugar beet and starch potato processing. Biomass Bioenergy 2009, 33, 620–627. [Google Scholar] [CrossRef]
  48. Šimanskaitė, D.; Feiza, V.; Lazauskas, S.; Feizienė, D.; Kadžienė, G. Soil tillage systems impact on hydrophysical properties of gleyic Cambisol. ZEMDIRBYSTE 2009, 96, 23–38. [Google Scholar]
  49. Singh, B.P.; Setia, R.; Wiesmeier, M.; Kunhikrishnan, A. Agricultural Management Practices and Soil Organic Carbon Storage; Brajesh, K.S., Ed.; Soil Carbon Storage; Academic Press: Cambridge, MA, USA, 2018; pp. 207–244. [Google Scholar] [CrossRef]
  50. Šlepetienė, A.; Kadžiulienė, Ž.; Feizienė, D.; Liaudanskienė, I.; Amalevičiūtė-Volungė, K.; Šlepetys, J.; Skersienė, A.; Velykis, A.; Armolaitis, K. The distribution of organic carbon, its forms and macroelements in agricultural soils. Zemdirbyste 2020, 107, 291–300. [Google Scholar] [CrossRef]
  51. Mayer, S.; Schwindt, D.; Steffens, M.; Völkel, J.; Kögel-Knabner, I. Drivers of organic carbon allocation in a temperate slope-floodplain catena under agricultural use. Geoderma 2018, 327, 63–72. [Google Scholar] [CrossRef]
  52. Barlóg, P.; Hlisnikovský, L.; Kunzova, E. Effect of digestate on soil organic carbon and plant-available nutrient content compared to cattle slurry and mineral fertilization. Agronomy 2020, 10, 379–389. [Google Scholar] [CrossRef] [Green Version]
  53. Möller, K. Effects of anaerobic digestion on soil carbon and nitrogen turnover, N emissions, and soil biological activity. A review. Agron. Sustain. Dev. 2015, 35, 1021–1041. [Google Scholar] [CrossRef]
  54. Zhang, M.; He, Z.; Zhao, A.; Zhang, H.; Dinku, M.E.; Schomberg, H.H. Water-extractable soil organic carbon and nitrogen affected by tillage and manure application. Soil Sci. 2011, 176, 307–312. [Google Scholar] [CrossRef]
  55. Monard, C.; Jeanneau, L.; Le Garrec, J.-L.; Le Bris, N.; Binet, F. Short-term effect of pig slurry and its digestate application on biochemical properties of soils and emissions of volatile organic compounds. Appl. Soil Ecol. 2020, 147, 103376. [Google Scholar] [CrossRef]
  56. Sogn, T.A.; Dragicevic, I.; Linjordet, R.; Krogstad, T.; Eijsink, V.G.H.; Eich-Greatorex, S. Recycling of biogas digestates in plant production: NPK fertilizer value and risk of leaching. Int. J. Recycl. Org. Waste Agric. 2018, 7, 49–58. [Google Scholar] [CrossRef] [Green Version]
  57. Staugaitis, G.; Vaisvila, Z.; Mazvila, J.; Arbaciauskas, J.; Adomaitis, T.; Fullen, M.A. Role of soil mineral nitrogen for agricultural crops: Nitrogen nutrition diagnostics in Lithuania. Arch. Agron. Soil Sci. 2007, 53, 263–271. [Google Scholar] [CrossRef]
  58. Román, F.; Adolph, J.; Hensel, O. Hydrothermal treatment of biogas digestate as a pretreatment to reduce fouling in membrane filtration. Bioresour. Technol. Rep. 2021, 13, 100638. [Google Scholar] [CrossRef]
  59. Drosg, B.; Fuchs, W.; Al Seadi, T.; Madsen, M.; Linke, B. Nutrient recovery by biogas digestate processing. In IEA Bioenergy. 2015. Available online: https://www.iea-biogas.net/files/daten-redaktion/download/TechnicalBrochures/NUTRIENT_RECOVERY_RZ_web1.pdf (accessed on 12 November 2021).
  60. Svehla, P.; Vargas Caceres, L.M.; Michal, P.; Tlustos, P. Thermal thickening of nitrified liquid phase of digestate for production of concentrated complex fertiliser and high-quality technological water. J. Environ. Manag. 2020, 276, 111250. [Google Scholar] [CrossRef]
  61. Amine Charfi, A.; Kim, S.; Yoon, Y.; Cho, J. Optimal cleaning strategy to alleviate fouling in membrane distillation process to treat anaerobic digestate. Chemosphere 2021, 279, 130524. [Google Scholar] [CrossRef]
Figure 1. Fluvisol profile horizons and their characteristics at the experimental site in 2018.
Sustainability 15 01345 g001
Figure 2. Soil moisture content in different sampling times ((A)—May; (B)—July), fertilization and year (averaged for 0–30 cm soil layer). Fertilization treatments: control (without fertilization); 85N LD (liquid digestate 85 kg ha−1 N); 170N LD (liquid digestate 170 kg ha−1 N); 85N SD (solid digestate 85 kg ha−1 N); 170N SD (solid digestate 170 kg ha−1 N). Error bars represent standard error.
Sustainability 15 01345 g002
Figure 3. Soil organic carbon (SOC) concentration in different Fluvisol as affected by fertilization (data averaged for year and sampling time). Fertilization treatments: control (without fertilization); 85N LD (liquid digestate 85 kg ha−1 N); 170N LD (liquid digestate 170 kg ha−1 N); 85N SD (solid digestate 85 kg ha−1 N); 170N SD (solid digestate 170 kg ha−1 N). Error bars represent standard error.
Sustainability 15 01345 g003
Figure 4. Changes of water-extractable organic carbon (WEOC) content in the Fluvisol (0–30 cm) fertilized with different phases of anaerobic digestate. Data represent different fertilization and sampling time interactions (averaged for year and soil layer). Fertilization treatments: control (without fertilization); 85N LD (liquid digestate 85 kg ha−1 N); 170N LD (liquid digestate 170 kg ha−1 N); 85N SD (solid digestate 85 kg ha−1 N); 170N SD (solid digestate 170 kg ha−1 N). Error bars represent standard error.
Sustainability 15 01345 g004
Figure 5. Changes of water-extractable organic carbon (WEOC) content in Fluvisol (0–30 cm) fertilized with different phases of anaerobic digestate. Data represent different fertilization, soil layer, sampling time and year interactions ((A)—2018 May; (B)—2019 May; (C)—2018 July; (D)—2019 July). Fertilization treatments: control (without fertilization); 85N LD (liquid digestate 85 kg ha−1 N); 170N LD (liquid digestate 170 kg ha−1 N); 85N SD (solid digestate 85 kg ha−1 N); 170N SD (solid digestate 170 kg ha−1 N). Error bars represent standard error.
Sustainability 15 01345 g005
Figure 6. Changes of total nitrogen (TN) content in Fluvisol (0–30 cm) fertilized with different phases of anaerobic digestate. Provided data represent different fertilization and year interactions (data of sampling time and soil layer are averaged). Fertilization treatments: control (without fertilization); 85N LD (liquid digestate 85 kg ha−1 N); 170N LD (liquid digestate 170 kg ha−1 N); 85N SD (solid digestate 85 kg ha−1 N); 170N SD (solid digestate 170 kg ha−1 N). Error bars represent standard error.
Sustainability 15 01345 g006
Figure 7. Changes of total nitrogen (TN) content in the Fluvisol (0–30 cm) fertilized with different phases of anaerobic digestate. Provided data represent different fertilization, soil layer, sampling time and year interactions ((A)—2018 May; (B)—2019 May; (C)—2018 July; (D)—2019 July). Fertilization treatments: control (without fertilization); 85N LD (liquid digestate 85 kg ha−1 N); 170N LD (liquid digestate 170 kg ha−1 N); 85N SD (solid digestate 85 kg ha−1 N); 170N SD (solid digestate 170 kg ha−1 N). Error bars represent standard error.
Sustainability 15 01345 g007
Figure 8. Changes of mineral nitrogen (Nmin) content in the Fluvisol (0–30 cm) fertilized with different phases of anaerobic digestate. Data represent different fertilization, soil layer, sampling time and year interactions ((A)—2018 May; (B)—2019 May; (C)—2018 July; (D)—2019 July). Fertilization treatments: control (without fertilization); 85N LD (liquid digestate 85 kg ha−1 N); 170N LD (liquid digestate 170 kg ha−1 N); 85N SD (solid digestate 85 kg ha−1 N); 170N SD (solid digestate 170 kg ha−1 N). Error bars represent standard error.
Sustainability 15 01345 g008
Figure 9. Soil ammonium nitrogen (N-NH4) concentration as affected by different fertilization, soil layer and year interactions (averaged for year and sampling time). Fertilization treatments: control (without fertilization); 85N LD (liquid digestate 85 kg ha−1 N); 170N LD (liquid digestate 170 kg ha−1 N); 85N SD (solid digestate 85 kg ha−1 N); 170N SD (solid digestate 170 kg ha−1 N). Error bars represent standard error.
Sustainability 15 01345 g009
Figure 10. Soil nitrate nitrogen (N-NO3) concentration as affected by different fertilization, soil layer and year interactions (averaged for year and sampling time). Fertilization treatments: control (without fertilization); 85N LD (liquid digestate 85 kg ha−1 N); 170N LD (liquid digestate 170 kg ha−1 N); 85N SD (solid digestate 85 kg ha−1 N); 170N SD (solid digestate 170 kg ha−1 N). Error bars represent standard error.
Sustainability 15 01345 g010
Table 1. Chemical properties of soil profile of the field experiment, 2018.
Soil Layer, cmpHSOCTNTPTKN-NH4N-NO3
g kg−1mg kg−1
0–106.2514.41.030.693.873.063.37
10–206.4112.41.140.644.064.925.67
20–306.6411.71.030.613.961.534.86
30–606.812.50.410.494.360.001.93
60–907.391.00.280.454.110.005.17
Note: SOC—soil organic carbon, TN—total nitrogen, TP—total phosphorus, TK—total potassium, N-NH4—ammonium nitrogen; N-NO3—nitrate nitrogen.
Table 2. Meteorological conditions, Dotnuva meteorological station.
MonthDecadeAverage Temperature, °CTotal Precipitation, mm
201820191924–2019201820191924–2019
AprilI7.65.8 38.20.0
II11.06.7 4.80.0
III11.314.2 9.10.0
I–III9.98.96.052.10.037.2
MayI15.48.6 9.88.0
II16.114.3 29.34.7
III18.815.5 1.142.7
I–III16.912.912.440.255.451.4
JuneI17.019.9 2.70.1
II18.821.9 7.016.0
III16.720.0 24.40.0
I–III17.520.615.834.116.161.2
JulyI16.315.2 45.119.4
II21.316.5 37.722.4
III23.620.1 0.524.2
I–III20.517.317.883.366.076.6
Table 3. Variance for soil parameters.
FactorDFF-Value of the Variance Source
MoistureSOCWEOCTNNminN-NH4N-NO3
Fertilization (F)46.05 **1.721.916.95 **4.62 **2.79 *3.09 *
Layer (L)284.87 **301.01 **45.75 **280.35 **100.45 **39.93 **93.00 **
Year (Y)11491.2 **20.79 **271.54 **5.29 *21.95 **38.44 **0.02
Sampling time (S)163.27 **0.09234.75 **8.06 *125.88 **27.37 **157.08 **
F × L81.622.40 *1.621.932.61 *2.39 *1.20
F × Y44.24 **0.620.812.96 *4.15 **1.776.59 **
F × S42.013.78 **4.23 **2.99 *2.76 *2.51 *2.79 *
L × Y250.35 **0.671.002.2529.59 **28.63 **9.20 **
L × S237.05 **6.84 **9.73 **3.44 *59.12 **25.56 **56.92 **
Y × S14583.2 **1.3717.72 **4.85 *12.15 **6.52 *7.05 **
F × L × Y80.490.651.020.203.32 **2.39 *3.59 **
F × L × S80.730.350.840.502.33 *2.33 *0.86
F × Y × S414.74 **0.460.881.522.372.025.17 **
L × Y × S289.25 **9.93 **2.292.3520.93 **25.55 **3.39 *
F × L × Y × S80.640.981.020.651.792.14 *1.99
Notes: DF—degree of freedom; * and **—significant at p < 0.05 and p < 0.01, respectively; SOC—soil organic carbon, WEOC—water-extractable organic carbon, TN—total nitrogen, TP—total phosphorus, TK—total potassium, Nmin—mineral nitrogen, N-NH4—ammonium nitrogen; N-NO3—nitrate nitrogen.
Table 4. Chemical composition of liquid and solid phases of digestate.
CharacteristicLDSD
2018201920182019
pH 8.037.548.198.54
Dry matter (DM)%2.321.4528.426.5
Organic matter (OM) % DM67.266.188.087.1
Total nitrogen (TKN) % DM9.7014.81.281.51
N-NH4 share on TN%47.561.43.884.09
Total carbon (OC)% DM42.735.252.450.1
TC-to-TN ratio 4.402.3840.933.2
Total phosphorus (TP)% DM2.441.660.711.31
Total potassium (TK)% DM5.789.240.440.63
Notes: LD—liquid digestate; SD—solid digestate.
Table 5. Soil moisture content % (mean ± standard error) variation affected by soil layer, fertilization and year (averaged at sampling time).
Soil Layer, cmControl85N LD170N LD85N SD170N SD
2018
0–108.59 ± 1.307.83 ± 1.517.69 ± 1.738.84 ± 1.708.99 ± 1.86
10–208.37 ± 1.598.04 ± 1.808.04 ± 1.798.65 ± 1.788.89 ± 2.02
20–306.38 ± 0.706.27 ± 1.136.95 ± 0.977.25 ± 1.267.35 ± 1.51
2019
0–104.08 ± 0.773.56 ± 0.833.78 ± 0.863.72 ± 0.833.70 ± 0.96
10–205.32 ± 1.455.48 ± 1.515.34 ± 1.515.69 ± 1.705.44 ± 1.81
Note—Fertilization treatments: control (without fertilization); 85N LD (liquid digestate 85 kg ha−1 N); 170N LD (liquid digestate 170 kg ha−1 N); 85N SD (solid digestate 85 kg ha−1 N); 170N SD (solid digestate 170 kg ha−1 N).
Table 6. Soil parameters as influenced by four factors of the experiment.
Moisture,
%
SOC,
g kg−1
WEOC,
g kg−1
TN,
g kg−1
Nmin,
mg kg−1
N-NH4,
mg kg−1
N-NO3,
mg kg−1
Mean±SEMean±SEMean±SEMean±SEMean±SEMean±SEMean±SE
Fertilization
Control6.10 a0.558.62 a0.210.246 a0.0110.762 ab0.0417.17 a0.721.75 a0.155.41 ab0.64
85N LD5.91 a0.589.33 ab0.540.266 a0.0130.837 b0.0298.37 ab1.132.99 b0.655.38 a0.60
170N LD6.03 a0.599.30 b0.380.257 a0.0120.839 b0.03810.55 b1.743.68 b0.946.87 b0.89
85N SD6.41 a0.649.05 ab0.460.258 a0.0110.778 ab0.04010.19 b1.913.79 b1.456.41 ab0.81
170N SD6.45 a0.719.21 ab0.510.261 a0.0120.734 a0.0368.89 ab1.072.72 b0.536.17 ab0.77
Soil layer
0–10 cm6.08 ab0.4911.03 b0.510.281 b0.0090.925 a0.01114.05 c1.565.71 c1.068.33 c0.73
10–20 cm6.93 b0.5310.61 b0.170.266 b0.0090.920 a0.0128.96 b0.452.15 b0.116.82 b0.45
20–30 cm5.54 a0.375.67 a0.110.226 a0.0070.526 b0.0224.09 a0.161.09 a0.103.00 a0.16
Year
20187.88 b0.388.65 a0.280.218 a0.0040.772 a0.0237.69 a0.521.62 a0.096.07 a0.48
20194.49 a0.309.55 b0.300.298 b0.0070.808 a0.02410.38 b1.114.36 b0.746.02 a0.47
Sampling time
May5.83 a0.199.07 a0.300.295 b0.0080.768 a0.02512.25 b1.134.14 b0.748.11 b0.58
July6.53 b0.519.13 a0.350.220 a0.0040.813 a0.0225.82 a0.211.83 a0.133.99 a0.14
Note: the different letters in the columns indicate significant differences (p < 0.05) within the factor.
Disclaimer/Publisher’s Note: The statements, opinions and data contained in all publications are solely those of the individual author(s) and contributor(s) and not of MDPI and/or the editor(s). MDPI and/or the editor(s) disclaim responsibility for any injury to people or property resulting from any ideas, methods, instructions or products referred to in the content.

