1. Introduction
For some years now, modern vehicles have been equipped with increasingly refined electronic instruments. If, at the beginning, their task was to monitor and possibly fix eventual errors of the vehicle, now they have taken on a role of great interaction with the driver as they aim to improve driving comfort and safety. As is known, among all the components of the road system, the state of the infrastructure and the vehicle are the most objectively controllable. The driver, on the other hand, includes considerable uncertainty and fragility, therefore the development of new technologies has focused more on it.
Recent technological developments have allowed the production of instruments that are very attractive to the potential buyer and sufficiently economical, so in the overall cost they represent an element of great convenience for the industries, with the consequence that they are often not very useful and, in some cases, harmful.
However, infotainment devices should be distinguished from driving aids, since the former could represent an important source of dispersion of user resources, while the latter are, however, aimed at increasing road safety.
In the first case, the drivers’ performance is often influenced by the presence of elements not directly associated with the road infrastructure [
1] that can lead to distraction phenomena and, consequently, to incorrect maneuvers [
2,
3]. Visual distraction can therefore be defined as a diversion of the driver’s attention to activities that are not necessary for safe driving. It is interesting to mention some recent reports of the National Highway Traffic Safety Administration [
4,
5], in which there is a prominent role of carelessness in accidents (to be precise, 78% of all accidents in the United States and 65% of missed collisions) and, among them, 25% is caused by equipment on board the vehicle. Distraction leads to very unpleasant effects in driving behavior, such as an increase in reaction time, a reduction in time-to-collision, a high probability of invasion of the opposite lane, sharp changes in speed and some reduction in headway [
6,
7,
8,
9,
10].
In the near future, the digitization of roads through communication protocols, such as Vehicle-to-Vehicle (V2V) and Vehicle-to-Infrastructure (V2I), will expose users to a large flow of information in real-time during driving, which, according to the best intentions, should improve traffic safety [
11,
12]. Investigating such interaction is key to understanding what factors should be considered for the decay of performance, despite the benefits that such technology can bring to them [
13,
14].
Among the various forms of overload of the user’s capacity, the visual one, for example, the use of a mobile phone or a navigator, is among the most dangerous, as it diverts the gaze from the road and induces a sudden shortening of the driver’s focal length [
15,
16]. Although the best thing is to divide the workloads on different channels (visual, auditory, or tactile), even with the most modern instrumentation, vision remains the main way to acquire information from the road context [
17,
18,
19,
20,
21,
22,
23].
Traditionally, this mental stress to which the user is subjected is called workload (WL) and depends on both the nature of the task and the ability of the individual: no acceptable determination can be considered if both elements are not considered. Considering a universally recognized definition by the scientific community, according to [
24], WL is that portion of the operator’s capacity required to perform a particular action.
The problem of measuring the workload has been addressed for several decades, identifying some characteristics in which to assign particular importance depending on the task to be performed: sensitivity (to small but important changes in the scenario), diagnosticity (ability to identify the cause of discomfort), intervention (interdependence between variables present in the driving scenario), but also selectivity, reliability, and reproducibility.
The success of low-cost sensors, together with the computing capabilities of modern microprocessors, makes it possible to measure workload in multiple ways and, therefore, should be classified appropriately. The choice should be made according to the experimental context and knowing that, in most cases, a single type of measure will not be sufficient to understand the phenomenon. In general terms, the three main categories are as follows:
- −
Subjective measurements (questionnaires);
- −
Performance measures (primary and secondary);
- −
Physiological measurements.
To the first group (subjective measurements) belong those methodologies that are based on the subjective judgment of the user about the experimented trial, generally, through appropriate questionnaires. Among those proposed in the literature, the National Aeronautics and Space Administration Task Load Index (NASA TLX) has found a wider application as it investigates more dimensions of the user’s task and lends itself to a multiplicity of applications [
25].
Self-assessment scales bring with them other advantages, such as ease of application and low costs. Obviously, there are also many elements against their use. First, the difficulty of distinguishing between mental and physical load or, again, a subjective contribution too marked. In this regard, O’Donnell and Eggemeier [
24] warn of the danger of a possible dissociation between self-evaluation and performance measures.
The performance measures refer to the control of the vehicle by the driver, distinguishing between lateral and longitudinal control. The variables based on the distance in curves—such as the lane gap [
26] or the steering wheel (angle or speed)—belong to the first group. In this regard, the steering angle is not very representative, and it is always good to refer to its variation in time and, therefore, to the steering speed. The other variables, such as lateral acceleration and jerk, are also not very indicative when examined together with the trajectory and steering speed, because they are directly derived from those.
Among the measures that can describe the longitudinal control and that could influence the workload, there are the speed variation (and, therefore, the acceleration or deceleration possibly related to a certain geometric element) and speed in the form of speed limit imposed by the operator, design speed, or operating speed [
27,
28,
29,
30].
This type of measure alone cannot determine a definitive judgment on a certain performance, as two users could manifest the same result but with completely different levels of discomfort, affecting their ability and experience of driving. It is necessary to couple it to another category of indicator.
The last category of measurements of WL is related to the physiology of the driver through the relief of variables such as visual activity in terms of saccharides, fixations and dilation of the pupil [
27,
31], dermal conductivity [
22], heart rate, and electromyography. The reliability of these indicators is now considered acceptable, and the only difficulties concern the study of the signal and the understanding of possible temporal latencies with respect to the stimulus to which the driver has been subjected [
32].
It is important to consider that these variables can be collected continuously over time and, therefore, be related to particular moments of activity (a passage on a given curve, for example), in contrast to the subjective measures that report a summary judgment by the operator on the overall performance.
The existing literature does not include a procedure capable of verifying a driving assistance system with a given class of users as the driving scenario varies. The proposal of this research is to identify an index dependent on visual behavior that allows the determinations with extreme simplicity in scenarios of any type.
Research Gap
The invasiveness of modern instruments in the vehicle that interact more or less actively is posing the problem of the driver’s ability to acquire all this information.
In order to increase the attractiveness of its products, the automotive industry will put new, increasingly complex instruments on the market, which will have to be subjected to an in-depth analysis to assess their effects on road safety.
The methods of communication between vehicle and driver have been the focus of studies in order to optimize the effort required to acquire information [
33,
34]. However, in the near future, these data, which also contain information coming from outside (for example, the road manager), will become particularly complex for the driver to manage and the transmission methods will have to be carefully studied [
35,
36].
This paper proposes a procedure for the verification of an On-Board Unit (OBU) mounted on a vehicle during travel on a rural road, characterized by a complex geometry and a significant flow of cyclists in its lane.
The aim of the research is not to give general meaning to the results, that is valid in every context, but to verify in some particular scenarios the effectiveness of the OBU.
2. Materials and Methods
2.1. General Description of the Experiment
The trial was carried out in a simulated environment in order to achieve certain advantages with respect to a real on-road test, including:
- −
Repeatability and homogeneity of light, weather, and traffic conditions;
- −
Safety of users involved in testing (including other vehicles);
- −
Ability to accurately represent situations that can hardly be found in reality (in this case, the presence of a particular flow of cyclists);
- −
Complete and accurate vehicle telemetry;
- −
Possibility to equip the driver with non-invasive instrumentation (biometric sensors), which, in real driving conditions, could cause sanctions by the authorities.
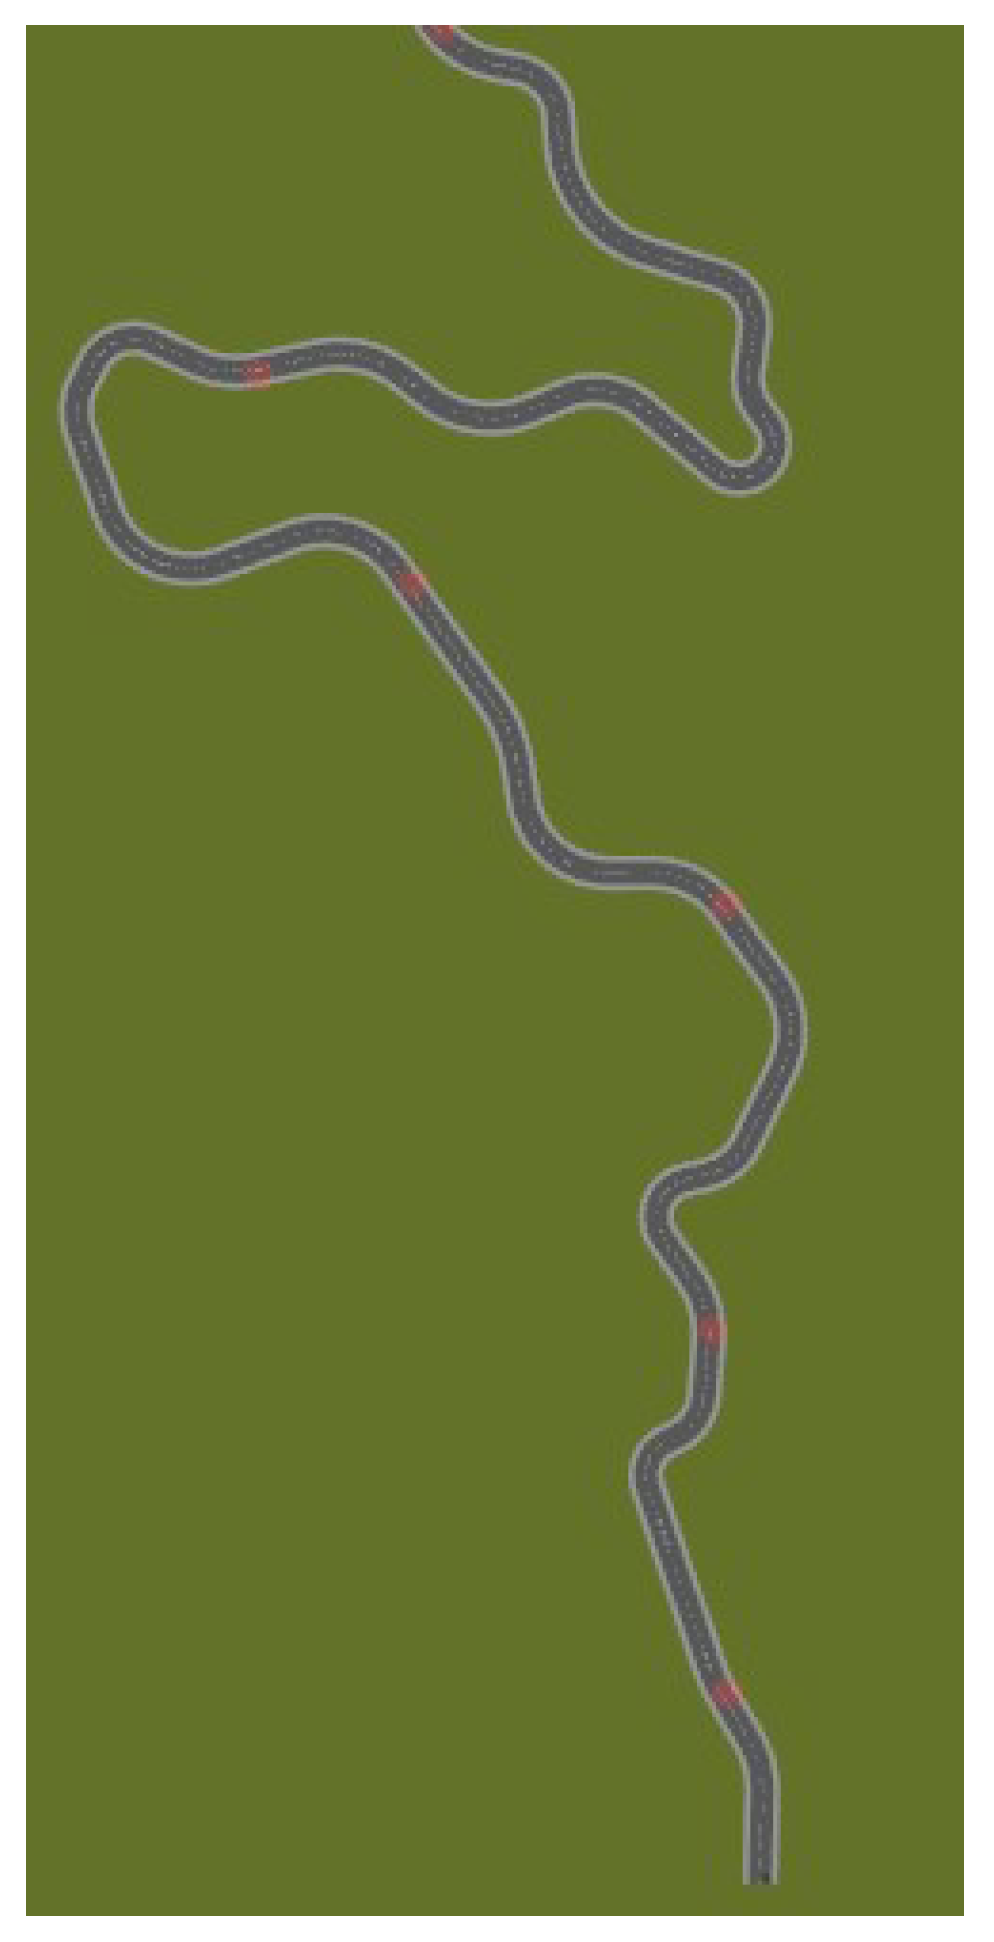
The road is within the municipality of Messina (near the village of Salice), is called SS113, and is characterized by a very tortuous geometry, with circular curves of small radius separated by short tangents (see
Figure 1), which induce drivers to acquire information through signage, since visibility is often limited. The characteristics of the cross-section consist of a total width of 7.00 m, divided into two lanes per direction of travel.
In order to investigate the influence of the OBU and the traffic consisting only of cyclists placed along the lane, 4 different driving conditions were organized on the same track, according to the following scheme:
- (1)
Control condition, no traffic. Users will acquire all the necessary information from the external context and vertical signage. There will be no traffic of any kind.
- (2)
Control condition, with traffic (cyclists). Users will acquire all the necessary information from the external context and the vertical signage. The traffic, as mentioned, will consist of groups of 3 cyclists at a time that will induce users to make the passing maneuver.
- (3)
Smart condition, no traffic. Users will acquire all the necessary information from the external context and from the OBU present inside the vehicle. There will be no traffic of any kind.
- (4)
Smart condition, with traffic (cyclists). Users will acquire all the necessary information from the external context and from the OBU present inside the vehicle. The traffic, as mentioned, will consist of groups of 3 cyclists at a time that will induce users to make the passing maneuver.
Always with the aim of simplifying the environmental context to have more robust statistical results, the weather and light conditions are the optimal ones, that is, travel in broad daylight and in the absence of rain.
The vehicle used for the test is a very common type (Citroen C3) in Italian road contexts.
2.2. The Driving Simulator at University of Messina
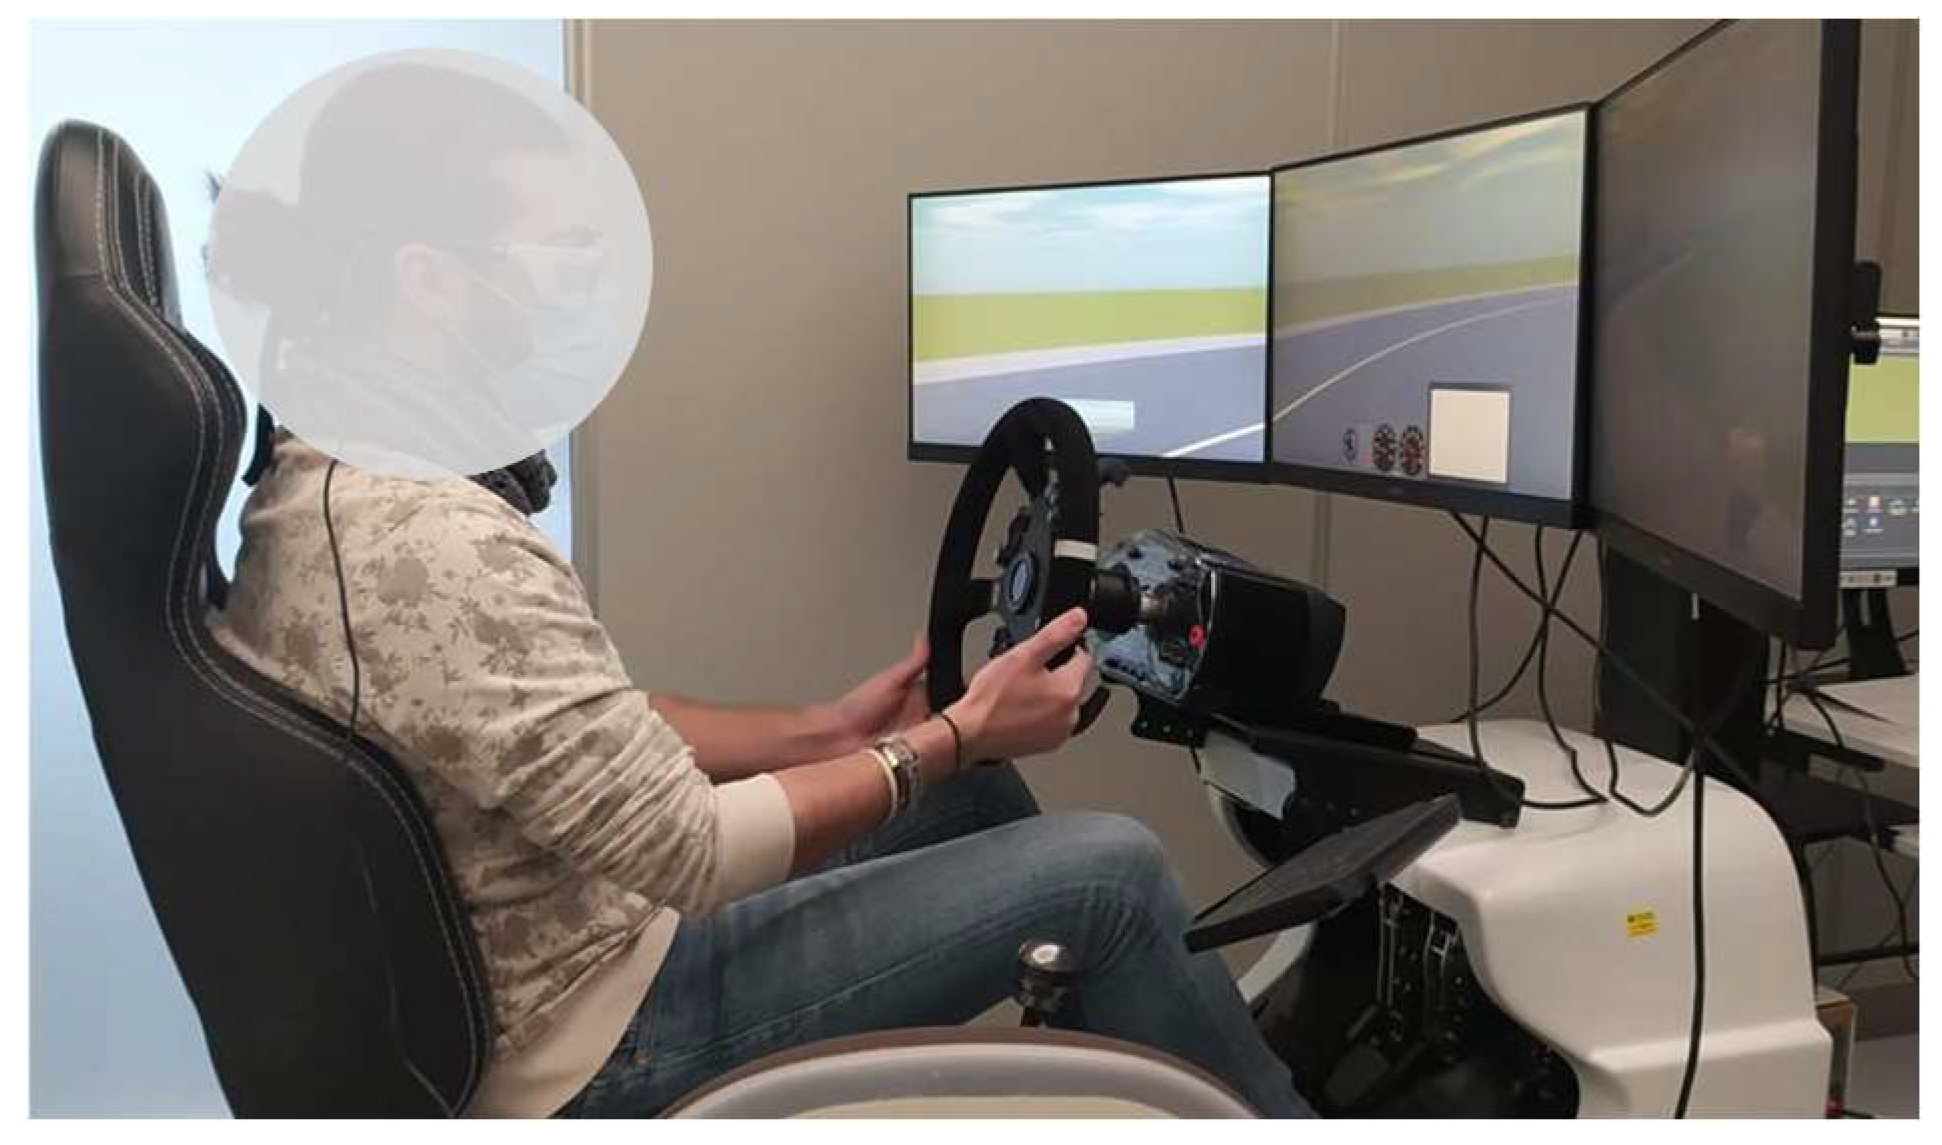
The experimentation was performed using the driving simulator named SimEASY, produced by AVSimulation, available in the Digital Laboratory for Road Safety (DiLaRS) of the University of Messina (
Figure 2). This simulator has the following features:
- −
A hardware characterized by three 29-inch full HD screens, a steering wheel characterized by a force feedback sensor to simulate the rolling motion of wheels and shocks, and sound effects reproduced through several speakers and subwoofers;
- −
A software named SCANeR studio, used to design tracks, generate the environmental context, and run trials;
- −
Data collected with a frequency of 10 Hz;
- −
A family car (Citroen C3) powered by an 80 hp gas engine, with six manual gears and automatic clutch.
2.3. The Drivers’ Sample
The test sample consists of 14 users (4 women and 10 men) with homogenous characteristics regarding age (average 27 years), number of years of possession of a driving license (average 8 years), propensity to accidents (0 accidents) experience with driving simulator (none), and visual pathologies (none). To ascertain these characteristics, users were given two questionnaires, one before driving and one after. Subjects who initially joined the trial but had important visual pathologies (excessive myopia) or who experienced nausea disorders while driving the simulator were excluded.
The inexperience of drivers towards the simulated environment has made it essential to have a training period of about 15 min to familiarize themselves with the driving controls and the general context.
All the trials were performed according to the American Psychological Association Code of Ethics and after an informed consent was obtained from each participant.
2.4. The Eye Tracker
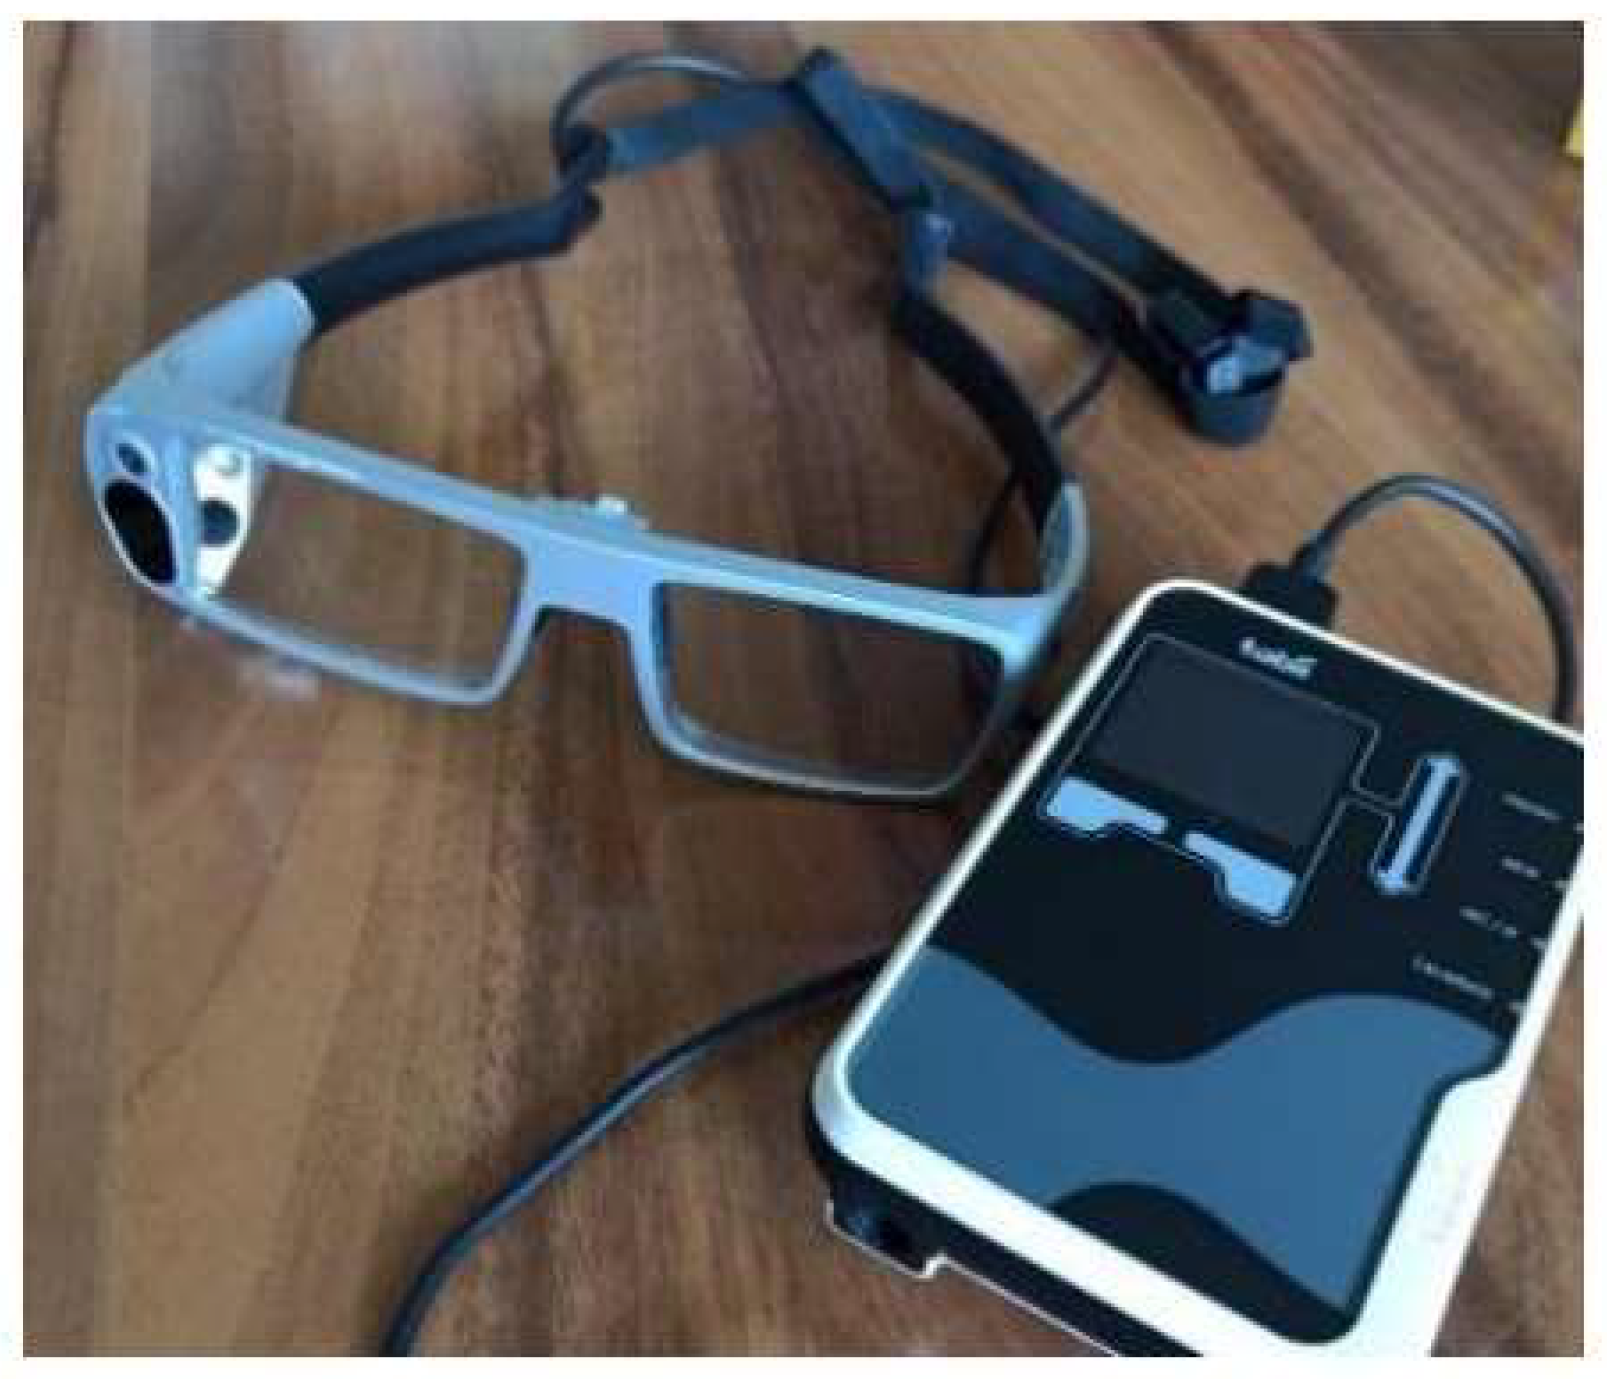
The visual behavior, in terms of fixations and saccades was detected by the eye tracker Tobii Glass rel. 1.0 that allows for accurately identifying the objects of interest fixed by the driver inside the visual field (
Figure 3).
On the right side of the eye trackers are mounted the infrared sensor, the microphone, and the camera. This causes the saccades and the fixations to be recorded only by the right eye. In the left lens, however, no recording or projections of infrared waves are made.
On the glasses there are two cameras capable of recording at a frequency of 30 Hz. The first camera detects the reflection of an infrared illuminator pointing towards the right pupil; using specific image analysis techniques, it is possible to derive eye movements from this data. The second camera looks frontally and reproduces the scene perceived by the user (
Figure 4). Its viewing angles are 56 degrees horizontally and 44 degrees vertically.
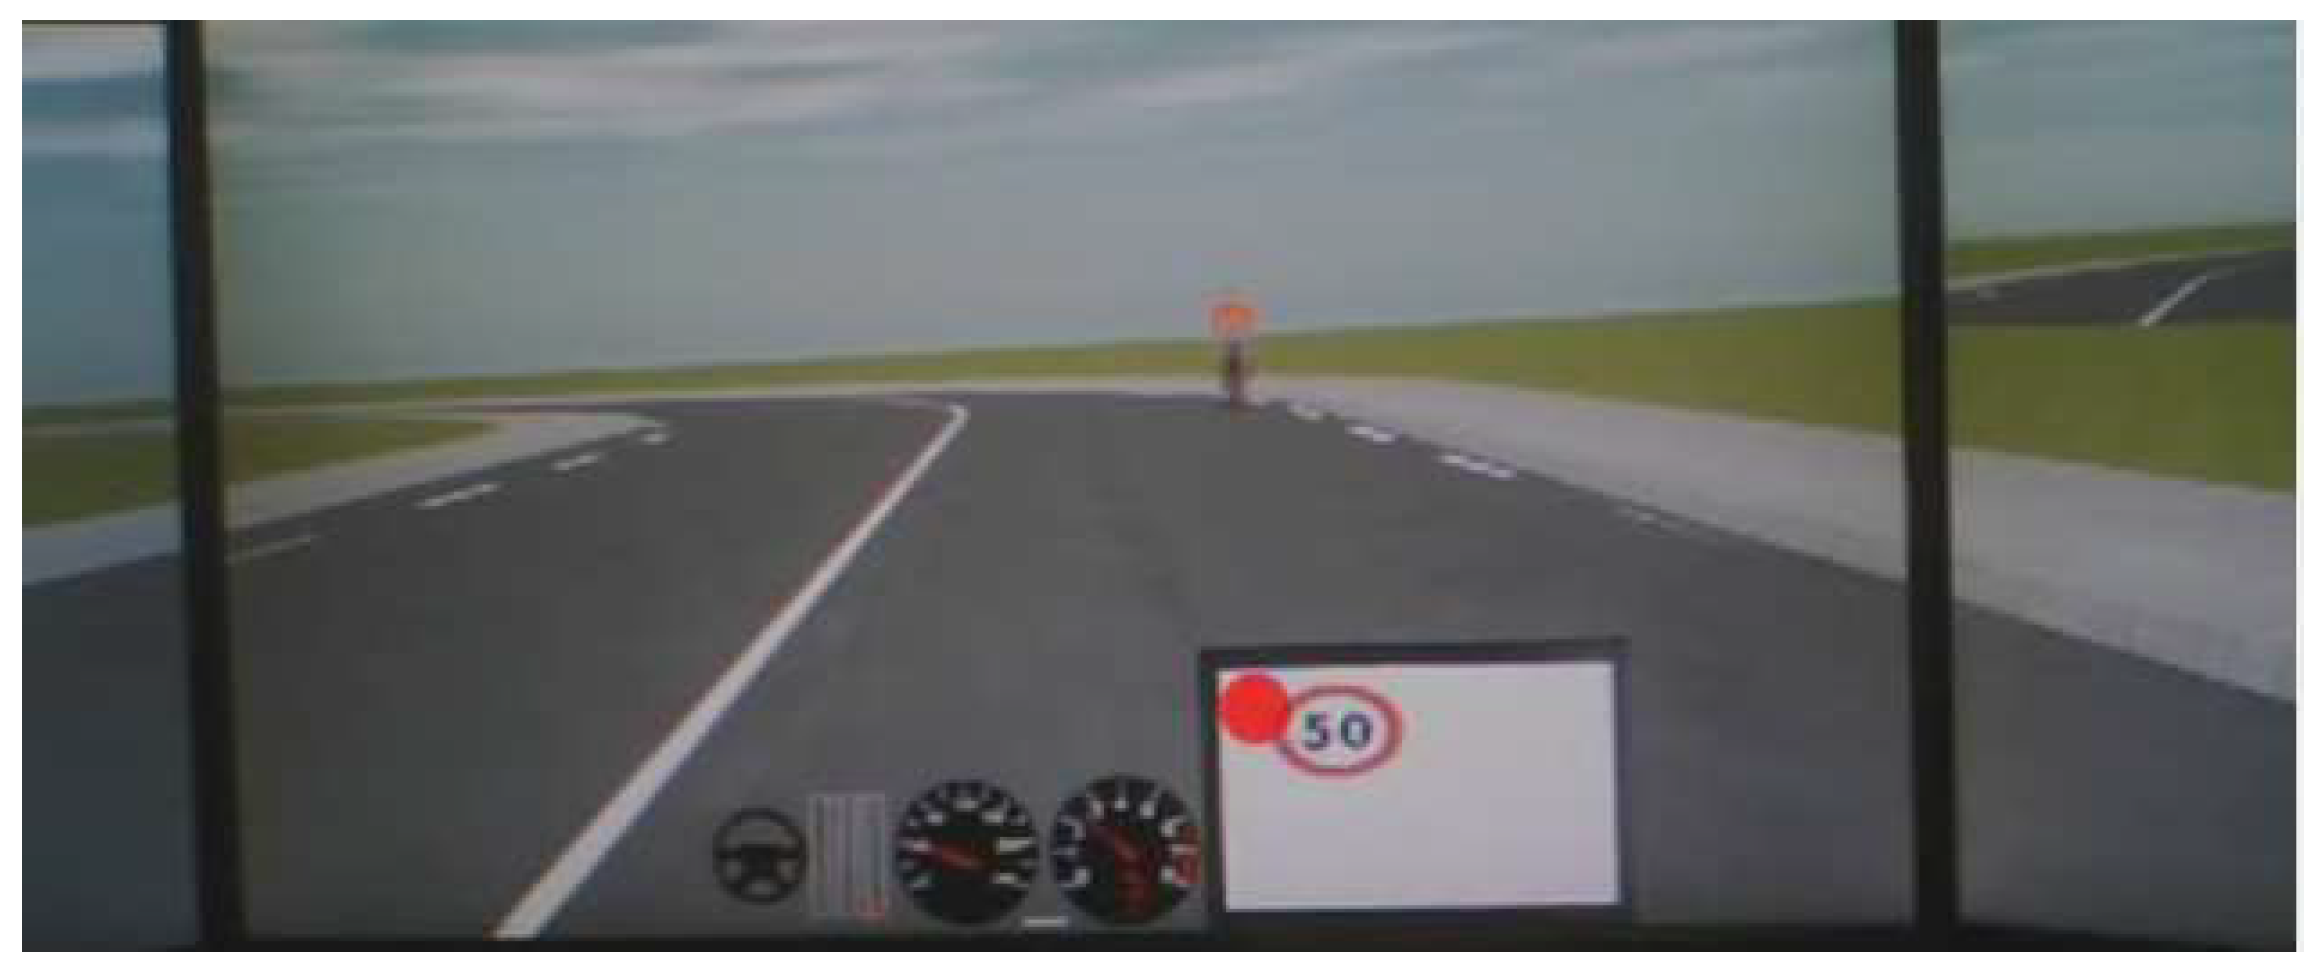
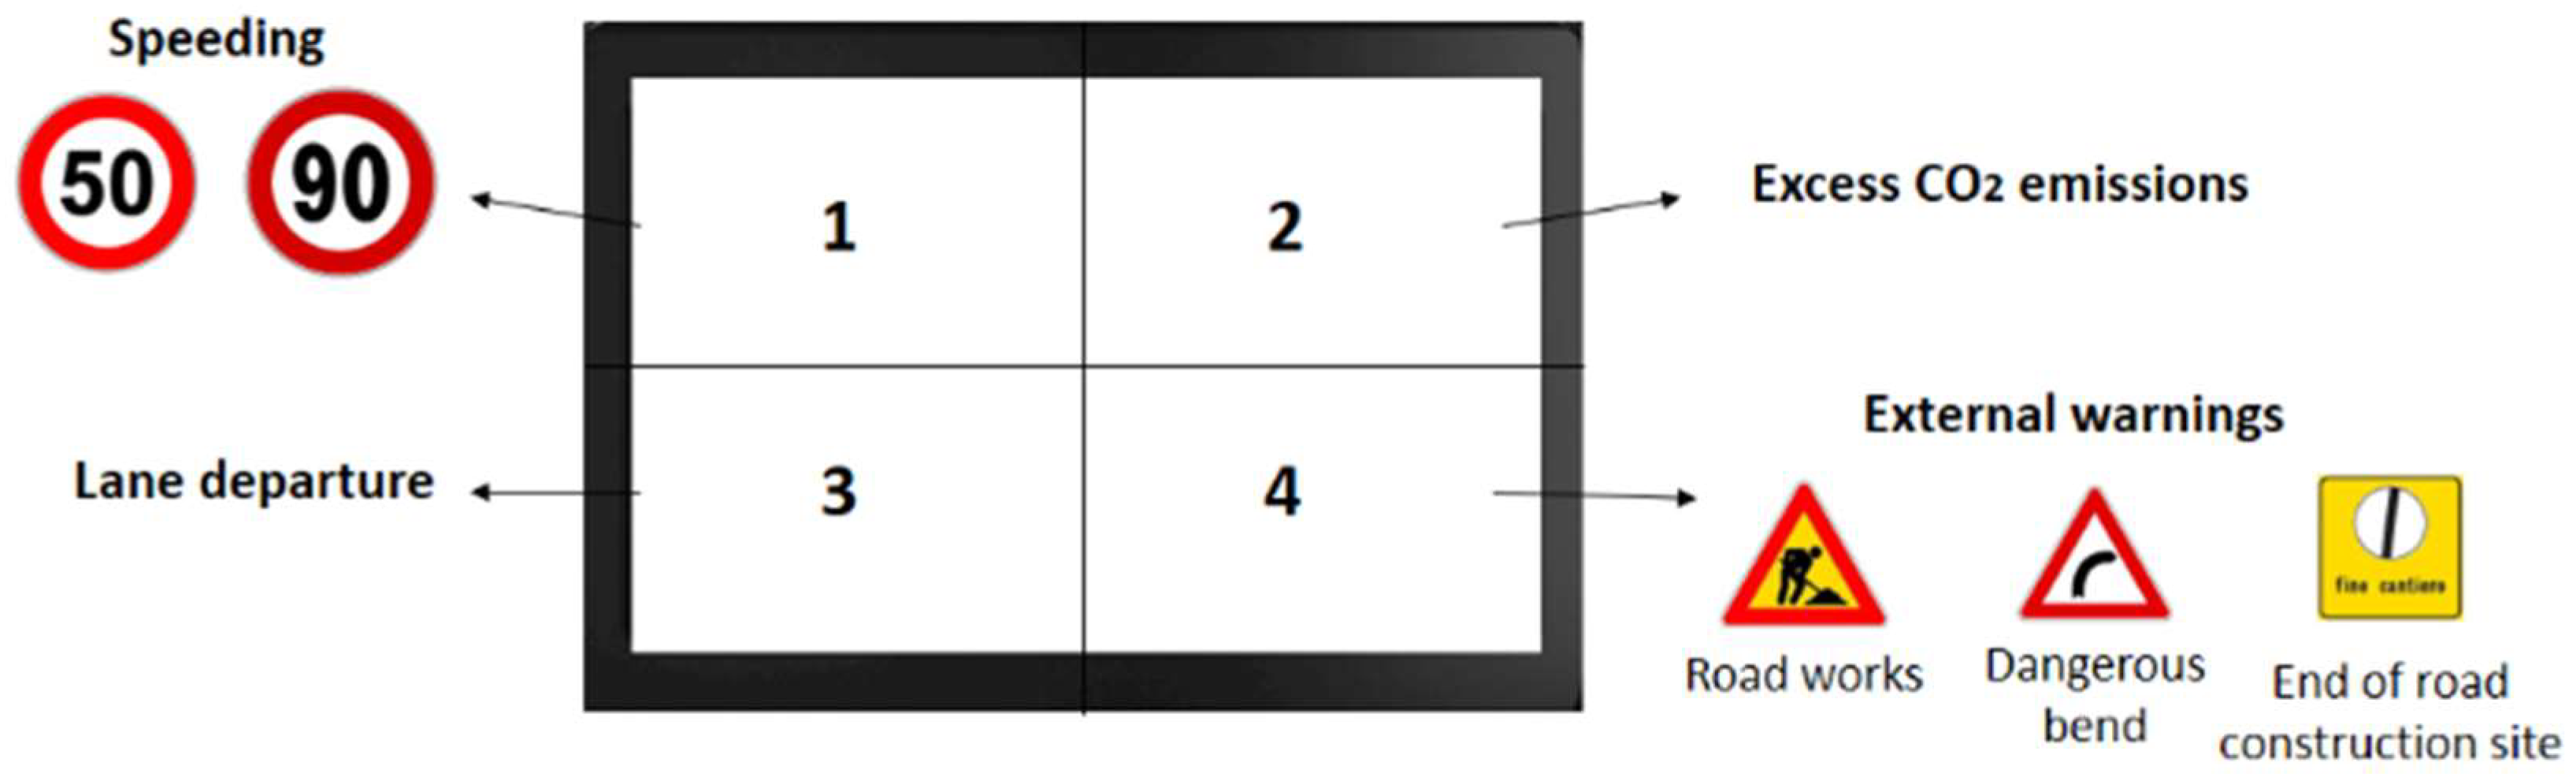
Inside the cockpit, by writing a script in Phyton language, an On-Board Unit was set up (
Figure 5) that simulates the communication between Vehicle and Infrastructure (V2I—Vehicle to Infrastructure) and that, in particular, indicates the warnings for exceeding the speed limit and for dangerous curves.
If the user does not behave incorrectly, then the OBU screen remains blank, but will display warnings as needed until the user corrects their behaviour [
37].
As shown in
Figure 5, four quadrants can be distinguished. Quadrants 1, 2, and 3 display the feedback related to inappropriate and/or dangerous driving behaviour. In quadrant 4, on the other hand, informative feedback on some critical aspects of the layout is shown.
2.5. Questionnaire NASA TLX
The workload was deduced during the experiment by means of physiological variables related to visual behavior. However, at the end of the driving activity, drivers (in addition to the general forms mentioned above) were given the NASA TLX questionnaire, with which it was possible to verify the consistency between subjective and physiological measurements.
In particular, users completed the questionnaire at the end of the first two driving conditions called “Control” (without aids by the OBU) and at the end of the last two conditions called “Smart” (characterized by the presence of the OBU).
As is well known, the main feature of this method is its multi-dimensionality, since it consists of six subgroups representing variables somewhat independent: mental, physical and temporal demands, frustration, effort, and performance. The multidimensional scale provides an overall workload score on a 100-point scale, based on the weighted average of the six subscales.
At the end of the survey, the overall workload (OW) was determined, which is the total workload to which each user was subjected.
2.6. One-Way ANOVA
The data set regarding the users’ activity was then processed by a one-way ANOVA to establish how they were affected by the absence/presence of smart alerts or the absence/presence of cyclists and which of these is the most critical.
Concerning the independent variable, the following were considered:
- −
Driving condition (2 levels: Control and Smart);
- −
Traffic (2 levels: no cyclists, with cyclists)
The response variable (or Dependent Variable DV) is always represented, alternatively, by the following:
- −
Driver’s Visual Acquisition (DVA): represents the percentage of time the driver does not gaze at the road to acquire information from road signs. It was assessed by calculating the ratio of two times f and t, where f is the time of fixation necessary for a driver to acquire information on signs and t is the travel time of the same user. In this trial, the DVA has been calculated for two types of vertical signal (dangerous curve and speed limit), distinguishing the four conditions already illustrated.
- −
Speed Violation (SV): indicates the speed of the vehicle.
- −
Overall Workload (OW): The NASA TLX questionnaire was administered to each user at the end of the guide in control conditions and at the end of the guide in smart conditions.
The reliability of the results depends on the satisfaction of the assumptions based on ANOVA analysis. In this case, the assumptions regard the following:
- −
The dependent variable must be measured at the continuous level.
- −
The two within-subjects’ factors (i.e., two independent variables) should consist of at least two related groups that indicate that the same subjects are present in both groups.
- −
The observations are independent, without relationship between the observations in each group or between the groups themselves.
- −
Absence of significant outliers.
- −
Tests for normality by means of residuals.
- −
Verification that the sphericity, i.e., the variances of the differences between all combinations of related groups, were equal. When these conditions are violated, the Mauchly tests for sphericity can be performed, adjusting the analysis by a correction criterion, such as the Greenhouse–Geisser method.
The following pairs of null or alternative hypotheses must be verified:
H0. The means of all Driving condition or Traffic group (Control or Smart, without or with cyclists) are equal.
H1. The mean of at least one Driving Condition or Traffic group (Control or Smart, without or with cyclists) is different.
The authors ascertained the significance of the results with a 95% confidence level.
3. Results and Discussion
Statistical processing using ANOVA has produced some interesting results. In detail, by representing the results using box-and-whiskers plot graphs in the following figures, some interesting deductions can be drawn.
3.1. One-Way ANOVA with Dependent Variable DVA50
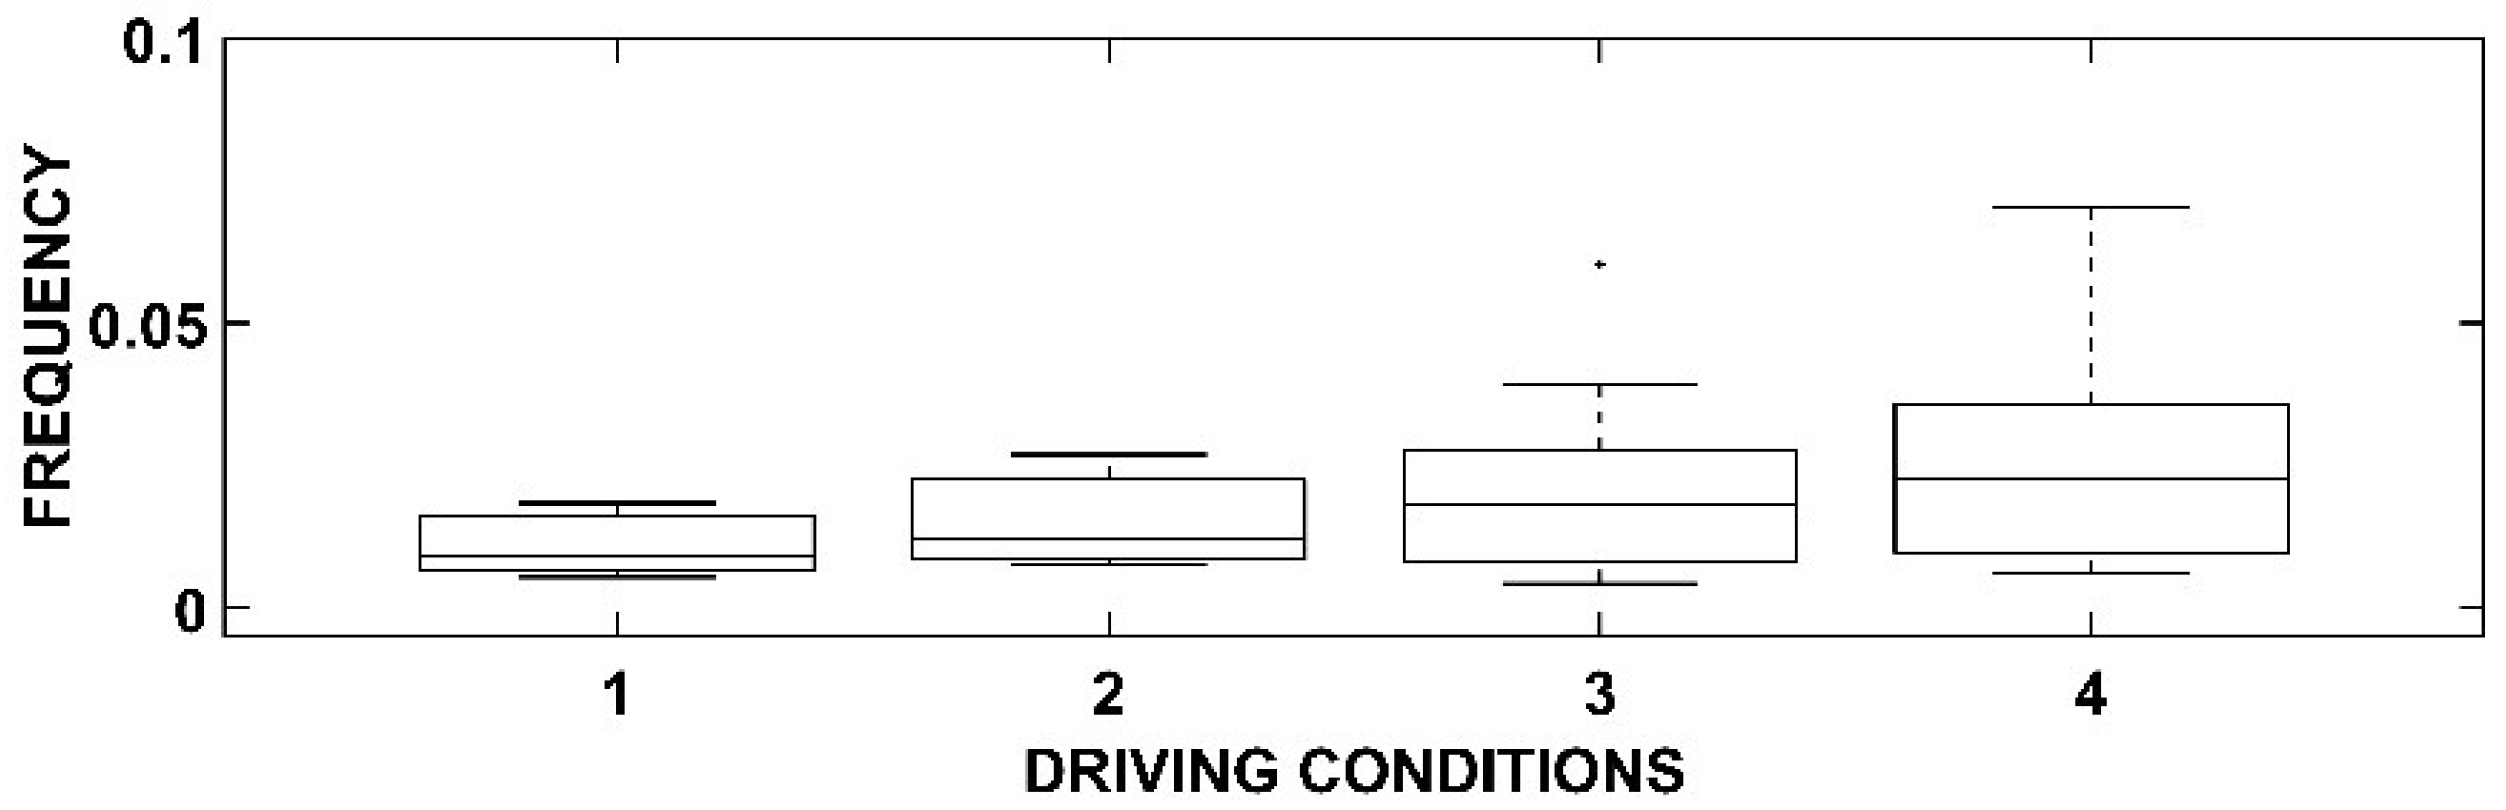
In
Figure 6, the DVA50-dependent variable related to the vision of the signs indicating the limit of 50 km/h was analyzed. The four Driving Conditions reported in abscissa, as already discussed, refer respectively to: (1) Control condition, without cyclists; (2) Control condition, with the presence of cyclists; (3) Smart condition, without cyclists; and (4) Smart condition, with the presence of cyclists.
The result of the ANOVA, also reported in
Table 1, evidences that there are not statistically significant deviations between the four conditions. This means that users, in any condition, always pay attention to this type of warning in the same way. From this point of view, the use of an OBU does not have an advantage over traditional signage but does not cause further load to the task. The interpretation of this result is not easy: most likely, the user who goes along a very winding road may not consider the speed control important, since it is the same geometry that constrains him to maintain a certain driving behavior.
The positive aspect of this result is that the OBU does not lead to an overload of work, even in conditions of greater stress that refer to the scenario in which it is necessary to overcome cyclists (condition 4), although the frequency of observation of the signal is slightly higher and there is a wider dispersion of data.
3.2. One-Way ANOVA with Dependent Variable DVAdang
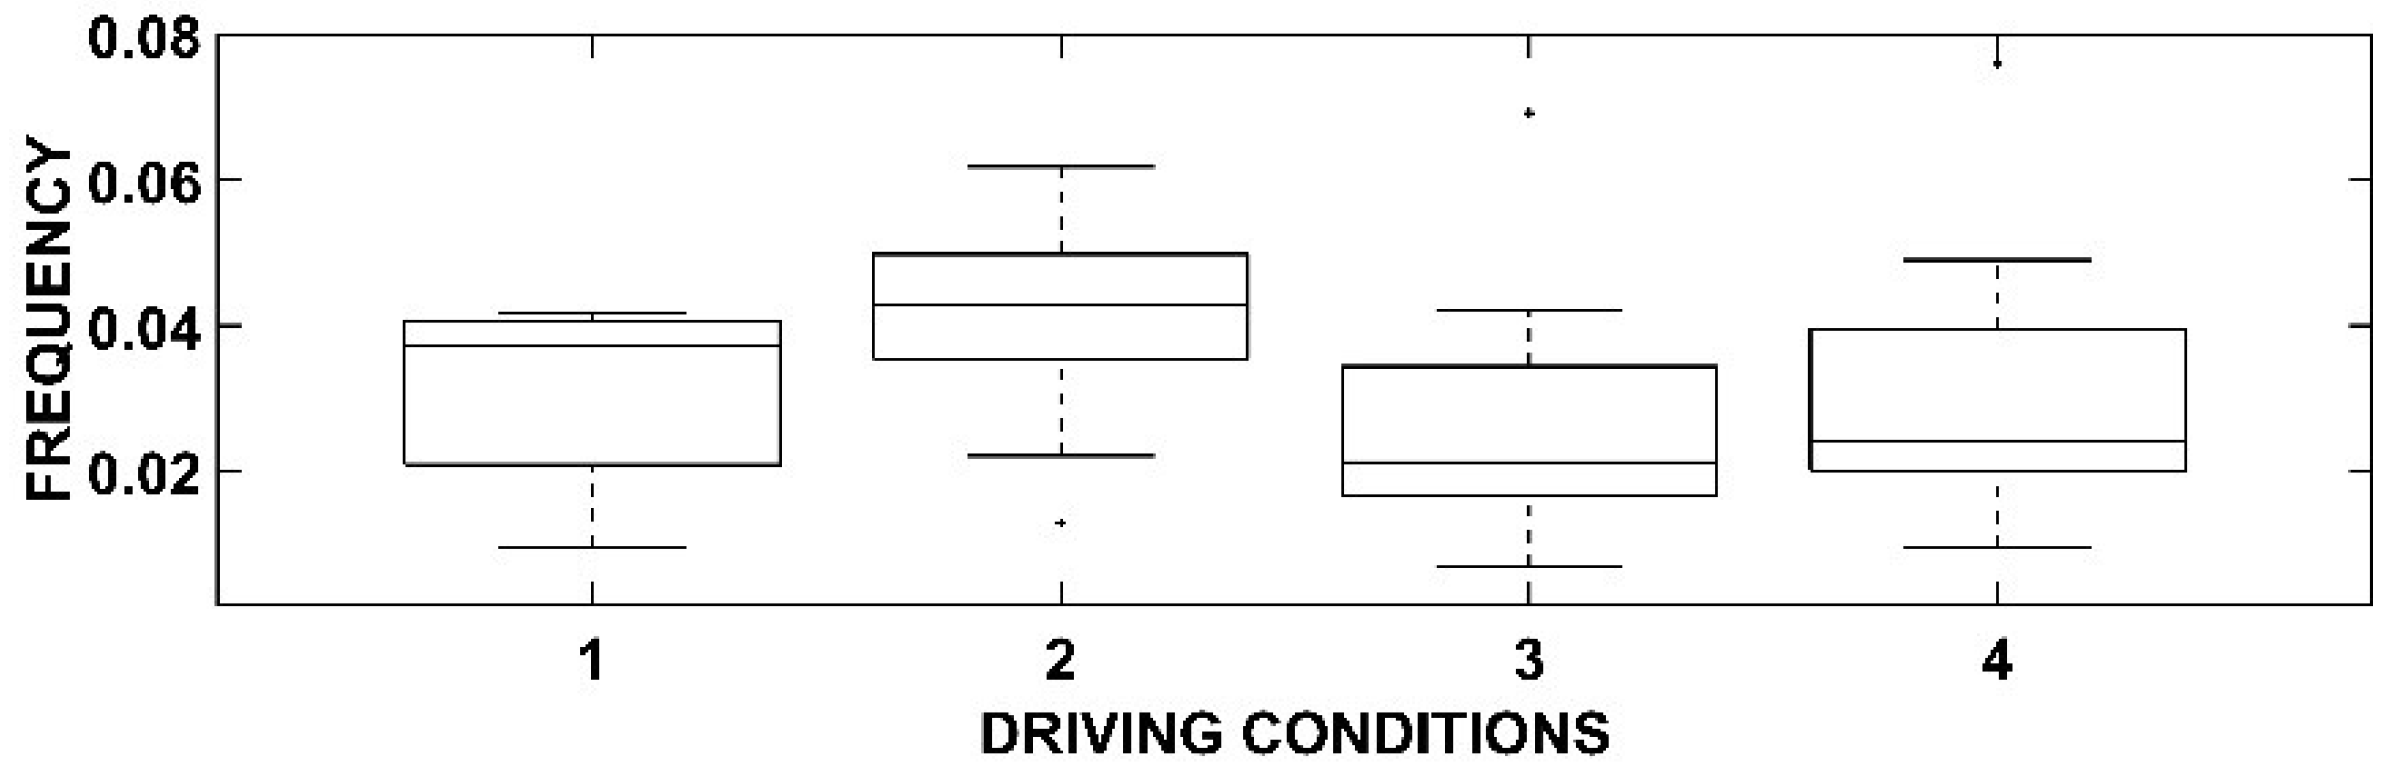
In
Figure 7, the DVA-dependent variable related to a dangerous curve warning has been analyzed. The four Driving Conditions reported in abscissa refer, as in the previous case, respectively to: (1) Control condition, without cyclists; (2) Control condition, with the presence of cyclists; (3) Smart condition, without cyclists; and (4) Smart condition, with the presence of cyclists.
The outcome of the ANOVA, also shown in
Table 2, shows that, even in this case, there are not statistically significant deviations between the four conditions with the only exception of Condition 2 (Control Condition with the presence of cyclists) and Condition 3 (Smart Condition without cyclists). It is possible to see that 3 is a better scenario because the signal sampling rate is statistically lower than Condition 2. The result, at least within these two scenarios, is slightly different from the previous case, as the user needs to find information on an insidious curve, especially in the presence of cyclists and in the absence of an instrumental aid such as the OBU.
The positive aspect of this result is that the OBU does not lead to an overload, even in conditions of greater stress that refer to the scenario in which it is necessary to overcome cyclists (4).
3.3. One-Way ANOVA with Dependent Variable Speed Violation
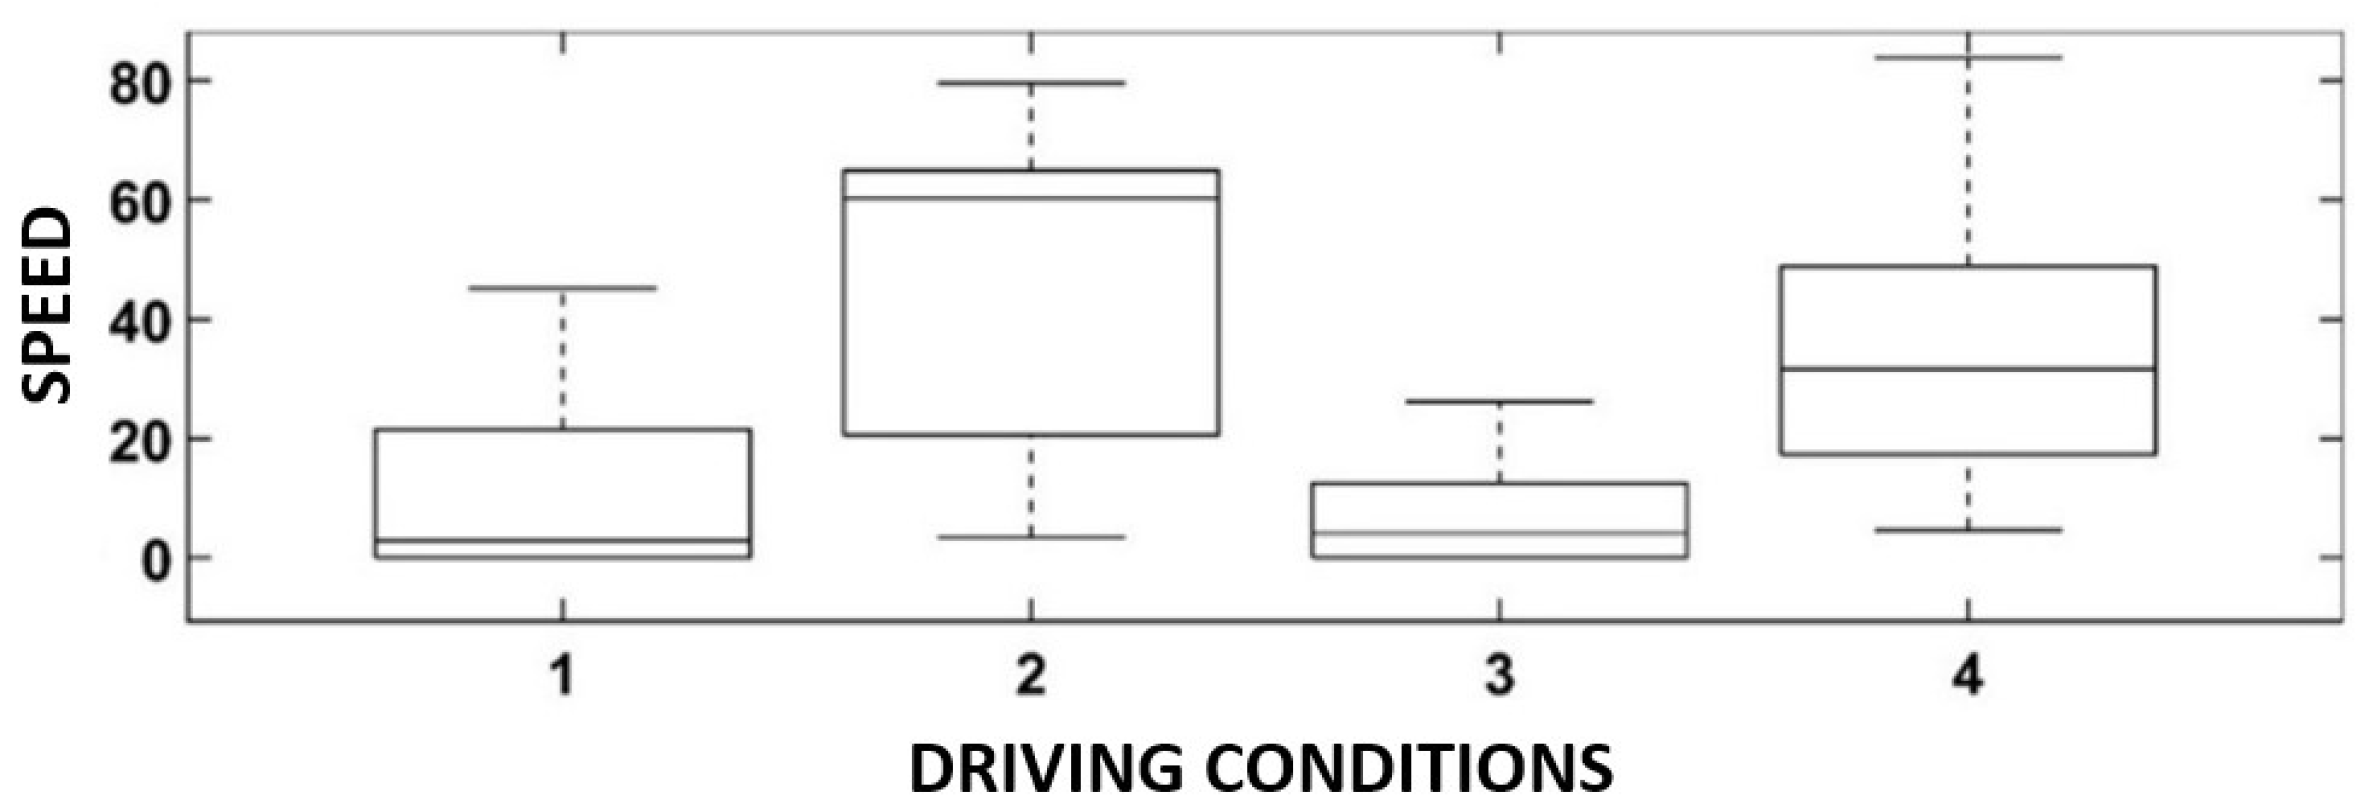
In
Figure 8, the dependent variable Speed Violation was analyzed for exceeding the road speed limit set at 50 km/h.
The four Driving Conditions reported in abscissa refer, as in the previous cases, respectively to: (1) Control condition, without cyclists; (2) Control condition, with the presence of cyclists; (3) Smart condition, without cyclists; and (4) Smart condition, with the presence of cyclists.
The outcome of the ANOVA, also reported in
Table 3, shows a statistically significant distinction between the conditions in which there is the presence of cyclists (2 and 4) compared to those in which the driver is isolated.
In this situation, the OBU did not exert any influence on driving behavior, even if the user would have had to manage a complex maneuver, such as cyclists passing. This critical issue was addressed by the driver based only on his driving skills and information that transfers the context directly through the visual channel. A useful consideration could regard the driving conditions 2 and 4: in both, there is the presence of cyclists and, although there are no statistically significant differences, it is noted that the average values of speed without the use of on-board equipment are significantly higher than those recorded when the driver could count on the help of the OBU. This means that in a fairly complicated driving environment, the OBU helps mitigate misconduct.
It is worth making a final assessment of the fact that there is a greater speed of users in the presence of cyclists. This behavior, at first sight unjustified, is explained by the fact that the driver has the need to limit in space and time a maneuver that, on this type and geometry of road, is very dangerous and achieves its goal by increasing speed.
3.4. One-Way ANOVA with Dependent Variable Overall Workload
In this case, for simplicity, no graphs are shown, but the data is presented in
Table 4. The analysis was carried out considering only two scenarios: absence and presence of the OBU. The results lead to a Prob > F of 0.681 (F value = 0.17) and, therefore, there is no statistically significant difference between these two conditions. The result should have a positive meaning and is in line with the findings deduced with the other indicators. The OBU itself does not represent an additional load on the driver’s capacity. To obtain an answer, however, on its actual usefulness, this index is not very representative. Please note that NASA TLX is determined through a questionnaire after the test and, although it takes into account many aspects of the task, it does not allow for recording its value continuously during travel.
Comparing all the cases presented here, it emerges that it is not possible to assign a value to the usefulness of an OBU in general terms. This plays a certain positive role only in certain contexts that must be neither too simple (the driver does not need to find more information), nor too complex, otherwise the driver does not have the ability to process additional information.
In the latter case, it can be said that the OBU never represents a primary channel for knowledge of the external context but is used as a support to the process of acquiring information only when these are not excessive.
The collected data were processed only in statistical terms (by means of an ANOVA) and produced the results previously reported. This procedure has some advantages, such as the ease of reading by other subjects, such as the infrastructure managers. These are interested in understanding very clearly the path from the collection of raw data to the production of results. The ANOVA guarantees these peculiarities. However, there are some disadvantages, too: it is not possible to make predictions about future events and for very significant quantities of data (big data), there are more expeditious procedures, such as those belonging to the Artificial Intelligence sector. The latter, however, return an output starting from an input without allowing a third subject to understand the evolution of the calculation (black box) and with few data, the results are unreliable.
Scientific literature has directed its efforts in two directions: on the one hand, it has studied the technological aspect of driving aid devices in depth, relegating the human factor to a secondary component of the entire system. This aspect is clearly seen with modern cars where ADAS are not always able to be useful in all circumstances and almost never for all types of users.
The second aspect is that these instruments are not tested in multiple scenarios but only in standard conditions, often far from the real ones. In fact, a particular OBU could be of great help in acquiring road signs, but could overload the user with information when the weather or visibility conditions are extremely critical.
The procedure illustrated in this research, based on the determination of indices related to visual behavior, can be applied to test any driving scenario in order to identify the most dangerous situations for a certain class of users.
4. Conclusions
This paper deals with the study of the effect of an On-Board Unit within a vehicle in order to assess its effectiveness or its harmfulness in a fairly complex driving environment.
Compared to other research reported in the state of the art, here the authors have introduced different levels of difficulty in the road object of experimentation, evaluating the driving behavior in terms of performance indicators. The results reveal a situation that is not easily generalizable a priori. In some situations, the stress element was so modest that it was handled very easily by the user, without any need of the OBU. In much more complex situations, the OBU was neglected because the user had presumably reached the limit of their ability to process additional information. In intermediate conditions, however, the OBU was very useful as the user improved its performance.
The significance of this research is that it is very difficult to ascertain quantitatively and in general terms the effectiveness of these driving aids. The preeminent role is always assumed by the road and, in particular, by its geometry that must be immediately understandable without additional overload when there are particular traffic components or difficult weather conditions.
The research suggests a practical application to both drivers and road managers. In case of critical findings in the performance of drivers, these subjects can play an active role to improve road safety, both refinements of instrumentation (for example, software dedicated to particular road types or traffic conditions) introducing mitigation elements into the infrastructure (additional signage, tighter speed limits, or -traffic calming devices).
The next steps of the research will tend to evaluate further scenarios considered highly likely and to identify more accurate summary indices of user performance.


