Abstract
The paper presents a set of Direct Strength Method (DSM) formulae for cold-formed stainless steel I-section beams. On basis of a carefully calibrated FE model for stainless steel open-section beams featuring local-global interaction buckling, an extensive database was first established. The existing DSM formula of the best prediction performance was commented on for its drawbacks. For improved strength prediction, a traditional-form DSM formula was proposed first, and novel two-phase DSM formulae were derived on basis of a deep insight into the varying trend of the member strengths. The two-phase DSM formulae were found to be very powerful predictors yielding more accurate strength predictions over the whole range of slenderness and avoiding undue conservatism for intermediate and short members. A considerable boost in design strength by up to 39% can be achieved with the two-phase DSM formula. The DSM curves were developed with a due reliability level to fit into the current design codes.
1. Introduction
Direct Strength Method (DSM), which originated from the research of Hancock et al. [1] and was fully developed and formally coined with the current name by Schafer et al. [2], is a new generation method for design of cold-formed steel members after the traditional Effective Width Methods (EWM). Compared with EWM, DSM avoids the iterative and cumbersome calculation process for effective section properties, and makes a highly efficient and convenient design process by (i) directly predicting the strength of a member from proper design curves in combination with the material yielding stress and section buckling stresses, (ii) making a more rational and accurate buckling analysis for the whole section instead of on a discrete element basis and (iii) incorporating calculation power of the computer by adopting numerical tools such as ThinWall [3], CUFSM [4] and GBTUL [5] in buckling analysis of sections. The simplicity and efficiency of DSM make it widely suitable (e.g., for complex cross-sections which would be too cumbersome or impossible to design using EWM) and adaptable to various conditions. Until now, researchers have kept extending the scope of DSM, from the very first local, distortional, and global buckling DSM formulae for cold-formed steel members [2,6,7], to those covering shear buckling [8,9], for perforated members [10], and those covering stainless [11,12,13,14] and aluminum members [15]. This list goes on.
While the DSM method gained rapid acceptance in cold-formed steel design codes, e.g., in North America standard AISI S100 [16] and Australia/New Zealand standard AS/NZS 4600 [17], the development of the DSM formula for stainless steel members is still underway. Among other structural members, stainless steel columns have received extensive study, and the corresponding DSM formulae for local, distortional, and sectional-global interaction buckling [11,12,13] were proposed. As for stainless steel beams, research efforts have mainly been dedicated to hollow sections [18,19,20,21,22,23,24] to study the bearing strength of such sections under local buckling effect (distortional and global flexural-torsional buckling is not relevant for such members) and crippling and openings in web. Relatively limited research was seen on stainless steel open-section beams. Welded I-sections were studied experimentally [25,26] and numerically [27], most of which were stocky and demonstrated inelastic strength reserve. Zhou et al. [28] studied the strength of stainless steel compact I-sections failed by shear buckling, and proposed methods to amend the current design guidance. Stainless steel plate girders (IPGs) featuring stocky flanges and slender web elements with or without transverse stiffeners were studied, the failure mode of which was dominated by lateral-distortional buckling [29] and shear buckling [30] respectively. Cold-formed lipped channels were tested in bending by [31,32], which demonstrated predominant distortional or distortional-global interaction buckling mode. Karthik et al. [33] studied close-section beams built-up with face-to-face channels, for which no global buckling was incurred, and the sectional buckling involved both local and distortional buckling modes of the constitutive channels. A systematic experimental and numerical study was made in [34,35] on stainless steel I-section beams (made up of cold-formed back-to-back channels) which demonstrated purely local-global interaction buckling. An evaluation was also made by [35] on the existing design formula, including the existing DSM formula in design codes and literature. It was found that the EWM design formula failed to reflect the local-global interaction buckling behavior and predicted generally optimistic strengths for sections of high slenderness. The existing DSM formulae were not satisfactory either, rendering obviously conservative predictions for medium- and short-length members.
Based on the above review, this paper intends to propose revised DSM formula for local-global interaction buckling of stainless steel I-section beams. The paper is organized as follows. An interpretation of the concept and format of DSM is given in Section 2, which is important for understanding the newly proposed formula in the following section. A databank from [35,36] is collected and new DSM design formula is proposed in Section 3 for improved design predictions. A traditional format DSM formula is first proposed with a prescribed reliability level, which makes a better predictor than the currently existing DSM formula. Furthermore, novel two-phase DSM formulae are proposed which offer an excellent predictor for local-global interaction buckling of stainless steel I-section beams. Conclusion remarks are made in Section 4.
2. Concept of DSM Design Method
2.1. General Format of a DSM Formula
The underlying concept of DSM is that the strength of a section can be predicted directly with some properly chosen design formulae fu = F(fcrl, fcrd, fcro, fy), where fu is the ultimate strength of a member, fcrl, fcrd, fcro are critical buckling stresses of the local, distortional and overall buckling modes as relevant for the member considered, and fy is the material yield stress. The universally accepted column curves and beam curves in design codes can be deemed as an original version of the DSM formula, by which the inelastic overall buckling strength of a column/beam can be determined from a slenderness value defined in terms of the material-yielding stress fy and the member elastic overall buckling stress fcro.
A general DSM formula further accounts for the sectional (local or distortional) buckling effect, as exemplified in Equation (1) for beams, where Mu is the ultimate capacity of a beam, a, b and c are properly determined constant parameters, Mref is the reference capacity of a member without influence from sectional buckling, λs is normalized slenderness defined with the ratio between reference capacity Mref and the sectional (local or distortional) buckling moment Mcrs as shown in Equation (2). The normalized slenderness λs is essentially an index of the level of sectional buckling experienced by the member before attaining the reference capacity Mref. It can be appreciated that the general format DSM in Equations (1) and (2) express the erosion effects of sectional (local or distortional) buckling on the reference member capacity Mref. Therefore, the ultimate strength Mu calculated from the formula is not allowed to exceed Mref.
A practical DSM formula, e.g., those codified in AISI S00 [16] and AS/NZS 4600 [17], is typically derived by fitting a set of parameters a, b, and c to a strength database, which is composed of experimental and/or numerical results reflecting the relevant buckling modes. The geometric and material limitations of sections included in the database are used to define ‘prequalified sections’ for the proposed DSM formula. In practice, if sections outside the scope of ‘prequalified sections’ are to be designed with the DSM formula, a more conservative resistance factor is generally required to be used [16,17], i.e., a higher safety margin is used in comparison with the prequalified counterparts.
2.2. Accounting for Interaction Buckling Effect with DSM
For a beam section without sectional buckling, the upper bound of its bearing capacity is the lesser of the section yielding moment My and the inelastic overall buckling moment Mo, as shown in Figure 1. Note that the first yielding moment My is generally adopted as an upper bound of cold-formed steel sections, although some extent of plastic reserve beyond My can be obtained in cold-formed sections of low section slenderness [18].
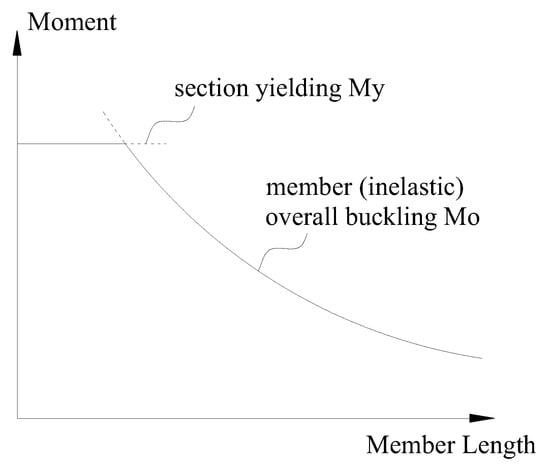
Figure 1.
Upper bound strength of beams without sectional buckling.
It is evident the upper bound strengths, My or Mo, shall be used for the reference member capacity Mref in Equation (1). For members of short span or closely spaced bracings, the material yielding effect is dominant and My should be taken for Mref. In this case, the resultant strength prediction Mu from Equation (1) reflects the section strength of a member. As the span of a member increases, the overall buckling effect starts dominating the member failure, and a span-dependent inelastic buckling moment Mo should be used for Mref. In this case, the DSM prediction Mu from Equation (1) reflects the overall buckling strength of a member under the influence of sectional buckling, i.e., the member strength under the sectional-overall interaction buckling effect.
Throughout this paper, the Mref term is taken as the lesser of My and Mo, as mathematically expressed in Equation (3). In contrast to carbon steels, stainless steel demonstrates rounded stress-strain curves without a distinct yielding point, from which yielding stress fy can be identified. Therefore, the yielding moment My of stainless steel sections is calculated from Equation (4) where f0.2 is the proof stress corresponding to 0.2% plastic strain, and W is the section modulus of the gross cross-section. The inelastic overall (flexural-torsional) buckling moment Mo should also be calculated with due consideration of the gradual yielding feature of stainless steel. The tangent modulus expression in Australian standard AS/NZS 4673 [37], see Equation (5), is adopted for Mo in this paper, in which Cb is a moment modification factor, (Ly, Lz) are effective lengths for lateral bending and twisting, (Iy, Iw, J) are the inertia moment about the minor axis, warping constant, and torsional constant of the gross cross-section, (G0, E0) are the initial shear modulus and Young’s modulus of the material, and Et is the tangent modulus corresponding to a stress level of fo, as calculated from Equation (6). Iteration is necessary to determine the Mo and fo values because Et is to be calculated at Mo, which is the object of the calculation.
From Equation (2), two types of slenderness can be defined depending on which value of (My, Mo) is used for Mref, see Equations (7) and (8). Note that the subscript ‘s’ in Equation (2) is replaced with ‘l’ representing local buckling, e.g., Mcrl and fcrl = Mcrl/W represent the elastic local buckling moment of a cross-section and the corresponding local buckling stress. In the context of this paper, the slenderness λl defined in Equation (7) is termed section slenderness reflecting the erosion effect of local buckling on the section strength, and the slenderness λol defined in Equation (8) is termed relative slenderness reflecting the erosion effect of local buckling on the member overall buckling load. The two slenderness can be defined for the same member, reflecting different aspects of the member’s behavior.
3. DSM Formula for Stainless Steel I-Beams
3.1. A Database for Local-Global Interaction Buckling of Stainless Steel Beams
Detailed FE models based on the shell element of ABAQUS were developed in [35] to replicate the local–global interaction buckling of stainless steel I-beams. The FE models were calibrated accurately against a full series of test results in the companion paper [34], showing excellent agreement in terms of ultimate capacities and post-buckling deformations. Parametric studies were therefore carried out to expand the available structural performance data over a wider range of sectional and overall slenderness values. The resultant databank of member failure strengths is adopted here as a basis for DSM formula derivation. Regarding the experimental results in [34], it’s noted that a couple of inevitable but important affecting factors, for example, the warping constraints introduced by localized clamping of the web at loading points, were involved in the experimental process, the effect of which could not be accurately accounted for in the existing design provisions [35]. Therefore, the parametric study results obtained with more clearly defined boundary conditions, serve as a better basis for assessment and derivation of the design formula.
Sections adopted for the parametric study [35] were named using the convention “Alloy-I-L××”, where the Alloy was austenitic S30401, ferritic S44330, or lean duplex S32101 as per the ASTM unified numbering system [38] as briefly referred here as 304, 443, and 2101 respectively, and the L×× denoted the nominal local buckling slenderness. For example, 304-I-L11 represents an I-section made of 304 alloys with a nominal slenderness λl = 1.1. The sections used for the parametric study are listed in Table 1, using the dimensional nomenclature illustrated in Figure 2. The E0, f0.2, and n in Table 1 are respectively Young’s modulus, nominal yielding stress, and Ramberg-Osgood index of the alloy used, which are also employed in the later sections in strength prediction formulae.

Table 1.
I-sections for FE parametric study.
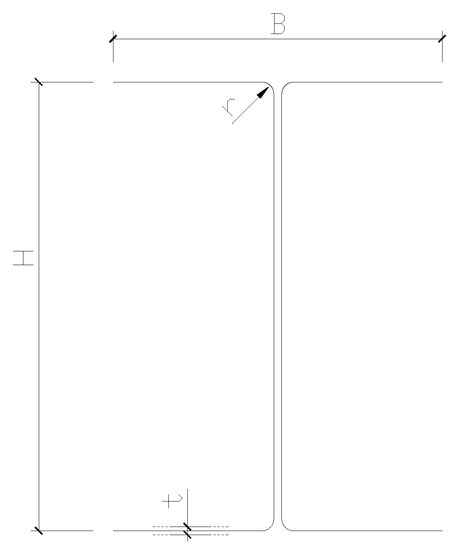
Figure 2.
Nomenclature for section dimensions.
For each of the sections, a series of member lengths were chosen to cover a target overall slenderness range of 0.5~2.0 (a lower bound of 1.0 m was used for the member length to avoid failure by shear buckling). Flexural and torsional geometric imperfections were introduced in the parametric study. To introduce a reasonable variation in the effect of geometric imperfections, an initial twist rotation of 0.5° and 1.0° were determined on basis of the measured imperfection statistics [35] and were used for each specimen.
The ultimate strengths obtained from the parametric study are collectively reproduced in Table 2, where L is the member length, and M-FE05 and M-FE10 are ultimate strengths corresponding to the 0.5° and 1.0° initial rotation imperfections.
Table 2.
Parametric study results for cold-formed stainless steel beams [36].
3.2. Current DSM Formula of the Best Performance
The ultimate strengths obtained from the parametric study were compared in [35] with the strength predictions from the EWM design formula in Australian/American and European codes for stainless steel structures. It was found that the methods were incapable of capturing the interaction buckling effect properly, affording overly optimistic strength predictions for beams of high section slenderness.
Existing DSM formulae were also evaluated in [35] about their applicability to local-global interaction buckling of stainless steel I-section beams, including the codified formula in AS/NZS 4600 [17] for carbon steel beams, see Equation (9), and the formula proposed in the literature [12] for stainless steel columns. The DSM formula proposed in [12], which was converted into beam format as Equation (10), was found to be the best predictor among others. However, it was still not working well in that (i) the formula makes overly conservative predictions for short members but unsafe predictions for long members, it’s especially so in cases of high sectional slenderness, and (ii) the overall reliability level offered by the formula was not adequate. A reliability analysis [35] showed that for a target reliability index β = 2.5, the required strength reduction factor φ was 0.78, which was considerably lower than the typically prescribed value of 0.9 by current design codes. This implied that the design formulae (10) were improperly optimistic due to their inability to properly capture the local-global interaction buckling effect in the stainless steel I-section beams.
3.3. Proposed DSM for Stainless Steel I-Section Beams
The data of I-section member capacity in Table 2 were normalized against the reference capacity Mref, which should be the lesser of the yield moment My (see Equation (4)) and the inelastic overall buckling capacity Mo (see Equation (5)). Note that for the I-section specimens involved in the parametric study, the inelastic overall buckling moments Mo were all below the yield moment My, and therefore the reference moment Mref actually took the value of Mo. Figure 3 plots the normalized strengths M/Mo against the relative slenderness λol (see Equation (8)). This graph demonstrates how the member capacity is reduced from the inelastic overall buckling strength (Mo) with increasing relative slenderness λol. A globally descending trend in the data band is observed which reflects a further reduction in strength as a result of increased relative slenderness (λol). There is no obvious clustering per alloy type, and the collection of data points demonstrates quite a high scatter (variance).
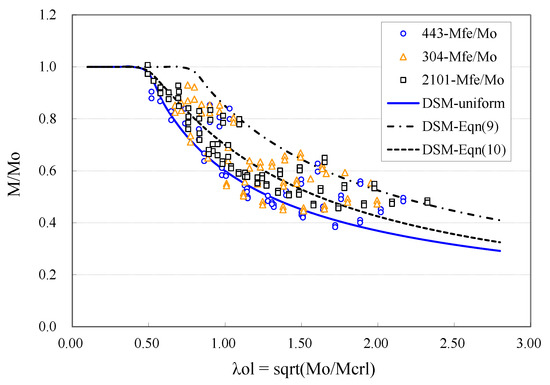
Figure 3.
FE data points of I-section beams.
A new DSM design formula was derived by fitting Equation (1) to the whole database, during which a reliability analysis process was carried out conforming to the principles established by Lin et al. [39]. Note that a reliability index β was taken as a measure of the reliability level, the calculation of which involved a series of random variables. It’s worth noting that a random variable directly related to the design formula was the professional factor P, defined as the ratio of actual member strength to the predicted strength from the design formula. The mean value and coefficient of variation of the professional factor (Pm, VP) were obtained by statistical calculation on basis of the whole strength database, and together with a prescribed strength reduction factor φ, the reliability index β could be worked out. When deriving a new design formula, target values of (φ = 0.9, β = 2.5) were adopted which fit into the existing LRFD framework. A trial and error process was used to search for a suitable design formula until the target (φ, β) values were achieved. A minimum coefficient of variation Vp was also aimed for in the search process. The resulting design formula is shown in Equation (11), with its key parameters listed in Table 3. In contrast with the novel “two-phase DSM” formula in the later sections, Equation (11) is also termed a “Uniform DSM” for local-global interaction buckling of stainless steel beams.
Table 3.
Parameters for a uniform DSM of I-section beams.
For comparison, the existing DSM formulae Equations (9) and (10), and the proposed Equation (11) in this section are collectively plotted in Figure 3, which are labeled as “DSM-Equation (9)”, “DSM-Equation (10)” and “DSM-uniform” respectively. As seen from the figure, the Equation (9) curve, codified in AS/NZS4600 for carbon steel beams, nearly follows the upper boundary of the data band and therefore is much too optimistic for stainless steel beams design. The DSM-Equation (10) curve, as transformed from the stainless steel column formula in [12], lies approximately in the middle of the data band with slightly more data points below it and fewer above it. The curve, therefore, represents the general strength varying trend reasonably well but is on the unsafe side. The DSM-uniform curve derived here for stainless steel beams lies just above the lower bound of the data band with the majority of data points above it. It serves as a proper design curve with an adequate safety margin.
3.4. A Novel Two-Phase DSM Formula
The data processing method in Section 3.3 was commonly used by researchers to derive DSM formulae. However, as observed in Figure 3 and Table 3, the resultant data points normally scatter widely and result in high variance (VP) when fitting a single design curve to the whole database. A different data processing method is used in this section to further explore the strength database. As per the definition of Mu in Equation (1), the expressions in Equation (12) can be derived. It is seen that when parameter c takes a value close to unity (which is a very common practice), the DSM prediction Mu normalized with the critical local buckling moment Mcrl follows a linearly varying trend against λol.
Beams of the same cross-section and different member lengths were collected. Recalling the slenderness definitions in Equations (7) and (8), the members should have the same section slenderness λl but different relative slenderness λol. Their strengths were normalized with Mcrl and plotted against λol in Figure 4 (two typical sections are given as an example, and only the member strengths for 0.5° initial twist rotation were plotted for simplicity). For comparison, the inelastic overall buckling moment Mo is also plotted in the figure, which takes the shape of a parabolic curve (appreciate this by recalling that Mo/Mcrl = λol2). The deviation of data points from the Mo curve implies the deteriorating effect of section local buckling. The DSM curve of Equation (10) is also plotted in Figure 4, which demonstrates a nearly linear trend as can be expected from the above analysis. Note should be taken about Figure 4 in that the member strengths normalized with elastic local buckling moment (M/Mcrl) can exceed unity due to the post-local buckling strength reserve. This is different from Figure 3 where the strengths were normalized with the inelastic overall buckling strength, which was a theoretical upper bound of strength, and therefore the values (M/Mo) were always lower than unity. Note also that the lower values of λol correspond to lower values of Mo which implies longer members.
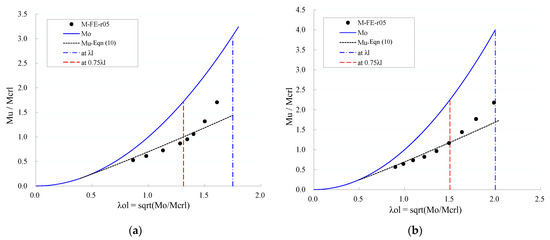
Figure 4.
Strength data from members of the same cross-section. (a) 443-I-L17 section; (b) 2101-I-L20 section.
As seen from Figure 4, the normalized strengths Mu/Mcrl of members with the same cross-section varies essentially bilinearly. It is obvious that the bi-linear variation trend cannot be well represented with a linearly varying design curve such as the Equation (10) curve displayed in Figure 4. This explains the high scatter when fitting a traditional DSM formula to the database of FE strengths in Section 3.3. It was therefore conceived that the data points from each linearly varying region should be represented with a separate DSM curve. The transition slenderness λTrans at which the slope of trend line changes was identified from each section (see Figure 4 for example), as listed in Table 4. It was found that the ratio of λTrans/λl value for all the sections was quite close to each other, with an average of 0.75. It was therefore decided that members should be distinguished at the point λol ≈ 0.75λl (this corresponds to Mo ≈ 0.56 My, see Equations (7) and (8)) and be treated separately in design. Accordingly, members of the same cross-section can be divided into ‘short’ and ‘long’ members as (i) short members λol > 0.75λl or Mo > 0.56 My, (ii) long members λol < 0.75λl or Mo < 0.56 My.
Table 4.
Transition point for a bilinear varying trend of member strengths.
All member strength results were collected as plotted in Figure 5. The database was then divided into two groups of ‘short’ and ‘long’ members as per the above-mentioned criterion, as plotted separately in Figure 6 and Figure 7. In these figures, the data points with the cross-section are interconnected with thin lines.
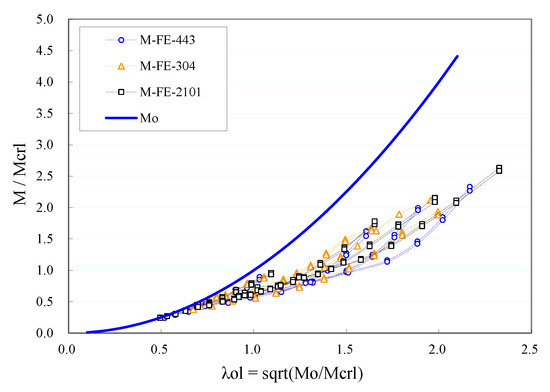
Figure 5.
All data points for I-sections.
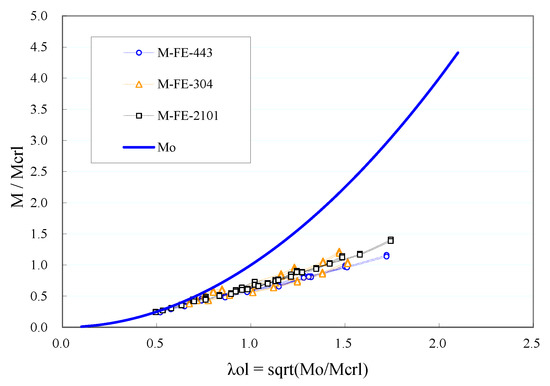
Figure 6.
Long members (λol < 0.75λl or Mo < 0.56 My).
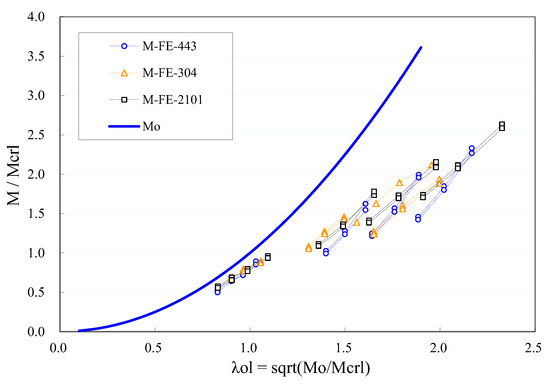
Figure 7.
Short members (λol > 0.75λl or Mo > 0.56 My).
It follows from Figure 6 and Figure 7 that (i) all the long member data points cluster closely near a straight line, and no obvious variance was caused by different alloy types nor by different section slenderness values, and (ii) for the short members, the data points cluster as per the section slenderness (λl). The data were lying on different lines, with similar slopes but offset from each other. Based on this observation, a novel two-phase DSM was proposed. For ‘long’ members, the traditional form of the DSM in Equation (1) was adopted, and for ‘short’ members, the section slenderness λl was incorporated into the parameter b of the DSM expression in Equation (1). The geometric interpretation of the b term is the y-intercept of the line in Equation (12). The ‘long members’ and ‘short members’ databases were used separately for the regression of a corresponding design formula. Similar to the work in Section 3.3, target values of (φ = 0.9, β = 2.5) were adopted when searching for a suitable design formula. A minimum coefficient of variation Vp was also aimed for in the search process. The finally proposed two-phase DSM is shown in Equations (13)–(15), with key parameters listed in Table 5. Considerably smaller coefficients of variation VP = 0.08 (for long members) and 0.05 (for short members) were obtained in comparison with that VP = 0.14 for the uniform DSM as shown in Table 3. This reflects a generally lower deviation between the predicted strength and the strength database, as a result of the two-phase DSM accurately fitting the varying trend of actual member strengths. Note that the Mlong and Mshort expressions were separately regressed from the corresponding database, and the two design curves might not accurately intersect at the point of λol = 0.75λl. Instead of directly specifying the scope of application for the Mlong and Mshort expressions, Equations (13)–(15) calculates both Mlong and Mshort values first and picks a proper one by comparison. A smooth transition between the Mlong and Mshort design curves can be achieved this way.
where , ,
Table 5.
Parameters for two-phase DSM of I-section beams.
The parametric study strengths and the strength curves predicted by Equations (13)–(15) are normalized with Mo and plotted against λol in Figure 8. As seen from the figure, the two-phase DSM gives a single curve for long members and multiple curves for short members as a result of including the variable λl in the DSM expression. Note also that the two-phase design curves in Figure 8 demonstrate a “descending + ascending” varying trend with increasing slenderness. This is different from the traditional DSM curves, which feature a monotonically descending trend with increasing slenderness (see Figure 3). The slightly ascending trend in the short-member design curves is probably a result of the development of plastic deformation and corresponding plastic strength reserve in short members.
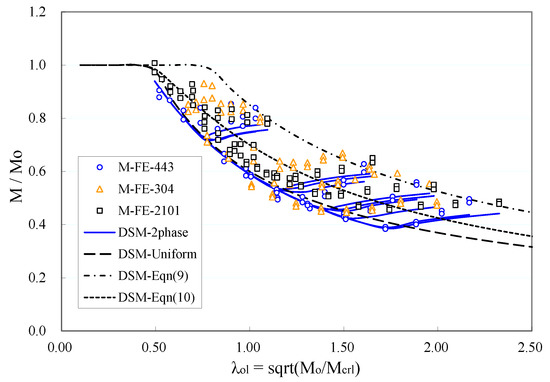
Figure 8.
FE strengths and 2-phase DSM of I-sections.
The traditional form DSM formulae in Equations (9)–(11) are also plotted in Figure 8, labeled as ‘DSM-Equation (9)’, ‘DSM-Equation (10)’, and ‘DSM-Uniform’ respectively. The two-phase DSM curves are found to lie between these traditional DSM curves. Specifically, the single curve for long members lies around the lower bound of the data band, and is close to the ‘DSM-uniform’ curve. The multiple curves for short members start from the lower bound and pass through the body of the data band until reaching the upper bound. The shape of the two-phase DSM curves is found to follow the data points very closely.
Figure 9 displays the member capacity versus member length graph for specimens of the same cross-section (2101-I-L20 for example). The Mlong and Mshort expressions in Equations (13) and (14) are plotted as the ‘Mu-DSM-2Phase(long)’ and ‘Mu-DSM-2Phase (short)’ curves respectively, and the higher part of the two curves are adopted for design. For comparison, the DSM formula in Equations (9)–(11) are also plotted in the figure as ‘Mu-Equation (9)’, ‘Mu-Equation (10)’, and ‘Mu-DSM -Uniform’ curves respectively. It is first pointed out in Figure 9 that the predicted member strength from the two-phase DSM descends monotonically with increasing member length, although the normalized strength curve in Figure 8 ascends slightly for the short member. The two-phase DSM predictions are found to closely follow the varying trend of the strength data points with a reasonable safety margin. The uniform DSM yields pretty good predictions in the long-member region, but becomes very conservative in the short-member region. Equation (10), which is obviously better than the other existing DSM Equation (9), predicts slightly unsafe results for long members and overly conservative results for short members. Recall that Equation (10) was not of adequate reliability level when fitting into the framework of current design codes (Section 3.2), while the newly proposed uniform and two-phase DSMs in this paper all have an adequate reliability level. For this example, an increase of design strength by up to 39% can be achieved with the two-phase DSM as compared with the uniform DSM.
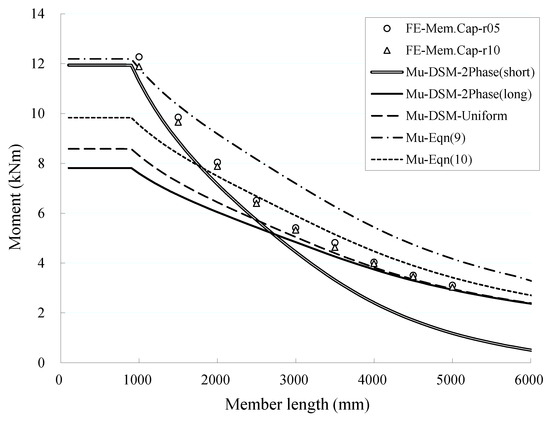
Figure 9.
FE strengths of 2101-I-L20 section.
3.5. Revised Two-Phase DSM Formula
It was appreciated by the authors that a slightly ascending design curve, as those shown in Figure 8 for short members, might be too newfangled to be accepted in design codes. In this section, a compromise is sought between the beneficial strength increase and the easiness of common acceptance. Specifically, a leveling-off trend is adopted for the short member design curves instead of the slightly ascending trend in Figure 8. A ‘short member’ design curve is assumed to start at the point λol = 0.75λl, and to join the ‘long member’ DSM curve exactly at this slenderness value. Therefore, the long-member DSM formula can be used directly to work out the intersection point at λol = 0.75λl. The revised two-phase DSM expression is shown in Equation (16), and the corresponding design curves are plotted in Figure 10. A comparison with Equations (13)–(15) and Figure 8 reflects that the revised DSM formula is more concise and the design curves take a “descending + leveling off” trend, which might make it easier to be adopted in design practices. However, it’s noted that the strength of intermediate and short members are sacrificed to some extent in Equation (14), and therefore the reliability level of it should be higher than those prescribed for Equations (11) and (13)–(15).
where , , .
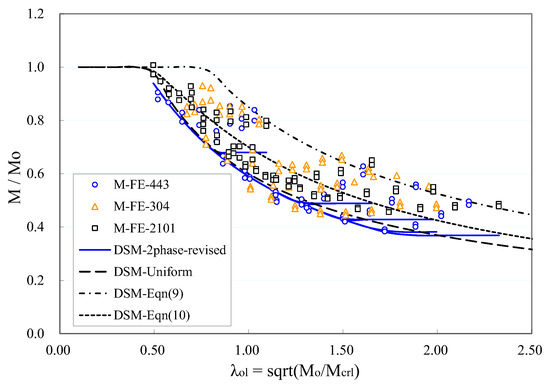
Figure 10.
FE strengths and revised 2-phase DSM of I-sections.
4. Conclusions Remarks
This paper aims at developing design formulae in the form of the Direct Strength Method (DSM) for cold-formed stainless steel beams undergoing local-global interaction buckling. A database was first established with extensive parametric studies of stainless steel I-section beams, on basis of the calibrated FE models in [35]. The following conclusions could be drawn from the research:
- Existing DSM formulae in literature were found incapable of accurately predicting the strength of cold-formed stainless steel beams and lacking a due level of reliability. A traditional-form DSM equation was regressed from the collected strength database, offering improved accuracy and adequate reliability level.
- Cold-formed stainless steel I-beams could be distinguished as “long” or “short” members with criteria (i) short members λol > 0.75λl and (ii) long members λol < 0.75λl, where λl and λol are “section slenderness” and “relative slenderness” defined in Equation (7) and Equation (8) of the paper.
- Varying trend of the member strengths differs considerably between the ‘long’ and ‘short’ members. A fundamental drawback of the traditional-form DSM formula was observed, viz. the mathematical expression hindered it from accurately following the strength varying trend of stainless steel I-beams and therefore resulting in generally high deviation in predictions and undue conservatism for intermediate and short members.
- Novel two-phase DSM was therefore proposed with a prescribed level of reliability. The novel two-phase DSM formula was found to predict member strengths more accurately over the whole slenderness range, resulting in strength predictions with much lower deviation from actual strengths. Enhanced design strengths by up to 39% could be obtained from the two-phase DSM formula for members with intermediate and short spans.
- A revised version of the two-phase DSM was further proposed, which simplified the formula expression at some cost of the member strength of short members.
Author Contributions
Conceptualization, S.N.; methodology, S.N. and Y.Y.; validation, S.N. and X.Z.; investigation, S.N. and Y.Y.; writing—original draft preparation, Y.Y.; writing—review and editing, S.N.; supervision, X.Z.; project administration, S.N.; funding acquisition, S.N. All authors have read and agreed to the published version of the manuscript.
Funding
This research was supported by the National Natural Science Foundation of China (Grant No. 51508134) and the Fundamental Research Funds for Central Universities (Grant No. HIT.NSRIF.201676).
Institutional Review Board Statement
Not applicable.
Informed Consent Statement
Not applicable.
Data Availability Statement
The data presented in this study are available in Refs. [35,36].
Conflicts of Interest
The authors declare no conflict of interest.
References
- Hancock, G.J.; Kwon, Y.B.; Stefan Bernard, E. Strength design curves for thin-walled sections undergoing distortional buckling. J. Constr. Steel Res. 1994, 31, 169–186. [Google Scholar] [CrossRef]
- Schafer, B.W.; Peköz, T. Direct Strength Prediction of Cold-Formed Members Using Numerical Elastic Buckling Solutions. In Proceedings of the Fourteenth International Specialty Conference on Cold-Formed Steel Structures, St. Louis, MO, USA, 15 October 1998. [Google Scholar]
- Papangelis, J.P.; Hancock, G.J. Computer analysis of thin-walled structural members. Comput. Struct. 1995, 56, 157–176. [Google Scholar] [CrossRef]
- Schafer, B.W.; Adany, S. Buckling analysis of cold-formed steel members using CUFSM: Conventional and constrained finite strip methods. In Proceedings of the 18th International Specialty Conference on Cold-Formed Steel Structures: Recent Research and Developments in Cold-Formed Steel Design and Construction, University of Missouri-Rolla, Orlando, FL, USA, 26–27 October 2006. [Google Scholar]
- Bebiano, R.; Camotim, D.; Goncalves, R. GBTUL 2.0 A second-generation code for the GBT-based buckling and vibration analysis of thin-walled members. Thin-Walled Struct. 2018, 124, 235–257. [Google Scholar] [CrossRef]
- Schafer, B.W. Local, Distortional, and Euler Buckling of Thin-Walled Columns. J. Struct. Eng. ASCE 2002, 128, 289–299. [Google Scholar] [CrossRef]
- Schafer, B.W. Review: The Direct Strength Method of cold-formed steel member design. J. Constr. Steel Res. 2008, 64, 766–778. [Google Scholar] [CrossRef]
- Pham, C.H.; Hancock, G.J. Direct Strength Design of Cold-Formed Purlins; Research Report; Department of Civil Engineering, University of Sydney: Sydney, Australia, 2007; pp. 1–37. [Google Scholar]
- Papangelis, J.; Trahair, N.; Hancock, G. Direct strength method for shear capacity of beams with corrugated webs. J. Constr. Steel Res. 2017, 137, 152–160. [Google Scholar] [CrossRef]
- Tovar, J.; Sputo, T. Application of direct strength method to axially loaded perforated cold-formed steel studs: Distortional and local buckling. Thin-Walled Struct. 2005, 43, 1882–1912. [Google Scholar] [CrossRef]
- Lecce, M. Distortional Buckling of Stainless Steel Sections; University of Sydney: Sydney, Australia, 2006. [Google Scholar]
- Becque, J.; Lecce, M.; Rasmussen, K.J.R. The direct strength method for stainless steel compression members. J. Constr. Steel Res. 2008, 64, 1231–1238. [Google Scholar] [CrossRef]
- Rossi, B.; Jaspart, J.P.; Rasmussen, K.J.R. Combined Distortional and Overall Flexural-Torsional Buckling of Cold-Formed Stainless Steel Sections: Design. J. Struct. Eng. 2010, 136, 354–360. [Google Scholar] [CrossRef]
- Chen, M.; Fan, S.; Li, C.; Zeng, S. Direct strength method for stainless steel lipped channel columns undergoing local buckling. Int. J. Steel Struct. 2020, 20, 1822–1830. [Google Scholar] [CrossRef]
- Zhu, J.H.; Young, B. Aluminum alloy tubular columns—Part II: Parametric study and design using direct strength method. Thin-Walled Struct. 2006, 44, 969–985. [Google Scholar] [CrossRef]
- AISI S100; North American Cold-formed Steel Specification for the Design of Cold-formed Steel Structural Members. American Iron and Steel Institute: Washington, DC, USA, 2012.
- AS/NZS4600; Australian/New Zealand Standard: Cold-Formed Steel Structures. Standards Australia: Sydney, Australia; Standards New Zealand: Wellington, New Zealand, 2018.
- Arrayago, I.; Rasmussen, K.J.R.; Real, E. Full slenderness range DSM approach for stainless steel hollow cross-sections. J. Constr. Steel Res. 2017, 133, 156–166. [Google Scholar] [CrossRef]
- Arrayago, I.; Real, E.; Mirambell, E. Design of stainless steel continuous beams with tubular cross-sections. Eng. Struct. 2017, 151, 422–431. [Google Scholar] [CrossRef]
- Huang, Y.; Young, B. Experimental and numerical investigation of cold-formed lean duplex stainless steel flexural members. Thin-Walled Struct. 2013, 73, 216–228. [Google Scholar] [CrossRef]
- Zhou, F.; Young, B. Tests of cold-formed stainless steel tubular flexural members. Thin-Walled Struct. 2005, 43, 1325–1337. [Google Scholar] [CrossRef]
- Li, H.-T.; Young, B. Web crippling of cold-formed ferritic stainless steel square and rectangular hollow sections. Eng. Struct. 2018, 176, 968–980. [Google Scholar] [CrossRef]
- Theofanous, M.; Gardner, L. Experimental and numerical studies of lean duplex stainless steel beams. J. Constr. Steel Res. 2010, 66, 816–825.24. [Google Scholar] [CrossRef]
- Lepcha, K.H.; Patton, M.L. A numerical study on structural behaviour of lean duplex stainless steel tubular beams with rectangular web openings. Structures 2021, 32, 1233–1249. [Google Scholar] [CrossRef]
- Saliba, N.; Gardner, L. Cross-section stability of lean duplex stainless steel welded I-sections. J. Constr. Steel Res. 2013, 80, 1–14. [Google Scholar] [CrossRef]
- Sun, Y.; Zhao, O. Material response and local stability of high-chromium stainless steel welded I-sections. Eng. Struct. 2019, 178, 212–226. [Google Scholar] [CrossRef]
- Lalthazuala, R.; Singh, K.D. Investigations on structural performance of hybrid stainless steel I-beams based on slenderness. Thin-Walled Struct. 2019, 137, 197–212. [Google Scholar] [CrossRef]
- Zhou, Y.; Uy, B.; Wang, J.; Li, D. Behaviour and design of welded stainless steel beams with compact sections under flexure and shear. J. Constr. Steel Res. 2021, 187, 106996. [Google Scholar] [CrossRef]
- Hassanein, M.F.; Silvestre, N. Flexural behavior of lean duplex stainless steel girders with slender unstiffened webs. J. Constr. Steel Res. 2013, 85, 12–23. [Google Scholar] [CrossRef]
- Chen, X.W.; Yuan, H.X.; Real, E.; Du, X.X.; Schafer, B.W. Experimental behaviour of stainless steel plate girders under combined bending and shear. J. Constr. Steel Res. 2020, 166, 105900. [Google Scholar] [CrossRef]
- Niu, S.; Rasmussen, K.J.R.; Fan, F. Distortional-Global Interaction Buckling of Stainless Steel C-beams: Part I—Experimental Investigation. J. Constr. Steel Res. 2014, 96, 127–139. [Google Scholar] [CrossRef]
- Fan, S.; Chen, M.; Li, S.; Ding, Z.; Shu, G.; Zheng, B. Stainless steel lipped C-section beams: Numerical modelling and development of design rules. J. Constr. Steel Res. 2019, 152, 29–41. [Google Scholar] [CrossRef]
- Karthik, C.; Anbarasu, M.; Dar, M.A. Cold-formed ferritic stainless steel closed-section built-up beams: Tests and flexural response. Thin-Walled Struct. 2022, 180, 109820. [Google Scholar] [CrossRef]
- Niu, S.; Rasmussen, K.J.R.; Fan, F. Local-Global Interaction Buckling of Stainless Steel I-Beams. I: Experimental Investigation. J. Struct. Eng. 2015, 141, 04014194. [Google Scholar] [CrossRef]
- Niu, S.; Rasmussen, K.J.; Fan, F. Local–global interaction buckling of stainless steel I-beams. II: Numerical study and design. J. Struct. Eng. 2015, 141, 04014195. [Google Scholar] [CrossRef]
- Niu, S.; Rasmussen, K.J.R. Numerical Study of the Sectional-Global Interaction Buckling of Stainless Steel Beams; Research Report no. R945; School of Civil Engineering, University of Sydney: Sydney, Australia, 2013. [Google Scholar]
- AS/NZS4673; Australian/New Zealand Standard: Cold-Formed Stainless Steel Structures. Standards Australia: Sydney, Australia; Standards New Zealand: Wellington, New Zealand, 2001.
- ASTM E527; Standard Practice for Numbering Metals and Alloys in the Unified Numbering System (UNS). American Society for Testing and Materials: West Conshohocken, PA, USA, 2012.
- Lin, S.H.; Yu, W.W.; Galambos, T.V. Load and Resistance Factor Design of Cold-Formed Stainless Steel: Statistical Analysis of Material Properties and Development of the LRFD Provision; Fourth Progress Report; Univ. of Missouri-Rolla: Rolla, MO, USA, 1988. [Google Scholar]
Disclaimer/Publisher’s Note: The statements, opinions and data contained in all publications are solely those of the individual author(s) and contributor(s) and not of MDPI and/or the editor(s). MDPI and/or the editor(s) disclaim responsibility for any injury to people or property resulting from any ideas, methods, instructions or products referred to in the content. |
© 2023 by the authors. Licensee MDPI, Basel, Switzerland. This article is an open access article distributed under the terms and conditions of the Creative Commons Attribution (CC BY) license (https://creativecommons.org/licenses/by/4.0/).