Article

Joint Impacts of Pricing Strategies and Persuasive Information on Habitual Automobile Commuters’ Travel Mode Shift Responses

School of Management Engineering, Zhengzhou University of Aeronautics, Zhengzhou 450046, China
*
Author to whom correspondence should be addressed.
Sustainability 2023, 15(2), 1058; https://doi.org/10.3390/su15021058
Submission received: 16 November 2022 / Revised: 29 December 2022 / Accepted: 3 January 2023 / Published: 6 January 2023

Abstract

:
Persuasive information developed by smartphone applications is a potential tool that can be utilized in order to increase the effectiveness of the impact of pricing strategies on triggering sustainable travel mode choice behavior. In order to address the joint impacts of pricing strategies and persuasive information on habitual automobile commuters’ travel mode shift responses, a stated-preference survey was conducted in Beijing’s inner district, from which over 1000 responses were collected. Four separate multivariable multilevel logistic regression models were estimated for more and less habitual automobile commuters when subjected to congestion pricing and reward strategies. The model estimation results showed that the influence of persuasive information was more effective in promoting travel mode shifts among more habitual automobile commuters with regard to reward strategies compared to congestion pricing. The results also showed that the impact of sociodemographic characteristics, commuter travel characteristics, the amount of congestion pricing or monetary award, and types of persuasive information on travel mode shift decisions under these strategies were deemed to be significantly different between more and less habitual automobile commuters. These findings suggest that more effective reward strategies can be explored by providing personalized and differentiated travel feedback information (e.g., pollution emission information and physical activity information), particularly for less habitual automobile commuters. This study also provides some degree of insight regarding the question as to how to design future congestion pricing, i.e., with respect to formulating differentiated charge rates according to the travel characteristics of habitual automobile commuters, as well as in developing complementary persuasive information that focuses on addressing public acceptability and fairness rather than travel feedback information.

1. Introduction

The rapid growth of car ownership and usage has led to increases in the number of habitual automobile commuters who have a clear and obvious preference for undertaking a certain automobile mode of transport (i.e., driving a private car, using a traditional taxi, or using a car-sharing service) as the main way of commuting in China over the past decade. In Beijing, the number of commuters that used a certain automobile mode as their primary travel mode increased by approximately 80% in 2020 compared with 2008. [1]. For many years, various pricing strategies, such as congestion pricing and reward strategies, which rely on the use of price signals (i.e., losses or gains) to alter habitual automobile commuters’ choices and to reduce traffic congestion have received increased attention [2].
In particular, congestion pricing has been considered a key tool that can cause individuals to make choices that maximize certain benefits to society [3,4,5]. Some cities, such as Singapore and London, have implemented such policies and carried out multiple empirical studies on this topic [6]. Moreover, numerous studies have also indicated that issues of public acceptance, fairness, and revenue allocation are constraints with respect to the wider promotion of congestion pricing [7,8]. In order to address such issues, financial reward strategies have been suggested to promote a travel mode shift. This strategy is not performed by punishing car travel behaviors but rather by incentivizing the use of more sustainable travel modes. Various empirical pieces of evidence have shown that reward strategies may be more politically acceptable and can potentially promote travel mode shifts toward more sustainability [9,10,11].
Furthermore, some studies were also conducted to compare the impact of congestion pricing and reward strategies on travel behavior. Descriptive analysis based on empirical experiments and discrete choice models are widely used to measure the effectiveness of congestion pricing and reward strategies. For example, Tillema et al. [12] compared the impact of two strategies on commuter travel behavior based on two studies that were conducted in the Netherlands. In particular, it was found that reward strategies were more effective in diverting commuters from utilizing less sustainable travel modes during peak periods. Kandolath [13] compared congestion pricing and incentive schemes with respect to their abilities to reduce traffic congestion. Furthermore, they provided a framework to evaluate the effectiveness of such schemes. Guo et al. [14] applied random parameter bivariate ordered probit models to evaluate the impact of two strategies on migrant and resident millennial commuting mode choice behavior in China. However, none of the previous studies have considered the potential correlation between pricing strategies and persuasive information; indeed, nor has there been an analysis regarding the auxiliary impacts of persuasive information on pricing strategies’ effectiveness in promoting travel mode shifts toward sustainability, nor is there, currently, an understanding with respect to the joint impacts of pricing strategies and persuasive information on habitual automobile commuters’ mode choice behavior.
However, in fact, persuasive information based on smartphone applications has aroused worldwide interest in triggering changes in travel behavior [15,16,17,18]. Persuasive information is broadly defined as information aimed at encouraging sustainable transport and managing automobile travel demand by changing travelers’ attitudes and behaviors [19,20]. There are many forms of persuasive information, such as real-time information and gamification information, that can trigger travelers to change their travel routes, departure times, or destinations, as well as provide personalized travel feedback (e.g., pollution emission information and physical activity information) to encourage users to adopt more sustainable travel modes.
Changes in travel mode are the focus of this study. Furthermore, several experimental results have demonstrated the effectiveness of such persuasive information for promoting travel mode shifts toward more sustainable practices [18,21]. These research articles suggest that combining persuasive information, especially personalized and mode-specified travel feedback information, with congestion pricing and reward strategies may potentially increase such pricing strategies’ effectiveness [22]. Indeed, a better understanding of the joint impact of persuasive information and pricing strategies is necessary to improve the effectiveness of such strategies.
Compared with simply and solely focusing on pricing strategies, the importance of investigating how persuasive information and pricing strategies jointly initiate automobile travel behavior changes lies in the following aspects. Firstly, it has been widely recognized (as well as applied in the field of urban transport management) that the use of persuasive information can be used to foster sustainable behavior. Persuasion-type information has gradually become an important component of real travel environments not only at this time but also in the future. Secondly, it is valuable to identify whether persuasive information or what types of persuasive information have auxiliary impacts on differential pricing strategies’ effectiveness in promoting travel mode shifts toward more sustainable approaches.
The present study aims at answering the following main questions:
  • Can persuasive information be used as complementary measures to enhance the impact of pricing strategies on habitual automobile commuters’ travel mode shift responses?
  • How can one evaluate the effect of persuasive information on pricing strategies with respect to promoting automobile mode choice behavior changes?
  • What are the similarities and dissimilarities in the factors influencing travel mode shifts response of more and less habitual automobile commuters when subjected to the joint impact of pricing strategies and persuasion information?
Specifically, this study developed a web-based stated preference survey, which can provide persuasive information, including pollution emission information (i.e., the amount of CO2 emissions and the amount of particulate matter emissions) and physical activity information (i.e., walk steps and calories burnt), for the purposes of analyzing Beijing’s inner districts in China with respect to automobile modes of transport. Four separate multivariable multilevel logistic regression models were estimated for more and less habitual automobile commuters under the congestion pricing and reward strategies. In addition, this study can provide insight for traffic management departments and smartphone application developers into understanding the possible relationship between pricing strategies and persuasive information.
In this study, three contributions are made to the research literature in the field of travel behavior change with respect to pricing strategies. First, we offer a paradigm in which to evaluate the effect of persuasive information on pricing strategies that promote automobile mode choice behavior changes. Second, within this study, a comprehensive understanding of the similarities and differences in the factors that affect travel mode shift responses of more and less habitual commuters when subject to congestion pricing and reward strategies in China is provided. Third, the research results can help transport policy makers explore more effective pricing strategies and complementary measures by designing more personalized and effective persuasive information to promote more large-scale changes in habitual automobile travel behavior.

2. Study Design and Data

In this study, a web-based stated preference survey method was used to collect habitual commuters’ travel mode shift responses when subjected to the congestion pricing and reward strategies with respect to considering the impacts of persuasive information. We hired the Sojump survey company, which possesses rich sample resources that have diverse sociodemographic characteristics to carry out the survey in Beijing, China in 2017. The random sampling research design method was adopted for use in this study. Individuals in the respondent pool of the survey company who are living or working in Beijing’s inner districts and are more than 18 years old were, at random, requested to answer the questions in our survey questionnaire.
Figure 1 shows the structure of the questionnaire. It mainly included three parts: (i) The individual sociodemographic information consisted of personal and household information, household mobility resources, and the usage of the characteristics of travel-related apps for smartphones; (ii) commuter travel characteristics, which contain information on habitual commuting modes, commuting distances, and commuting time; and (iii) the travel mode shift responses that may occur when subjected to the joint impacts of pricing strategies and persuasive information.
We divided the participants into more and less habitual automobile commuters according to their commonly used mode of commuting. Specifically, more habitual automobile commuters referred to those who use a car, traditional taxi, or car-sharing service as the most common commuting mode. Less habitual automobile commuters represented those who use a car, traditional taxi, or car-sharing service as the second most common commuting mode.
The pricing strategy scenarios are composed of three-tier congestion pricing (5-yuan, 15-yuan, and 25-yuan tiers) and reward strategies (1-yuan, 1.5-yuan, and 2-yuan tiers). The congestion pricing fees were designed based on related studies that focus on congestion pricing strategies in Beijing [23,24], as well as the congestion pricing policies implemented in London, Singapore, and Stockholm where the charges are approximately set equal to between 20% and 80% of the average hourly salary of full-time employed residents [14]. Roughly 10%, 25%, and 40% of the average hourly salary of full-time employed residents in Beijing in 2017 [25] are set as the three-tier congestion pricing charging scenarios. The design of reward strategy scenarios not only needed to meet the minimum cost of sustainable travel modes as much as possible but should also be able to consider the financial burden of the government. Therefore, the three tiers of reward strategies were designated as the bus travel cost that is paid by the public transport IC card. Moreover, it should be noted that the congestion pricing and reward strategy scenarios in this study are a one-time daily charge or a reward with a uniform rate.
Persuasive information, including pollution emission information and physical activity information, can aid in better focusing on the travel feedback information that is associated with the eight available modes (car, bus transit, taxi, subway transit, personal bike, electric bike, shared bike, and walking). Pollution emission information was measured by the amount of CO2 emissions and the amount of particulate matter emission, while physical activity information was measured by the number of steps and the amount of activity calories burned. The calculation methods for the various types of information are detailed in previous studies [22]. In addition, all information can be calculated automatically when participants enter their commute origin and destination in an interactive map as shown in Figure 2, whereby the survey question “If you know the physical activity information, would you switch to sustainable travel modes that are priced at a 5-yuan congestion pricing instead?” is taken as an example. This method can capture the participants’ heterogeneity of commuter travel and also assist with participants with respect to accessing persuasive information.
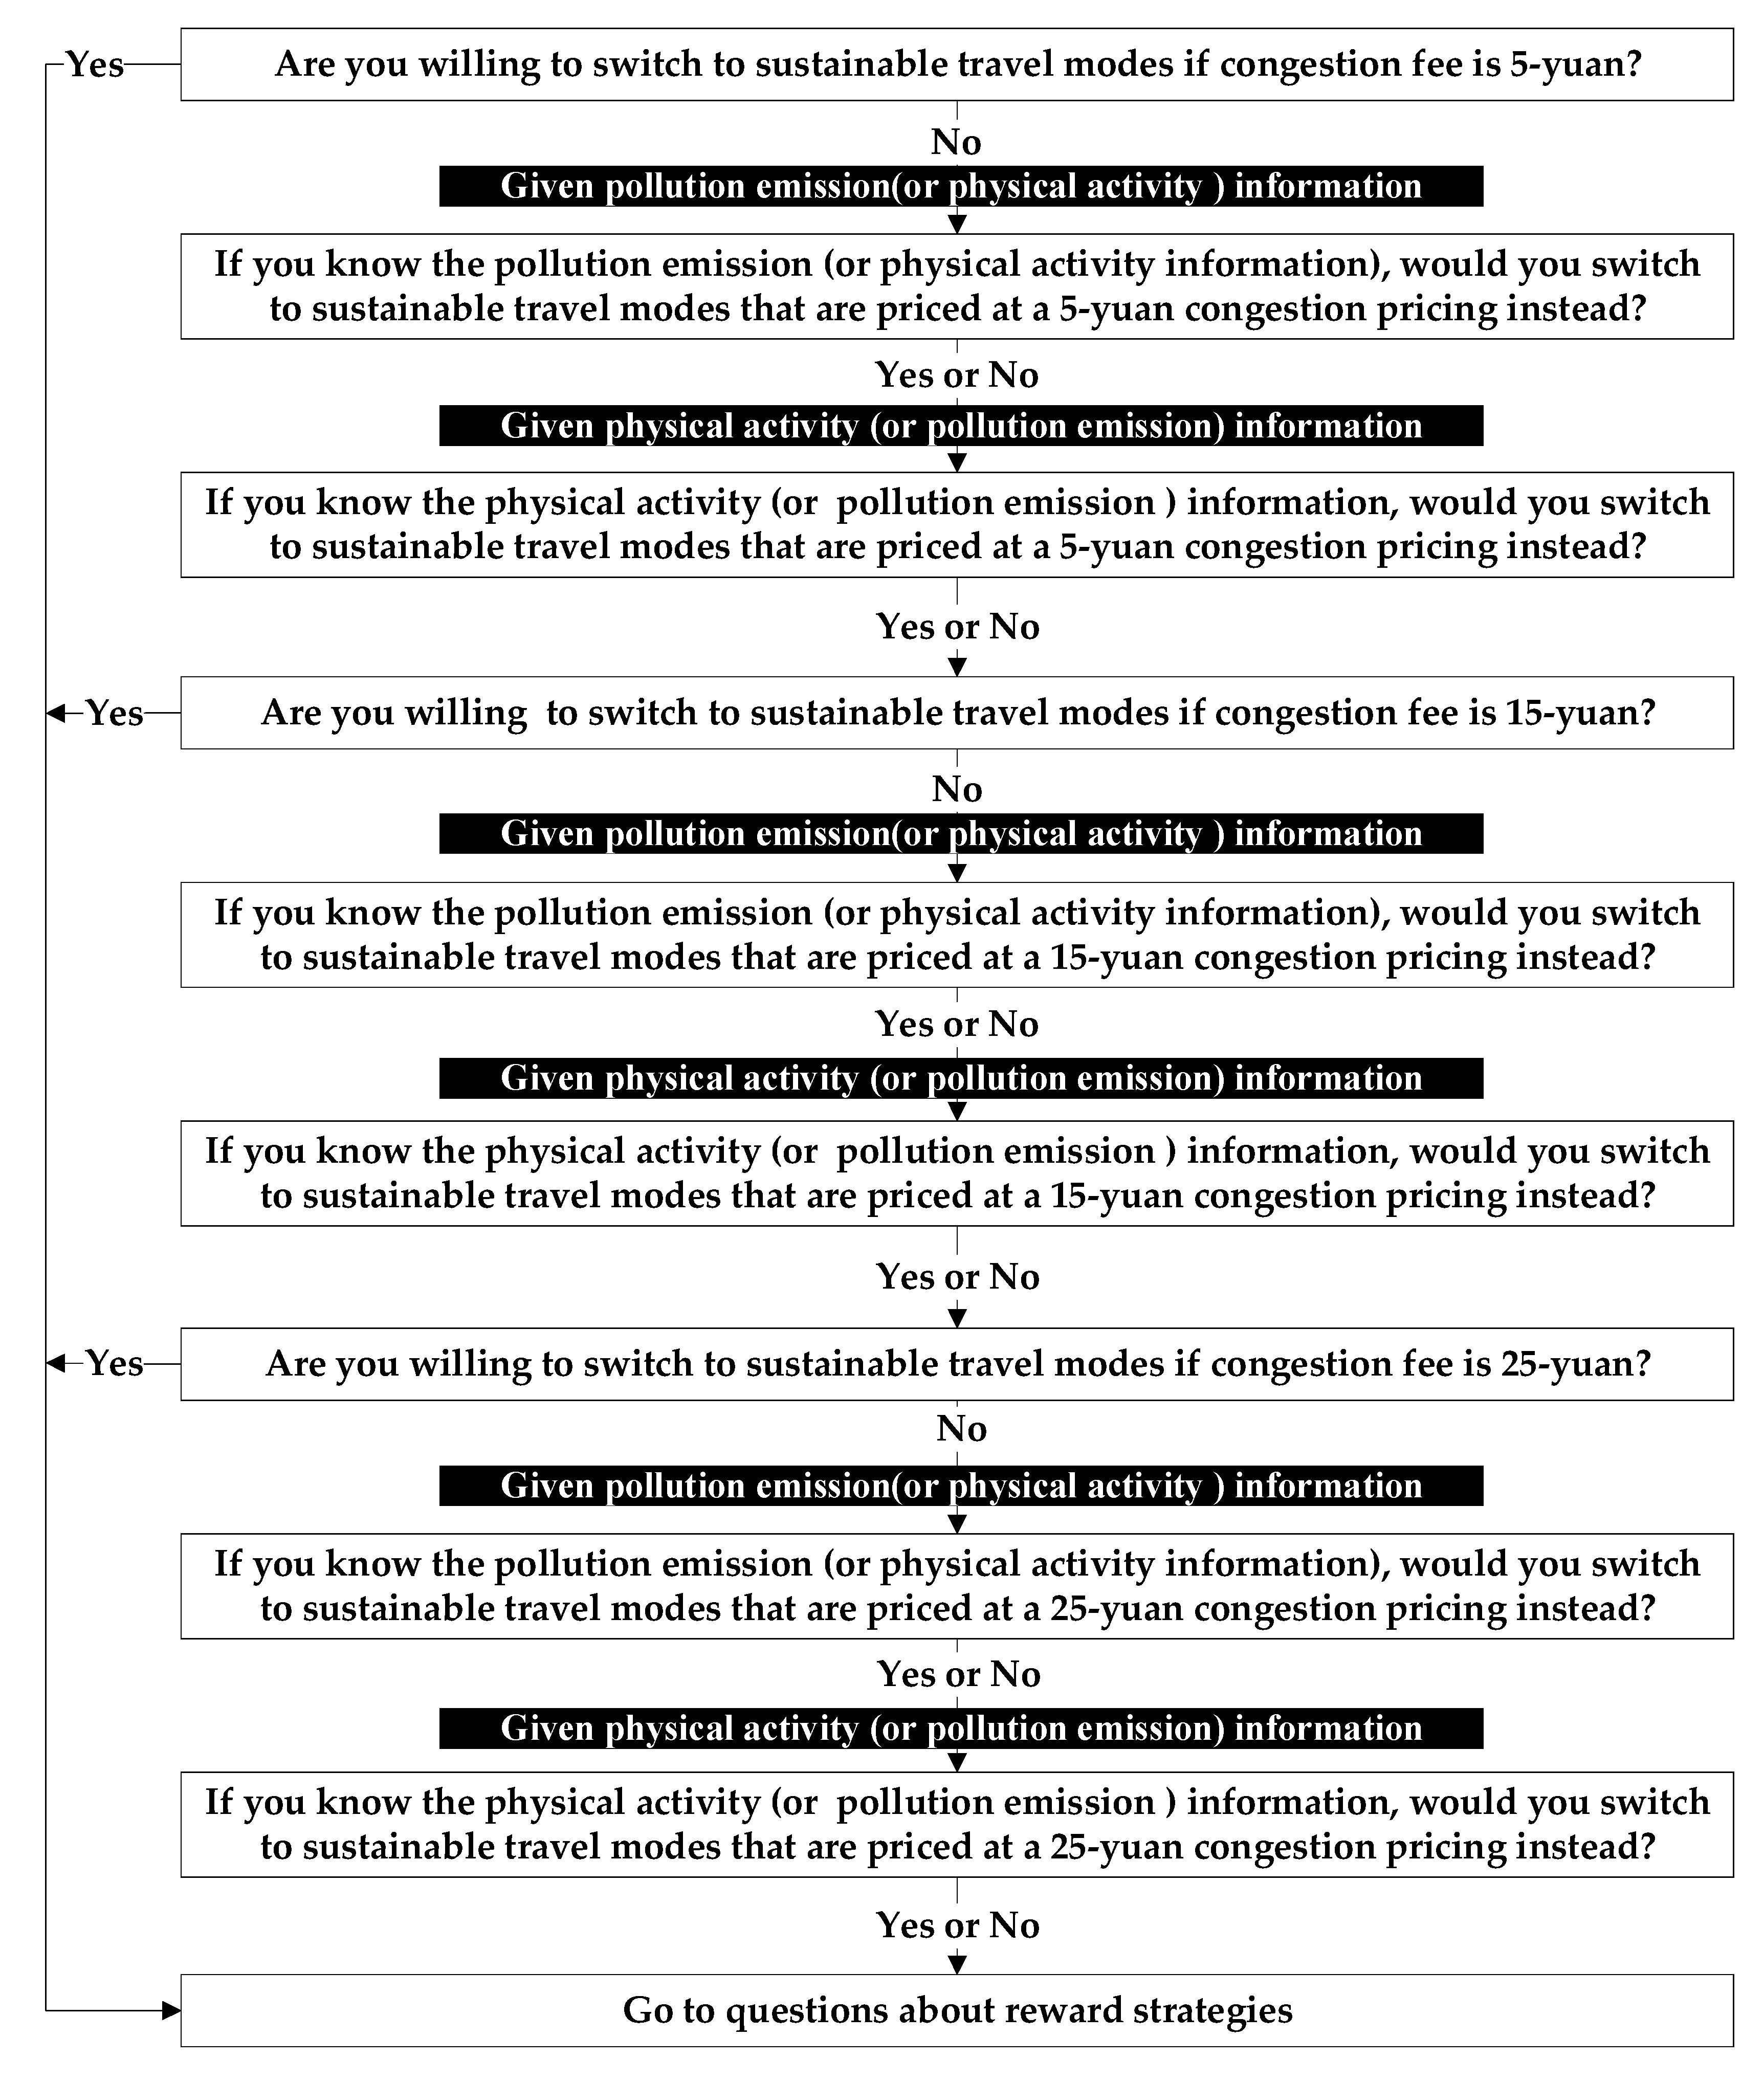
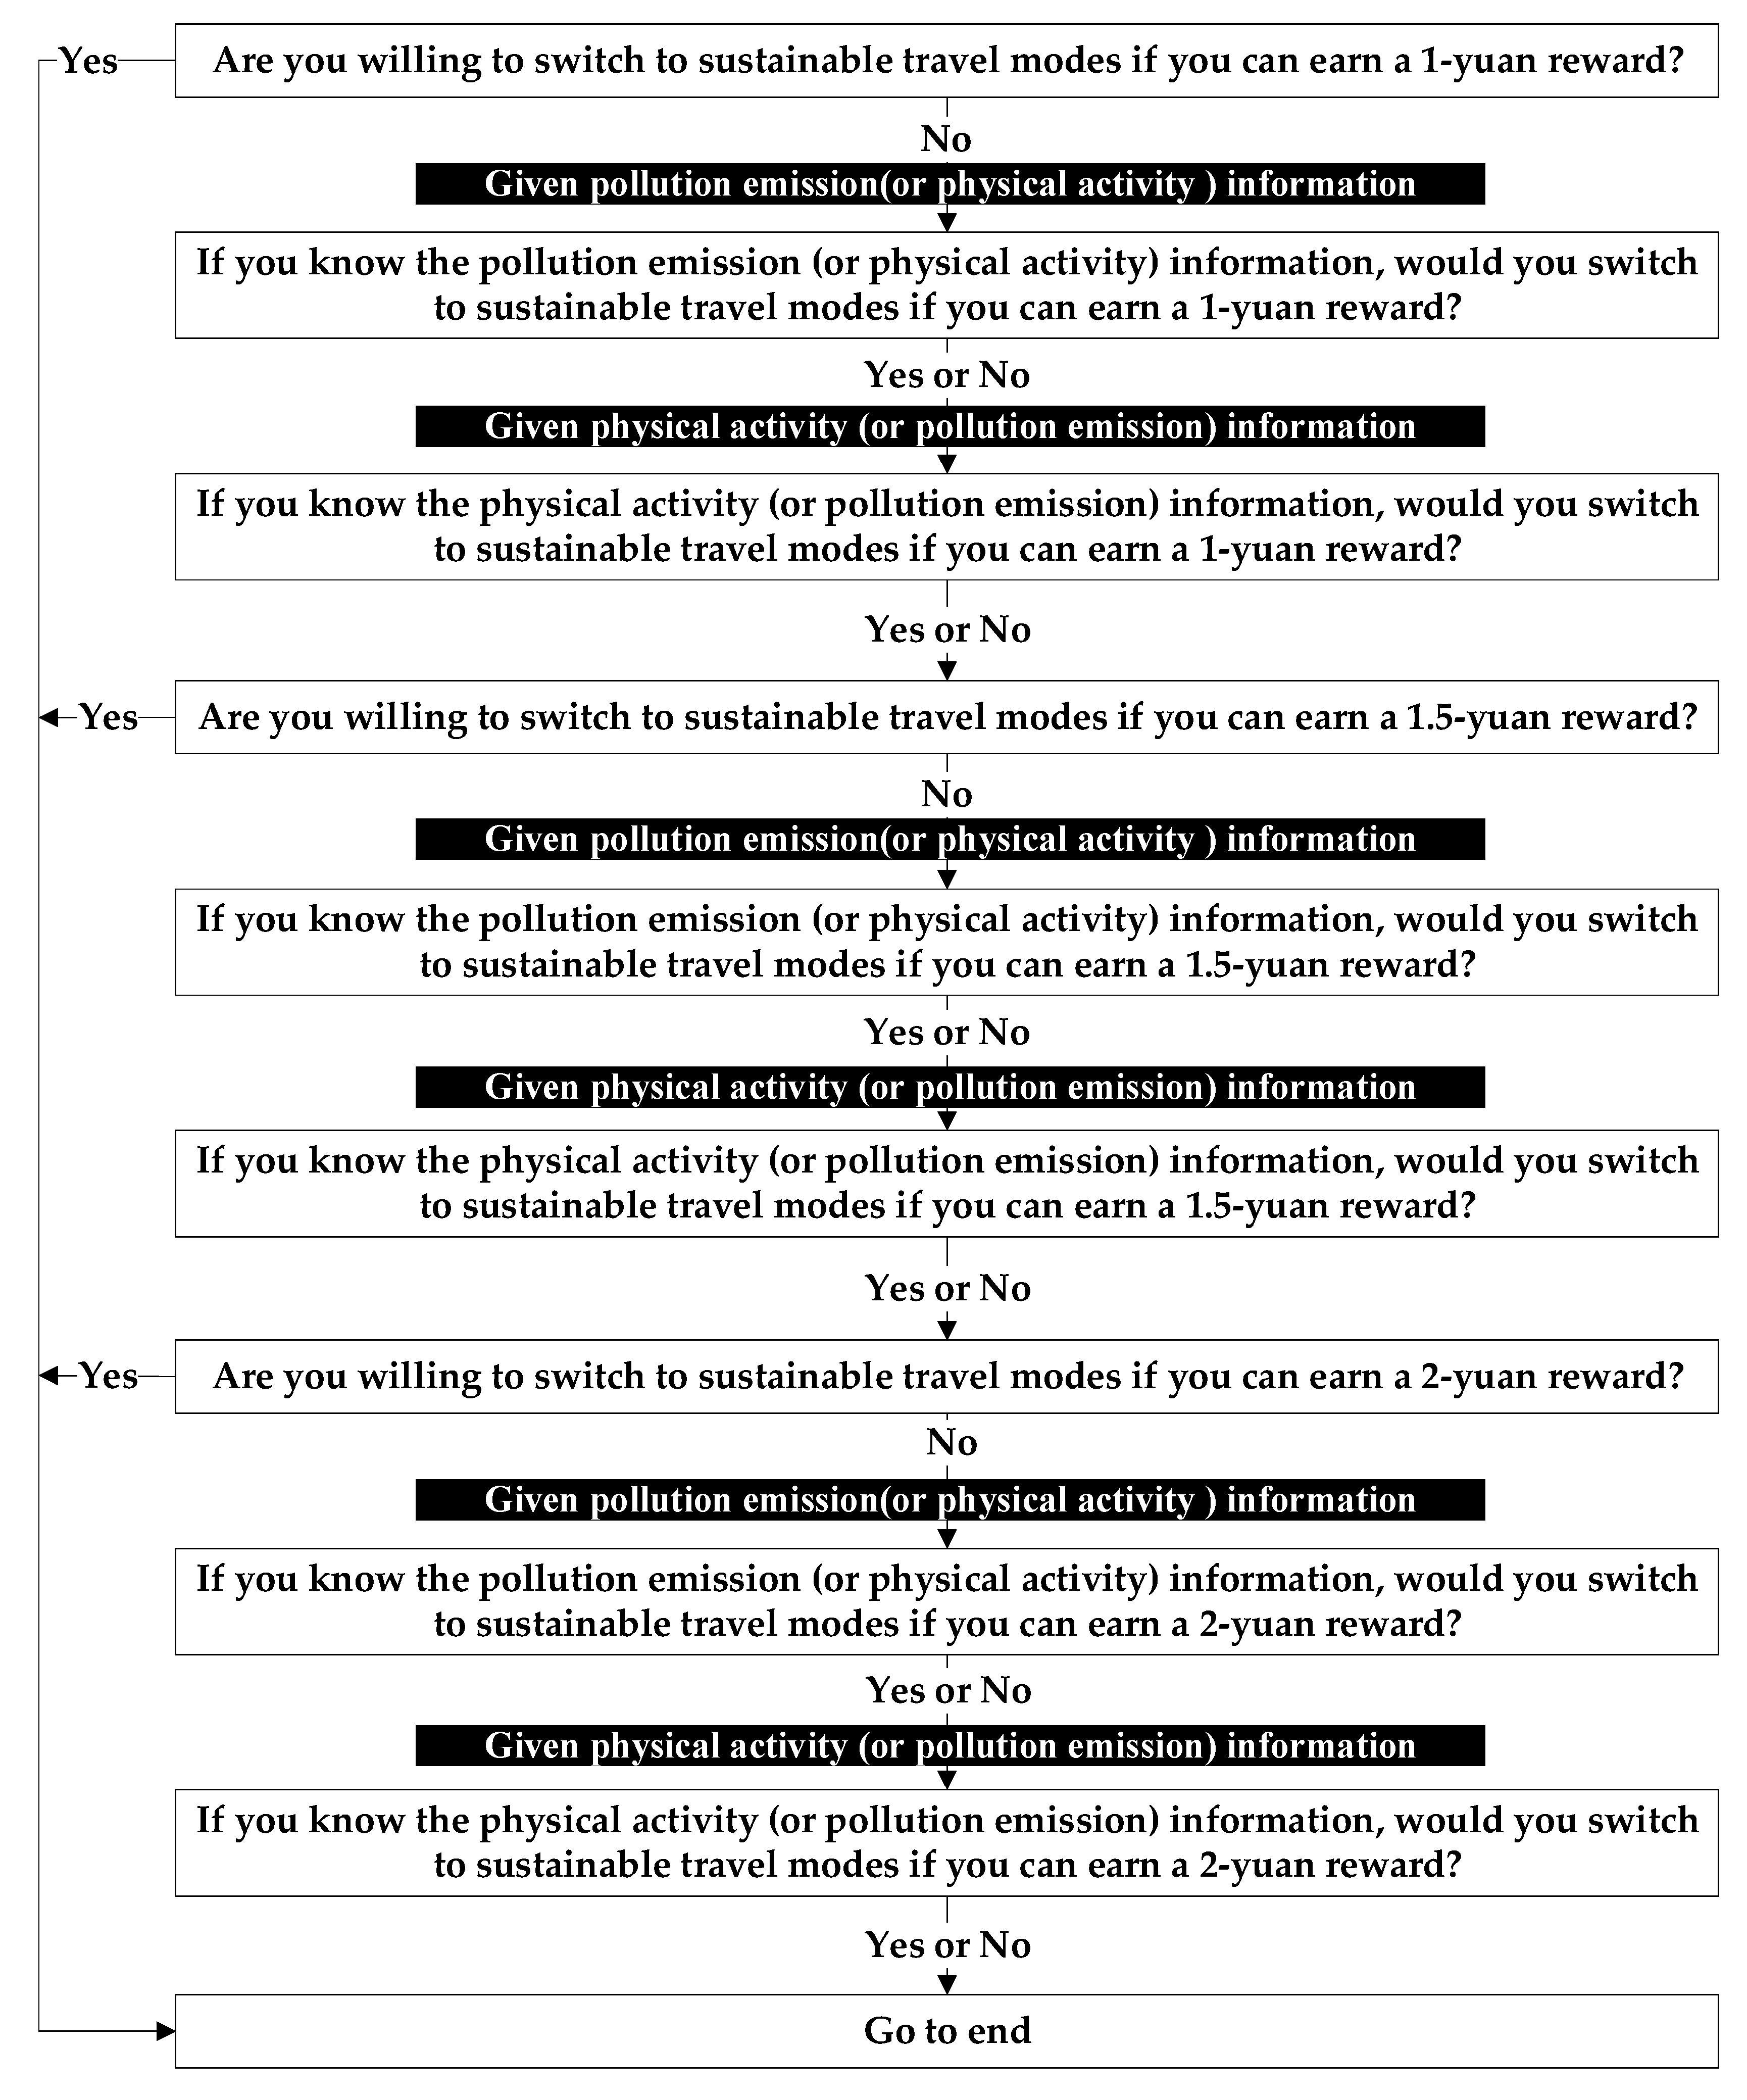
Figure 3 and Figure 4 present the flowchart of questions related to travel mode shift response with respect to the joint impacts of pricing strategies and persuasive information. Regarding the reward strategies, participants were first asked, “Are you willing to switch to sustainable travel modes if you can earn a 1-yuan reward?”. If the answer was “yes” to this question, we considered the participants to have effectively responded “I will switch to sustainable travel modes if I can earn a 1-yuan reward”. Moreover, it was found that the default response was that the participants were willing to switch to sustainable travel modes with the increase in reward amount and the understanding of pollution emissions and physical activity information, which in turn, marked the end of the survey section related to the reward strategies. If the answer was “no” to this question, participants would be directed to answer the following question: “If you know the pollution emission (or physical activity) information, would you switch to sustainable travel modes if you can earn a 1-yuan reward?”. Whether the answer was “yes” or “no”, the next question that was posed was, “If you know the physical activity (or pollution emission) information, would you switch to sustainable travel modes if you can earn a 1-yuan reward?”. It is important to note that the order of questions related to pollution emission and personal activity information was conducted at random. We assumed that the participants possessed different sensitivities with respect to pollution emission and personal activity information. These two questions can be used to determine the difference between the impact of pollution emissions and physical activity information in regard to pricing strategies. Then, the participants were prompted with the following question: “Are you willing to switch to sustainable travel modes if you can earn a 1.5-yuan reward?”. A similar approach was used to design another two-tier reward strategy and a three-tier congestion pricing model.
With the above settings, a total of 1274 completed questionnaires were returned between 10 June and 25 August 2017. It should be noted that this survey was carried out before the outbreak of COVID-19. Since then, certain studies have revealed that commuter travel remained the main purpose of travel during the pandemic and demonstrated a shift in the respondents’ preferences from public transport to other travel modes such as non-motorized vehicles and walking [26,27,28]. According to the 2018 and 2021 Annual Reports on Traffic Development in Beijing, the proportion of green travel in the central urban area of Beijing has not seen a significant decrease from 2017 to 2021, but rather it slightly increased from 72.1% to 73.1% [1,29]. This implied that there was no significant change in the mode choice behavior of habitual automobile commuters even during the pandemic. In addition, the impact of the COVID-19 pandemic on residents’ travel will also be further reduced with the optimization of China’s prevention and control strategies that have been implemented recently.
The sociodemographic characteristics of the population in the target area, within the survey samples, and the more and less habitual automobile commuters are shown in Table 1. In general, participants were mainly aged between 25 and 44, with an education level of a college degree or above, a relatively high monthly income, or families with more than three family members. Less habitual automobile commuters were a smaller percentage in the aforementioned categories when compared to more habitual automobile commuters. Compared with the population in the target area, there was a larger proportion of men that were aged 25 to 44 with college or higher education in the survey samples. This is primarily due to the fact that all participants were habitual automobile commuters.
Table 2 presents participants’ travel mode shift responses with respect to the joint impact of pricing strategies and persuasive information. Some key similarities and differences were found between more and less habitual automobile commuters. First, more and less habitual commuters were more likely to change from automobile travel modes to more sustainable travel modes as the penalty or reward increased. Second, a smaller proportion of less habitual automobile commuters were more likely to shift to sustainable travel modes when subjected to reward strategies compared to congestion pricing, while the opposite was observed for more habitual automobile commuters. Third, physical activity information was more effective in assisting pricing strategies to promote habitual automobile commuters to shift to sustainable travel modes compared to pollution emission information. This is likely due to the fact that travelers are more concerned regarding individual health issues, which relate to their own interests when compared to environmental issues, than any related social interests. This finding also helped to address the first research question that was proposed, i.e., that persuasive information can be utilized as complementary measures in which to enhance the impact of pricing strategies on habitual automobile commuters’ travel mode shift responses.

3. Model Specification

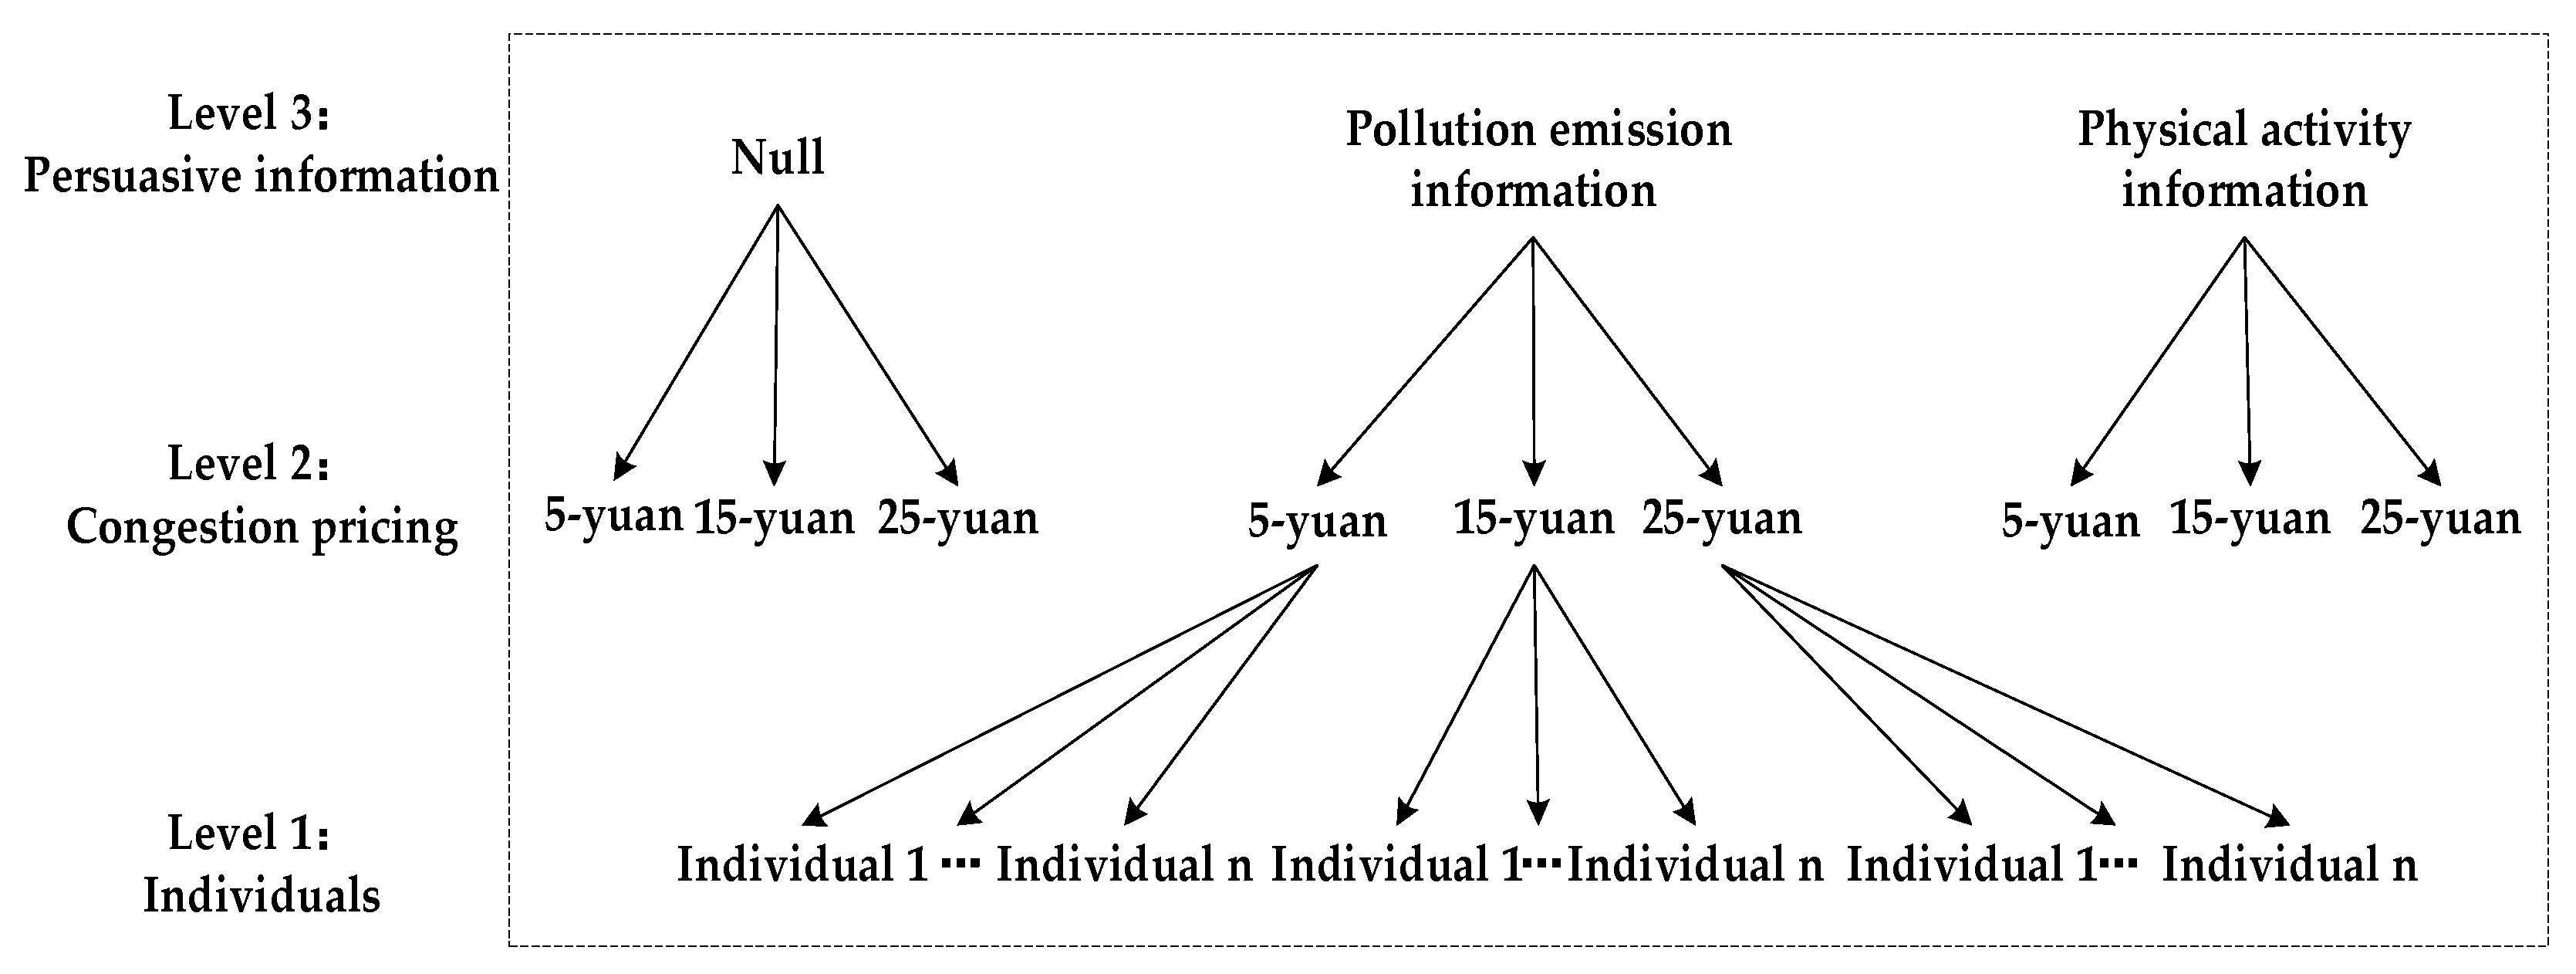
The travel mode choice data structure can be viewed as a three-level hierarchy where individual mode choice behaviors (Level 1) are nested within congestion pricing or reward strategies (Level 2), which are, in turn, nested within pollution emissions or physical activity information (Level 3), as shown in Figure 5 and Figure 6. In order to model the habitual automobile commuters’ mode choice behavior with respect to the joint impact of pricing strategies and persuasive information, a multivariable multilevel (three-level) logistic regression model was developed. This model was designed to isolate the effect of the persuasive information attributes on habitual automobile commuters’ mode choice behavior with respect to pricing strategies attributes and individual attributes. Furthermore, the use of the model assumes that the effects of the variables at the individual level vary across the pricing strategic level. In addition, the explanatory variable with respect to the pricing strategic level possesses a different effect for each information scenario. On this note, y i j k is the observed binary travel mode shift response of an individual i who is subjected to the impact of pricing strategies scenario j for information scenario k. In addition, p i j k = p y i j k = 1 is the probability of choice with respect to sustainable travel modes for an individual i who is subjected to the impact of pricing scenario j for information scenario k. The multivariable multilevel logistic regression model can be expressed as:
log p i j k 1 - p i j k = β 0 j k + m β m j k x m j k + ξ i j k
and:
β 0 j k = v 00 k + v 01 k g 1 + ε 0 j k
β m j k = v m 0 k + v m 1 k g 1 + ε m j k
v 00 k = u 000 + u 001 z 1 + τ 0 k
v 01 k = u 010 + u 011 z 1 + τ 1 k
where x m j k represents the explanatory variables that are included the sociodemographic and behavioral characteristics (i.e., household, individual, and travel-related factors); g1 is the pricing strategy attributes (the amount of congestion pricing or monetary award); and z1 is the type of information. β 0 j k and β m j k are the effect coefficients for explanatory variables, which are at level 1. v 00 k , v 01 k , v m 0 k , and v m 1 k are the effect coefficients for the pricing strategy attributes. u 000 , u 001 , u 010 , and u 011 are the effect coefficients for the type of information. ξ i j k is an unobserved random term with an independent and identical Gumbel distribution. ε 0 j k , ε m j k , τ 0 k , and τ 1 k are random terms that capture unobserved variations across the various pricing strategies and types of information. Here, ε 0 j k , ε m j k , τ 0 k , and τ 1 k are assumed to be normally distributed and identically distributed: ε 0 j k N 0 , σ 0 j k 2 , ε m j k N 0 , σ m j k 2 , τ 0 k N 0 , σ 0 k 2 , and τ 1 k N 0 , σ 1 k 2 .
The multivariable multilevel logistic regression model can alternatively be written in the form of:
log p i j k 1 - p i j k = u 000 + u 001 z 1 + u 010 g 1 + u 011 z 1 g 1 + m v m 0 k x m j k + m v m 1 k g 1 x m j k + m ε m j k x m j k + τ 1 k g 1 + ε 0 j k + τ 0 k
where u 000 + u 001 z 1 + u 010 g 1 + u 011 z 1 g 1 + m v m 0 k x m j k + m v m 1 k g 1 x m j k is the fixed part of the calculation and m ε m j k x m j k + τ 1 k g 1 + ε 0 j k + τ 0 k is the random part.
Meanwhile, the probability of choice with respect to sustainable travel modes for individual i that is subjected to the impact of pricing scenario j for information scenario k can be obtained as follows:
p i j k = exp u 000 + u 001 z 1 + u 010 g 1 + u 011 z 1 g 1 + m v m 0 k x m j k + m v m 1 k g 1 x m j k + m ε m j k x m j k + τ 1 k g 1 + ε 0 j k + τ 0 k 1 + exp u 000 + u 001 z 1 + u 010 g 1 + u 011 z 1 g 1 + m v m 0 k x m j k + m v m 1 k g 1 x m j k + m ε m j k x m j k + τ 1 k g 1 + ε 0 j k + τ 0 k
The null model is explored to evaluate the variation that is caused by the pricing strategies and information-specific random effects in the absence of any explanatory variables. It can decompose and quantify the size of variance between pricing strategies and information levels. This means that we can evaluate the effect of persuasive information on pricing strategies with respect to promoting automobile mode choice behavior changes when using the null model. In this study, the intra-class correlation (ICC) is used to measure the possible impact of factors that are considered at three different levels. Regarding two individuals who are under the same impact of information scenarios but different pricing strategy scenarios, the correlation between them can be expressed as:
L e v e l   2 : l C C = σ 0 j k 2 σ 0 j k 2 + σ 0 k 2 + σ e 2
For two individuals under the same impact of pricing strategy scenarios but different information scenarios, the correlation between them can be expressed by:
L e v e l   3 : l C C = σ 0 k 2 σ 0 j k 2 + σ 0 k 2 + σ e 2
where σ e 2 is the standard deviation of ξ i j k , which has a standard normal distribution. With respect to the logit model, the value of σ e 2 is π 2 / 3 , which serves as a Gumbel distribution [30,31].
The value of the intra-class correlation coefficient ranges from 0 to 1. If l C C = 0 , there is no pricing strategy or information variance. The multivariable multilevel logistic regression model can be simplified to a two-level logistic regression model or logistic regression model. Conversely, the pricing strategies or information effects regarding individual mode choice behaviors are more significant with a higher ICC. In general, if the value of the ICC is less than 0.10, multilevel analysis is not required [31].
Four separate null models and four separate multivariable multilevel logistic regression models for more and less habitual automobile commuters’ travel mode shift decisions when subjected to the joint impact of pricing strategies and persuasive information are estimated using the MLwinN software, version 3.05 embedded in Stata version 15 [32]. Bayesian Markov Chain Monte Carlo (MCMC) procedures (distribution: Binomial; link: Logit, thinning: 50, burning: 5000, chain: 50,000, and refresh: 500) were employed to estimate model parameters [33]. The association measures (i.e., fixed-effects) between the likelihoods of sustainable travel behavior and independent covariates (i.e., the type of persuasive information, the pricing strategies attribute, and individual variables) are expressed as adjusted odds ratios with their 95% credible intervals (C.I.). The 95% credible interval represents the 95% probability of the population parameter within a specific range. If the 95% credible intervals of the posterior mean include zero, this then indicates that this effect is not statistically significant at the 95% level. The deviance information criterion (DIC) test is used to evaluate the model performance of the models. A model with a lower DIC is considered to have a better fit [34,35].

4. Results and Discussion

4.1. The Effect of Persuasive Information on Pricing Strategies Promoting Automobile Mode Choice Behavior Change

The estimation results of the null models are shown in Table 3. The ICC values in the pricing strategy levels and the persuasive information levels indicate that variations in the travel mode shift responses are attributed to the difference across pricing strategies and persuasive information, respectively. There is 20% (95%CI: 18%, 21%) of the total variance in more habitual automobile commuters’ travel mode shift responses under congestion pricing that can be explained by the difference across the amount of congestion pricing, which is higher than that of less habitual automobile commuters. Furthermore, the ICC values in the pricing strategy level for more habitual automobile commuters’ mode shift response when subjected to reward strategies is less than that of less habitual automobile commuters. These results suggest that less habitual automobile commuters are more sensitive to reward strategies than more habitual automobile commuters, while the opposite is observed for congestion pricing. Note that the variances of the persuasive information- level in regard to the congestion pricing for both more and less habitual automobile commuters were not statistically significant at the 95% level. This implied that the effect of persuasive information on habitual automobile commuters’ travel mode shift response in regard to congestion pricing was not statistically significant. This finding is inconsistent with the expectation that persuasive information plays an important role in strengthening the effect of congestion pricing on habitual automobile commuters’ travel mode choice behavior. This is most likely due to the fact that habitual automobile commuters are more concerned with the potential penalties and financial burden than the potential benefits in terms of personal health and environmental protection that are brought on by congestion pricing policies. As mentioned previously, due to the fact that that the value of the ICC is less than 0.10, we performed a multivariable two-level logistic regression model analysis that did not take into account the impact of persuasive information for more habitual automobile commuters’ travel mode shift decision when subjected to both congestion pricing and reward strategies. In addition, this was also performed for the less habitual automobile commuters’ travel mode shift decision when subjected to congestion pricing.

4.2. Joint Impacts of Pricing Strategies and Persuasive Information on Habitual Automobile Commuters’ Travel Mode Shift Responses

Table 4 presents the estimation results of the final model wherein the effects of the individual-, pricing strategy- and persuasive information-level factors are included. The Bayesian DIC results of the final models are lower than that of the corresponding null model indicating that there indeed appears to be the expected hierarchy with respect to the habitual automobile commuters’ travel mode shift decision under the joint impact of pricing strategies and persuasive information.
At the individual level, the habitual automobile commuters’ age is significantly associated with the outcome probabilities of the travel mode shift response regarding congestion pricing, but not under the reward strategies, especially for more habitual automobile commuters, which suggests that there is no significant difference in the sensitivity perception of reward strategies between travelers of different ages. Travelers aged 25–55 years old are less likely to give up automobile travel modes when subjected to congestion pricing than those aged 18–24 years old, and the probability of shifting to sustainable travel modes gradually increases with an increase in age. These results are somewhat consistent with studies conducted in developed countries (reports from different regions) [36,37,38,39]. This may be attributed to the fact that travelers aged 25–55 years old, who have relatively more stable jobs and incomes, are more able to bear the potential penalty and financial burden. However, the older the travelers are, then the more they are concerned regarding the personal health or environmental benefits of more sustainable travel. In addition, this could also be related to the higher demand for traveling with respect to having multiple family members or multiple travel activities for travelers aged 25–55 years. Less habitual automobile commuters with a monthly salary of more than 8000 yuan are more likely to use automobile modes that are related to pricing strategies than those who possess a monthly salary of less than 4000 yuan. However, this characteristic is not statistically significant for more habitual automobile commuters. Furthermore, this also indicates that there is no significant difference in the commute travel mode choice behavior of those who have strong automobile travel habits with different monthly incomes. For those who do not have a strong automobile travel habit (i.e., those who often use sustainable travel modes), travelers with a lower income are more interested in the potential penalty or rewards.
Furthermore, the work hour flexibility of habitual automobile commuters is a significant predictor of the outcome probabilities of mode shift response regarding congestion pricing and reward strategies, except for the more habitual automobile commuters’ mode choice behavior regarding congestion pricing. One possible explanation is that more habitual automobile commuters whose work hour is somewhat flexible or very flexible are more likely to travel via automobile during non-peak hours to limit the congestion charges, rather than utilize more sustainable travel during peak hour. The number of cars at a specific traveler’s disposal was also noted to be a key factor affecting the travel mode shift responses when travelers are subjected to congestion pricing and reward strategies. Specifically, both more and less habitual automobile commuters with a higher number of cars at their disposal were more inclined to make the mode shift to more sustainable travel modes. This finding is in line with previous studies [40,41] in which the available automobile resources influenced the traveler’s travel mode choice decisions. In addition, it can be seen that the weekly persuasive information query frequency related to the travelers’ attitudes towards health and environmental factors also affected the travel mode shift response of less habitual automobile commuters when subjected to congestion pricing and reward strategies, especially under the reward strategies. In addition, less habitual automobile commuters who query persuasive information more than seven times per week were more likely to make a travel mode shift to more sustainable travel modes. This result also illustrates the importance of recommending persuasive information for those without strong automobile travel habits via the use of a smartphone app in promoting travel mode shifts to more sustainable travel modes regarding both congestion pricing and reward strategies.
Travel time and travel cost were also found to play key roles in inducing travel mode shift responses with respect to the joint impact of pricing strategies and persuasive information. Both more and less habitual automobile commuters preferred to make the travel mode shift to more sustainable travel modes at a shorter travel time or lower travel cost. In addition, the cross-level interactions of travel time (or travel cost) with the amount of congestion pricing were found to be significant in predicting travel mode shift responses. Regarding the decomposition of the interaction effect, we assume that other variables are fixed and only consider the impact of travel time (or travel cost). Figure 7 shows the relationship between travel time and the probability of the choice of more sustainable travel modes for more and less habitual automobile commuters. The impact of travel time on the probability of choosing more sustainable travel modes when subjected to a low-congestion-charge scenario was found to be weaker than that of the high-congestion-charge scenario. The results of the cross-level interactions of travel cost and the amount of congestion pricing, which are presented in Figure 8, are similar with respect to the results of travel time. These results indicate that the amount of congestion pricing could weaken the negative association between travel time (or travel cost) and sustainable travel mode responses. In addition, it should be noted that the cross-level interactions of travel time (or travel cost) with the amount of reward strategies are not significant in terms of predicting travel mode shift responses. This result implies that the effect of travel time (or travel cost) on more sustainable travel mode responses did not change significantly with an increase or decrease in the monetary award.
At the pricing strategy level, it is expected in the results that the amount of congestion pricing or monetary award will play a significant role in predicting the sustainable travel mode responses of both more and less habitual automobile commuters. Similar implications can also be drawn from previous studies. At the persuasive information level, it is found that the pollution emission information and physical activity information only has a significant influence on the travel mode shift responses of less habitual automobile commuters in the context of reward strategies. These results indicate that when the reward strategy is implemented and the pollution emission information or sports activity information is disseminated simultaneously, it should then result in a more favorable effect in terms of promoting those without strong automobile travel habits to switch to more sustainable travel modes.

5. Conclusions

This study examined the various effects that are associated with more and less habitual automobile commuters’ travel mode shift responses with a focus on the joint impacts of pricing strategies and persuasive information. Multivariable multilevel logistic regression models were estimated in order to examine how persuasive information can strengthen the effect of pricing strategies and to further determine the specific factors that affect the travel mode shift responses with respect to the impacts of pricing strategies and persuasive information.
The model estimation results show that persuasive information on pollution emission and physical activity that is aimed at improving the awareness and understanding of personal health and social environmental benefits of using sustainable travel modes can significantly enhance the effectiveness of reward strategies. However, the impacts were not as strong as expected, and the effect was found to be not significant with respect to congestion pricing. These results suggest that mobile applications can be applied to provide mode-specified positive and negative feedback information in which to improve the consequence consciousnesses of habitual automobile commuters to different travel mode behavioral alternatives with respect to reward strategies; this was noted to be especially the case for less habitual automobile commuters. Further, the amount of monetary reward can be linked to travel feedback information, such as the more steps you take, the more rewards travelers can obtain. Overall, planners and policymakers can establish a partnership with application developers to provide personalized and differentiated persuasive information in order to improve the implementation effectiveness of reward strategies. However, with respect to congestion pricing, the inclusion of a strategic design that includes—but is not limited to—the amount of congestion pricing and revenue allocation should be focused upon by planners and policymakers. Moreover, persuasive information regarding the effectiveness and fairness of congestion pricing may be useful with respect to encouraging habitual automobile commuters to perform sustainable behavior. These suggestions can be implemented together with other complementary measures that are proposed in the relevant literature [5,42], such as pre-AM peak discounts or real-time information regarding crowding levels, in order to develop more effective pricing strategies.
The model estimation results also show that there are differences in the factors that affect the more and less habitual automobile commuters’ travel mode shift responses with respect to the joint impact of pricing strategies and persuasive information. Indeed, this indicates that differential congestion pricing or reward strategies can be implemented by classifying travelers according to motorized travel habits, age, income, work hour flexibility, car ownership, persuasive information attention, travel time., or travel cost. This finding is similar to many other behavior characteristics that have been determined in the literature [4,5,9,14,22]. The present study adds to this body of literature by classifying habitual automobile commuters according to their habit strength. In addition, the cross-level interaction effect between travel time (or travel cost) and the amount of congestion pricing is statistically positively significant, while the cross-level interaction effect between travel time or travel cost and the amount of monetary award is determined to be not statistically significant. This, therefore, means that the increase in congestion pricing passively weakens the negative impact of travel cost (or travel time) on habitual automobile commuters’ behavioral intention to shift to more sustainable travel modes. Therefore, it is valuable for planners and policymakers to take into account the synergistic effect of commute travel characteristics and congestion pricing strategy design to successfully promote more sustainable travel mode choice behavior. Additionally, the potential introduction of a reward strategy should also be given sufficient consideration with respect to the financial burden of the government, rather than blindly relying on increasing monetary incentives to urge habitual automobile commuters to perform more sustainable behavior in a timely manner.
Although this study can be seen as a first attempt to empirically understand the joint impact of pricing strategies and persuasive information on the travel mode choice behaviors of habitual automobile travelers in China, there are still some limitations worth noting. Firstly, the stated-preference survey data in this study provide the necessary information that allows one to examine habitual automobile commuters’ travel mode choice behavior with respect to the joint impact of pricing strategies and persuasive information. However, the amount of congestion pricing and rewards was presuppositional and uniform. In order to address this, pilot studies that implement more flexible pricing strategies can be conducted on groups of travelers in China to reveal and study the short-term and long-term effects of such policies on habitual automobile commuters’ travel mode choice behaviors. Secondly, an additional stated-preference survey may be required in the post-COVID-19 era in order to identify the impact of COVID-19 on habitual automobile commuters’ travel mode choice behaviors. Thirdly, more case studies that take other megacities, such as Shanghai and Shenzhen, as the study city subject are required in order to compare the impacts of different vehicle registration systems, built environments, and public transit systems on habitual automobile commuters’ travel mode choice behavior. Finally, this study only investigates the effectiveness of travel feedback information. The joint impacts of pricing strategies and multiple persuasive information, such as real-time information and gamification information, will be a fruitful direction for future work. Finally, future research should consider more attributes, such as psychological factors and the built environment, which were not available to study in this article.

Author Contributions

Conceptualization, Y.L. and Z.L.; methodology, Y.L.; software, Y.L.; validation, Y.L., Z.L. and S.Z.; formal analysis, Y.L.; investigation, Y.L.; writing—original draft preparation, Y.L.; writing—review and editing, Z.L.; supervision, S.Z.; project administration, Y.L.; funding acquisition, Y.L. and S.Z. All authors have read and agreed to the published version of the manuscript.

Funding

This research is funded by the National Natural Science Foundation of China (No. 72204231), The Science and Technology Research Project of Henan Province of China (No. 222102320374), and The Annual Project of Philosophy and Social Sciences of Henan Province of China (No. 2021CJJ153).

Informed Consent Statement

Informed consent was obtained from all subjects involved in the study.

Data Availability Statement

Data will be made available on request.

Conflicts of Interest

The authors declare no conflict of interest.

References

  1. Beijing Transport Institute. 2021 Beijing Transport Development Annual Report. Available online: https://www.bjtrc.org.cn/Show/download/id/68/at/0.html (accessed on 3 September 2021).
  2. Khademi, E.; Timmermans, H. Incorporating Traveler Response to Pricing Policies in Comprehensive Activity-Based Models of Transport Demand: Literature Review and Conceptualization. Procedia Soc. Behav. Sci. 2011, 20, 594–603. [Google Scholar] [CrossRef] [Green Version]
  3. De Palma, A.; Lindsey, R. Traffic congestion pricing methodologies and technologies. Transp. Res. Part C Emerg. Technol. 2011, 19, 1377–1399. [Google Scholar] [CrossRef]
  4. Cipriani, E.; Mannini, L.; Montemarani, B.; Nigro, M.; Petrelli, M. Congestion pricing policies: Design and assessment for the city of Rome, Italy. Transp. Policy 2019, 80, 127–135. [Google Scholar] [CrossRef]
  5. Cohen-Blankshtain, G.; Bar-Gera, H.; Shiftan, Y. Congestion pricing and positive incentives: Conceptual analysis and empirical findings from Israel. Transportation 2022, 1–27. [Google Scholar] [CrossRef]
  6. Chen, D.; Ignatius, J.; Sun, D.; Goh, M.; Zhan, S. Impact of congestion pricing schemes on emissions and temporal shift of freight transport. Transp. Res. E Logist. Transp. Rev. 2018, 118, 77–105. [Google Scholar] [CrossRef] [Green Version]
  7. Noordegraaf, D.V.; Annema, J.A.; van Wee, B. Policy implementation lessons from six road pricing cases. Transp. Res. Part A Policy Pract. 2014, 59, 172–191. [Google Scholar] [CrossRef]
  8. Link, H. Is car drivers’ response to congestion charging schemes based on the correct perception of price signals? Transp. Res. Part A Policy Pract. 2015, 71, 96–109. [Google Scholar] [CrossRef]
  9. Ben-Elia, E.; Ettema, D. Changing commuters’ behavior using rewards: A study of rush-hour avoidance. Transp. Res. Part F Traffic Psychol. Behav. 2011, 14, 354–368. [Google Scholar] [CrossRef]
  10. Khademi, E.; Timmermans, H. The long-term effectiveness of a reward scheme in changing daily travel choices. Procedia Soc. Behav. Sci. 2014, 111, 380–389. [Google Scholar] [CrossRef] [Green Version]
  11. Kumar, V.; Bhat, C.R.; Pendyala, R.M.; You, D.; Ben-Elia, E.; Ettema, D. Impacts of incentive-based intervention on peak period traffic: Experience from the Netherlands. Trans. Res. Rec. 2016, 2543, 166–175. [Google Scholar] [CrossRef]
  12. Tillema, T.; Ben-Elia, E.; Ettema, D.; van Delden, J. Charging versus rewarding: A comparison of road-pricing and rewarding peak avoidance in the Netherlands. Transp. Policy 2013, 26, 4–14. [Google Scholar] [CrossRef]
  13. Kandolath, U.S. Regulating travel demand for sustainable transport: Road pricing versus incentive schemes. In Green Buildings and Sustainable Engineering; Drück, H., Mathur, J., Eds.; Springer: Singapore, 2019; pp. 259–264. [Google Scholar]
  14. Guo, Y.; Li, Y.; Anastasopoulos, P.C.; Peeta, S.; Lu, J. China’s millennial car travelers’ mode shift responses under congestion pricing and reward policies: A case study in Beijing. Travel. Behav. Soc. 2021, 23, 86–99. [Google Scholar] [CrossRef]
  15. Andersson, A.; Hiselius, L.W.; Adell, E. Promoting sustainable travel behaviour through the use of smartphone applications: A review and development of a conceptual model. Travel. Behav. Soc. 2018, 11, 52–61. [Google Scholar] [CrossRef] [Green Version]
  16. Semanjski, I.; Aguirre, L.; De Mol, J.; Gautama, S. Policy 2.0 Platform for Mobile Sensing and Incentivized Targeted Shifts in Mobility Behavior. Sensors 2016, 16, 1035. [Google Scholar] [CrossRef] [PubMed] [Green Version]
  17. Sunio, V.; Schmöcker, J.D. Can we promote sustainable travel behavior through mobile apps? Evaluation and review of evidence. Int. J. Sustain. Transp. 2017, 11, 553–566. [Google Scholar] [CrossRef]
  18. Jariyasunant, J.; Abou-Zeid, M.; Carrel, A.; Ekambaram, V.; Gaker, D.; Sengupta, R.; Walker, J.L. Quantified traveler: Travel feedback meets the cloud to change behavior. J. Intell. Transp. Syst. 2015, 19, 109–124. [Google Scholar] [CrossRef]
  19. Anagnostopoulou, E.; Urbančič, J.; Bothos, E.; Magoutas, B.; Bradesko, L.; Schrammel, J.; Mentzas, G. From mobility patterns to behavioural change: Leveraging travel behaviour and personality profiles to nudge for sustainable transportation. J. Intell. Inf. Syst. 2020, 54, 157–178. [Google Scholar] [CrossRef] [Green Version]
  20. Li, T.; Chen, P.; Tian, Y. Personalized incentive-based peak avoidance and drivers’ travel time-savings. Transp. Policy 2021, 100, 68–80. [Google Scholar] [CrossRef]
  21. Cellina, F.; Bucher, D.; Mangili, F.; Veiga Simão, J.; Rudel, R.; Raubal, M. A large scale, app-based behaviour change experiment persuading sustainable mobility patterns: Methods, results and lessons learnt. Sustainability 2019, 11, 2674. [Google Scholar] [CrossRef] [Green Version]
  22. Li, Y.; Guo, Y.; Lu, J.; Peeta, S. Impacts of congestion pricing and reward strategies on automobile travelers’ morning commute mode shift decisions. Transp. Res. Part A Policy Pract. 2019, 125, 72–88. [Google Scholar] [CrossRef]
  23. Linn, J.; Wang, Z.; Xie, L. Who will be affected by a congestion pricing scheme in Beijing? Transp. Policy 2016, 47, 34–40. [Google Scholar] [CrossRef]
  24. Sun, X.; Feng, S.; Lu, J. Psychological factors influencing the public acceptability of congestion pricing in China. Transp. Res. Part F Traffic Psychol. Behav. 2016, 41, 104–112. [Google Scholar] [CrossRef]
  25. China Daily. Top 10 Chinese Cities with Highest Average Monthly Salary. Available online: http://africa.chinadaily.com.cn/business/2017-06/23/content_29862396.htm (accessed on 23 June 2017).
  26. Jiang, S.; Cai, C. Unraveling the dynamic impacts of COVID-19 on metro ridership: An empirical analysis of Beijing and Shanghai, China. Transp. Policy 2022, 127, 158–170. [Google Scholar] [CrossRef] [PubMed]
  27. Paul, T.; Chakraborty, R.; Anwari, N. Impact of COVID-19 on daily travel behaviour: A literature review. Transp. Saf. Environ. 2022, 4, tdac013. [Google Scholar] [CrossRef]
  28. Das, S.; Boruah, A.; Banerjee, A.; Raoniar, R.; Nama, S.; Maurya, A.K. Impact of COVID-19: A radical modal shift from public to private transport mode. Transp. Policy 2021, 109, 1–11. [Google Scholar] [CrossRef]
  29. Beijing Transport Institute. 2018 Beijing Transport Development Annual Report. Available online: https://www.bjtrc.org.cn/Show/download/id/18/at/0.html (accessed on 24 October 2018).
  30. Hedeker, D. A mixed-effects multinomial logistic regression model. Stat. Med. 2003, 22, 1433–1446. [Google Scholar] [CrossRef]
  31. Snijders, T.A.B.; Bosker, R.J. Multilevel Analysis: An Introduction to Basic and Advanced Multilevel Modeling, 2nd ed.; Sage: London, UK, 2011. [Google Scholar]
  32. Rasbash, J.; Steele, F.; Browne, W.J.; Goldstein, H. A User’s Guide to MLwiN, v3.05. Bristol. Available online: https://www.bristol.ac.uk/cmm/media/software/mlwin/downloads/manuals/3-05/manual-web.pdf (accessed on 26 March 2020).
  33. Browne, W.J. MCMC Estimation in MLwiN v3.03. Bristol. Available online: https://www.bristol.ac.uk/cmm/media/software/mlwin/downloads/manuals/3-03/mcmc-web.pdf (accessed on 26 March 2020).
  34. Celeux, G.; Forbes, F.; Robert, C.P.; Titterington, D.M. Deviance information criteria for missing data models. Bayesian Anal. 2006, 1, 651–673. [Google Scholar] [CrossRef]
  35. Spiegelhalter, D.J.; Best, N.G.; Carlin, B.P.; Van der Linde, A. The deviance information criterion: 12 years on. J. R. Stat. Soc. Ser. B Stat. Methodol. 2016, 76, 485–493. [Google Scholar] [CrossRef]
  36. Vrtic, M.; Schuessler, N.; Erath, A.; Axhausen, K.W. The impacts of road pricing on route and mode choice behaviour. J. Choice Model. 2010, 3, 109–126. [Google Scholar] [CrossRef] [Green Version]
  37. Francke, A.; Kaniok, D. Responses to differentiated road pricing schemes. Transp. Res. Part A Policy Pract. 2013, 48, 25–30. [Google Scholar] [CrossRef]
  38. Nikitas, A.; Avineri, E.; Parkhurst, G. Understanding the public acceptability of road pricing and the roles of older age, social norms, pro-social values and trust for urban policy-making: The case of Bristol. Cities 2018, 79, 78–91. [Google Scholar] [CrossRef] [Green Version]
  39. Sen, S.; Charles, M.B.; Harrison, J.L. Usage-based road pricing and potential equity issues: A study of commuters in South East Queensland, Australia. Transp. Policy 2022, 118, 33–43. [Google Scholar] [CrossRef]
  40. Viegas, J.M. Making urban road pricing acceptable and effective: Searching for quality and equity in urban mobility. Transp. Policy 2001, 8, 289–294. [Google Scholar] [CrossRef]
  41. Peters, J.R.; Gordon, C. Results not guaranteed: A tale of road pricing in New York and London. J. Urban Technol. 2009, 16, 113–131. [Google Scholar] [CrossRef]
  42. Adnan, M.; Biran, B.H.N.; Baburajan, V.; Basak, K.; Ben-Akiva, M. Examining impacts of time-based pricing strategies in public transportation: A study of Singapore. Transp. Res. Part A Policy Pract. 2020, 140, 127–141. [Google Scholar] [CrossRef]
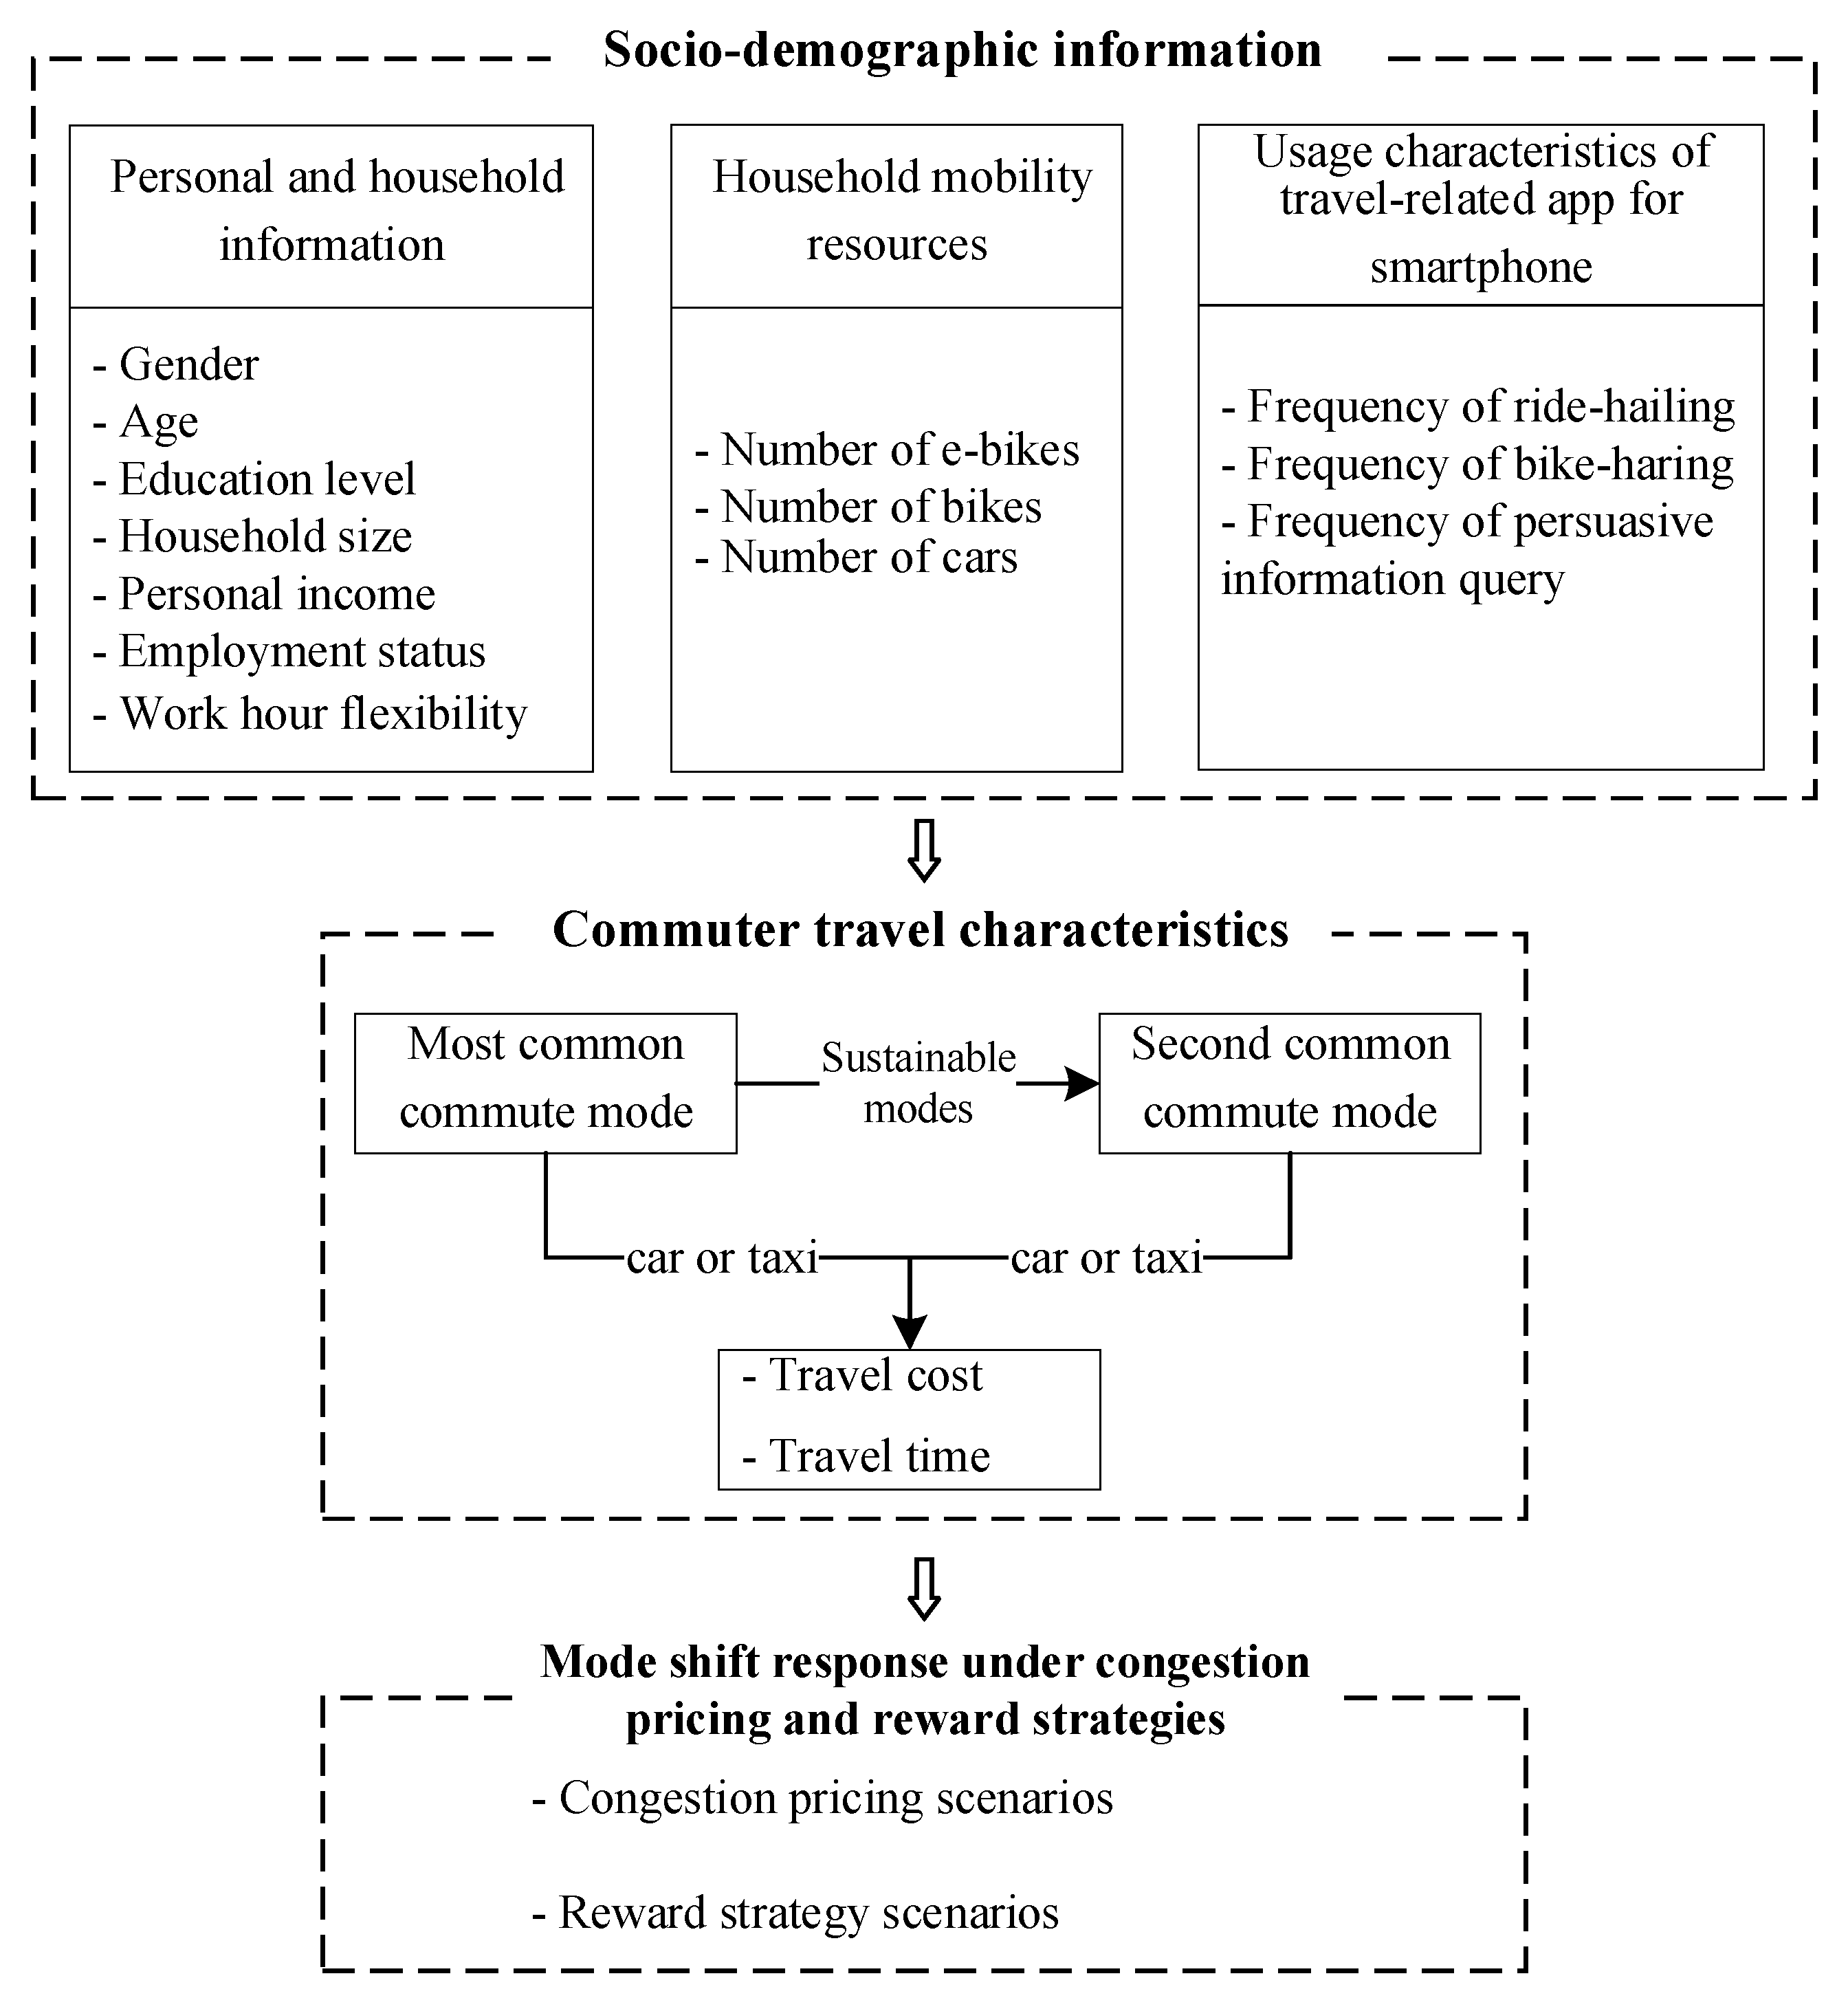
Figure 1. Structure of the questionnaire.
Sustainability 15 01058 g001
Figure 2. Interactive map.
Sustainability 15 01058 g002
Figure 3. The flowchart of questions related to congestion pricing.
Sustainability 15 01058 g003
Figure 4. The flowchart of questions related to reward strategies.
Sustainability 15 01058 g004
Figure 5. The hierarchical structure of the survey data with respect to the impacts of congestion pricing.
Sustainability 15 01058 g005
Figure 6. The hierarchical structure of the survey data with respect to the impacts of reward strategies.
Sustainability 15 01058 g006
Figure 7. The relationship between travel time and the probability of choice of sustainable travel modes regarding congestion pricing.
Sustainability 15 01058 g007
Figure 8. The relationship between travel cost and the probability of choice of sustainable travel modes regarding congestion pricing.
Sustainability 15 01058 g008
Table 1. Descriptive statistics of sociodemographic characteristics.
CharacteristicTarget Population 1All Samples
(N = 1274)
More Habitual Automobile Commuters
(N = 746)
Less Habitual Automobile Commuters
(N = 528)
p-Value 2
Gender
Male50.9%59.3%64.4%52.1%0.000
Female49.1%40.7%35.5%47.9%
Age
18–2412.5%19.5%18.2%21.4%0.000
25–3426.2%44.3%46.5%41.1%
35–4418.4%26.8%26.5%27.3%
45–5516.4%7.4%7.3%7.6%
>5526.5%2.0%1.5%2.6%
Education level
High school diploma or lower43.3%8.0%6.3%10.4%0.012
College degree46.9%73.2%74.5%71.4%
Post-graduate degree or above9.8%18.8%19.2%18.2%
Personal monthly income (Yuan)
<400019.2%22.4%17.5%29.3%0.000
4000–600022.8%16.4%12.8%21.5%
6001–800018.5%24.5%29.2%17.8%
8001–10,00010.5%9.2%7.5%11.7%
>10,00026.0%27.5%33.0%19.7%
Household size
122.7%12.3%11.9%12.9%0.031
230.7%16.2%14.4%18.8%
329.0%40.5%42.0%38.4%
417.6%31.0%31.8%29.9%
Employment status
Public sector employee22.0%24.9%23.4%26.8%0.002
Private sector employee65.3%56.7%59.6%52.7%
Self-employment8.1%13.3%13.8%12.5%
Students -5.1%3.2%7.8%
Work hour flexibility
Very inflexible -52.1%56.3%46.2%0.000
Somewhat flexible or very flexible-47.9%43.7%53.8%
1 Data from Beijing Census Bureau 2016. 2 Chi-square test result regarding the demographic characteristics between more and less automobile commuters.
Table 2. Travel mode shift response when subjected to congestion pricing and reward strategies.
Persuasive InformationStrategic ScenariosMore Habitual Automobile CommutersLess Habitual Automobile Commuters
Congestion pricingNull5-yuan38.8%52.7%
15-yuan60.1%68.2%
25-yuan74.9%75.3%
Pollution emission information5-yuan43.5%59.6%
15-yuan67.4%70.5%
25-yuan75.8%76.7%
Physical activity information5-yuan48.1%62.7%
15-yuan69.0%71.3%
25-yuan76.5%77.3%
Reward strategiesNull1-yuan28.7%53.2%
1.5-yuan41.4%68.7%
2-yuan56.3%76.1%
Pollution emission information1-yuan31.6%60.3%
1.5-yuan45.5%72.1%
2-yuan52.2%77.8%
Physical activity information1-yuan35.3%63.4%
1.5-yuan53.4%71.6%
2-yuan66.4%78.5%
Table 3. Estimation results of the null models.
VariableMore Habitual Automobile CommutersLess Habitual Automobile Commuters
Congestion PricingReward StrategiesCongestion PricingReward Strategies
AOR (95% C.I.)AOR (95% C.I.)AOR (95% C.I.)AOR (95% C.I.)
Fixed-effect
Intercept0.75 (0.54, 1.06)0.85 (0.23, 1.78)0.65 (0.18, 1.77)0.57 (0.24, 0.80)
Random effect
Pricing strategy-level
Variance0.80 (0.74, 0.88)0.53 (0.51, 0.70)0.62 (0.60, 0.75)0.73 (0.42, 0.83)
ICC0.20 (0.18, 0.21)0.13 (0.12, 0.15)0.16 (0.15, 0.22)0.16 (0.09, 0.18)
Persuasive information-level
Variance-0.32 (0.29, 0.58)-0.48 (0.40, 0.69)
ICC-0.08 (0.07, 0.13)-0.11 (0.09, 0.15)
Model fit statistics
Bayesian DIC2762.1531785.1613048.0931372.217
Table 4. Model results of the multivariable multilevel logistic regression model.
VariableMore Habitual Automobile CommutersLess Habitual Automobile Commuters
Congestion PricingReward StrategiesCongestion PricingReward Strategies
AOR (95% C.I.)AOR (95% C.I.)AOR (95% C.I.)AOR (95% C.I.)
Fixed-effect
Intercept1.84 (1.23, 2.45)0.43 (0.07, 0.79)1.12 (0.80, 1.44)1.25 (0.35, 2.15)
Age
18–241-1-
25–34−0.41 (−0.68, −0.14)-−0.19 (−0.36, −0.03)-
35–44−0.31 (−0.61, −0.01)-−0.14 (−0.27, −0.01)-
45–55−0.30 (−0.54, −0.08)-−0.09 (−0.15, −0.03)-
Personal monthly income (Yuan)
<4000--11
8001–10,000--−0.05 (−0.09, −0.01)−0.17 (−0.31, −0.03)
>10,000--−0.19 (−0.36, −0.02)−0.24 (−0.40, −0.08)
Work hour flexibility
Very inflexible -111
Somewhat flexible or very flexible-0.16 (0.08, 0.24)0.11 (0.03, 0.19)0.23 (0.17, 0.29)
Numbers of cars
01111
1−0.53 (−0.77, −0.29)−0.42 (−0.83, −0.17)−0.20 (−0.33, −0.07)−0.30 (−0.57, −0.03)
2−0.63 (−0.87, 0.39)−0.61 (−1.02, −0.26)−0.24 (−0.42, −0.06)−1.72 (−1.90, −1.53)
Frequency of persuasive information query per week
0--11
>7--0.15 (0.09, 0.21)0.36 (0.14, 0.58)
Travel time−2.26 (−2.79, −1.73)−3.97 (−4.26, −3.68)−1.50 (−1.75, −1.25)−2.89 (−4.65, −1.13)
Travel time • The amount of congestion pricing or monetary award0.47 (0.02, 0.92)-0.32 (0.10, 0.54)-
Travel cost−4.84 (−5.89, −3.79)−9.06 (−9.52, −8.61)−3.15 (−3.68, −2.62)−8.83 (−14.56, −3.10)
Travel cost • The amount of congestion pricing or monetary award1.40 (0.57, 2.23)-0.70 (0.38, 1.02)-
The amount of congestion pricing or monetary award0.67 (0.22, 1.12)0.52 (0.03, 1.01)0.75 (0.52, 0.98)0.90 (0.45, 1.35)
Types of persuasive information
Null ---1
Pollution emission information ---0.14 (0.06, 0.22)
Physical activity information---0.26 (0.04, 0.48)
Random effect
Variance of Pricing strategy-level 0.50 (0.01, 0.99)0.23 (0.15, 0.31)0.26 (0.13, 0.39)1.11 (0.97, 1.25)
Variance of Persuasive information-level---0.46 (0.24, 0.68)
Model fit statistics
Bayesian DIC2118.2881554.3942233.5951080.664
Disclaimer/Publisher’s Note: The statements, opinions and data contained in all publications are solely those of the individual author(s) and contributor(s) and not of MDPI and/or the editor(s). MDPI and/or the editor(s) disclaim responsibility for any injury to people or property resulting from any ideas, methods, instructions or products referred to in the content.