
Modelling the Environmental and Economic Life Cycle Performance of Maximizing Asphalt Recycling on Road Pavement Surfaces in Europe


Abstract
:1. Introduction
Aim and Structure of the Study
2. Methodology
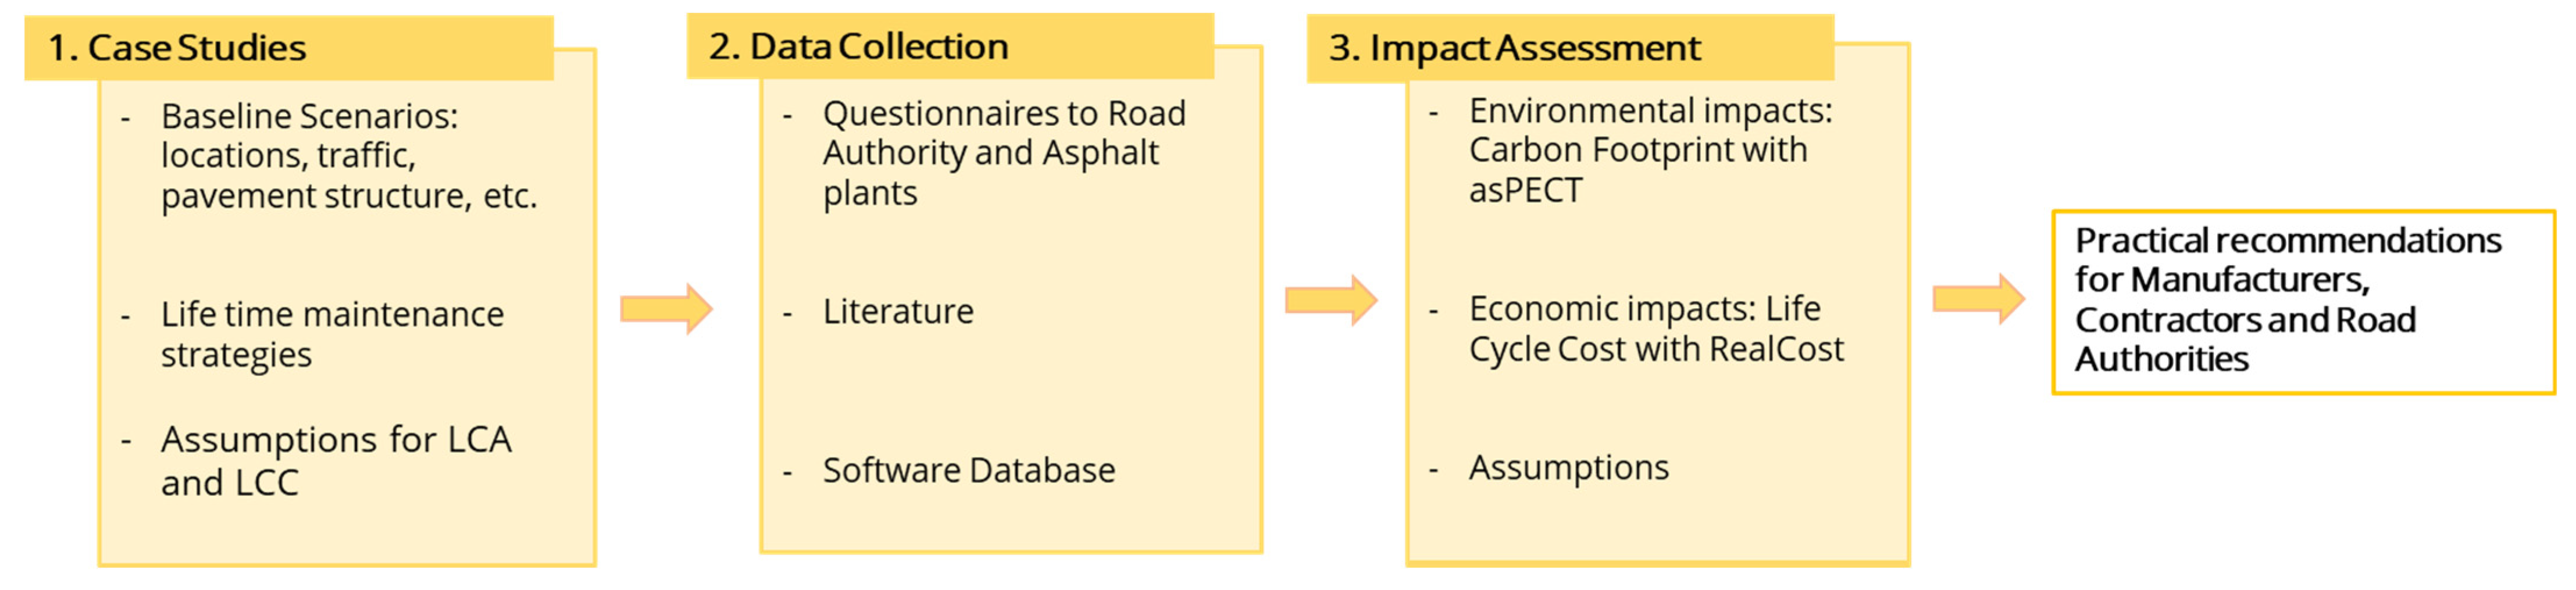
2.1. Case Studies and Data Collection
2.1.1. Pavement Materials
- AC16 30% RA + add
- AC16 60% RA + add
- AC16 90% RA + add
- SMA8S 30% RA
- SMA8S 60% RA
- SMA8S 60% RA + add
2.1.2. Case Studies
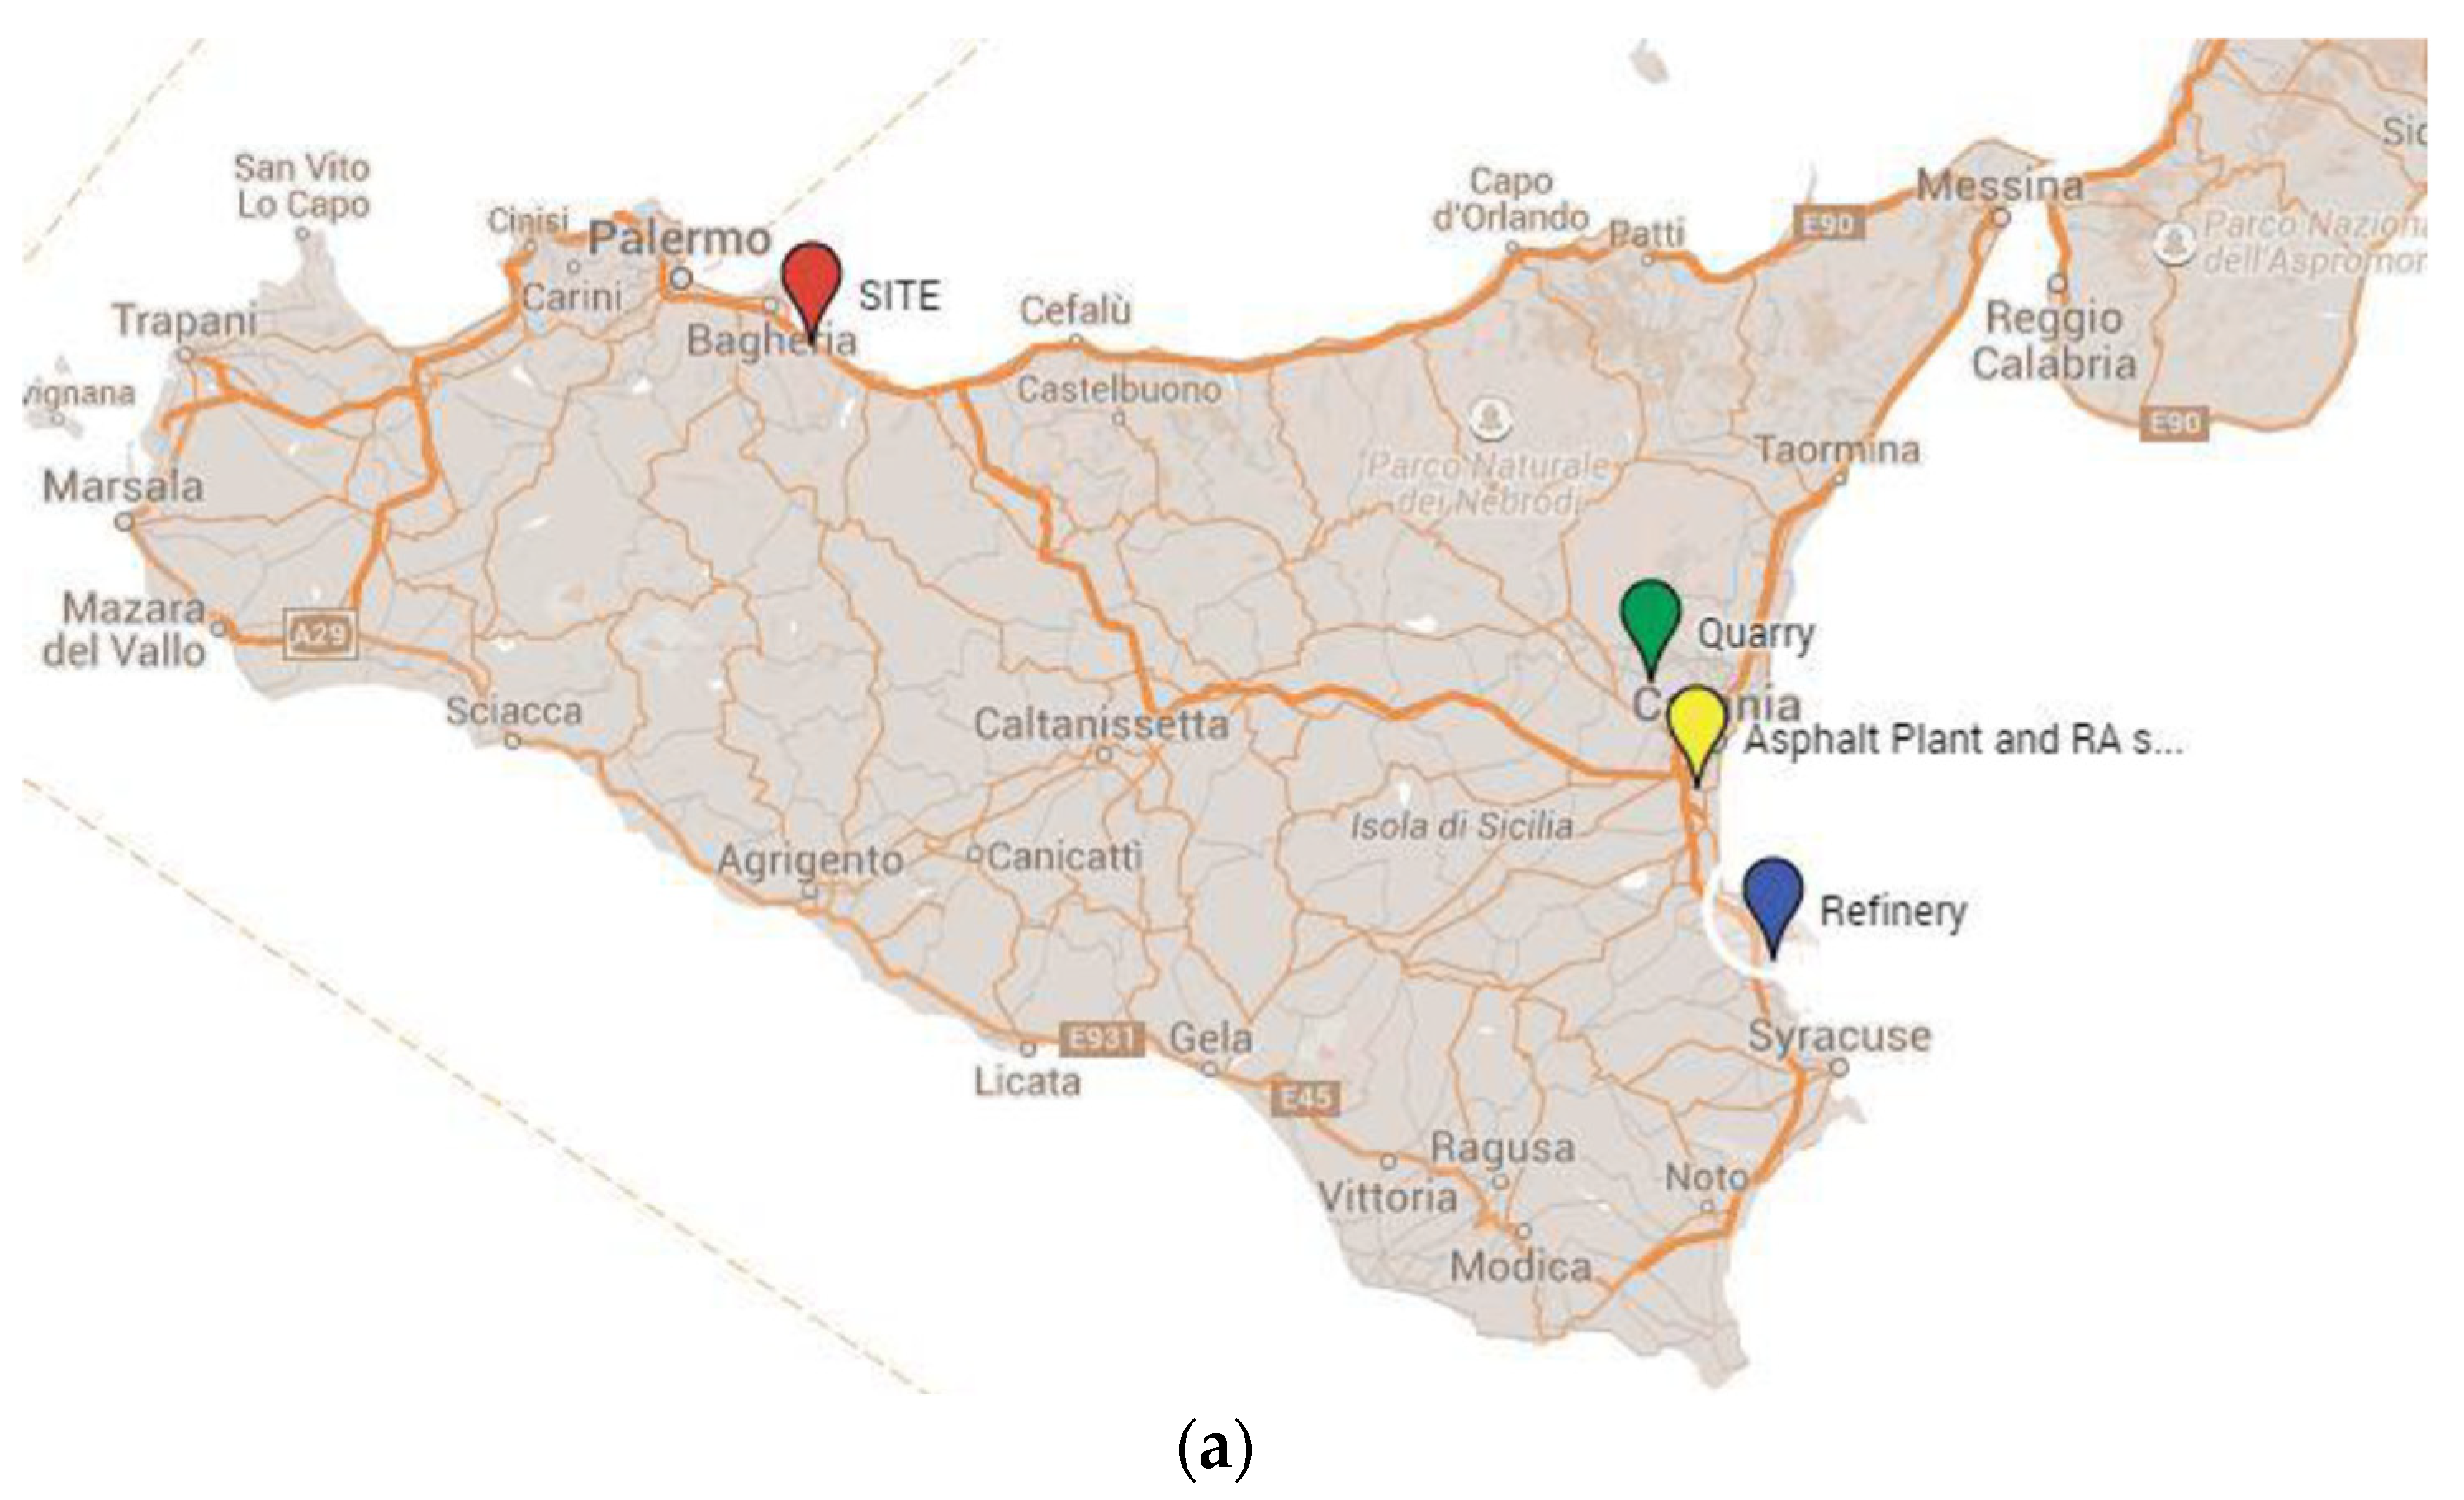
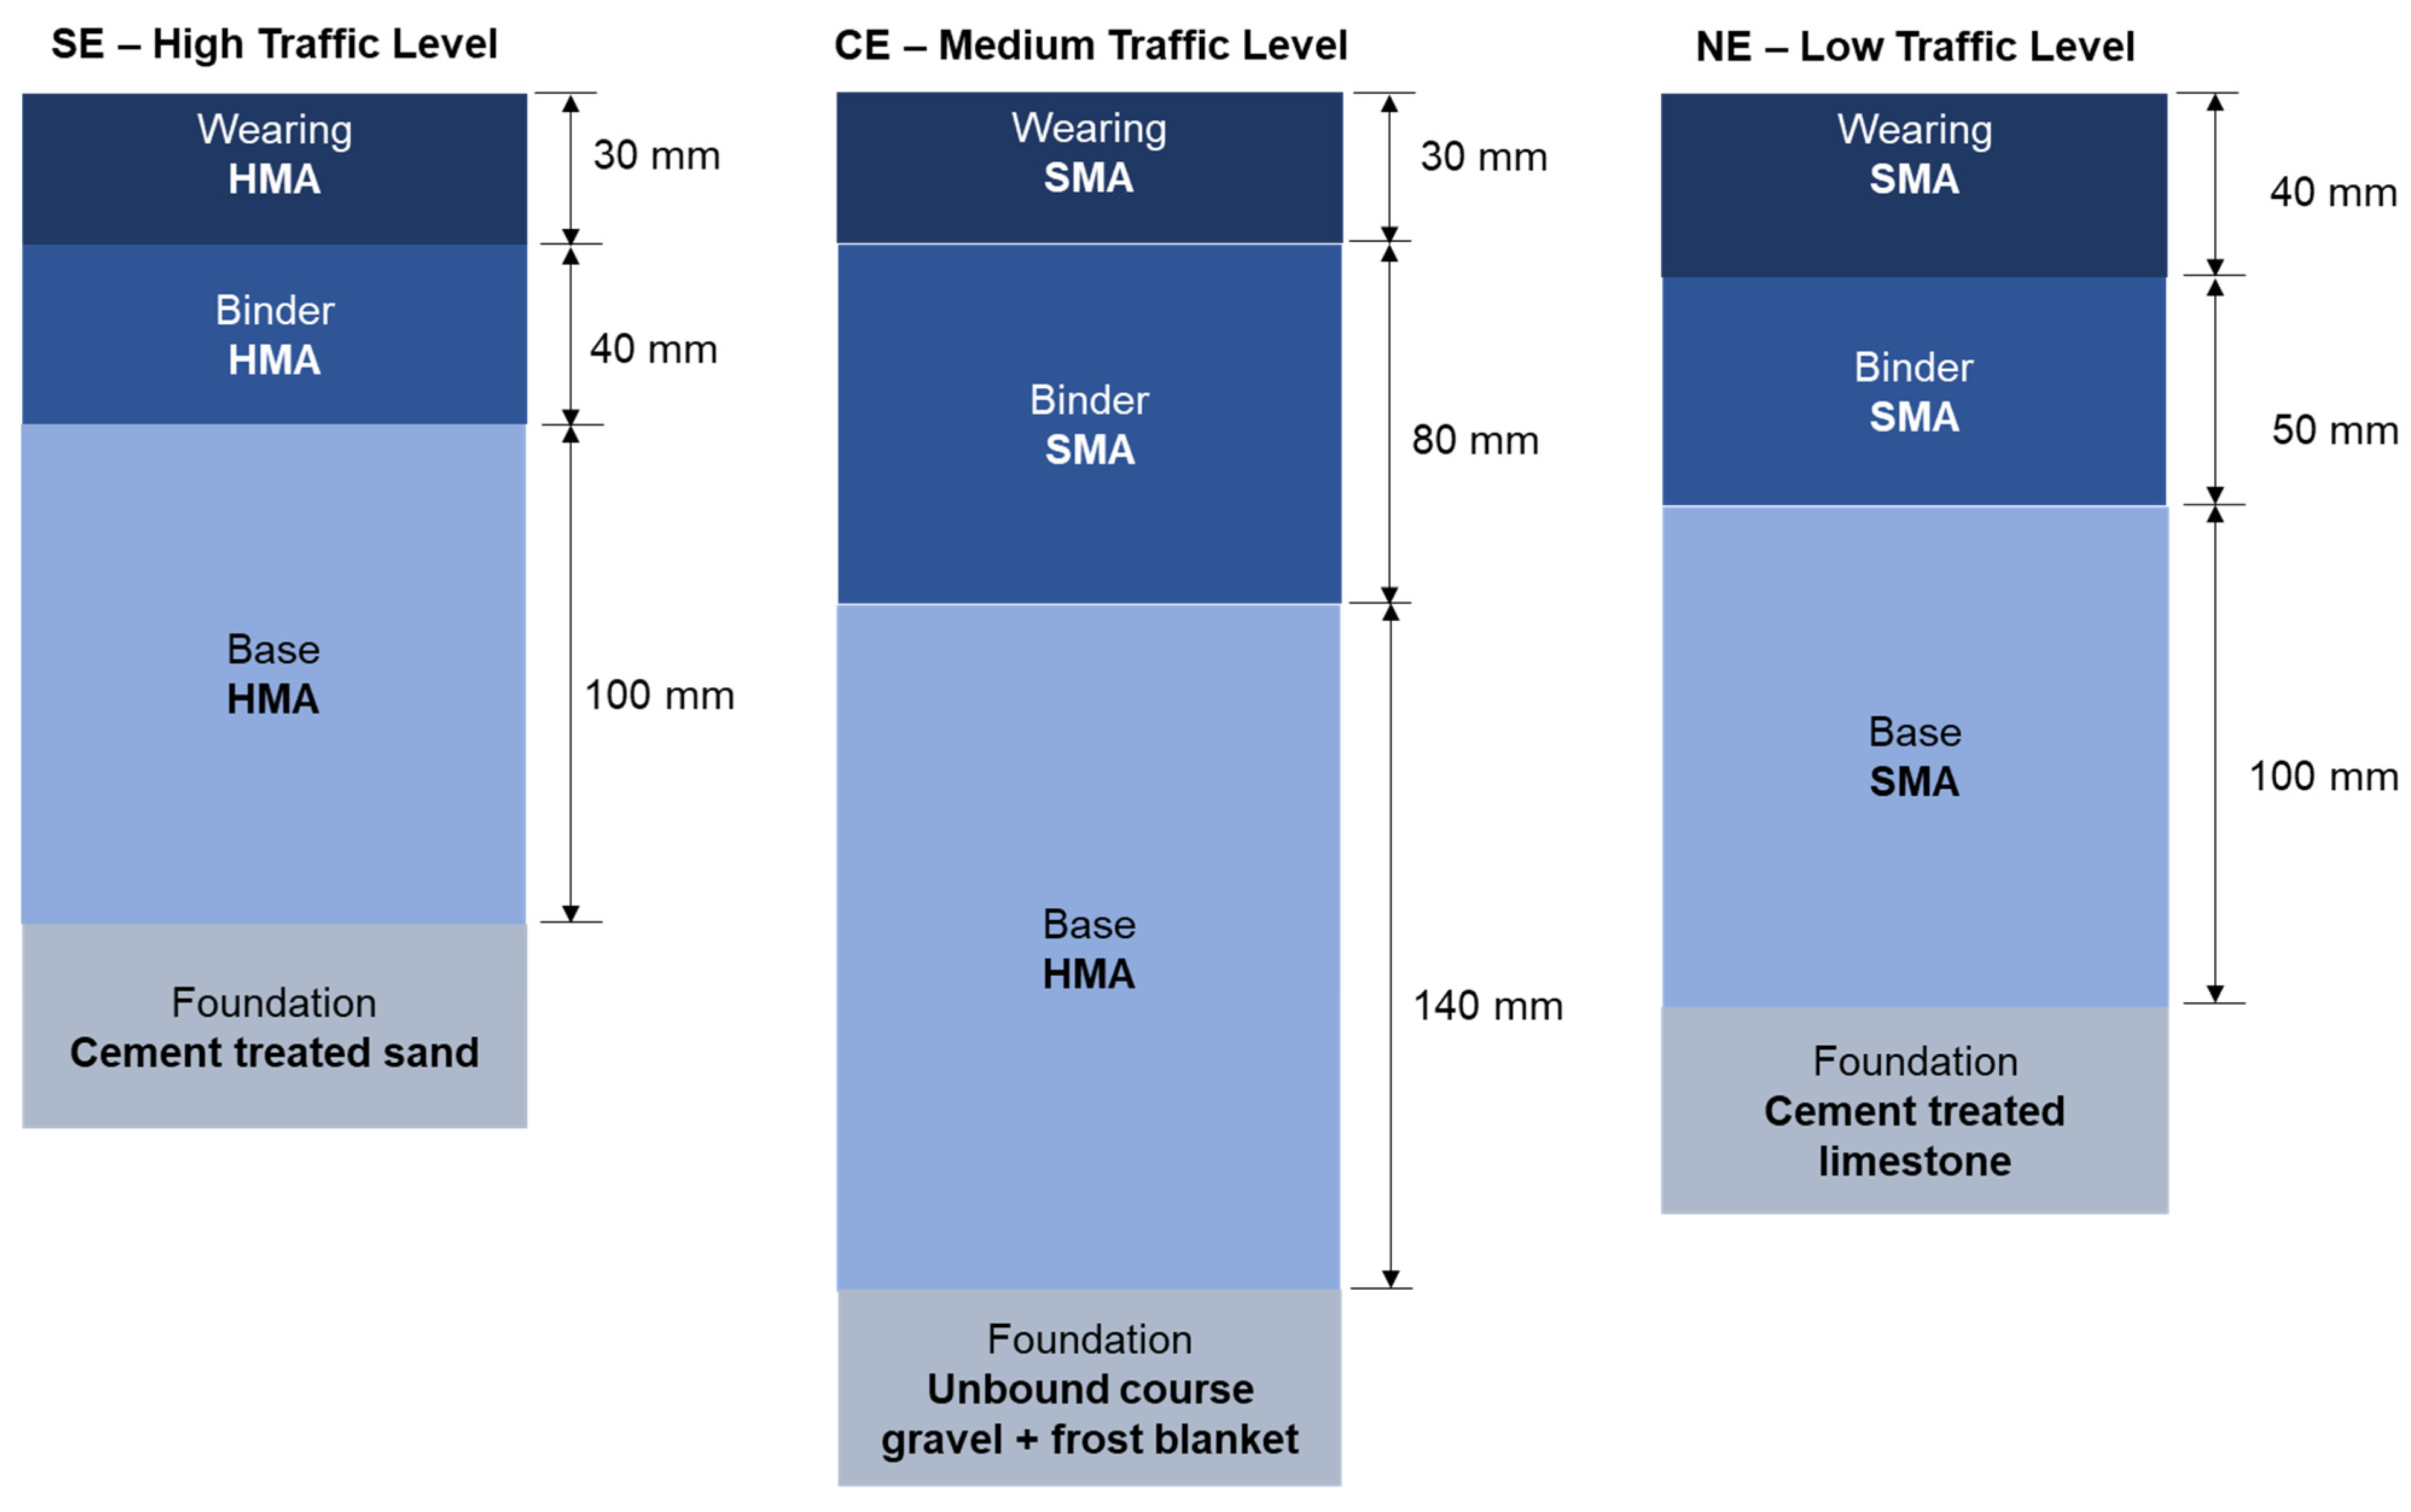
- South Europe: Italy: A repaving operation on a motorway (40,000 ADT) called A19-Palermo–Catania. The road consists of two separate carriageways in each direction that are structurally composed of 170 mm of asphalt (30 mm wearing course, 40 mm binder course, and 100 mm of base) and 300 mm of foundation cement-stabilised sand. The road section, the object of the intervention, is 9.50 m wide and 2000 m long. Usual maintenance of this type of pavement consists of five-year periodic inlay of the wearing course, mainly for skid resistance issues [28], while the binder course is substituted every thirty years.
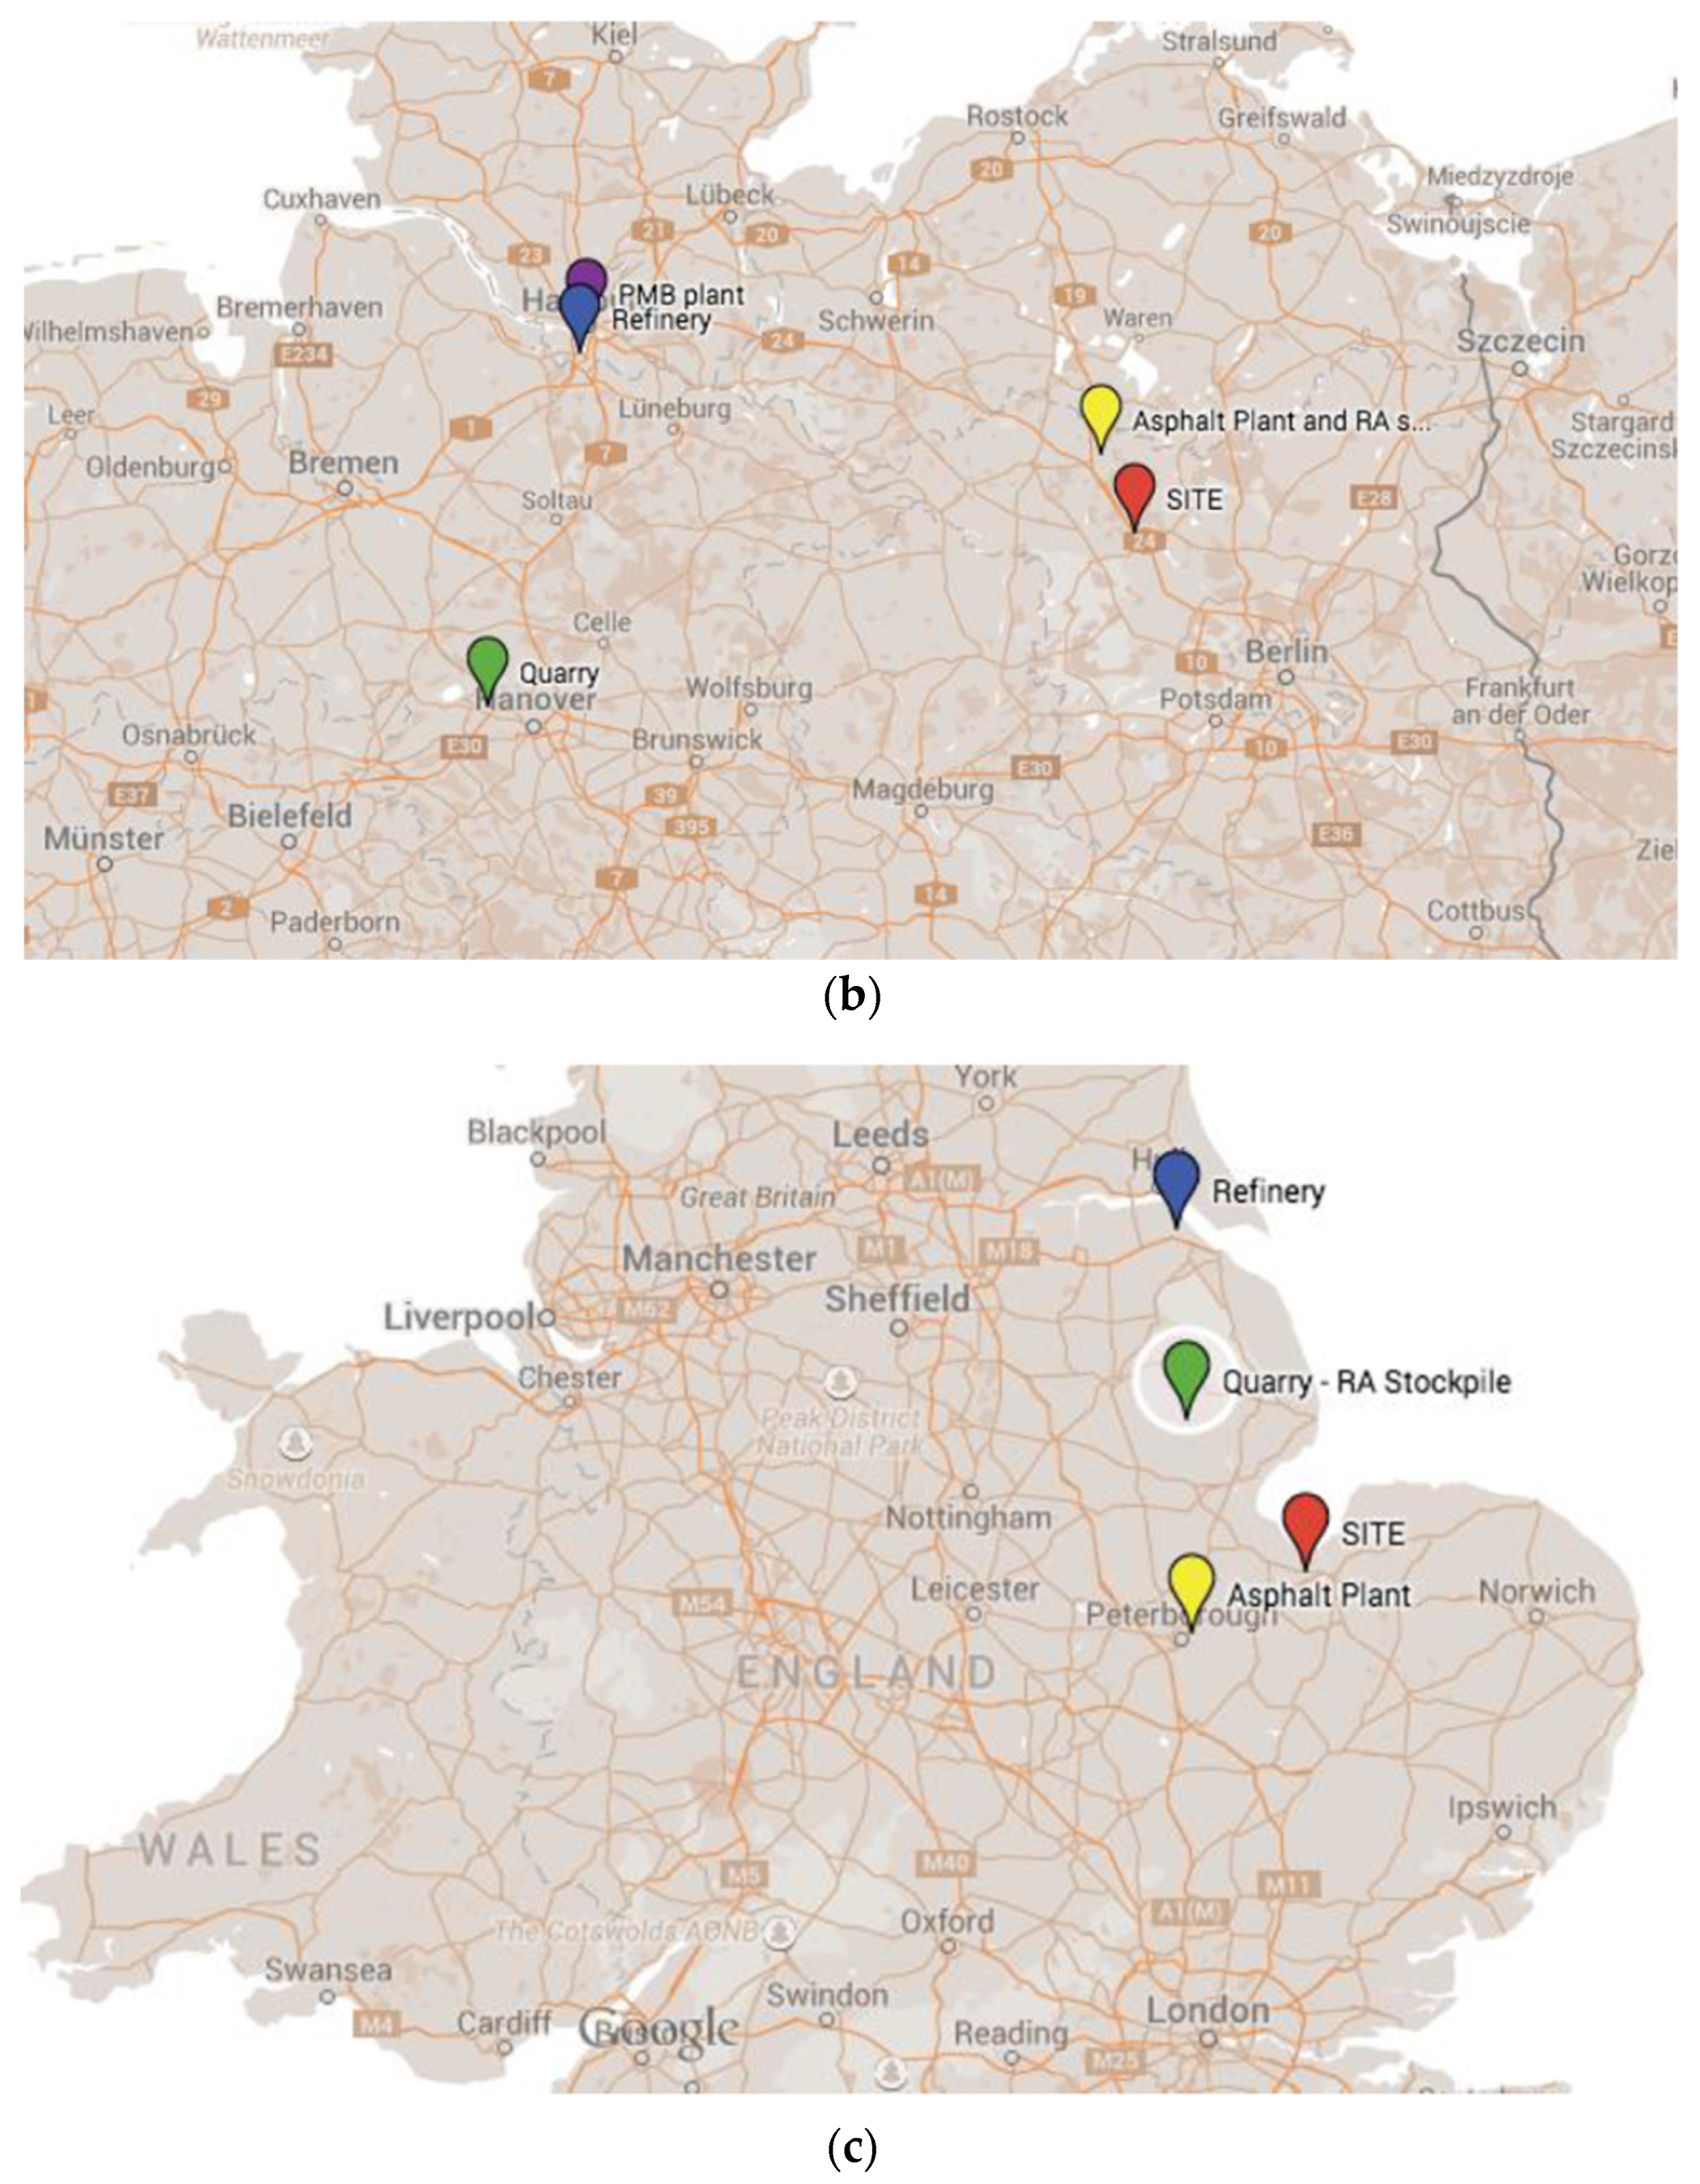
- Central Europe: Germany: A repaving operation on an inter-urban highway called A24 and situated near Berlin with medium traffic volume (20.000 ADT). The structure is composed of 30 mm of wearing course, 80 mm of binder course, 140 mm of base course, 200 mm of unbound gravel base course, and 350 mm of unbound frost blanket. The road section, the object of the intervention, is 11.80 m wide and 800 m long. Usual maintenance for this type of pavement, realised with SMA mixture, consists of sixteen-year periodic inlay of the wearing course [29], while the binder course is substituted every thirty years.
- North Europe: UK: An inlay operation on an inter-urban road with low/medium traffic volume (10.000 ADT) consisting of a single carriageway. The structure is currently composed as follows: 40 mm of wearing course, 100 mm of binder course, and 50 mm of base course. The road section, the object of the intervention, is 11 m wide and 720 m long. The wearing course is realised with SMA mixture, and its maintenance consists of ten-year periodic inlay [30], while the binder course is substituted every thirty years.
- Maintenance strategies: The maintenance strategies were considered similar for all of the case studies. These consisted of the milling and inlay of wearing courses (WCs) enhanced with binder course (BC) inlays and rehabilitation, considering an analysis period of 60 years. This assumption was made to account for the potential benefits, in terms of costs and emissions, linked to the use of RA, which implies reductions in the material stockpiled and the depletion of virgin materials. The maintenance plan was dependent on the reference service life of each pavement component, which was provided as primary data by European NRAs or estimated through laboratory tests [27]. The authors assumed that road pavement foundation and sub courses would not deteriorate and that the asphalt would not go under/over performance. The maintenance procedures consider the details shown below [27] and in Table 4:
- ○
- Surface treatments involve the periodic inlay of wearing course and the occasional inlay of binder and base course.
- ○
- Maintenance is undertaken on one carriageway (two lane) or one lane (single-lane road) at a time, with the traffic diverted onto the other carriageway/lane.
- ○
- Work zones are extended for the whole length and the width of the full carriageway.
- ○
- In the case studies with dual carriageways, maintenance events are considered only in one direction.
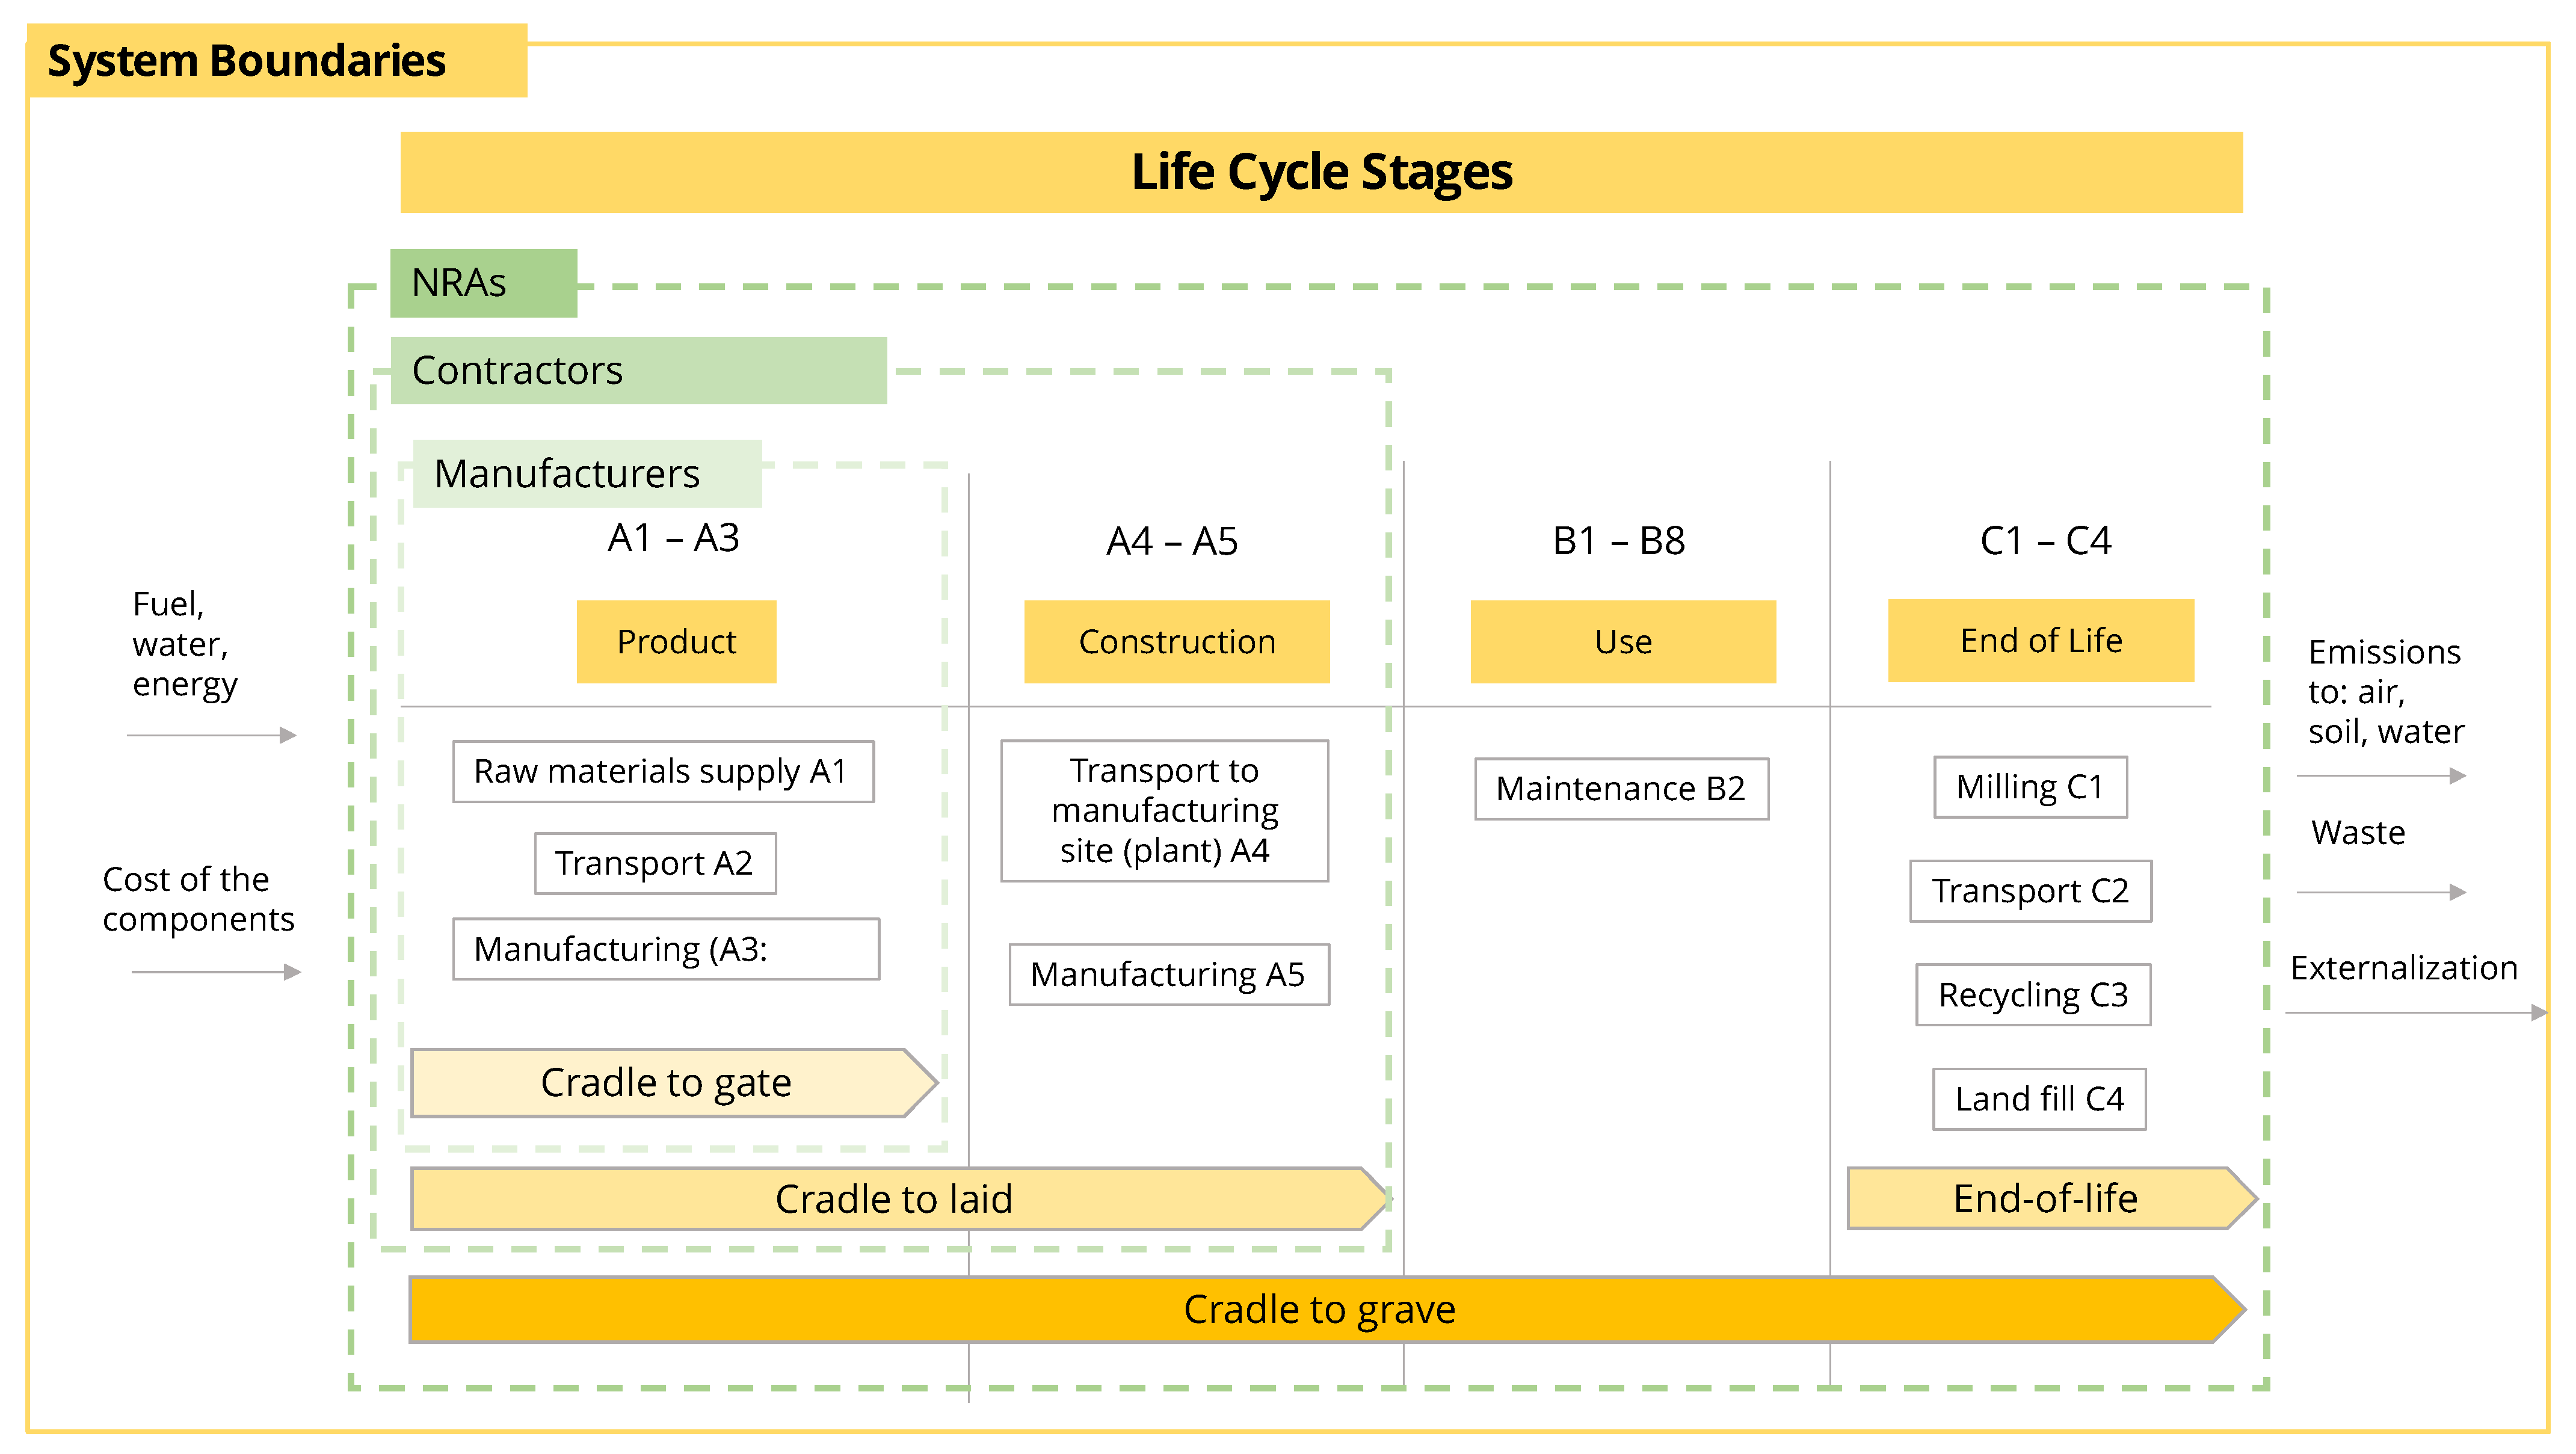
2.2. Environmental Impact Assessment by Means of LCA
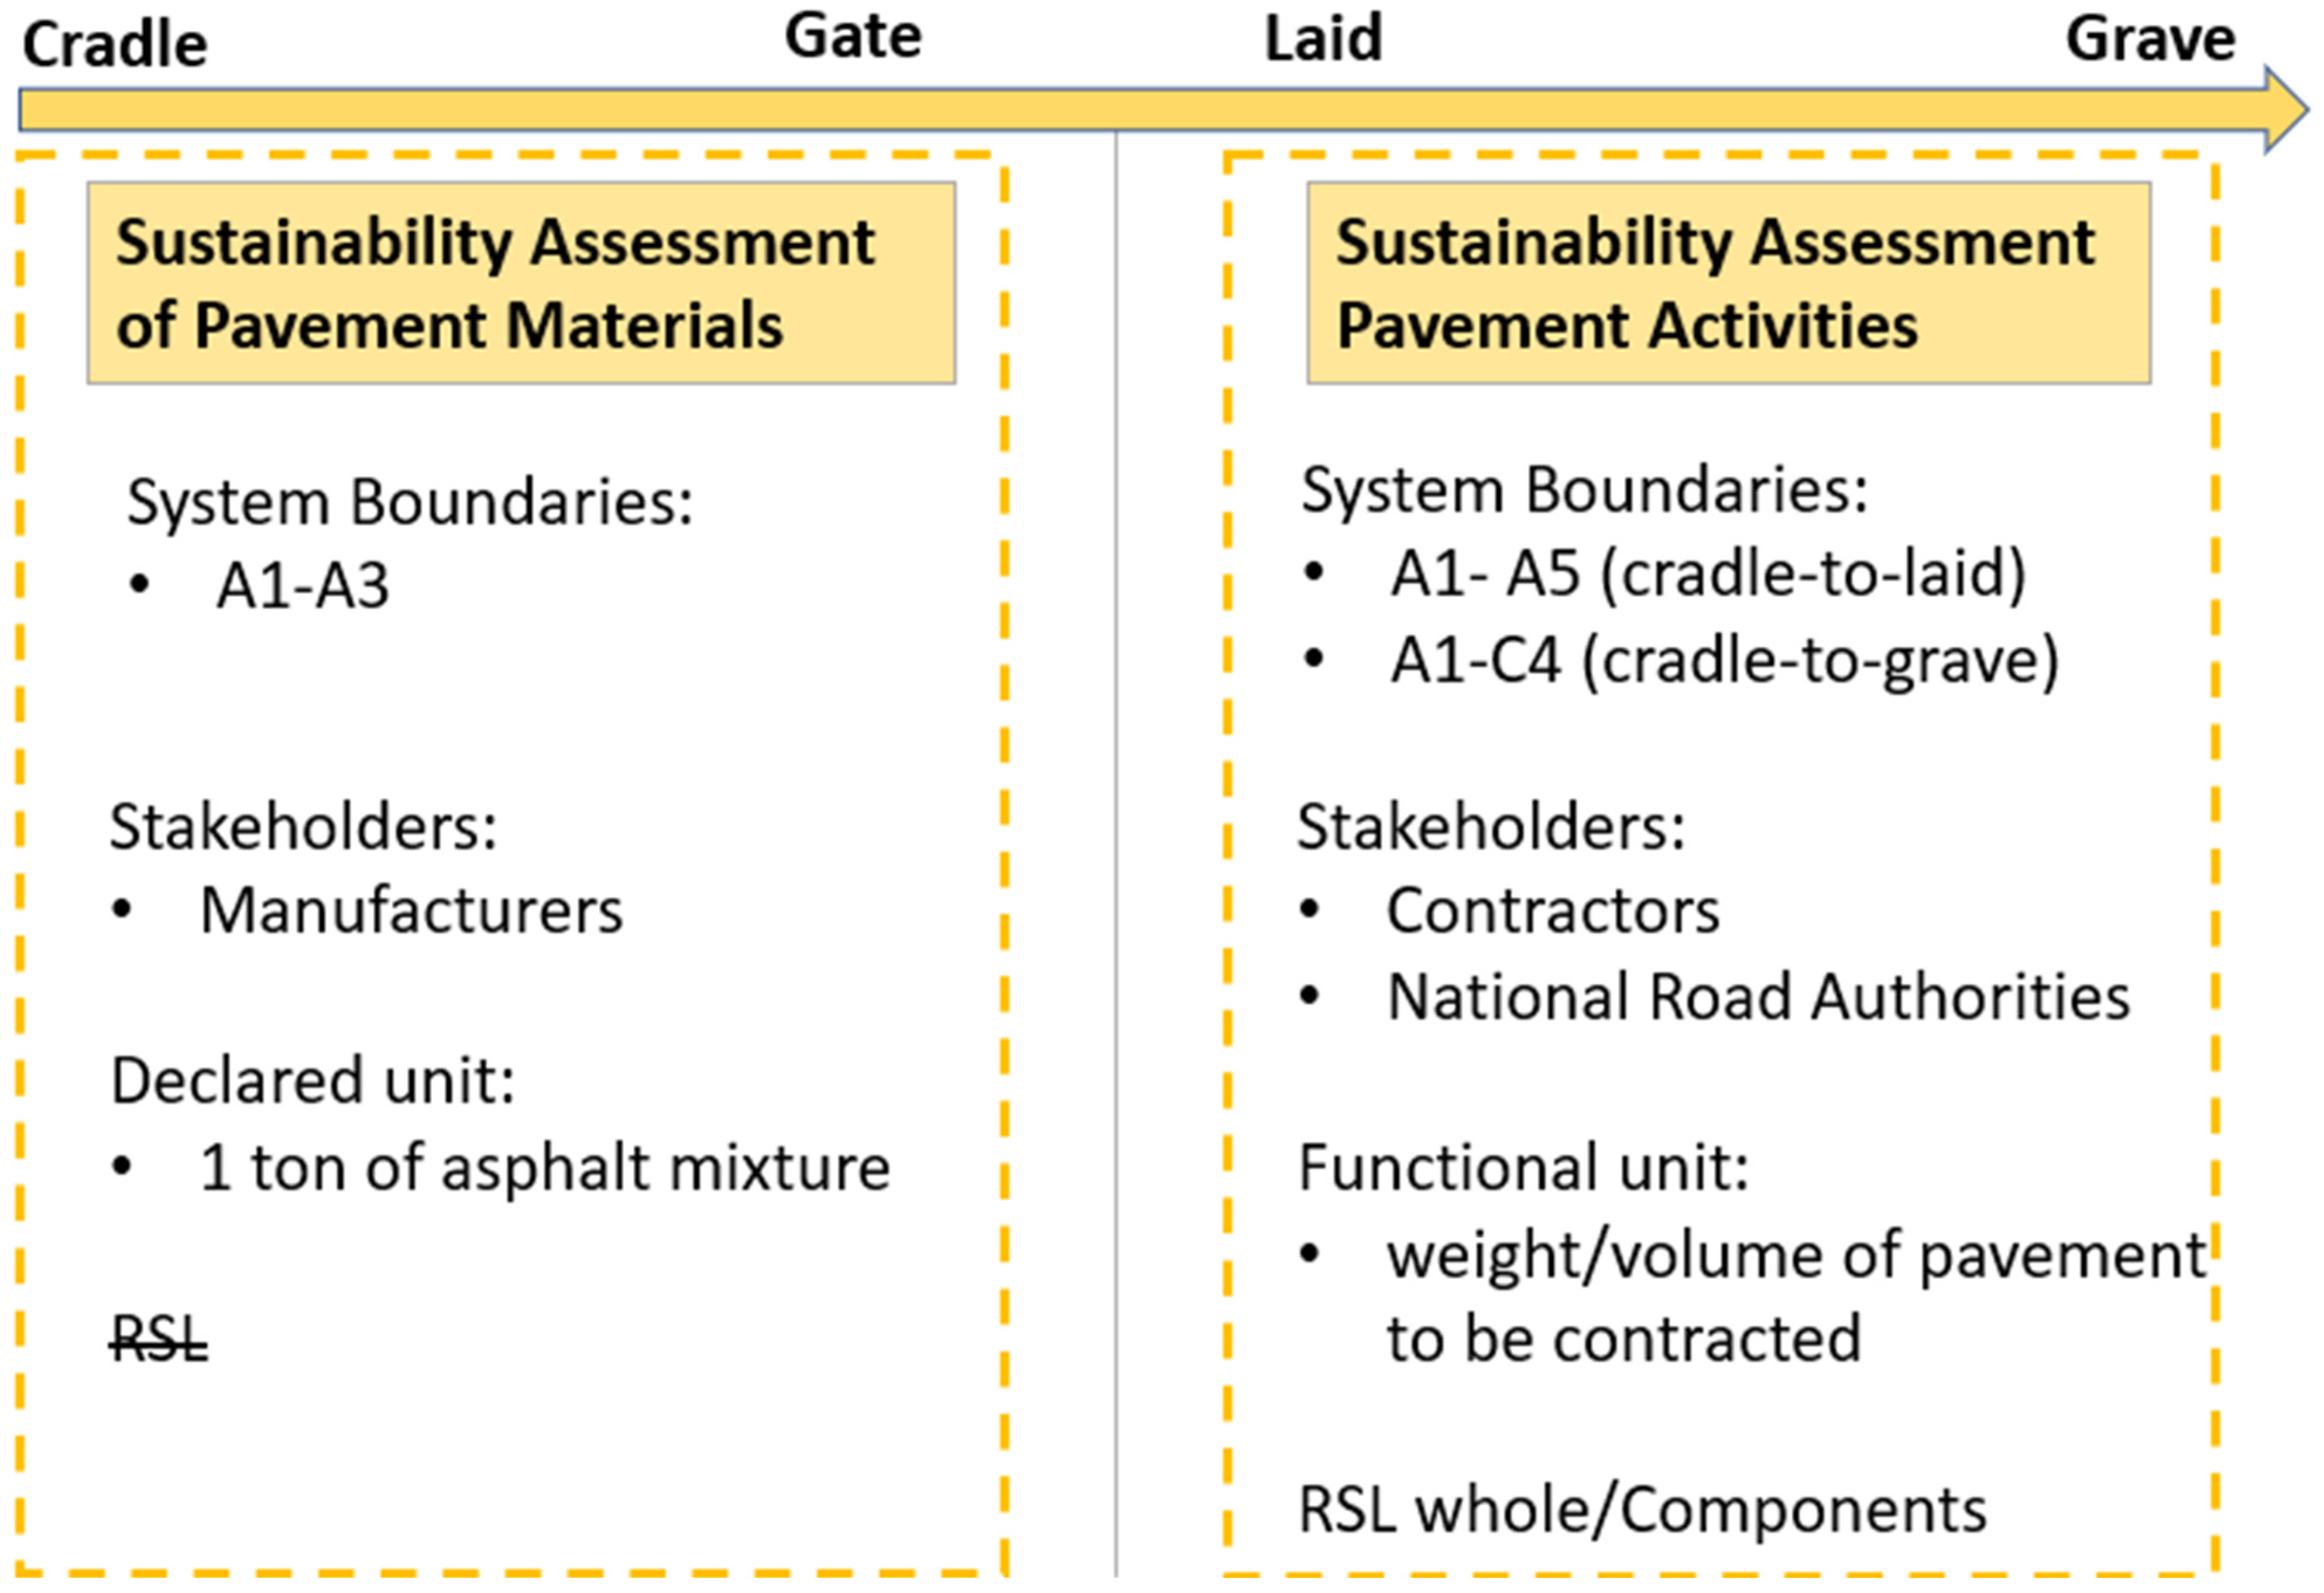
- Asphalt mixture producers: The assessment is related to the production of the asphalt mixtures (cradle-to-gate), and the declared unit is assumed to be one ton of asphalt mixture.
- Pavement contractors: The evaluation concerns the installation of a pavement component(s) (cradle-to-laid), and the functional unit is the total weight of the pavement component(s) to be contracted, considering only a reference service (i.e., 10 years for a wearing course)
- Road pavement agencies: The assessment relates to the comparison of the maintenance strategies (over a certain analysis period (laid-to-grave)), and the functional unit is a square meter of road pavement and/or the total weight of pavement component(s) to be contracted.
2.2.1. Goal and Scope Definition
- Understanding of the environmental benefits related to asphalt recycling.
- Understanding of the pros and the cons of using these new technologies when compared to current baselines.
- Support of more sustainable decision-making processes among asphalt mixture producers.
- A “cradle-to-gate” perspective for the pavement materials, considering only the production of the asphalt mixtures;
- A “cradle-to-laid” and a “cradle-to-grave” perspective were considered if the object of the assessment was pavement activities and therefore the wearing course. In the first case, the focus was on the production of the material and the installation of the layer; in the second case, all the necessary stages from the extraction to the end-of-life were considered.
2.2.2. Life Cycle Inventory (LCI)
- Production phase (A1–A3)
- ○
- Raw materials supply (A1): The inventories (Table 2) include all the information linked to the components used, such as aggregates, neat bitumen, polymer-modified bitumen, fibres, and the STORBIT PLUS Rejuvenator (which is a composition of high-viscosity second refinement known for its higher viscosity STORFLUX PLUS and Fischer Tropsch Wax; it has a solid state of aggregation at room temperature).
- ○
- Transport (A2): This includes the distances between raw material suppliers and the asphalt plant. In this case study, all the constituents are locally sourced, excluding the additive imported from Germany (Table A5).
- ○
- Manufacturing (A3): This includes energy consumption required in the plant and the typology of the fuel. Some data were directly provided (i.e., quantity of energy used), while other data was assumed and taken from the literature, including:
- ○
- The consumption of electricity and fuel oil, taken from UK grid;
- ○
- The activity of soluble binder in RA, which was fixed to 80% (partial blending) to have an average of the two extremes considered during the mix design (100% and 60%);
- ○
- The content of soluble binder in the RA fraction;
- ○
- An increase of 10% due to RA aggregate heating, considered to account for fuel consumption [34].
- ●
- Installation (A4–A5)
- ○
- According to asPECT protocol, laying and compacting impacts were considered as 4.7 kg CO2eq per ton of asphalt.
- ○
- Tack coat bitumen emulsion is applied at a rate of 0.4 L/m2 of laid asphalt [32].
- ○
- Unless otherwise stated, it is assumed that all the materials used at the site come from the asphalt plant.
- ●
- Use phase (B2)
- ○
- milling of the pavement course to be substituted, including 10 mm of regulating course.
- ○
- installation of new course, with the same inputs and outputs reported in A1–A5.
- ●
- End-of-Life (C1–C3)
2.2.3. Life Cycle Impact Assessment (LCIA)
2.2.4. Interpretation of Results
2.3. Economic Impact Assessment by Means of LCC
- Establish alternative pavement design strategies:
- 2.
- Determine performance periods and activity timing:
- 3.
- Estimate agency costs:
- 4.
- Net Present Value
3. Results and Discussion
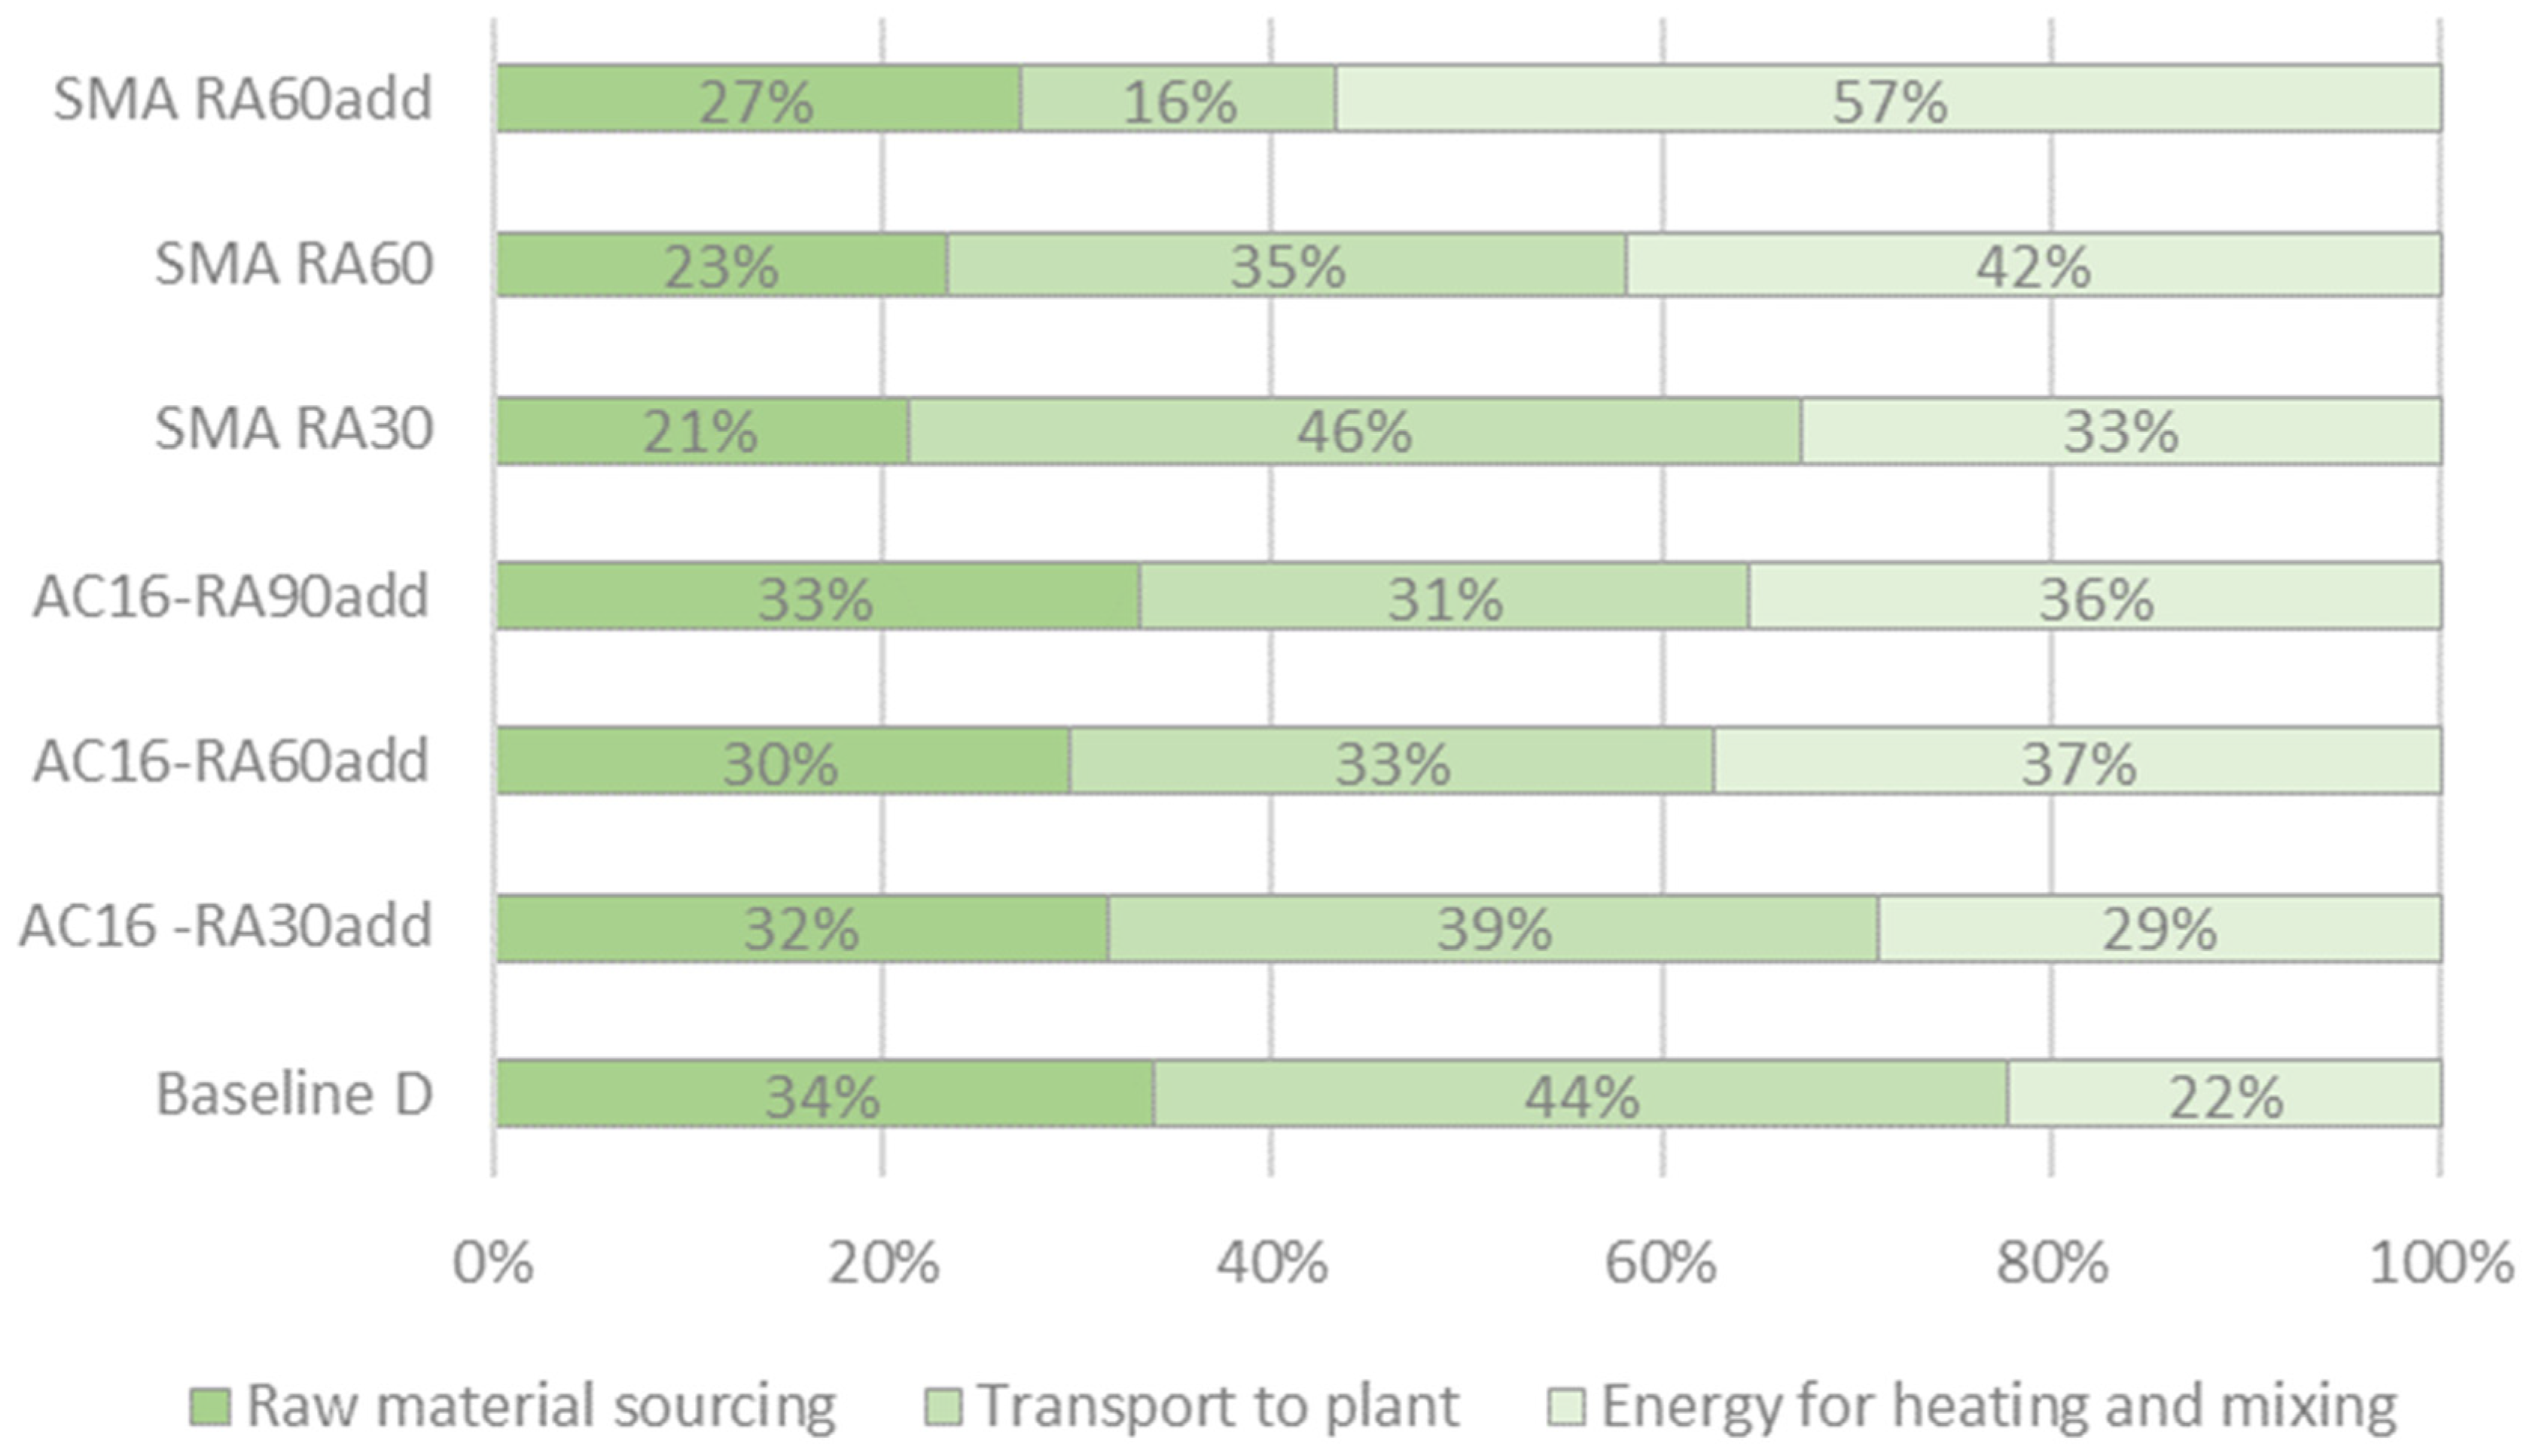
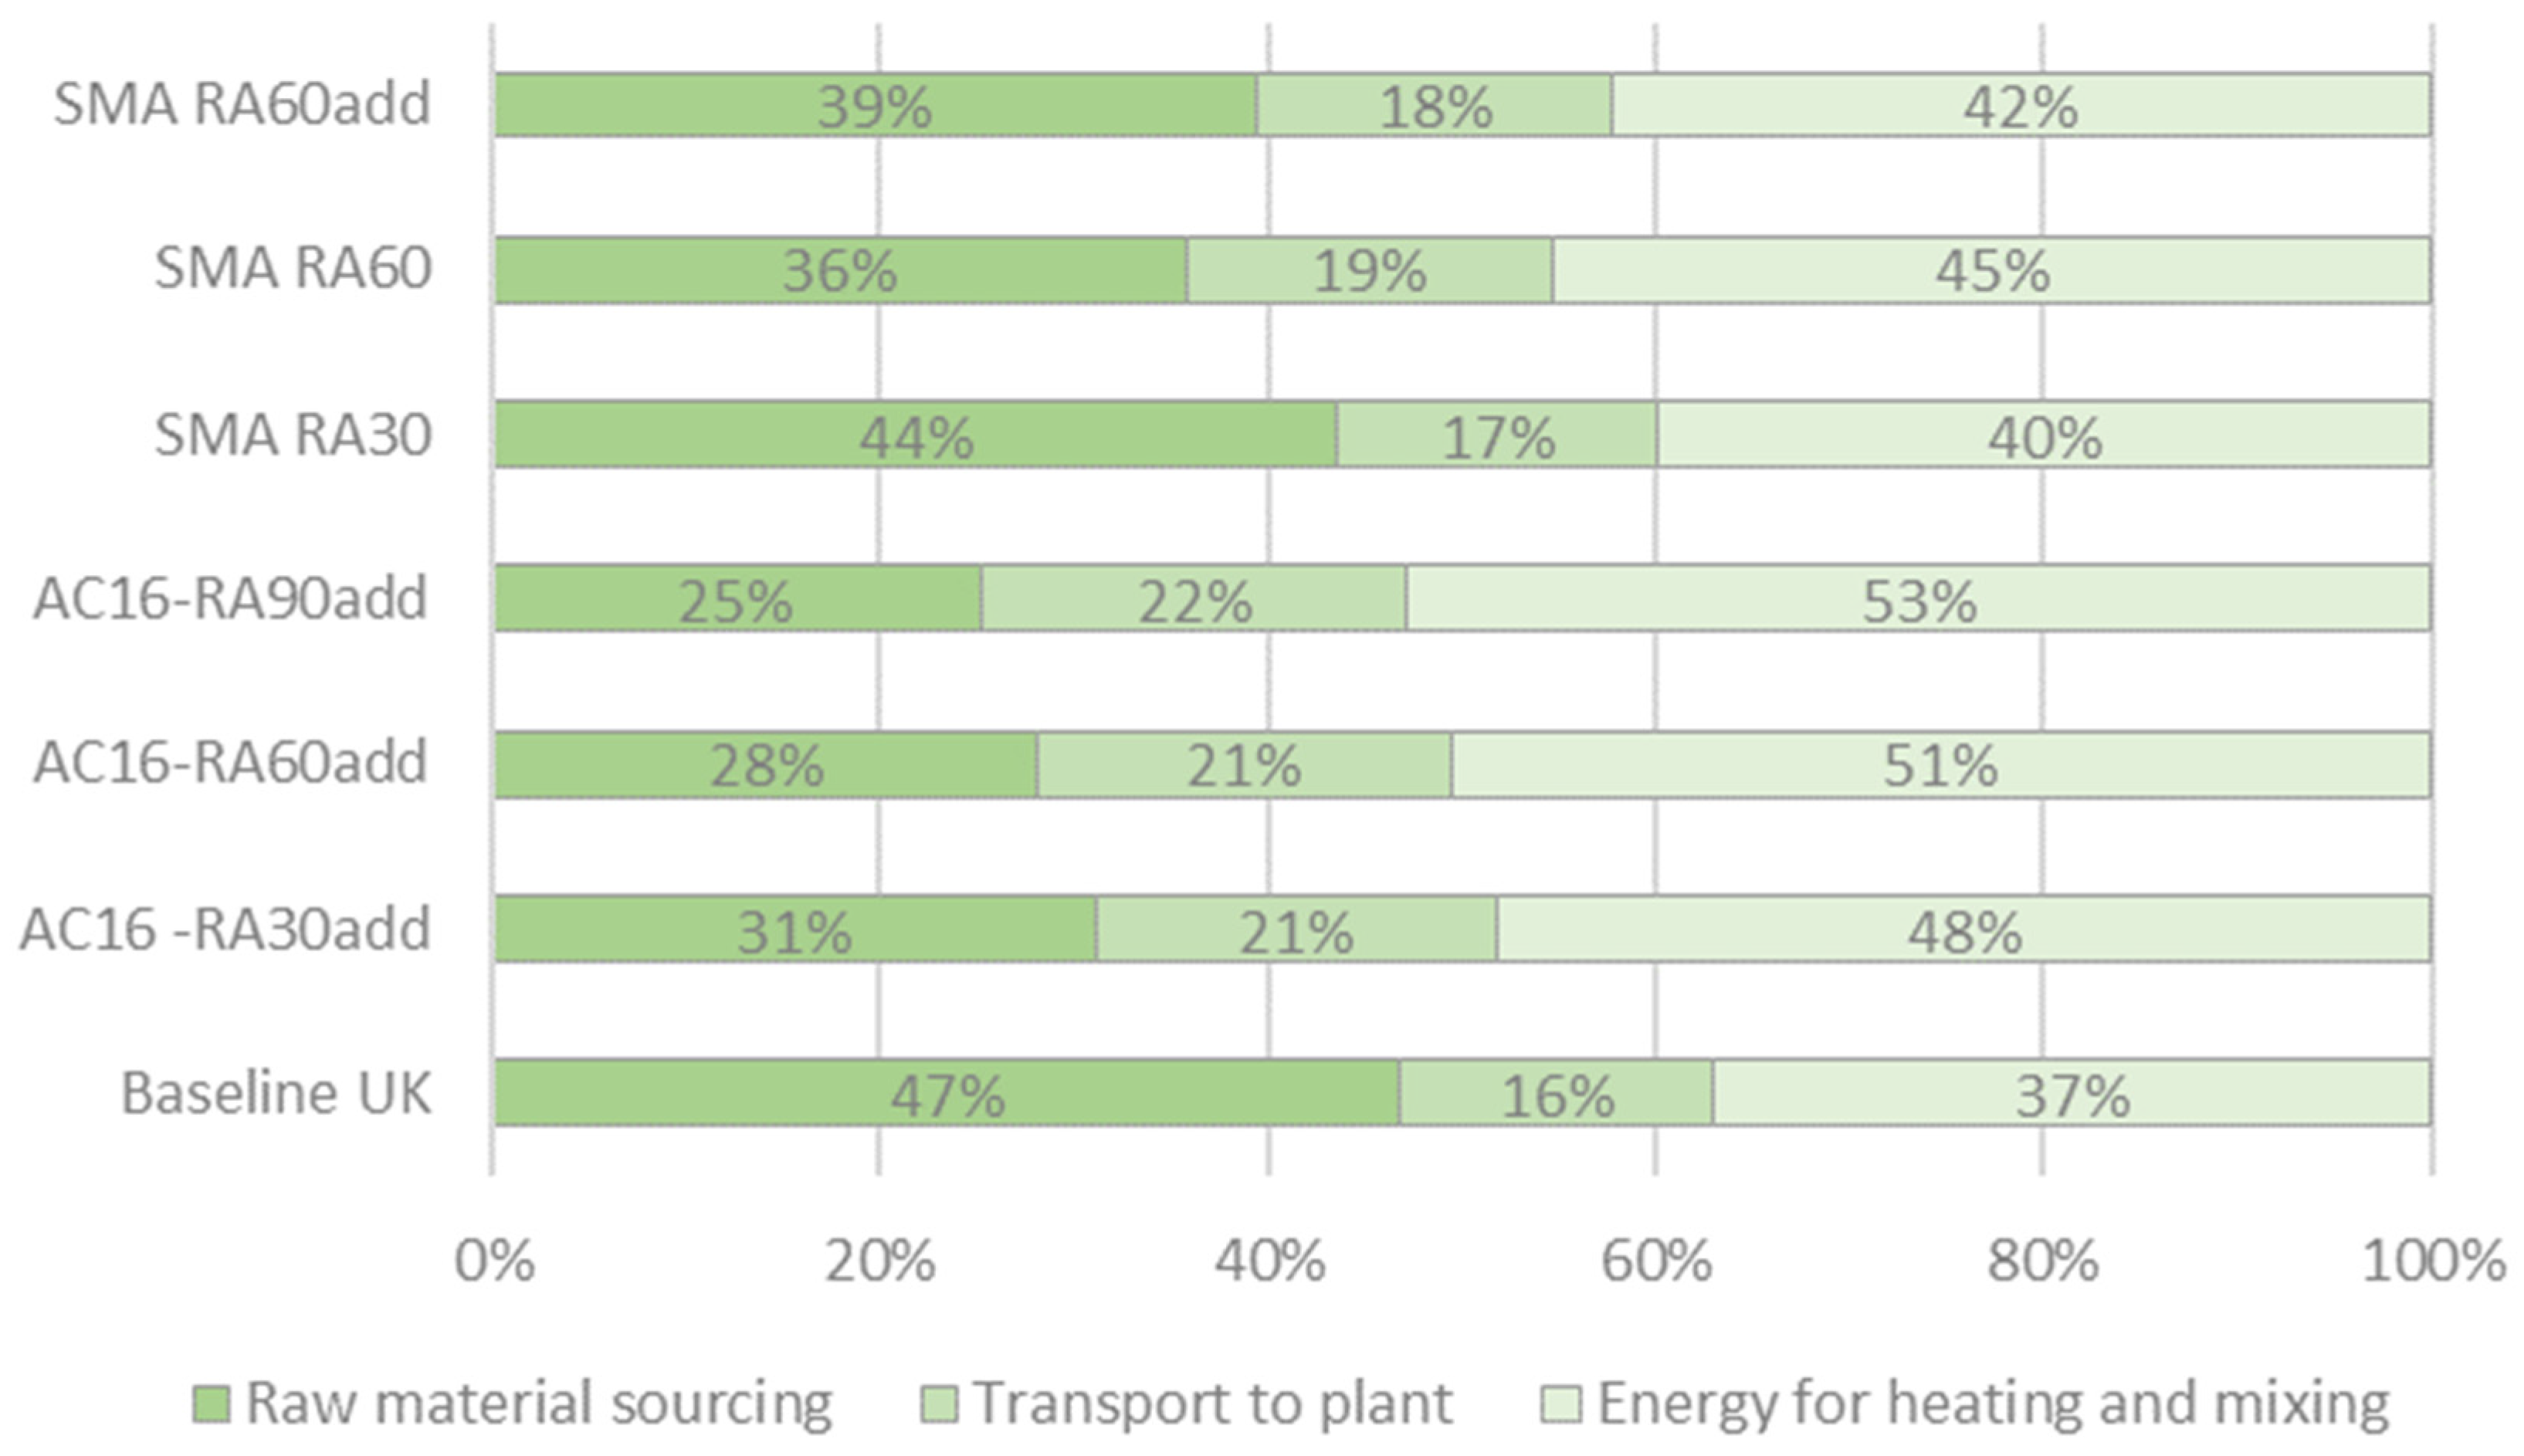
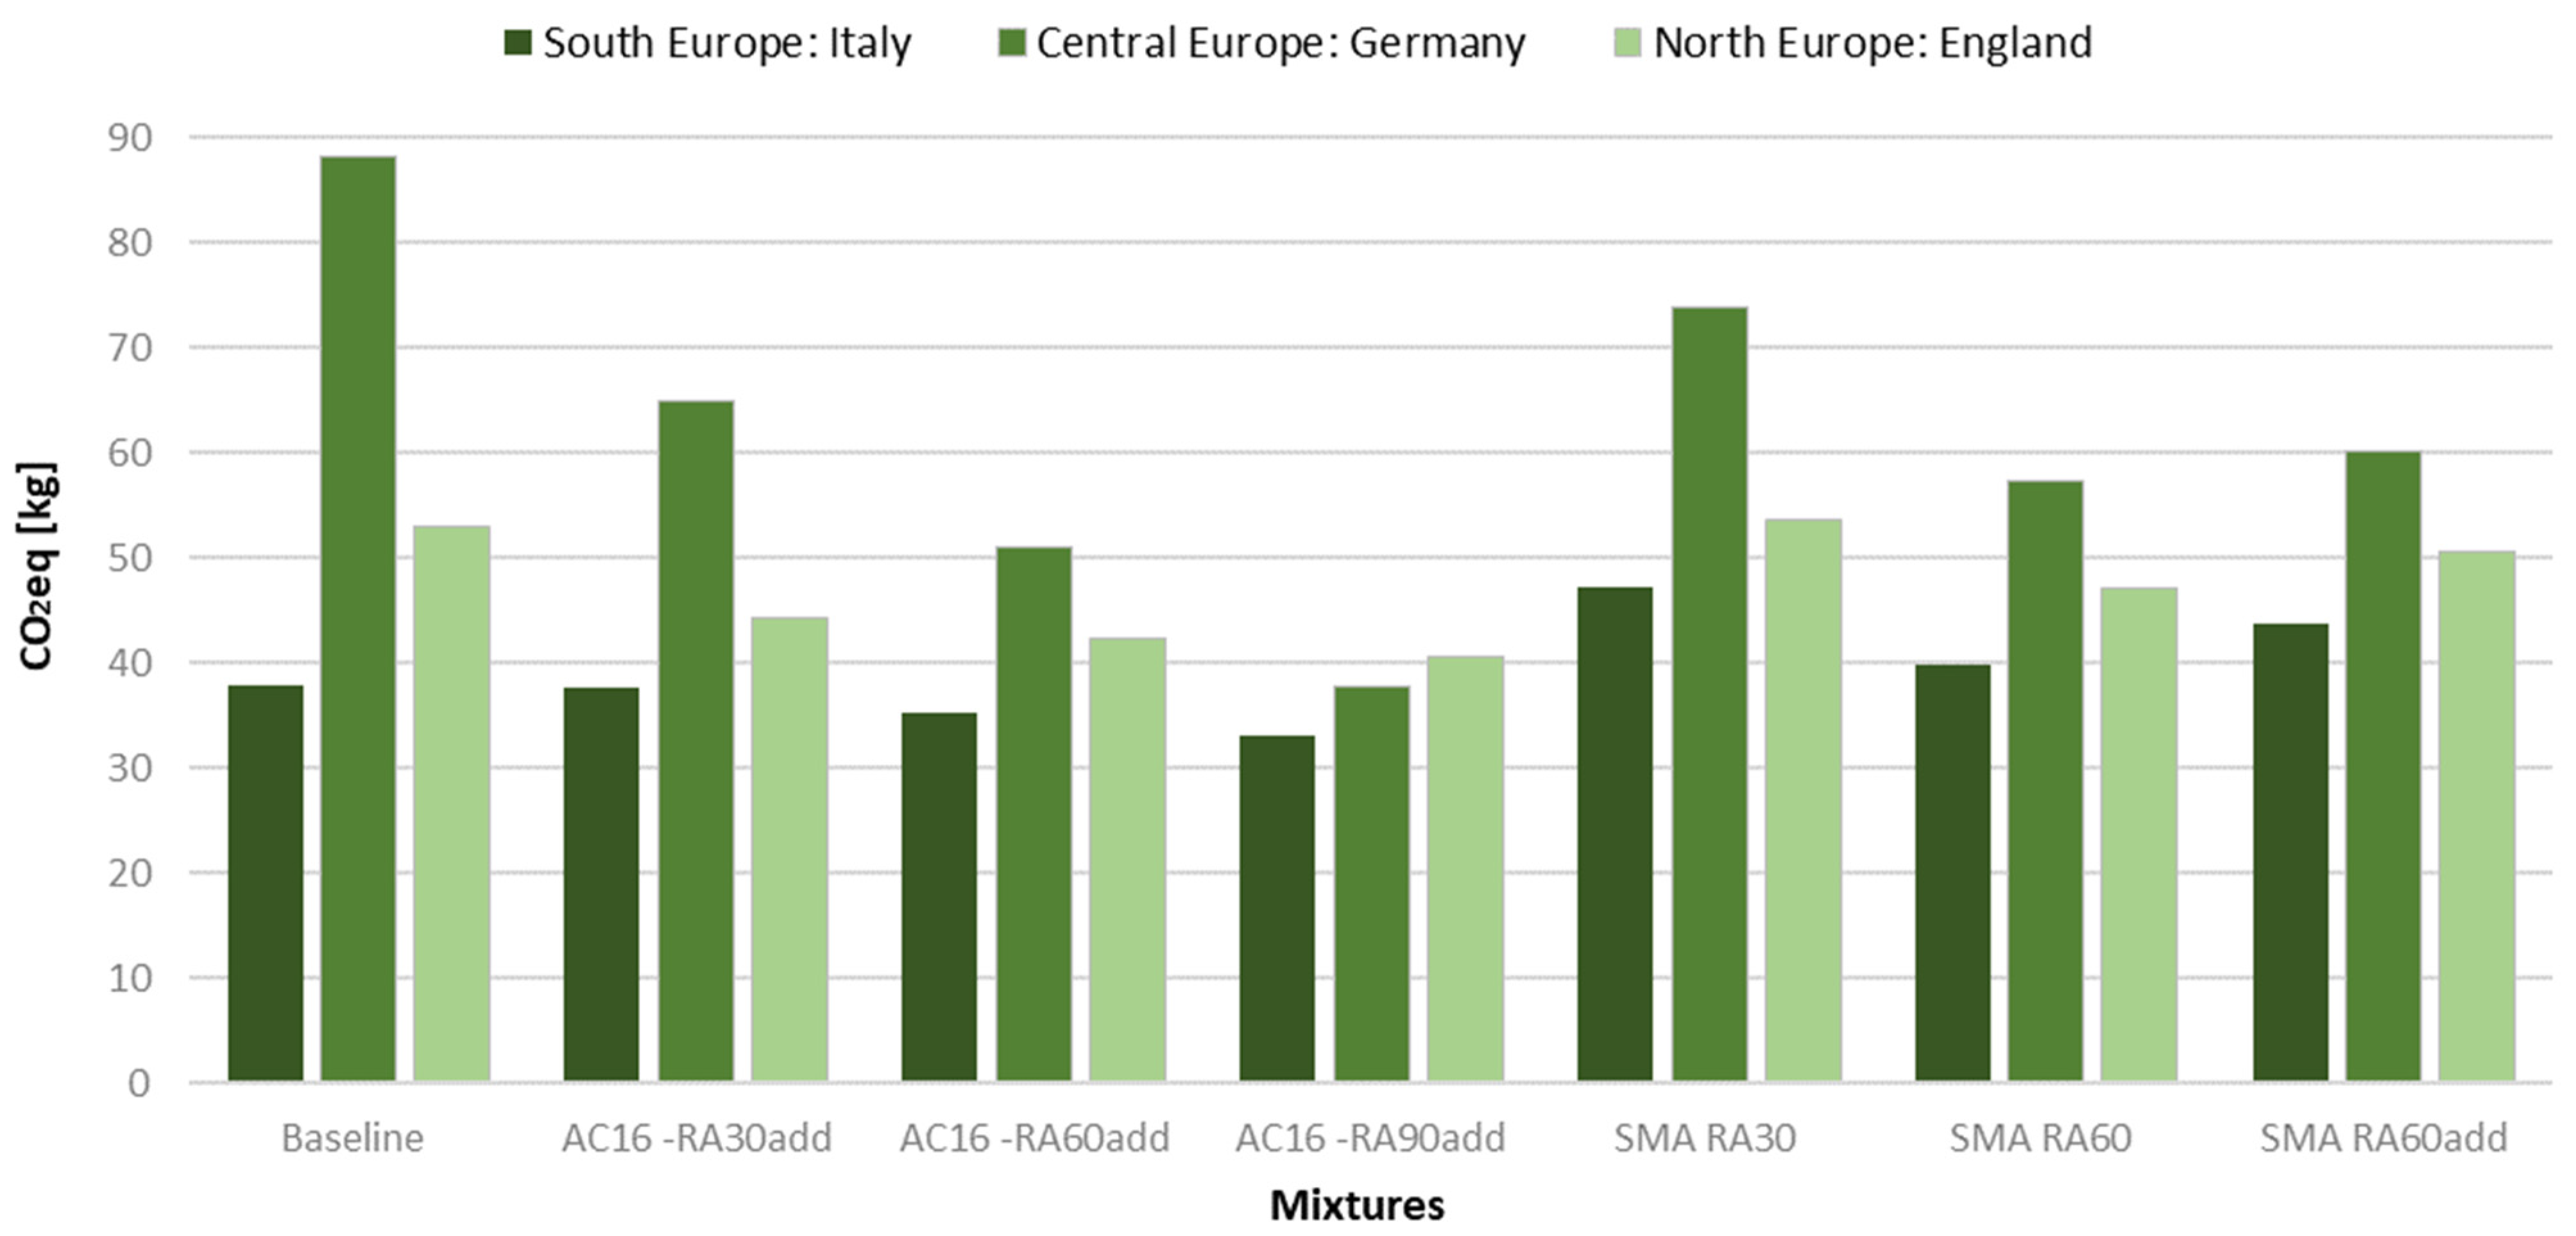
3.1. Calculation of Environmental Performance
- Pavement Material–Manufacturers (A1–A3)
- Pavement Activities–Contractors (A1–A5)
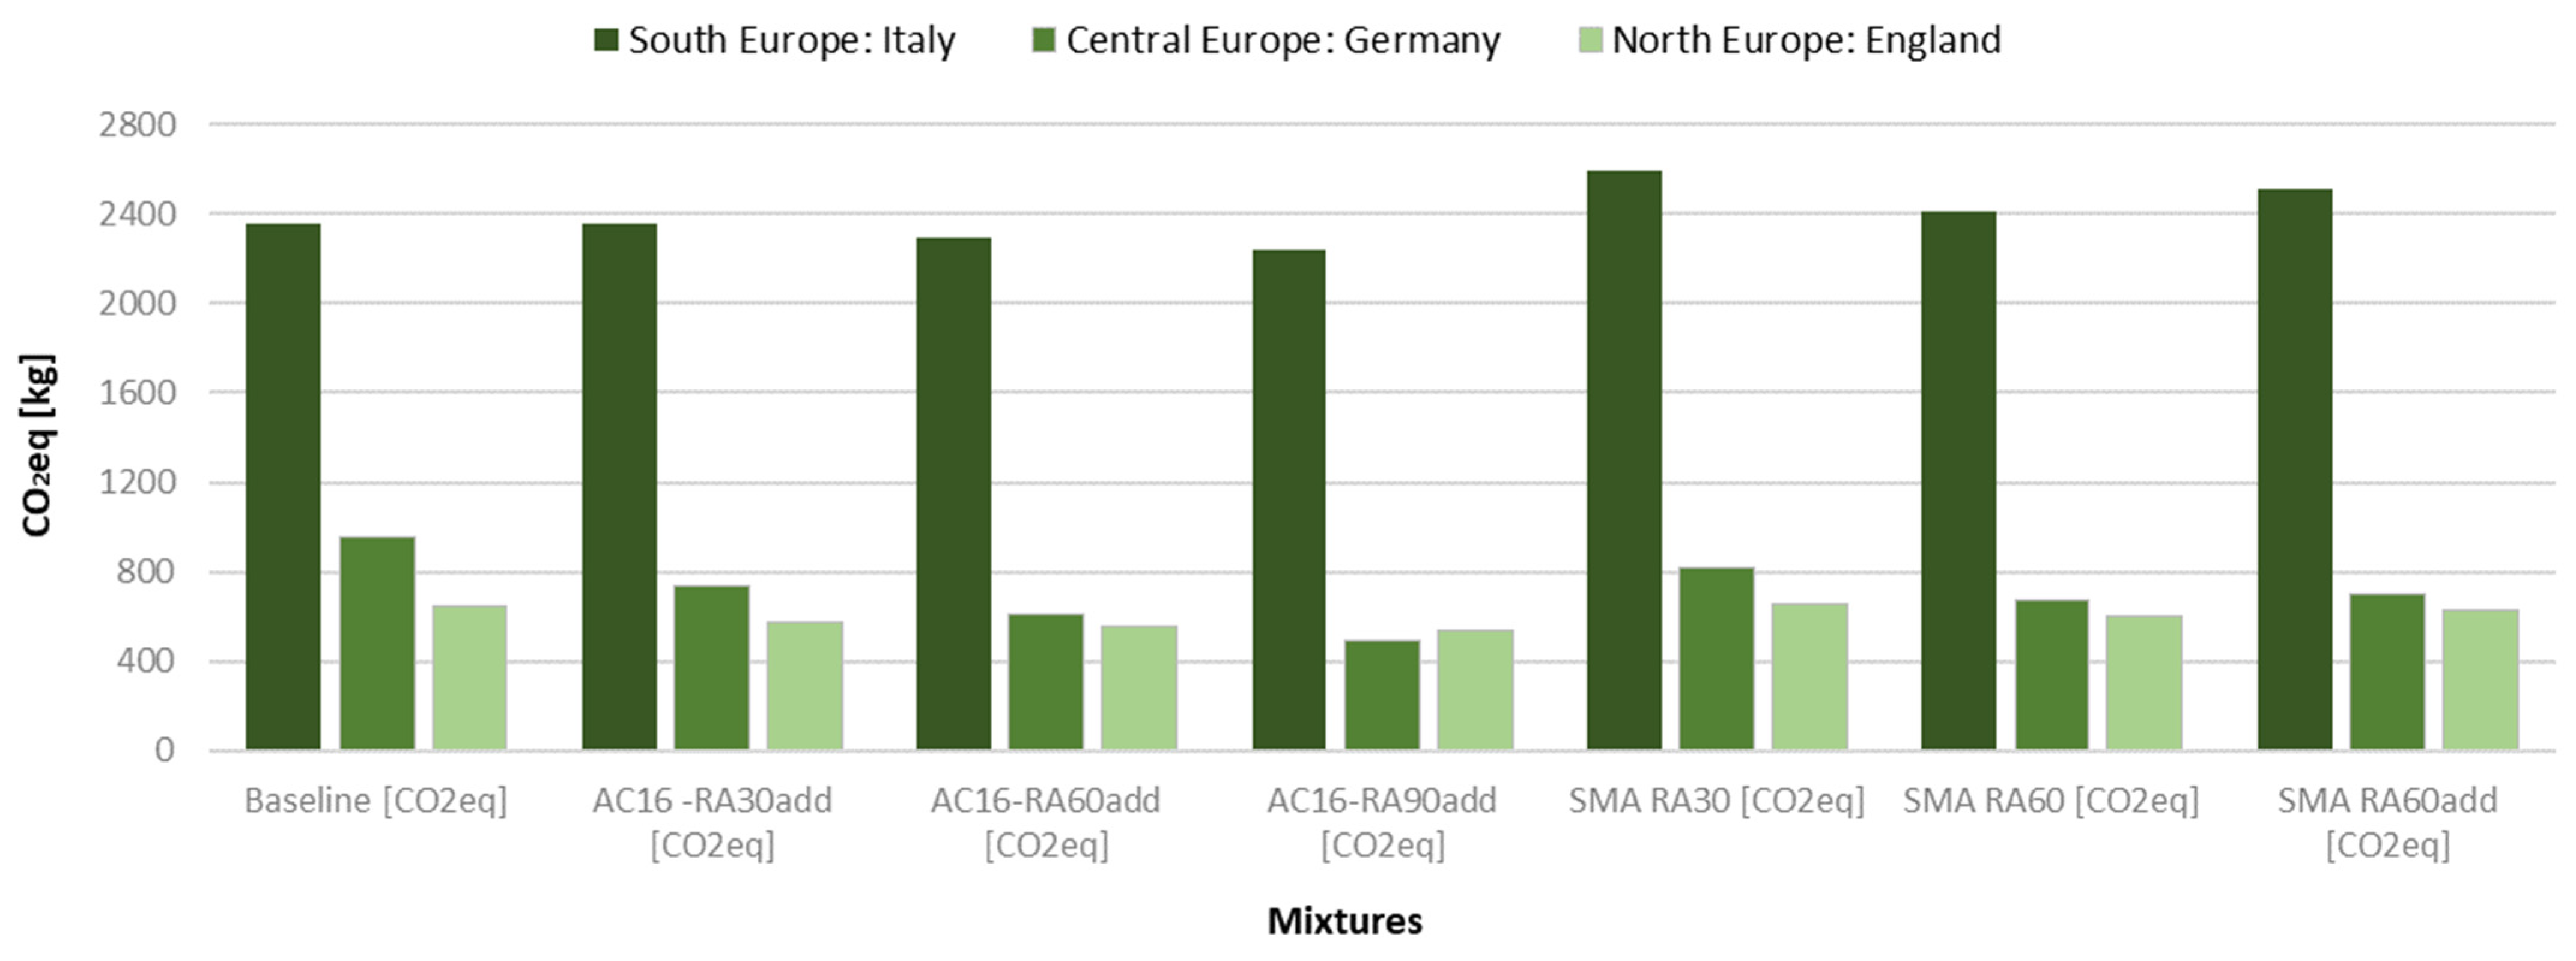
- Pavement Activities–NRAs (A1–C3)
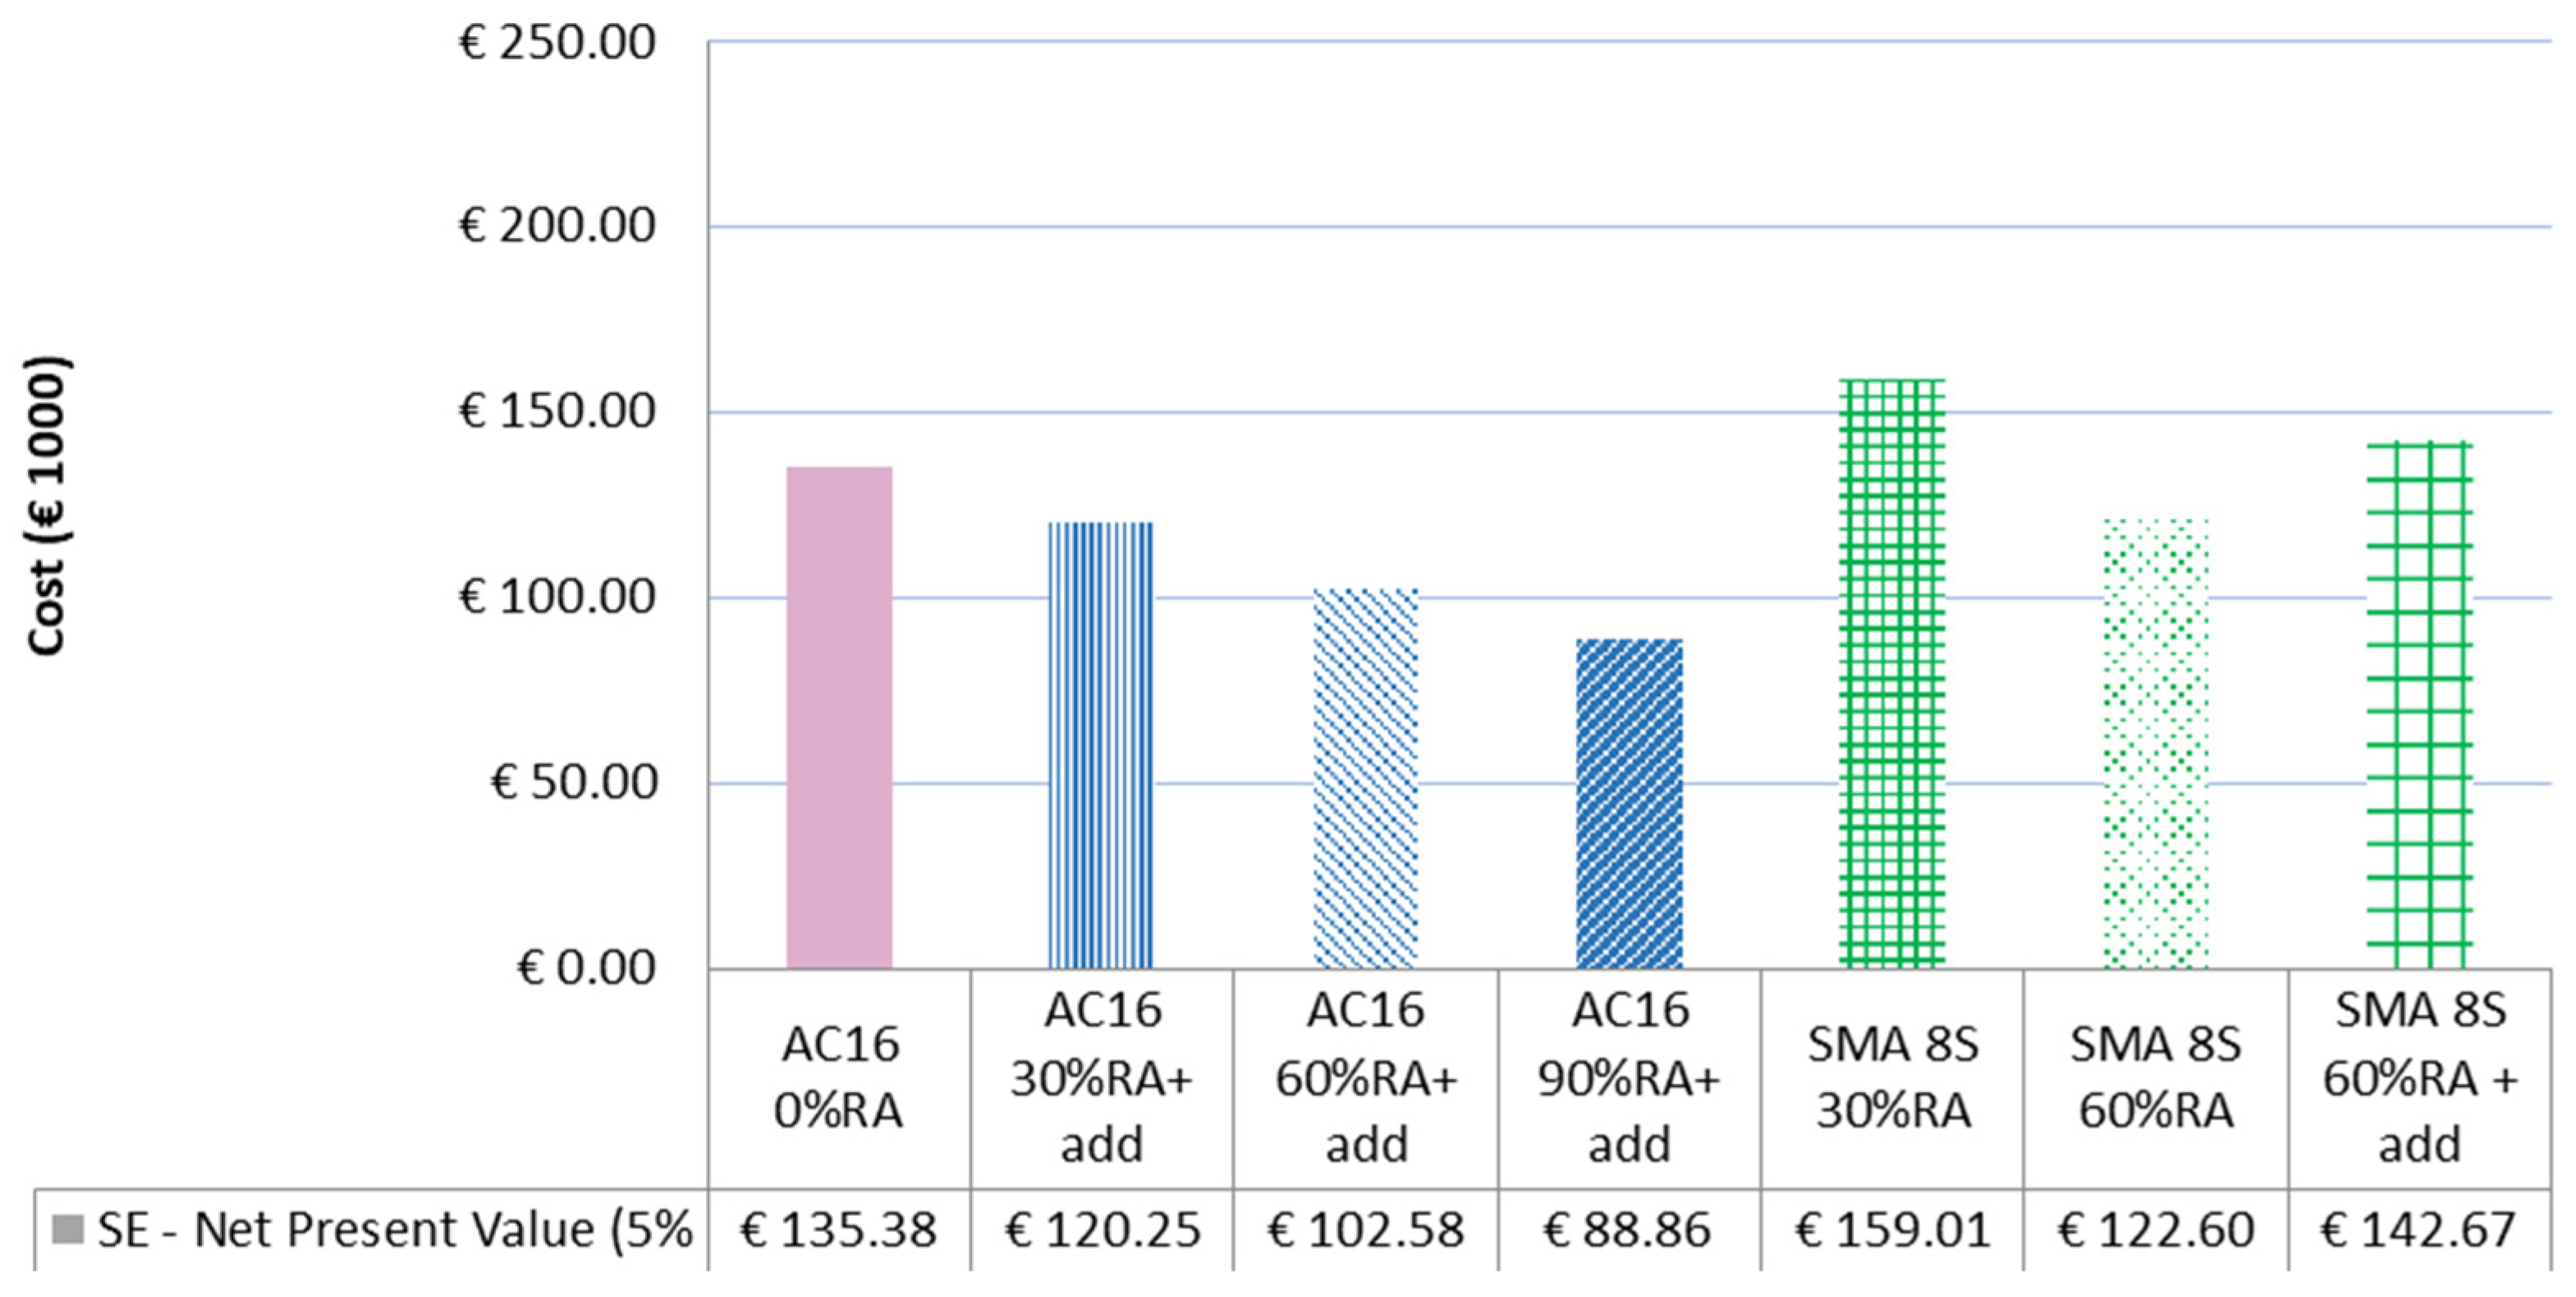
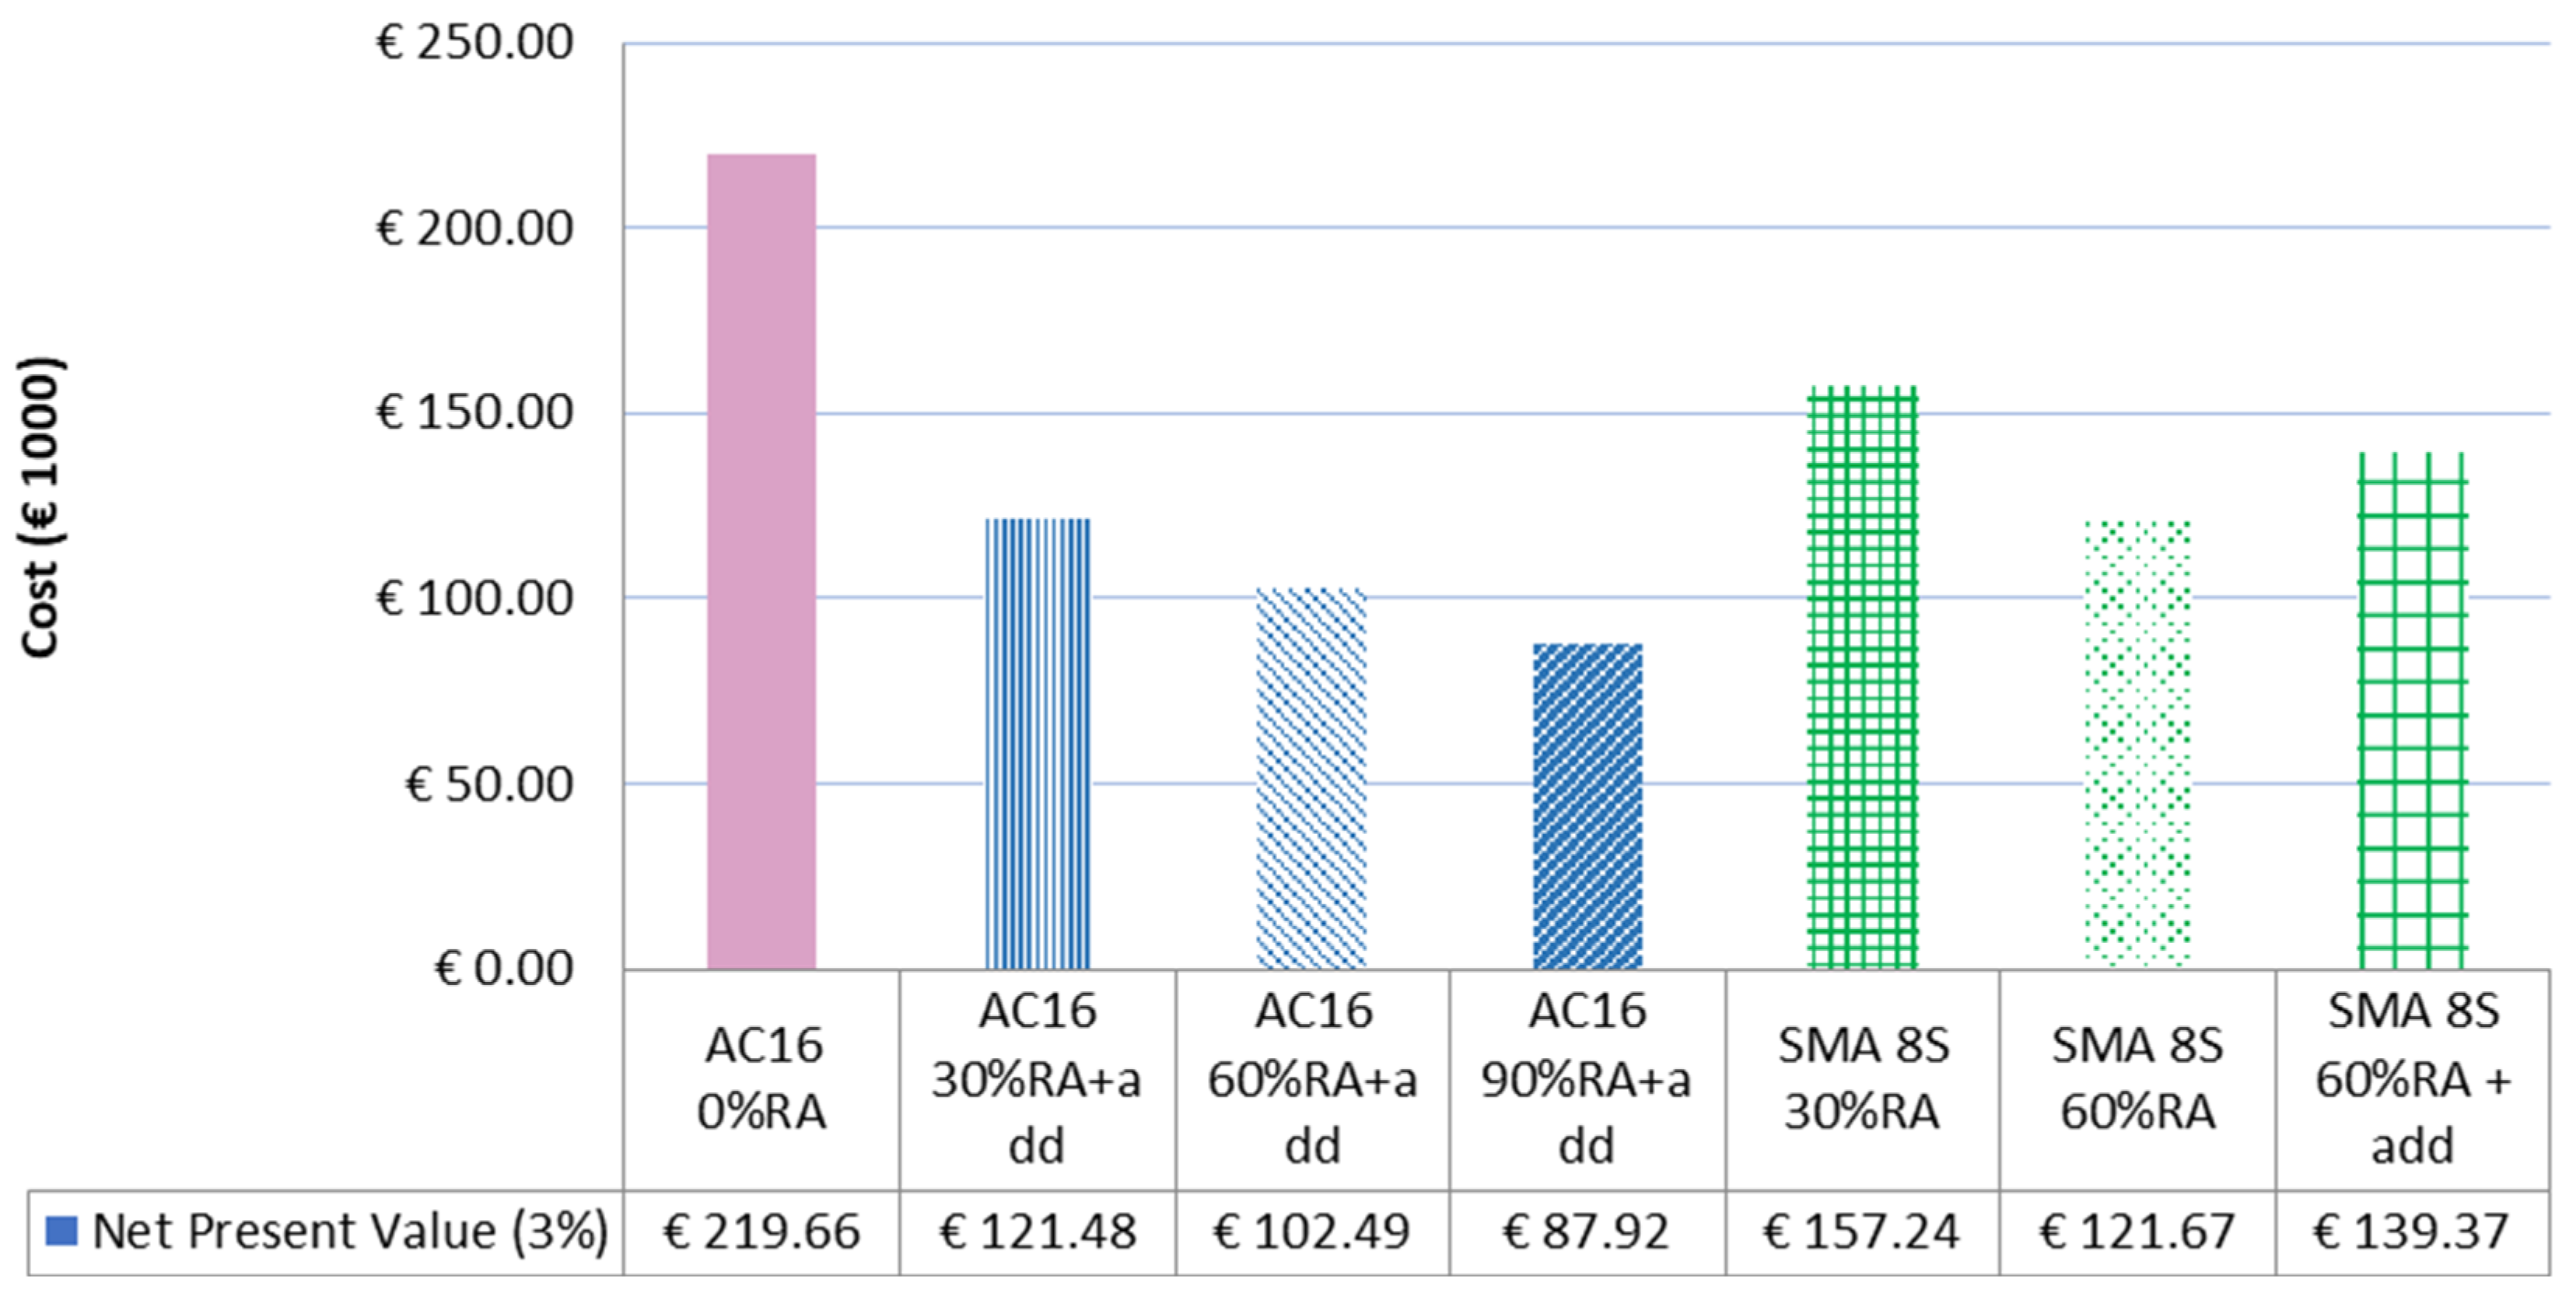
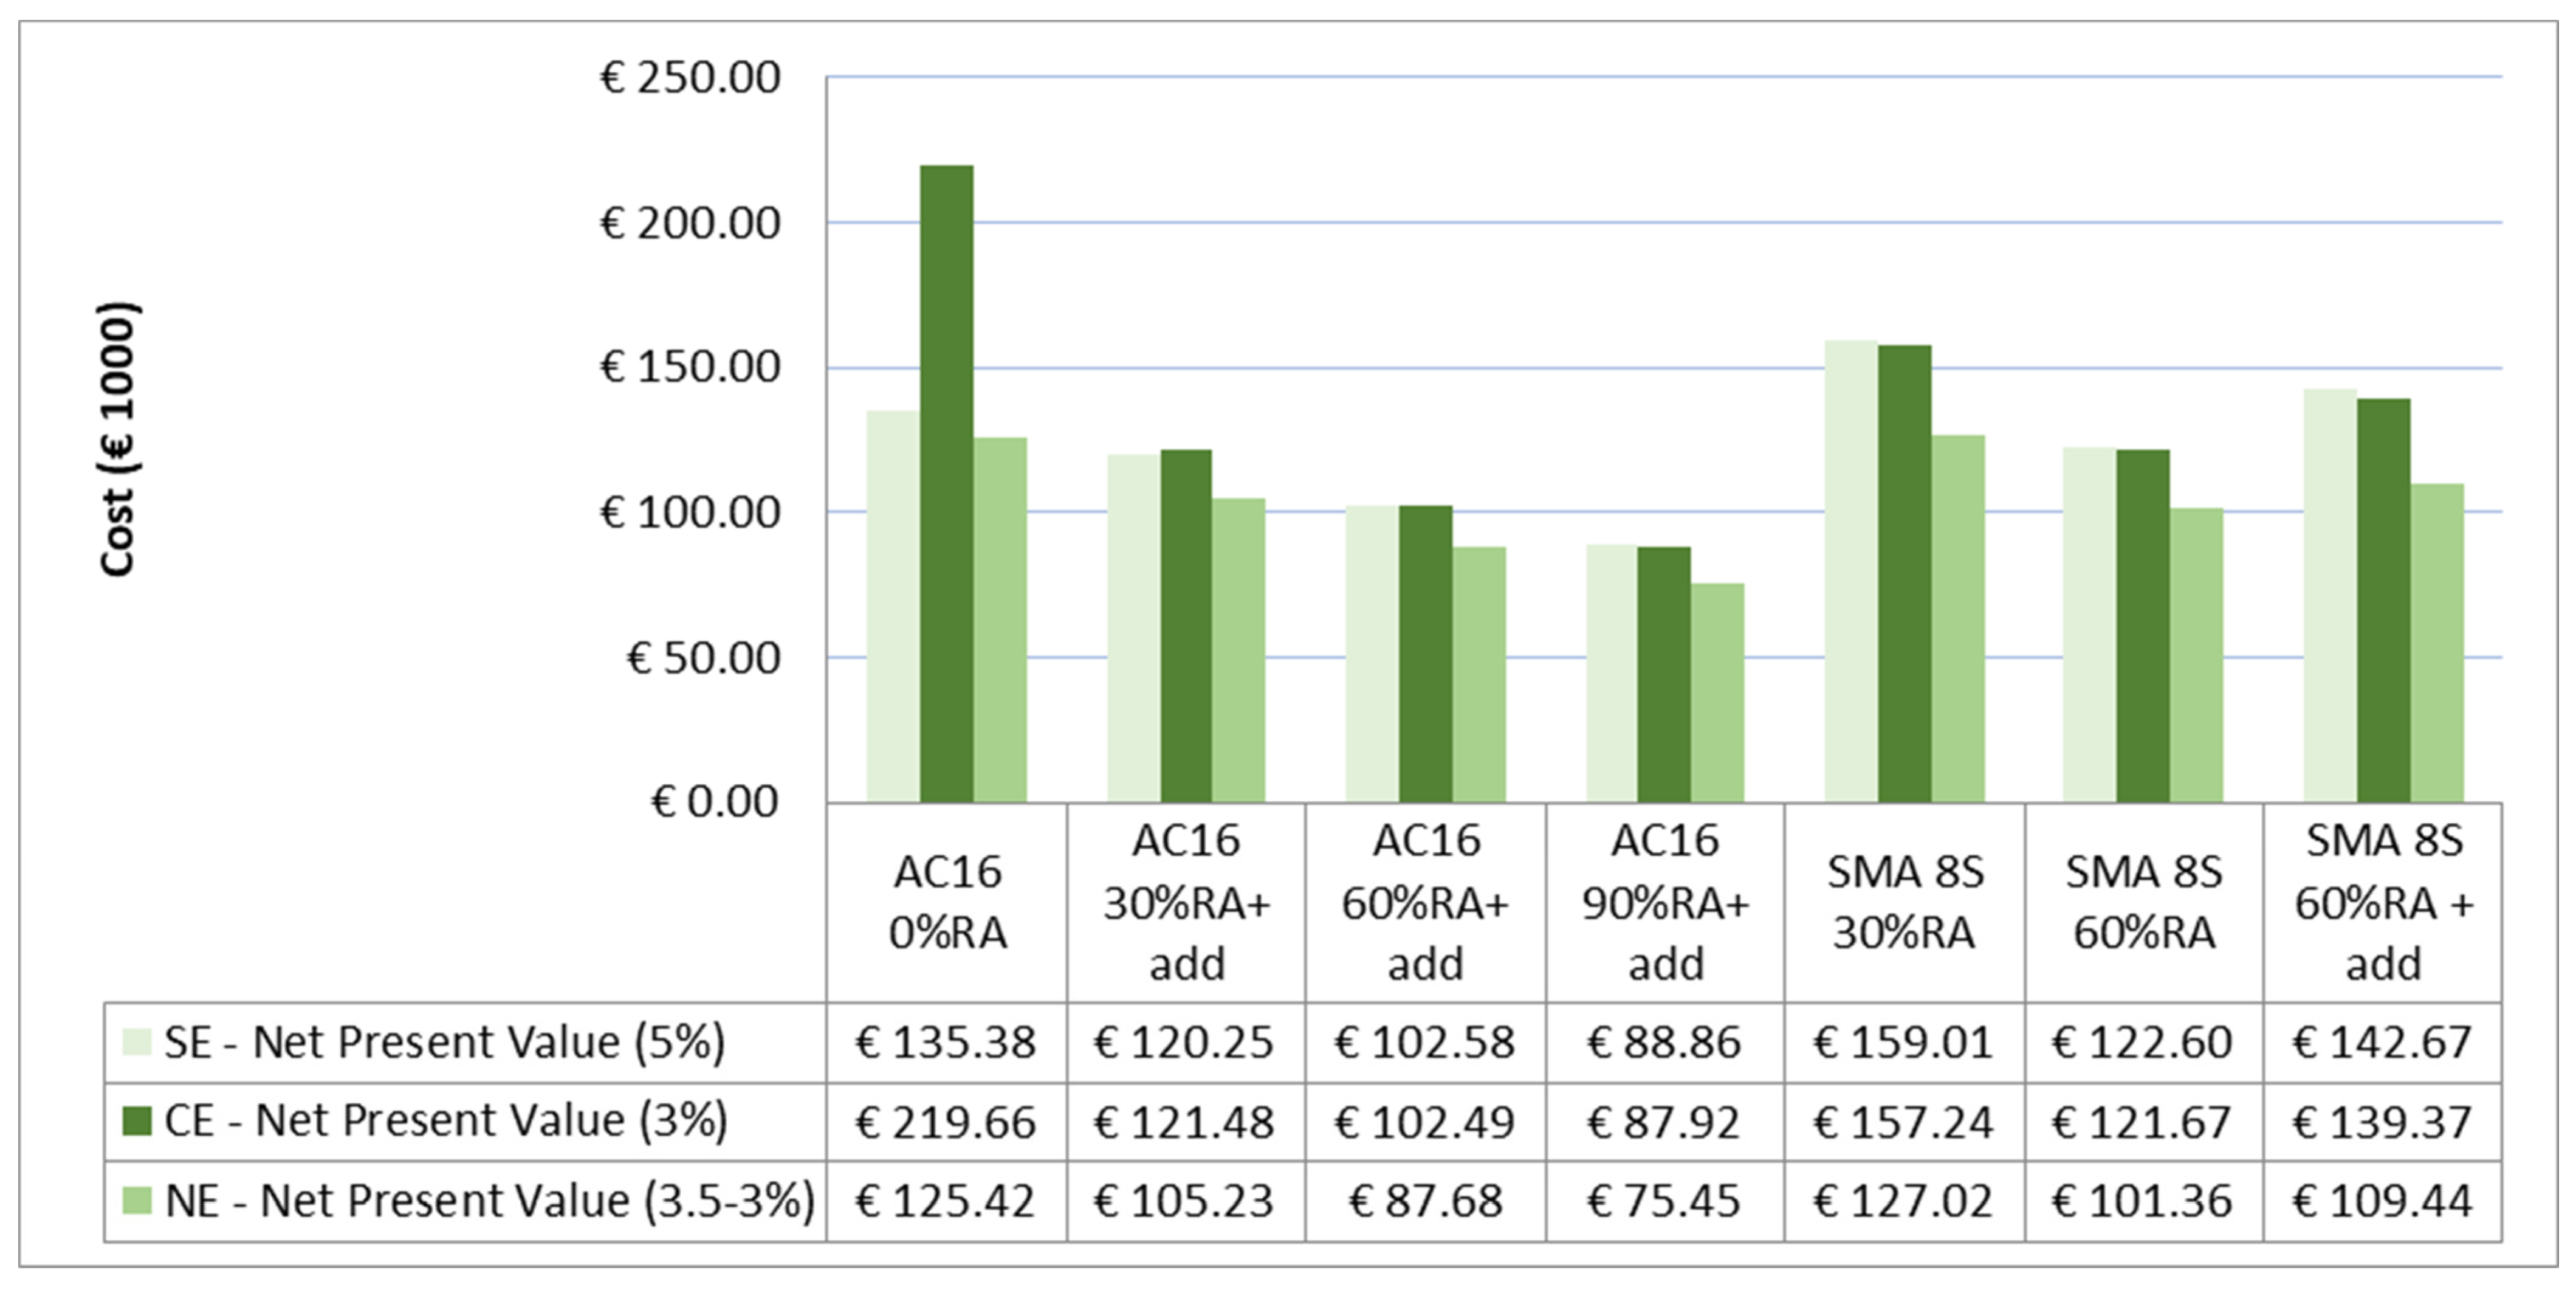
3.2. Calculation of Economic Performance
3.3. Summary of Results Amongst Case Studies
- Using asphalt with RA in the CE case study provided the best results compared to the baseline (from −13.5% to −48%) because the distance of the virgin aggregate quarry from the asphalt plant was 10 times higher than the distance to the RA stockpile.
- The worst performance was recorded in Italy, where AC16 mixtures provided a reduction in CO2eq (from −0.2% to −5.3%) while the use of SMA asphalts caused an increase in impacts (from 0.2% to 9.9%). These values can be explained because of the long distances from the plant to the site and from the site to the RA collection stockpile: on average, the distances were more than twice as high as the other cases.
- The additive used in this study allowed high recycling rates while keeping reasonable mixing and compaction temperatures. Since in all the case studies higher recycling rates enabled significantly lower transport of virgin material, overall, the additive helped indirectly lower the environmental impact.
- Considering that, for each case study, durability, maintenance strategy, and end-of-life were always assumed to be the same, the difference lies in the production phase (A1–A3). In particular, within the SE and NE case studies, using technologies and/or procedures enabling minimisation of emissions during A3 is recommended, while minimizing these distances should provide important environmental benefits within the CE case study.
- Using SMA in the CE case study was more environmentally friendly than in the other countries because of the average shorter transport distances.
- Enhancing the durability of an asphalt course and decreasing the number of maintenance interventions is far more important than increasing the amount of recycled material incorporated in the mixtures. In fact, the best results are recorded for CE and NE case studies, where the interventions were significantly lower than in Italy (4–5 against 12).
- Incorporating high quantities of RA implies important benefits almost in each case study. Nevertheless, in Italy, where it was chosen to add polymer-modified bitumen and fibres in SMA8S, these mixes had a consequently higher footprint. It can be deduced, then, that any improvement in the lifetime of this course can bring significant benefits to the environment. Both in CE and in NE, significant improvements were recorded. In particular, in Germany, maximizing the use of RA in asphalt mixes significantly reduced carbon emissions when compared to the baseline. Additionally, in the UK, the trend was similar: up to a 15% reduction in emissions was recorded when the RA increased.
- Independently of the case study, increasing the amount of RA implies significant economic benefits; when a 60–90% volume of RA is incorporated, a cost reduction between 25% and 60% is recorded.
- The production of SMA is always more expensive than the production of an AC16; this is due to the higher costs for the acquisition of raw materials used in the mixture, such as PMB, fibres, or additives.
4. Discussion and Conclusions
- Overall, maximizing the use of RA while maintaining the durability of road pavement component(s) is suitable from both an environmental and an economical perspective. This holds true regardless of the selected case studies, geographical location within Europe, traffic level, and road pavement structures.
- Concerning the environmental impact
- ○
- In general, significant CO2eq savings (up to almost 50%) can be observed for high-content RA asphalt mixtures when compared to the baselines. These savings derived primarily from the incorporation of a high percentage of recycled materials, as well as from average shorter transportation distances of RA compared to virgin aggregates. In fact, in Europe, the former is usually stockpiled directly in the asphalt plant, while for the latter it is necessary to always add up emissions due to transport from quarries.
- ○
- In all the selected case studies, the main parameter that governs the volume of emissions remains the durability. This result might be different with different values of reference service life; therefore, in order to adapt these conclusions to other case studies, the authors strongly suggest carrying out a case-by-case sensitivity analysis.
- Concerning the economic impacts:
- ○
- LCC provided clear evidence of the economic savings due to the maximisation of the RA. In fact, the cost reduction ranged from 25 to 60% whenever the RA content ranged, respectively, from 60 to 90%.
- The adopted framework allows performing SA exercises for more informed decision-making by all stakeholders involved in the road pavement industry. It is evident that, in the current form, the framework provides estimates of economic costs and carbon footprints; therefore, the SA exercise can certainly be enriched with other environment-related impact categories. Currently, co-authors are also working towards improving the proposed approach by introducing indicators derived from social LCA.
- Durability of road pavement layers remains a main parameter for any road pavement sustainability assessment exercise; therefore, more research should focus on a detailed estimation of the reference service life of road pavements and/or each paved layer. In this sense, a collaboration between material manufacturers and pavement contractors aiming at obtaining/guaranteeing road pavement reference service lifespans is advisable as a pre-requisite within procurement practices.
Author Contributions
Funding
Institutional Review Board Statement
Informed Consent Statement
Data Availability Statement
Acknowledgments
Conflicts of Interest
Abbreviation
| AADT | Average Annual Daily Traffic |
| AC | Asphalt Concrete |
| ANAS | Azienda Nazionale Autonoma delle Strade |
| BAST | Bundesanstalt für Straßenwesen (Federal Highway Research Institute in Germany) |
| BC | Binder Course |
| CE | Central Europe |
| CF | Carbon Footprint |
| EARN | Effects on Availability of Road Network |
| FHWA | Federal Highway Agency |
| GWP | Global Warming Potential |
| LCA | Life Cycle Assessment |
| LCC | Life Cycle Cost |
| LCCA | Life Cycle Cost Analysis |
| LCI | Life Cycle Inventory |
| LTA | RA Long-Term Aged Reclaimed Asphalt |
| NE | North Europe |
| NPV | Net Present Value |
| RA | Reclaimed Asphalt |
| RSL | Reference Service Life |
| PCR | Product Category Rules |
| PMB | Polymer Modified Bitumen |
| SE | South Europe |
| SMA | Stone Mastic Asphalt |
| STA RA | Short-Term Aged Reclaimed Asphalt |
| TUD | Technische Universität Dresden |
| WC | Wearing Course |
Appendix A
Appendix A.1. Figures


Appendix A.2. Tables

| GENERAL | |
| Section length | 2000 m |
| Lane Width | Total carriageway width 9.50 m. Two lanes (3.5 m) plus shoulders (1.25 m) |
| Number of lanes | Dual carriageway road with two lanes |
| Traffic | HIGH VOLUME: 30,000 AADT vehicles/day |
| CURRENT PAVEMENT MATERIALS | |
| Mix specifications for all mixes used in the project. These should include (at the very least) aggregate type and content, asphalt content, and any modifiers used in the mix. |
|
| DESCRIPTION OF WORK Information about the milling, laying, and compaction processes used for each course, such as: | |
| Typical lift thickness used when laying each asphalt course | 170 mm asphalt, 30 mm wearing course, 45 mm binder course, 100 mm base course, and 300 mm of stabilised sand with cement |
| TRANSPORT DISTANCES (km) | |
| From: Bitumen refinery/binder production To: Mixing Plant | 35 |
| From: Bitumen refinery/binder production To Work Site | 233 |
| From: Aggregate Quarry To: Mixing Plant | 23 |
| From: RA stockpile To Mixing plant | 0 |
| From: Equipment storage To Work Site | 198 |
| From: Mixing plant To Work Site | 198 |
| From: Work site To: RA Stockpile | 198 |
| GENERAL | |
| Section length | 800 m |
| Lane Width (m) | Total carriageway width 11.80 m. |
| Number of lanes | Dual carriageway road with two lanes |
| Traffic | MEDIUM VOLUME: 20,000 AADT |
| CURRENT PAVEMENT MATERIALS | |
| Mix specifications for all mixes used in the project. These should include (at the very least) aggregate type and content, asphalt content and any modifiers used in the mix. |
|
| DESCRIPTION OF WORK Information about the milling, laying, and compaction processes used for each course, such as: | |
| Typical lift thickness used when laying each asphalt course | 30 mm wearing course, 80 mm binder course, 140 mm base course, unbound gravel base course 200 mm, unbound frost blanket 350 mm |
| TRANSPORT DISTANCES (km) | |
| From: Bitumen refinery To: Binder production (PMB) | 29 |
| From: binder production plant (PMB) To: Mixing Plant | 189 |
| From: Bitumen refinery/binder production To Work Site | - |
| From: Aggregate Quarry To: Mixing Plant | 348 |
| From: RA stockpile To Mixing plant | 0 |
| From: Equipment storage To Work Site | 35 |
| From: Mixing plant To Work Site | 35 |
| From: Work site To: RA Stockpile | 35 |
| GENERAL | |
| Section length | 720 m |
| Lane Width (m) | Total carriageway width 11 m |
| Number of lanes | Single carriageway with 2 lanes |
| Traffic | LOW VOLUME: 10,000 AADT |
| PAVEMENT MATERIALS | |
| Mix specifications for all mixes used in the project. These should include (at the very least) aggregate type and content, asphalt content and any modifiers used in the mix. |
|
| DESCRIPTION OF WORK Information about the milling, laying, and compaction processes used for each course, such as: | |
| Typical asphalt wearing course thickness | 190 mm asphalts: 40 mm wearing course, 100 mm binder course, 50 mm base course and 258 mm of stabilised sand with cement |
| TRANSPORT DISTANCES (km) | |
| From: Bitumen refinery/binder production To: Mixing Plant | 160 |
| From: Bitumen refinery/binder production To Work Site | 130 |
| From: Aggregate Quarry To: Mixing Plant | 70 |
| From: RA stockpile To Mixing plant | 70 |
| From: Equipment storage To Work Site | 43 |
| From: Mixing plant To Work Site | 43 |
| From: Work site To: RA Stockpile | 56 |
| Elements | Source | Notes |
| Costs | Wayman, 2014 [32], ITERCHIMICA [37], STORIMPEX [38] | Most of them were directly provided by the supplier, some of them coming from the literature |
| Durability | ANAS [28], BASt [29], Spray [30] | Durability should be subjected to sensitivity analysis |
| Discount rate | Vardakoulias, 2013 [39] | Discount rate should be subjected to sensitivity analysis ( + 1%) |
| Energy consumption–plant | Primary data. Temperature variations in hot and warm recycled mix collected from asphalt plant in Italy and Germany. Re-Road, 2012 [34] | Due to only slight variations in temperatures when using additives, the asphalt plant energy consumption was considered the same in all cases Heating increments should be subject to a sensitivity analysis to up 25% of increase |
| Laying and compacting energy consumption | asPECT v4.0 [31] | Review EARN and CEREAL outputs for relevance |
| Maintenance strategies | ANAS [28], BASt [29], Spray [30] | Strategies were adapted based on exchange of information with road authority engineers |
| Materials–additive | asPECT v4.0 [31], Mineral Products Association [38], STORIMPEX [38] | |
| Materials–mix recipes | ANAS [28], BASt [29], Spray [30], AllBack2Pave [27] | - |
| Planing energy consumption | asPECT v4.0 [31] | Review EARN and CEREAL outputs for relevance |
| Rolling resistance of materials in place | Reviewed published sources, no significant difference observed between asphalt with similar grading profiles | Assumed to be identical for all the considered asphalt mixes |
| Transport–distances | ANAS [28], BASt [29], Spray [30] | Distances should be subjected to sensitivity analysis |
| Transport–emission factors | [39] | - |
| Origins | Mode of Transport | One Way Distance (km) | |
| South Europe–Catania, Italy | |||
| Virgin aggregates 0.075–20 mm | Quarry | Rigid > 17 t, 20 t payload | 46 |
| Filler < 0.075 mm | Plant | - | 0 |
| RA Planings | RA stockpile | Rigid > 17 t, 20 t payload | 32 |
| Bitumen/PMB | Refinery | Rigid > 17 t, 20 t payload | 215 |
| Fibres | ITERCHIMICA Bergamo, IT | Articulated > 33 t, 24 t payload | 1370 |
| STORBIT PLUS additive | STORIMPEX Leipzig | Articulated > 33 t, 24 t payload | 2250 |
| Central Europe–Wittstock, Germany | |||
| Virgin aggregates 0.075–20 mm | Quarry | Rigid > 17 t, 20 t payload | 348 |
| Filler < 0.075 mm | Plant | - | 0 |
| RA Planings | RA stockpile | Rigid > 17 t, 20 t payload | 35 |
| Bitumen/PMB | Refinery | Rigid > 17 t, 20 t payload | 215 |
| Fibres | Central Germany | Articulated > 33 t, 24 t payload | 623 |
| STORBIT PLUS additive | STORIMPEX Hamburg | Rigid > 17 t, 20 t payload | 180 |
| North Europe–Lincoln, UK | |||
| Virgin aggregates 0.075–20 mm | Quarry | Rigid > 17 t, 20 t payload | 70 |
| Filler < 0.075 mm | Plant | 0 | |
| RA Planings | RA stockpile | Rigid > 17 t, 20 t payload | 70 |
| Bitumen/PMB | Refinery | Rigid > 17 t, 20 t payload | 160 |
| Fibres | Central Germany | Articulated > 33 t, 24 t payload | 375 |
| STORBIT PLUS additive | STORIMPEX Hamburg | Articulated > 33 t, 24 t payload (overestimated by not including the rail freight channel tunnel) | 1160 |
| Origin | Mode of Transport | One Way Distance (km) | |
| South Europe–Palermo, Italy | |||
| Asphalt mixes to site | Plant | Rigid > 17 t, 20 t payload | 198 |
| Bitumen emulsion for tack Coat | Plant | Rigid > 17 t, 20 t payload | 233 |
| Equipment | Plant | - | 198 |
| Central Europe–Wittstock, Germany | |||
| Asphalt mixes to site | Plant | Rigid > 17 t, 20 t payload | 35 |
| Bitumen emulsion for tack Coat | - | Rigid > 17 t, 20 t payload | 215 |
| Equipment | - | - | 35 |
| North Europe–Lincoln, UK | |||
| Asphalt mixes to site | Plant | Rigid > 17 t, 20 t payload | 43 |
| Bitumen emulsion for tack Coat | - | Rigid > 17 t, 20 t payload | 160 |
| Equipment | - | - | 43 |
| Origin | Mode of Transport | One Way Distance (km) |
| South Europe–Palermo, Italy | ||
| Excavated RA to stockpile | Rigid > 17 t, 20 t payload | 198 |
| Central Europe–Wittstock, Germany | ||
| Excavated RA to stockpile | Rigid > 17 t, 20 t payload | 35 |
| North Europe–Lincoln, UK | ||
| Excavated RA to stockpile | Rigid > 17 t, 20 t payload | 56 |
| Data Source | SE–IT [€/t] | |
| Virgin aggregates 0.075–20 mm | Ferrara | 10 |
| Filler < 0.075 mm | Ferrara | 10.50 |
| RA Planings | Ferrara | 4 * |
| Bitumen | Ferrara | 400 |
| Polymer modified bitumen | Ferrara | 520 |
| Fibres (glass) (0.90 €/Kg) | ITERCHIMICA | 900 |
| STORBIT PLUS additive | Ferrara | 1350 |
| Freight Transport (rigid > 17 t, 20 ton payload) | Ferrara | 0.33 |
| Data Source | CE/D and NE/UK [€/t] | |
| Virgin aggregates 0.075–20 mm | Wayman M [32] | 16.75 |
| Filler < 0.075 mm | as aggregate | 16.75 |
| RA Planings | Wayman M [32] | 11.00 |
| Bitumen | Rodriquez | 650 |
| Polymer modified bitumen | Wayman M [32] | 730.87 |
| Fibres (glass) (0.90 €/Kg) | ITERCHIMICA | 900 |
| STORBIT PLUS additive | STORIMPEX | 1350 |
| Transport–Rigid > 17 t, 20 ton payload | Wayman M [32] | 1.03 |
| Transport–Articulated > 33 t, 24 t payload | Wayman M [32] | 1.03 |
References
- Balaguera, A.; Carvajal, G.I.; Albertí, J.; Fullana-i-Palmer, P. Life Cycle Assessment of Road Construction Alternative Materials: A Literature Review. Resour. Conserv. Recycl. 2018, 132, 37–48. [Google Scholar] [CrossRef]
- Santero, N.J.; Masanet, E.; Horvath, A. Life-Cycle Assessment of Pavements. Part I: Critical Review. Resour. Conserv. Recycl. 2011, 55, 801–809. [Google Scholar] [CrossRef]
- Castro, C.; Sabogal, D.; Fernández, W. A Review of Emissions on Pavement Materials and Sustainability Rating Systems. Rev. Ing. Constr. 2022, 37, 280–291. [Google Scholar] [CrossRef]
- Vidal, R.; Moliner, E.; Martínez, G.; Rubio, M.C. Life Cycle Assessment of Hot Mix Asphalt and Zeolite-Based Warm Mix Asphalt with Reclaimed Asphalt Pavement. Resour. Conserv. Recycl. 2013, 74, 101–114. [Google Scholar] [CrossRef]
- Giani, M.I.; Dotelli, G.; Brandini, N.; Zampori, L. Comparative Life Cycle Assessment of Asphalt Pavements Using Reclaimed Asphalt, Warm Mix Technology and Cold in-Place Recycling. Resour. Conserv. Recycl. 2015, 104, 224–238. [Google Scholar] [CrossRef]
- Zaumanis, M.; Mallick, R.B. Review of Very High-Content Reclaimed Asphalt Use in Plant-Produced Pavements: State of the Art. Int. J. Pavement Eng. 2015, 16, 39–55. [Google Scholar] [CrossRef]
- Shi, B.; Dong, Q.; Chen, X.; Gu, X.; Wang, X.; Yan, S. A Comprehensive Review on the Fatigue Resistance of Recycled Asphalt Materials: Influential Factors, Correlations and Improvements. Constr. Build. Mater. 2023, 384, 131435. [Google Scholar] [CrossRef]
- Bizarro, D.E.G.; Steinmann, Z.; Nieuwenhuijse, I.; Keijzer, E.; Hauck, M. Potential Carbon Footprint Reduction for Reclaimed Asphalt Pavement Innovations: Lca Methodology, Best Available Technology, and Near-Future Reduction Potential. Sustainability 2021, 13, 1382. [Google Scholar] [CrossRef]
- Praticò, F.G.; Giunta, M.; Mistretta, M.; Gulotta, T.M. Energy and Environmental Life Cycle Assessment of Sustainable Pavement Materials and Technologies for Urban Roads. Sustainability 2020, 12, 704. [Google Scholar] [CrossRef]
- Bloom, E.F.; Horstmeier, G.J.; Ahlman, A.P.; Edil, T.B.; Whited, G. Assessing the Life Cycle Benefits of Recycled Material in Road Construction. In Proceedings of the Geo-Chicago 2016, Chicago, IL, USA, 14–18 August 2016. [Google Scholar]
- Chiu, C.T.; Hsu, T.H.; Yang, W.F. Life Cycle Assessment on Using Recycled Materials for Rehabilitating Asphalt Pavements. Resour. Conserv. Recycl. 2008, 52, 545–556. [Google Scholar] [CrossRef]
- Farina, A.; Zanetti, M.C.; Santagata, E.; Blengini, G.A. Life Cycle Assessment Applied to Bituminous Mixtures Containing Recycled Materials: Crumb Rubber and Reclaimed Asphalt Pavement. Resour. Conserv. Recycl. 2017, 117, 204–212. [Google Scholar] [CrossRef]
- Zhao, Y.; Goulias, D.; Peterson, D. Recycled Asphalt Pavement Materials in Transport Pavement Infrastructure: Sustainability Analysis & Metrics. Sustainability 2021, 13, 8071. [Google Scholar] [CrossRef]
- Aurangzeb, Q.; Al-Qadi, I.L.; Ozer, H.; Yang, R. Hybrid Life Cycle Assessment for Asphalt Mixtures with High RAP Content. Resour. Conserv. Recycl. 2014, 83, 77–86. [Google Scholar] [CrossRef]
- Vandewalle, D.; Antunes, V.; Neves, J.; Freire, A.C. Assessment of Eco-Friendly Pavement Construction and Maintenance Using Multi-Recycled Rap Mixtures. Recycling 2020, 5, 17. [Google Scholar] [CrossRef]
- Araújo, J.P.C.; Oliveira, J.R.M.; Silva, H.M.R.D. The Importance of the Use Phase on the LCA of Environmentally Friendly Solutions for Asphalt Road Pavements. Transp. Res. D Transp. Environ. 2014, 32, 97–110. [Google Scholar] [CrossRef]
- Butt, A.A. Life Cycle Assessment of Asphalt Roads: Decision support at project level. Doctoral Thesis, KTH Royal Institute of Technology, Stockholm, Sweden, 2014. Available online: https://www.diva-portal.org/smash/get/diva2:763875/FULLTEXT01.pdf (accessed on 12 July 2023).
- Thenoux, G.; González, Á.; Dowling, R. Energy Consumption Comparison for Different Asphalt Pavements Rehabilitation Techniques Used in Chile. Resour. Conserv. Recycl. 2007, 49, 325–339. [Google Scholar] [CrossRef]
- Huang, Y.; Bird, R.N.; Heidrich, O. A Review of the Use of Recycled Solid Waste Materials in Asphalt Pavements. Resour. Conserv. Recycl. 2007, 52, 58–73. [Google Scholar] [CrossRef]
- ISO 14040:2006; Environmental Management—Life Cycle Assessment—Principles and Framework. ISO: Geneva, Switzerland, 2006.
- ISO 14044:2006; Environmental Management—Life Cycle Assessment—Requirements and Guidelines. ISO: Geneva, Switzerland, 2006.
- EN 15804:2012; Sustainability of Construction Works—Assessment of Environmental Performance of Buildings—Calculation Method. Comite Europeen de Normalisation: Bruxelles, Belgium, 2012.
- Finkbeiner, M.; Schau, E.M.; Lehmann, A.; Traverso, M. Towards Life Cycle Sustainability Assessment. Sustainability 2010, 2, 3309–3322. [Google Scholar] [CrossRef]
- Kloepffer, W. Life Cycle Sustainability Assessment of Products (with Comments by Helias A. Udo de Haes, p. 95). Int. J. Life Cycle Assess. 2008, 13, 89–95. [Google Scholar] [CrossRef]
- Harvey, J.; Meijer, J.; Ozer, H.; Al-Qadi, I.L.; Saboori, A.; Kendall, A. Pavement Life Cycle Assessment Framework; Federal Highway Administration: Washington, DC, USA, 2016.
- Carrión, A.J.d.B.; Buttitta, G.; Neves, L.; Lo Presti, D. Sustainability Assessment for Road Pavements: PavementLCM Framework Deliverable D2.1b. 2021. Available online: https://www.pavementlcm.eu/download/sustainability-assessment-for-road-pavements-pavementlcm-framework-d2-1b/ (accessed on 1 March 2022).
- AllBack2Pave. AllBack2Pave—Toward a Sustainable 100% Recycling of Reclaimed Asphalt in Road Pavement; Conference of European Directors of Roads (CEDR): Brussels, Belgium, 2015. [Google Scholar]
- ANAS Capitolato Speciale d’appalto—Norme Tecniche per l’esecuzione del contratto–2010; Anas S.pA.: Rome, Italy, 2010.
- BASt. Section S3—Asphalt Pavements—Federal Highway Research Institute (BASt) Responsible, Oliver Ripke; BASt: Bergisch Gladbach, Germany, 2015. [Google Scholar]
- Spray, A. Global Warming Potential Assessment. Methodology and Road Pavements. Ph.D. Thesis, University of Nottigham, Nottingham, UK, 2014. [Google Scholar]
- AsPeCT. Available online: https://trlsoftware.com/services/software-development/aspect/ (accessed on 15 February 2022).
- Wayman, M.; Schiavi-Mellor, I.; Cordell, B. Protocol for the Calculation of Whole Life Cycle Greenhouse Gas Emissions Generated by Asphalt; Transport Research Laboratory: Wokingham, UK, 2014. [Google Scholar]
- EeBGuide Project G-06 Distinction between the Declared Unit and the Functional Unit. European Commission, Research and Innovation, Environment; Seventh Framework Programme for Research (FP7). Available online: https://www.eebguide.eu/eebblog/?p=1231 (accessed on 14 September 2023).
- Re-Road Re-Road: End of Life Strategies of Asphalt Pavements. Available online: http://re-road.fehrl.org/ (accessed on 15 September 2012).
- FHWA. Life-Cycle Cost Analysisin Pavement Design—In Search of Better Investment Decisions; Pavement Division Interim Technical Bulletin; U.S. Department of Transportation, Federal Highway Administration: Washington, DC, USA, 1998.
- FHWA. Life-Cycle Cost Analysis Software; Federal Highway Administration: Washington, DC, USA, 2015. [Google Scholar]
- Vardakoulias, O. Discounting and Time Preferences. the New Economics Foundation. Available online: www.neweconomics.org (accessed on 14 September 2015).
- Mineral Products Association Climate Change & Energy Data. Available online: http://www.mineralproducts.org/sustainability/climate-change-data.html (accessed on 14 September 2023).
- UK Gov UK Conversion Factor. Available online: http://www.ukconversionfactorscarbonsmart.co.uk/ (accessed on 15 September 2015).

| Author/Year | Stages Considered | Comparison of Mixtures with Different RA Content (y/n) | RA Content (%) | CF reduction (%)-Comparison with Conventional Mix | Cost Reduction (%) |
|---|---|---|---|---|---|
| Chiu et al., 2007 [11] | Material production, transport, construction | n | AC 45% RA | 23% (not a CF, it is an avarage of environmental improvement) | / |
| Vidal et al., 2013 [4] | Material production, transport, construction, use, maintenance, EoL | y | HMA 15% WMA 15% | 13% 13% | / / |
| Aurangzeb et al., 2013 [14] | Material production, transport, construction | y | AC 30% RA AC 40% RA AC 50% RA | 7% 10% 13% | 8% 11% 14% |
| Araùjo et al., 2014 [16] | Material production, transport, construction | n | AC 50% RA | 17% | / |
| Bloom et al., 2017 [10] | Material production, transport, construction | n | 55% | 39% | 33% |
| Praticò et al., 2020 [9] | Material production, transport, construction, EoL | y | AC 45% RA AC 30% RA | 8% 6% | / / |
| Vandewalle et al., 2020 [15] | Material production, transport, construction, maintenance, EoL | AC 25% RA AC 50% RA AC 75% RA + rej SMA 100% RA | 16% 22% 28% 31% | ||
| Zhao et al., 2021 [13] | Material production, transport, construction, maintenance, EoL | y | HMA 10% RA HMA 20% RA HMA 30% RA HMA 40% RA HMA 50% RA | 11% 13% 15% 17% 19% | 21% 23% 24% 25% 26% |
| Bizarro et al., 2021 [8] | Material production | y | AC 50% RA SMA 71% SMA 93% RA WMA PA 71% RA Foam. Bit. PA 93% RA | 35% 50% 55% 59% 64% | / |
| South Europe Baseline | Central Europe Baseline | North Europe Baseline | AC16 30% RA + Add | AC16 60% RA + Add | AC16 90% RA + Add | SMA8S 30% RA | SMA8S 60% RA | SMA8S 60% RA + Add | |
|---|---|---|---|---|---|---|---|---|---|
| Virgin aggregates (%) | 86.9 | 86.2 | 87.4 | 63.84 | 33.77 | 3.9 | 61.59 | 35.62 | 35.62 |
| Filler (%) | 7.0 | 6.5 | 7.0 | - | - | - | 2.57 | - | - |
| STA RA (%) | - | - | - | - | - | - | 30 | 60 | 60 |
| LTA RA (%) | - | - | - | 31.4 | 62.8 | 93.5 | - | - | - |
| Bitumen (%) | 6.1 | - | 5.6 | 4.5 | 2.9 | 1.9 | - | - | - |
| PMB (%) | - | 7.0 | - | - | - | - | 5.54 | 4.08 | 3.48 |
| Fibres (%) | - | 0.3 | - | - | - | - | 0.3 | 0.3 | 0.3 |
| STORBIT additive (%) | - | - | - | 0.26 | 0.53 | 0.7 | - | - | 0.6 |
| Pavement Course | South EU-IT (ANAS, 2015) [28] | Central EU-D (BASt, 2015) [29] | North EU-UK (Spray, 2014) [30] |
|---|---|---|---|
| Section width | 9.50 m | 11.80 m | 11.00 m |
| Section length | 2000 m | 800 m | 720 m |
| Foundation heights | Cement treated sand 300 mm | Unbound course gravel + frost blanket 350 mm | Cement treated limestone 258 mm |
| Traffic levels | High traffic | Medium traffic | Low traffic |
| Typical durability of wearing course | 5 years (HMA) | 16 years (SMA) | 10 years (SMA) |
| Typical durability of binder course | 25–30 years | ||
| Typical durability of base course | 50 years | ||
| Italy: (ANAS, 2015) [28] | Germany: (BASt, 2015) [29] | UK: (Spray, 2014) [30] | |||
|---|---|---|---|---|---|
| Year | Procedure | Year | Procedure | Year | Procedure |
| 0–5 | Inlay WC + BC | 0–15 | Inlay WC + BC | 0–10 | Inlay WC + BC |
| 5–10 | Inlay WC | 15–30 | Inlay WC | 10–20 | Inlay WC |
| 10–15 | Inlay WC | 30–45 | Rehabilitation | 20–30 | Inlay WC + BC |
| 15–20 | Inlay WC | 45–60 | Inlay WC | 30–40 | Inlay WC |
| 20–25 | Inlay WC | 40–50 | Rehabilitat. | ||
| 25–30 | Inlay WC + BC | 50–60 | Inlay WC | ||
| 30–35 | Inlay WC | ||||
| 35–40 | Inlay WC | ||||
| 40–45 | Inlay WC | ||||
| 45–50 | Inlay WC | ||||
| 50–55 | Rehabilitation | ||||
| 55–60 | Inlay WC | ||||
| Baseline | AC16-RA30add | AC16-RA60add | AC16-RA90add | SMA RA30 | SMA RA60 | SMA RA60add | |
|---|---|---|---|---|---|---|---|
| SE [kg CO2eq] | 37.89 | 37.7 | 35.28 | 32.98 | 47.12 | 39.82 | 43.84 |
| CE [kg CO2eq] | 88.3 | 65.01 | 51.14 | 37.72 | 73.99 | 57.25 | 60.25 |
| NE [kg CO2eq] | 52.89 | 44.39 | 42.35 | 40.56 | 53.7 | 47.15 | 50.59 |
| Baseline | AC16-RA30add | AC16-RA60add | AC16-RA90add | SMA RA30 | SMA RA60 | SMA RA60add | |
|---|---|---|---|---|---|---|---|
| SE [kg CO2eq] | 151.11 | 150.65 | 145.13 | 139.84 | 172.27 | 155.48 | 164.68 |
| CE [kg CO2eq] | 242.19 | 169.74 | 137.77 | 106.95 | 190.44 | 152.03 | 158.93 |
| NE [kg CO2eq] | 143.98 | 124.43 | 119.83 | 115.69 | 145.82 | 121.141 | 60.3 |
| South Europe: Italy | Central Europe: Germany | North Europe: England | |
|---|---|---|---|
| Baseline [CO2eq] | 2361 | 952.8 | 648.9 |
| AC16-RA30add [CO2eq] | 2356 | 740.6 | 573.0 |
| AC16-RA60add [CO2eq] | 2295 | 612.3 | 554.8 |
| AC16-RA90add [CO2eq] | 2236 | 491.7 | 538.8 |
| SMA RA30 [CO2eq] | 2595 | 822.5 | 656.1 |
| SMA RA60 [CO2eq] | 2410 | 669.8 | 597.6 |
| SMA RA60add [CO2eq] | 2512 | 697.2 | 628.3 |
| AC16 0% RA | AC16 30% RA + add | AC16 60% RA + add | AC16 90% RA + add | SMA 8S 30% RA | SMA 8S 60% RA | SMA 8S 60% RA + add | |
|---|---|---|---|---|---|---|---|
| €/t | €/t | €/t | €/t | €/t | €/t | €/t | |
| Raw material acquisition | 33.80 | 29.20 | 24.60 | 21.20 | 39.10 | 29.90 | 34.90 |
| Transport to plant | 0.40 | 0.30 | 0.30 | 0.20 | 0.30 | 0.20 | 0.40 |
| Electricity | 0.14 | 0.14 | 0.14 | 0.14 | 0.14 | 0.14 | 0.14 |
| Heating | 1.18 | 1.30 | 1.30 | 1.30 | 1.30 | 1.30 | 1.30 |
| TOTAL (€/t) | 35.5 | 30.9 | 26.4 | 22.9 | 40.9 | 31.5 | 36.7 |
| SMA 8S 0% RA | AC16 30% RA + add | AC16 60% RA + add | AC16 90% RA + add | SMA 8S 30% RA | SMA 8S 60% RA | SMA 8S 60% RA + add | |
|---|---|---|---|---|---|---|---|
| €/t | €/t | €/t | €/t | €/t | €/t | €/t | |
| Raw material acquisition | 69.1 | 46.7 | 38.5 | 32.7 | 57.0 | 45.0 | 48.7 |
| Transport to plant | 5.2 | 4.0 | 2.4 | 0.8 | 3.9 | 2.6 | 2.6 |
| Electricity | 0.136 | 0.136 | 0.136 | 0.136 | 0.136 | 0.136 | 0.136 |
| Heating | 1.18 | 1.30 | 1.30 | 1.30 | 1.30 | 1.30 | 1.30 |
| TOTAL (€/t) | 75.7 | 52.2 | 42.3 | 35.0 | 62.4 | 49 | 52.7 |
| SMA UK 0% RA | AC16 30% RA + add | AC16 60% RA + add | AC16 90% RA + add | SMA 8S 30% RA | SMA 8S 60% RA | SMA 8S 60% RA + add | |
|---|---|---|---|---|---|---|---|
| €/t | €/t | €/t | €/t | €/t | €/t | €/t | |
| Raw material acquisition | 56.5 | 46.7 | 38.5 | 32.7 | 57.0 | 45.0 | 48.7 |
| Transport to plant | 1.2 | 1.3 | 1.3 | 1.3 | 1.2 | 1.2 | 1.3 |
| Electricity | 0.136 | 0.136 | 0.136 | 0.136 | 0.136 | 0.136 | 0.136 |
| Heating | 1.18 | 1.30 | 1.30 | 1.30 | 1.30 | 1.30 | 1.30 |
| TOTAL (€/t) | 58.9 | 49.4 | 41.2 | 35.5 | 59.7 | 47.6 | 51.4 |
Disclaimer/Publisher’s Note: The statements, opinions and data contained in all publications are solely those of the individual author(s) and contributor(s) and not of MDPI and/or the editor(s). MDPI and/or the editor(s) disclaim responsibility for any injury to people or property resulting from any ideas, methods, instructions or products referred to in the content. |
© 2023 by the authors. Licensee MDPI, Basel, Switzerland. This article is an open access article distributed under the terms and conditions of the Creative Commons Attribution (CC BY) license (https://creativecommons.org/licenses/by/4.0/).
Share and Cite
Buttitta, G.; Giancontieri, G.; Parry, T.; Lo Presti, D. Modelling the Environmental and Economic Life Cycle Performance of Maximizing Asphalt Recycling on Road Pavement Surfaces in Europe. Sustainability 2023, 15, 14546. https://doi.org/10.3390/su151914546
Buttitta G, Giancontieri G, Parry T, Lo Presti D. Modelling the Environmental and Economic Life Cycle Performance of Maximizing Asphalt Recycling on Road Pavement Surfaces in Europe. Sustainability. 2023; 15(19):14546. https://doi.org/10.3390/su151914546
Chicago/Turabian StyleButtitta, Gabriella, Gaspare Giancontieri, Tony Parry, and Davide Lo Presti. 2023. "Modelling the Environmental and Economic Life Cycle Performance of Maximizing Asphalt Recycling on Road Pavement Surfaces in Europe" Sustainability 15, no. 19: 14546. https://doi.org/10.3390/su151914546
APA StyleButtitta, G., Giancontieri, G., Parry, T., & Lo Presti, D. (2023). Modelling the Environmental and Economic Life Cycle Performance of Maximizing Asphalt Recycling on Road Pavement Surfaces in Europe. Sustainability, 15(19), 14546. https://doi.org/10.3390/su151914546