Article

Predicting Concrete Pavement Condition for Sustainable Management: Unveiling the Development of Distresses through Machine Learning

1
Department of Highway & Transportation Research, Korea Institute of Civil Engineering and Building Technology, Goyang-daero 283, Ilsanseo-gu, Goyang-si 10223, Republic of Korea
2
Department of Structural Engineering Research, Korea Institute of Civil Engineering and Building Technology, Goyang-daero 283, Ilsanseo-gu, Goyang-si 10223, Republic of Korea
*
Author to whom correspondence should be addressed.
Sustainability 2024, 16(2), 573; https://doi.org/10.3390/su16020573
Submission received: 4 November 2023 / Revised: 22 December 2023 / Accepted: 3 January 2024 / Published: 9 January 2024

Abstract

:
This study presents a machine learning model for predicting representative surface distresses (crack, durability, patching, joint spall) in concrete pavements, focusing on South Korean examples. It thoroughly analyzes specific distress types using time series data to understand their development over time, aiming to surpass traditional regression methods in forecasting pavement conditions. The research fills a gap by applying machine learning algorithms to detailed long-term data, enhancing the accuracy of distress progression predictions, which is crucial for efficient pavement management. A notable aspect of this study is the use of particle filtering, recognized for its effective resampling in analyzing time series data. To validate predictions, we compared the results from particle filtering with those from traditional regression models, long short-term memory (LSTM) networks, and Deep Neural Networks (DNNs). The accuracy varied significantly, with differences ranging from 3.32% to 23.64%, indicating particle filtering’s suitability for time-series-based pavement condition predictions. These findings are especially relevant in the context of current image-based machine learning and AI research in pavement distress detection and prediction. This research offers a comprehensive reference that is especially valuable due to the lack of studies using long-term usage data, thereby making a significant contribution to pavement management research and practice.

1. Introduction

There has been significant research on the efficient and systematic management of road pavements as the aging of road pavements is rapidly progressing around the world. The road pavement management tasks can be broadly classified into (1) survey, (2) analysis, and (3) decision-making tasks. The recent research related to the investigation and analysis stage is represented by research utilizing surface scan images that are collected by roadway surface scanning vehicles using machines (e.g., Artificial Intelligence, machine learning, and deep learning) [1,2,3]. A majority of these studies attempted to increase the detection rate of distresses in surface scan images. However, it was observed that these methods do not have a high detection rate of distresses compared to the current approach where distress is analyzed by humans. Further, the false positive rate is still high. Moreover, these methods do not consider distress generation mechanisms and environmental factors. These limitations have limited their adoption in actual maintenance and rehabilitation (M&R) decision making. Regarding the decision-making stage, studies on segmentation prioritization and life cycle analysis are prevalent. Until recently, most road management organizations considered the overall pavement condition based on the pavement condition index, and the total surface distress amount and flatness are primary variables to identify the pavement condition at the network level and make management decisions such as selecting repair sections [4,5,6]. In this case, the project-level investigation of specific sections aims at rehabilitation and explores alternative construction methods to address the causes of representative distress. However, the selection process for these methods still relies on the subjective judgment of managers or field experts. Thus, there are some limitations in terms of time and cost. Furthermore, improper timing and method selection may increase the budget for pavement management and overhead costs [7].
Therefore, this study subdivides the surface distress (SD), which is a globally used representative variable of the pavement condition index, according to distress. It further predicts the progression rate of individual distress based on actual long-term public data. Thus, we aim to conduct a study that can be used as a basis for selecting construction methods and timing for a more detailed M&R. To this end, this study defines representative distresses that occur in concrete pavement sections in Korea and uses particle filtering, a machine learning technique, based on long-term public data collected over 30 years to identify the progression rate of each type of distress and reflect it in the overall pavement condition index. The findings and outcomes of the study will serve as a guideline and reference for decision making in pavement management.
In this study, we propose a method to predict the amount of distress that will occur in the future based on the application of machine learning to the rate of progression of each distress that occurs on the surface of concrete pavement. First (step 1), longitudinal/transverse GPS, route, line, lane, city, endpoint, pavement type, surface distress amount, and flatness per 10 m unit section data were collected every two years for the same locations. Second (step 2), data preprocessing was performed, such as selecting defect types that could be statistically analyzed from the collected data and removing data with maintenance history. Third (steps 3~5), a progression rate prediction model for each distress occurring on the surface of the concrete pavement through machine learning which uses particle filtering was developed using the preprocessed data. Lastly (step 6), the prediction validity of particle filtering was verified by developing a function formula for each distress progression rate prediction model and analyzing the prediction accuracy for actual distresses.
Figure 1 shows a detailed development process of the proposed method for predicting concrete pavement based on surface distress in six steps.

2. Literature Review
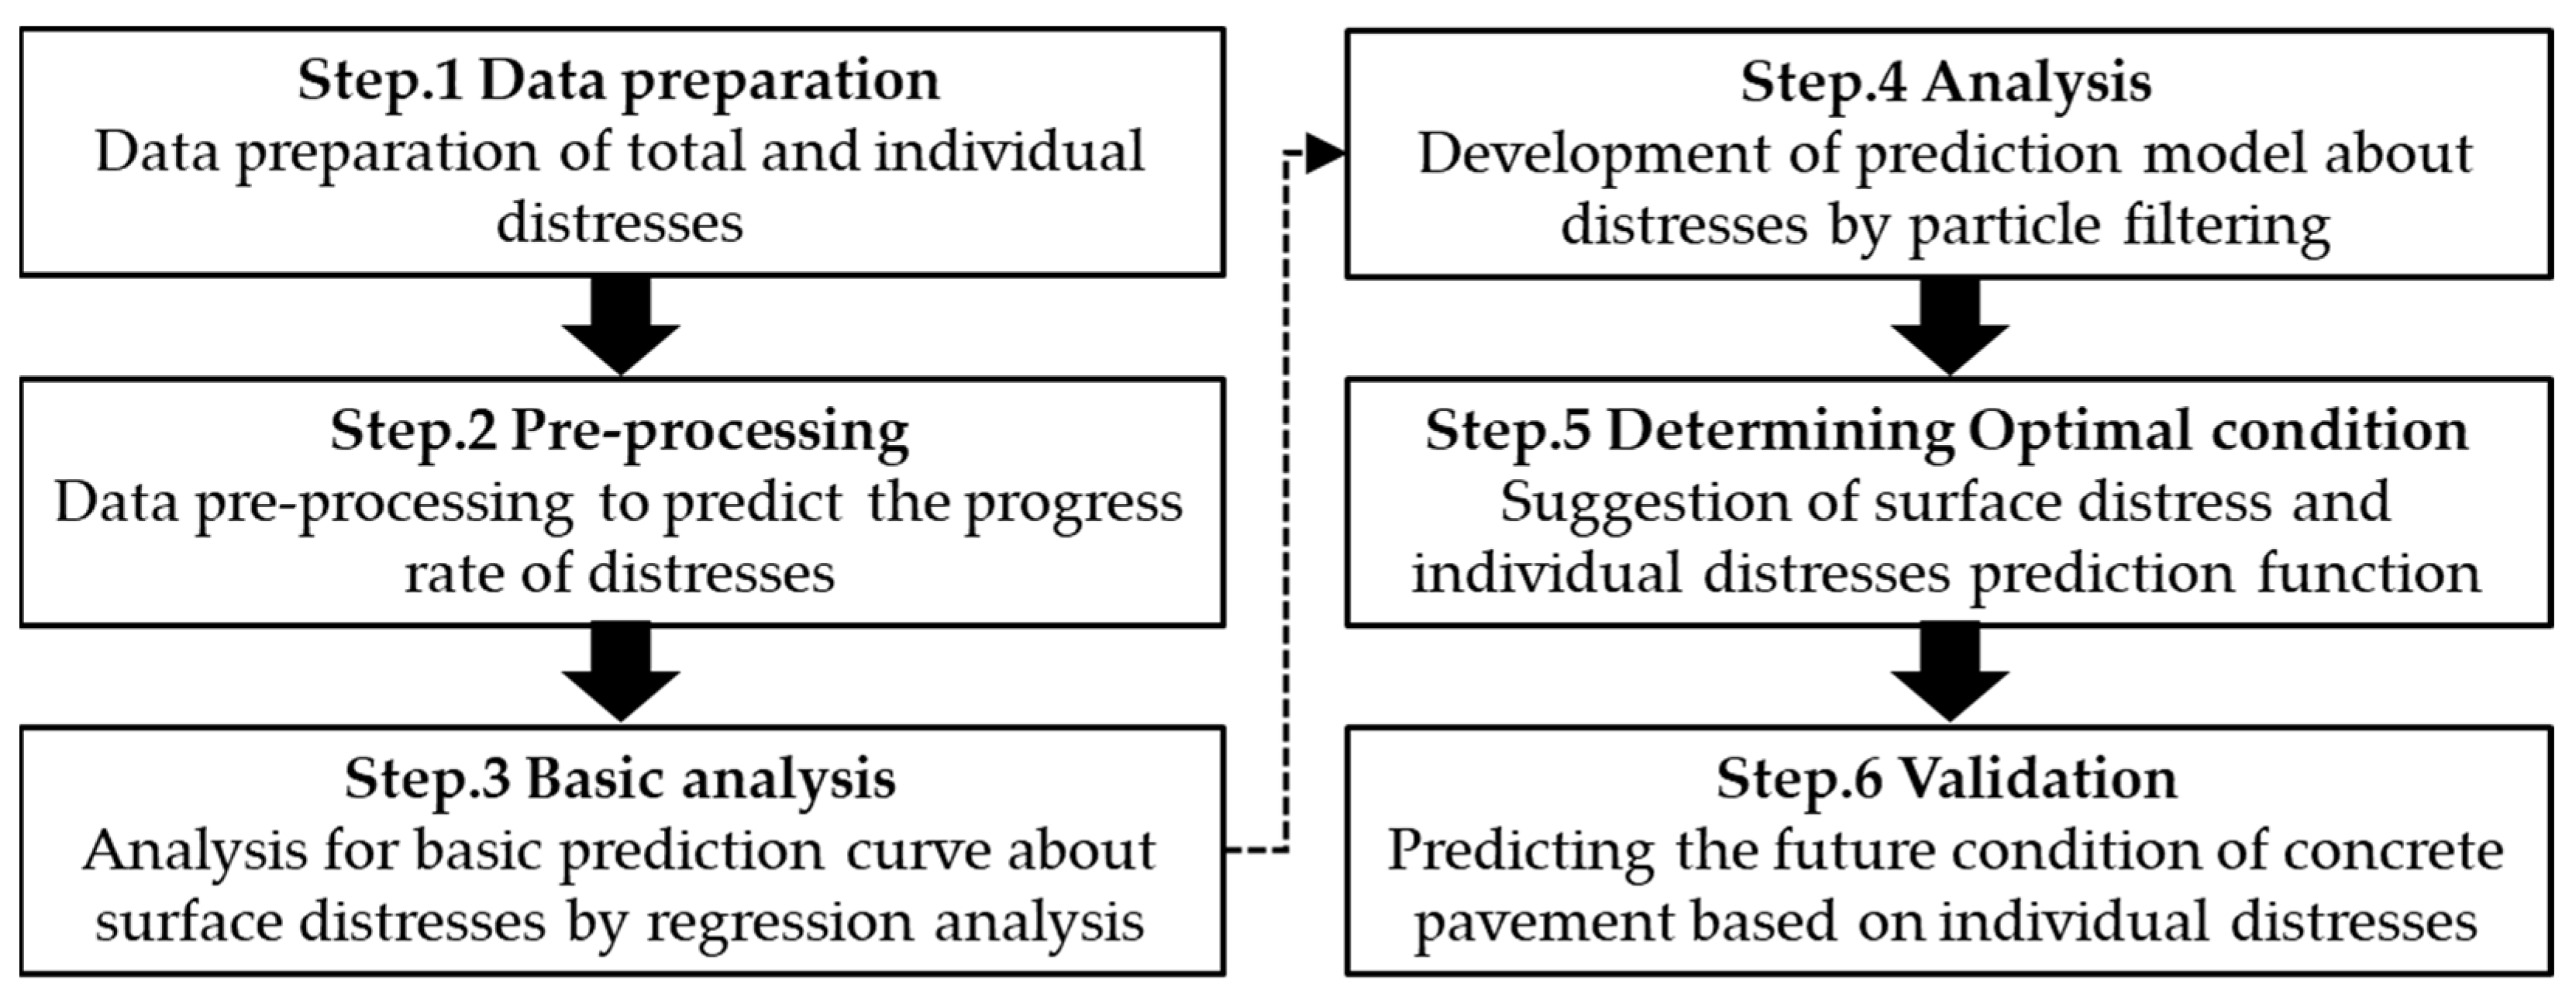
Since the 1980s, state departments of transportation (DOTs) across the United States have extensively researched pavement condition ratings (PCRs) based on Mechanistic-Empirical (ME) design for pavement management at the network level [8]. During this period, individual deductive curves for various distresses occurring in road pavements were developed to measure the deterioration rate using time series analysis [4]. The management of a wider range of road networks was systematically conducted using non-linear regression modeling with the distress structural and roughness index as the basis [5]. In the early 2000s, computing approaches (machine/deep learning, AI, etc.) and satellite technologies (especially geographic information systems (GIS) and global positioning systems (GPS)) were used to perform time series analysis on the same pavement sections. As a result, future pavement management methods based on imaging and scanning, and automatic interpretation technologies were introduced [9]. The summary of the studies on predicting the future performance of road pavements revealed approximately 40 different analysis methodologies, including general statistical analysis, regression analysis, count data modeling, survival analysis, stochastic process modeling, supervised learning, and Bayesian analysis [10].
Despite significant research on predicting the future pavement condition spanning over 40 years, certain challenges persist, including the need for high predictive power due to varying rates of deterioration influenced by geographical environment, climate, equivalent single axial load (ESAL), vehicle-type distribution, and material formulation characteristics [11,12,13,14,15]. Although some studies adopted the international roughness index (IRI) and the distress index, which can represent various distresses that occur on the road pavement surface [16,17,18], they could not achieve high predictive power due to the impact on material properties (ductility and brittleness) and traffic volume distribution. The NCDoT (North Carolina Department of Transportation) in the U.S. is actively researching how to effectively maintain the 79,000-mile network in North Carolina through cost–benefit analysis. These studies have enhanced the predictive value’s explanatory power by operating separate deterioration models for each distress, deriving weighting factors and calibrating coefficient values based on performance data collected annually [19]. Similarly, the IDOT (Indiana Department of Transportation) operates its own PCI (Pavement Performance Index) based on individual prediction models and weights for representative variables (crack, rut, roughness, faulting, and friction) [20]. The studies mentioned so far have predominantly focused on utilizing regression modeling to predict future pavement conditions. However, compared to this approach, there has been relatively limited research using machine learning methods that can achieve higher accuracy. Especially when dealing with the complexity of predicting road pavement deterioration while considering various traffic and environmental loadings, there is a need for research to go beyond relying only on regression equations [21]. Additionally, the necessity of including machine learning approaches for deriving more precise conclusions from extensive road pavement networks has been increasingly recognized [22]. A notable example comes from the Florida Department of Transportation (DOT), where they have introduced methods involving recurrent neural networks (RNNs), Deep Neural Networks (DNNs), gated recurrent units (GRUs), long short-term memory (LSTM), and hybrid (LSTM-FCNN) models to process time series data representing continuous pavement conditions [23]. Deep Neural Networks (DNNs) have been utilized as a predictive tool for the pavement condition index by using a dataset of 536,848 samples. The development and training of various models with different hyperparameters and architectures demonstrated superior performance over traditional linear and non-linear regression models [24]. Additionally, utilizing DNNs with the long-term pavement performance (LTPP) database yielded higher predictive accuracy compared to current practice and multivariate linear regression models, offering potential applications in relative impact assessment and prioritization [25]. In Iowa, the Department of Transportation (DOT) utilized long short-term memory (LSTM) networks for modeling pavement deterioration across three pavement types: asphalt, Portland cement concrete, and composite pavements. This LSTM model achieved higher prediction accuracy over time for all pavement types, suggesting an improvement in future pavement performance prediction and the overall efficiency of pavement management systems compared to traditional regression models [26].
Furthermore, to address the challenge of standardizing maintenance strategies for road pavements with significant variability due to external factors, the application of Markov chain-based approaches has been proposed. These approaches aim to balance costs and effects from the life-cycle cost (LCC) perspective [27]. Upon reviewing most of the developed predictive models, a distinguishing aspect of this study is its focus on the concrete pavement as opposed to the majority of global research centered around asphalt pavement [28].
When establishing the causal relationships behind various damages on road surfaces, a significant amount of research evidence is often required. Therefore, efforts have been made to investigate relatively straightforward correlations, such as those between distress and roughness, using techniques like artificial neural networks (ANNs) and genetic programming (GP) to obtain results [29,30]. Furthermore, the impact of IRI on distress has been analyzed rather than conducting regression analysis through algorithms that process high-dimensional data by utilizing complex machine learning (Lasso: least absolute shrinkage and selection operator; SVR: support vector regression, regression tree, random forests method, etc.) for IRI [31]. The aforementioned studies, which were based on regression modeling, used various computing technologies to increase the predictive power. Validation between two predictive equations is performed through R 2 , root mean squared error and mean absolute error [32].
As described earlier, there is a shortage of research focused on predicting future conditions based on actual long-term public performance data. Therefore, the findings of this study are anticipated to serve as a reference for future research on distress detection using computing technology based on surface image data of road pavement and studies relying on actual long-term public performance data.

3. Methodology

In this study, as mentioned previously, we use particle filtering, a popular machine learning technique aimed at predicting time series data based on long-term public health surveys. The particle filter, a type of Kalman Filter, possesses the ability to forecast models with high nonlinearity. This filter is an advanced technique that yields improved predictive accuracy for typical Bayesian techniques. Moreover, particle filtering is called “Sequential Monte Carlo (SMC)” [33] because it is characterized by the fact that when performing updates that reflect the measured training data characteristics, the model variables with higher probability are resampled more with weights. Further, a small number of model variables with lower probability are resampled. Due to such characteristics of particle filtering, the more reliable the characteristics of the actual measured training data, the higher the prediction accuracy for the test data to be predicted. Readers should refer to the literature for detailed features and the results of particle filtering, including a recent paper that predicted the overall condition index of concrete pavement [8,34,35,36].
The primary aim of this study is to predict the progression rate of the amount of each type of distress by utilizing the available data on distresses among the main failure factors of concrete pavement. To perform particle filtering, a basic model must be constructed first. An example based on the SD is presented below.
S D k = S D k 1 + a k t 2 + b k t + c k
a k + 1 = a k + w a k
b k + 1 = b k + w b k
c k + 1 = c k + w c k
y k = S D k m e a s u r e d S D k ~ S D 0 , σ S D 2
In Equations (1) to (5), a k , b k and c k are the regression coefficients. In this study, “a”, “b”, and “c” were uniformly distributed to ensure that they were not biased toward any particular values. Furthermore, after analyzing the trend of the actual measured training data of SD (excluding the test data to be predicted), it was observed that the regression coefficient of determination ( R 2 ) of the quadratic equation is closest to one. Hence, we set the basic function expression and its coefficient values to the form of a quadratic function. The variables w a k , w b k and w c k are white noise vectors of Gaussian distribution with mean of zero. In addition, S D k is the future SD to be predicted, and it is set as the objective function of k corresponding to the time variable, t is the age of the SD, and S D k m e a s u r e d is the actual measured SD in terms of m 2 . Thus, y k is a function of SD, which can be represented using an equation associated with S D 0 , σ S D 2 , as shown in Equation (5). Consequently, the relative likelihood can be expressed as follows:
q = P S D k m e a s u r e d S D k ~ 1 2 π σ S D e x p 1 2 S D k m e a s u r e d S D k σ S D 2
Here, the error rate of the road surface image analysis data, which is the basis of the SD used in this study, was assumed to be in the range of 5–10%. Further, σ S D was assumed to be 0.1 (10%).
Moreover, the relative likelihood can be normalized and expressed as follows:
q i = q i j = 1 N q j
where N is the number of particles, and the sum of the relative likelihoods is always equal to one. New particles can be calculated based on the relative likelihoods. To prevent the initial SD from being biased toward a particular distribution, the random number (r) was set to a uniform probability distribution between 0 and 1.
i = 1 j 1 q i < r i = 1 j q i
Here, a j , b j , and c j can be reselected through the process of Equation (8). The variable q represents the measured data. The probability increases as the SD approaches the mean, and it decreases towards the tail of the normal distribution. In other words, during this process, data with high probability in the normal distribution are reproduced, and these data are preferentially selected. Conversely, data with low probabilities are gradually eliminated. The old particles are then replaced by new ones (N times iteration) in the next step. An intuitive concept diagram of this process is shown in Figure 2.

4. Prediction of Individual Distresses Based on Particle Filtering

This study aimed to predict the total distress that will occur in the future by learning data on the rate of progression of distresses on the surface of concrete pavement. This is a preliminary study for the prediction of individual distress units based on actual long-term public data of the same 10 m section measured at 2-year intervals.

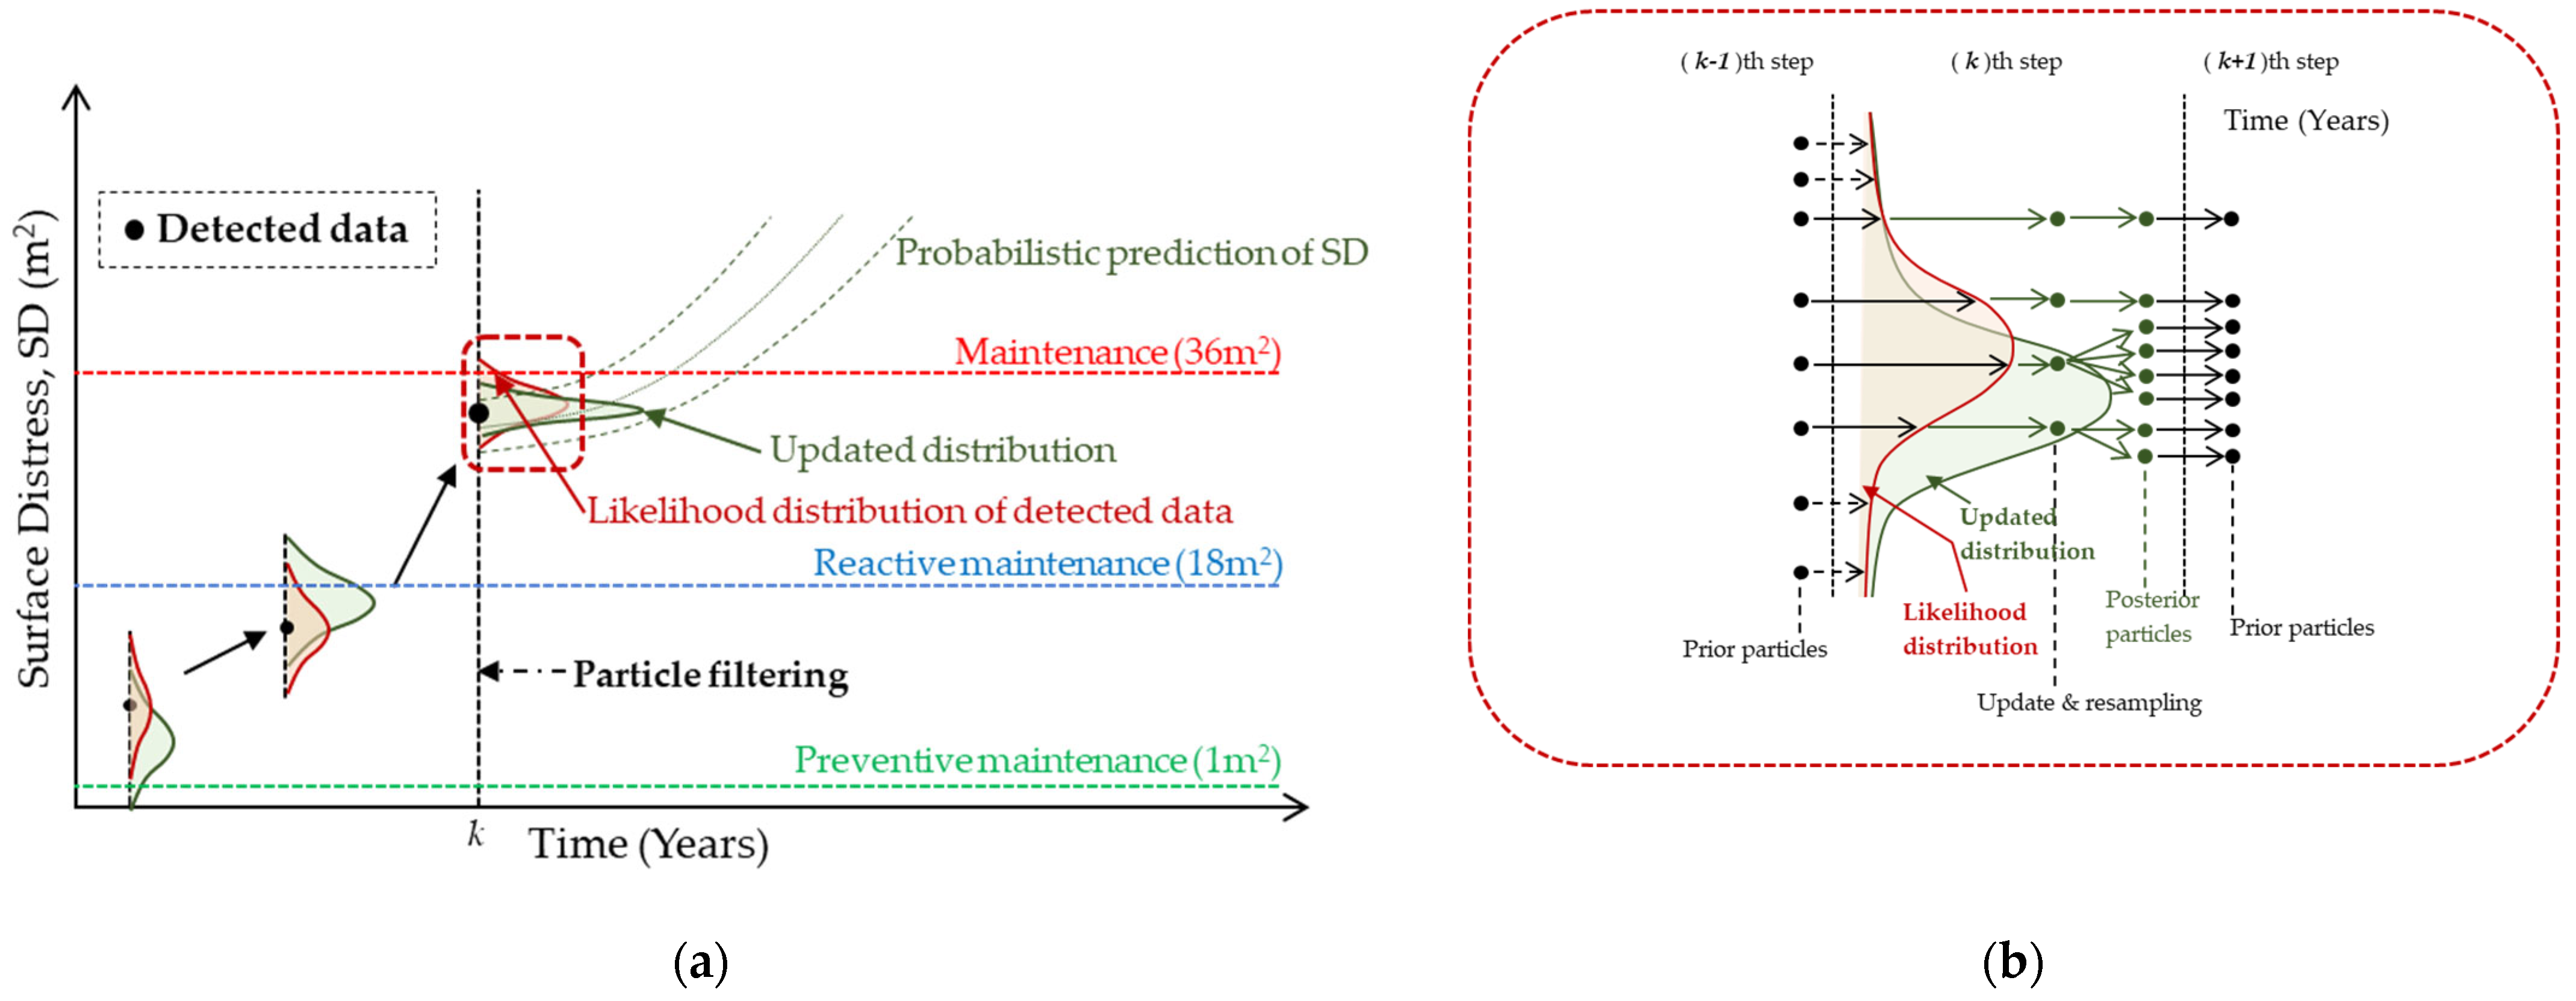
4.1. Concept of Analysis

Based on the vast volume of data on the occurrence of distress, this study attempts to predict the rate of progression of distress at the existing data collection interval of two years. The concept of the basic model is shown in Figure 3. The following concept diagram illustrates the concept of this study, and the explanation is as follows: Figure 3a shows the results of a survey of the average distress that may occur two years later for several sections with the same distress amount. To be precise, the average distress amount after two years was analyzed for several sections with a distress amount of zero, and it was recorded to be 0.02. In the same way, the graph shows that the average distress amount after two years is 0.11 for many sections with a distress amount of 0.02, 0.38 for many sections with a distress amount of 0.11, and 0.70 for many sections with a distress amount of 0.38. When the average distress amounts of the segments with the same distress amount derived from (a) in Figure 3 are interconnected, we get the graph in Figure 3b.
The concept of the basic model described previously can generally be represented by a single regression equation for the entire interval. However, this method was devised to construct a basic model format to integrate particle filtering while overcoming the limitation of the decrease in the overall model’s explanatory power, such as the deviations that may become larger due to numerous outliers when analyzing a large volume of data.

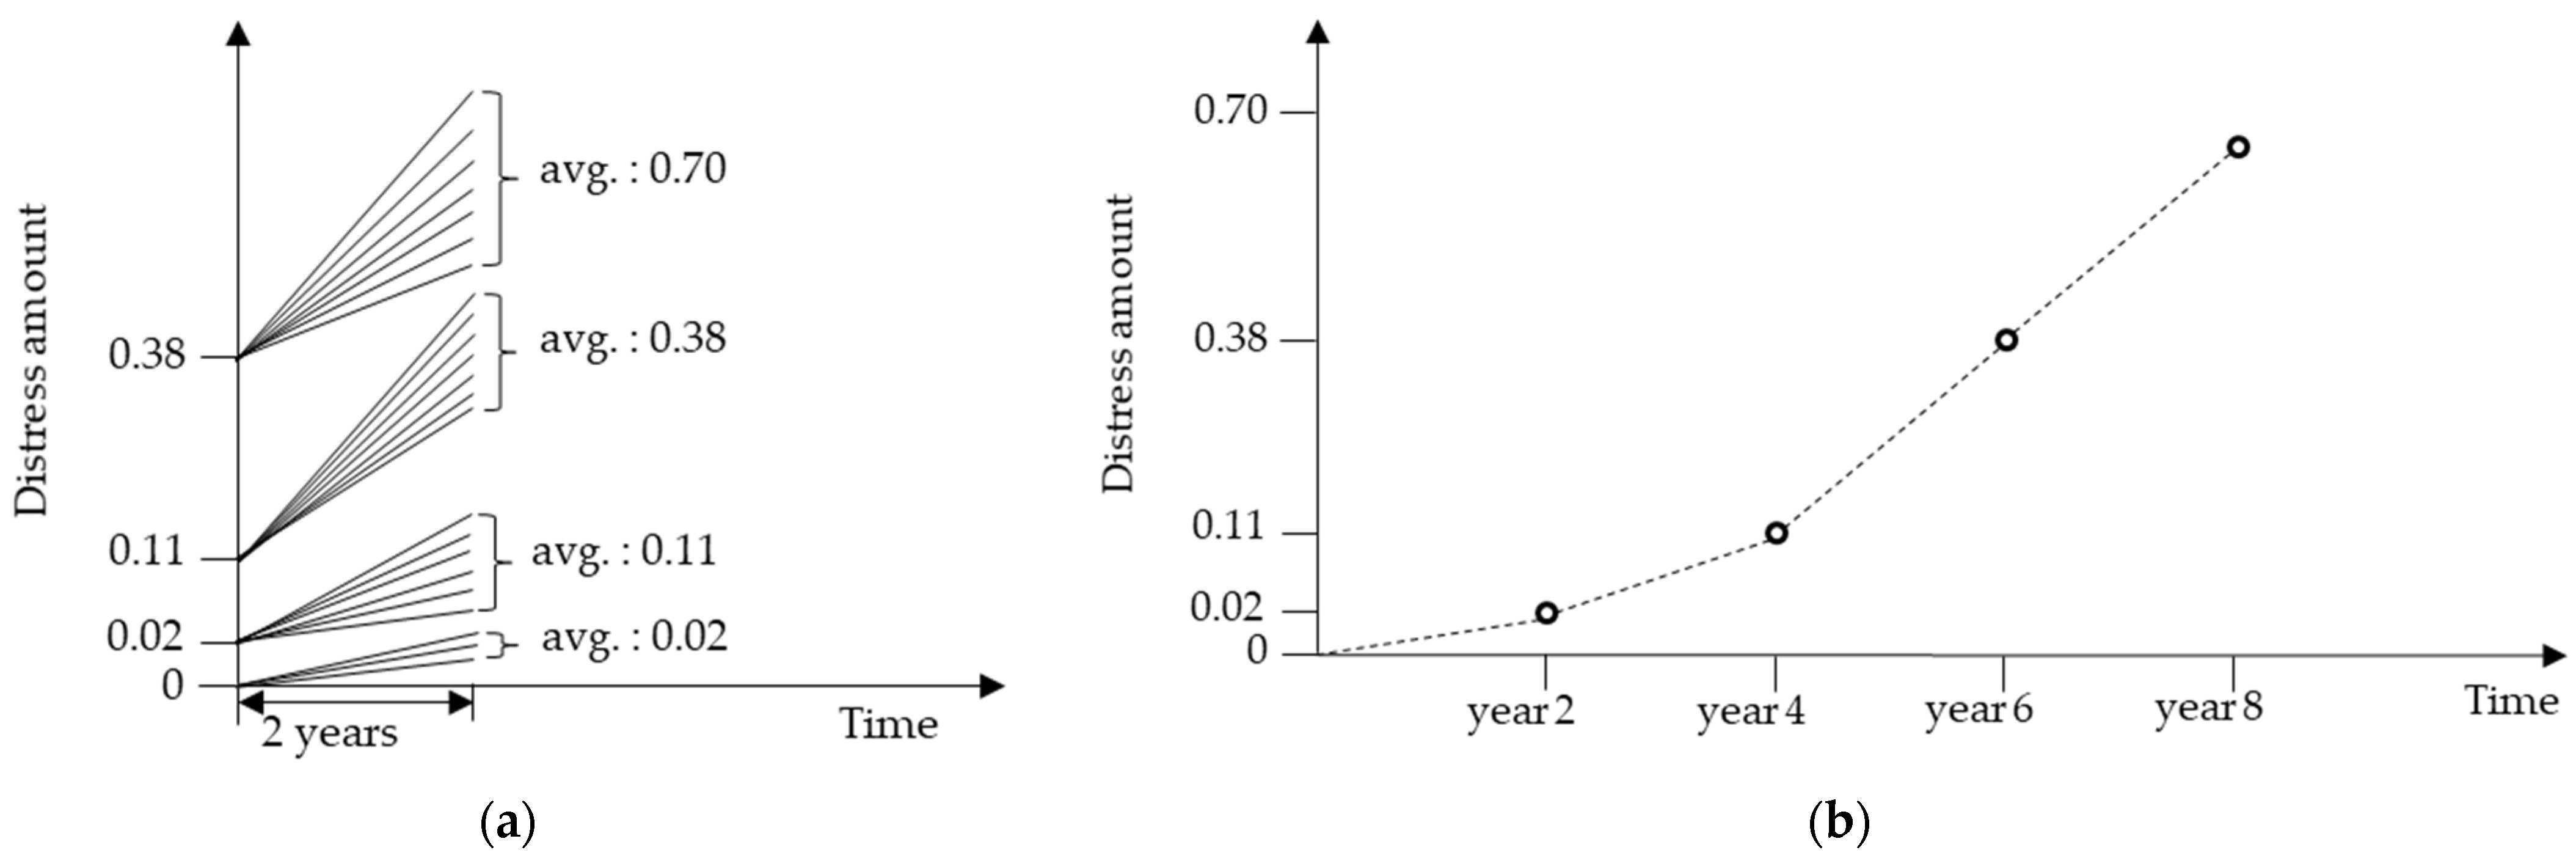
4.2. Data Preparation

The data utilized in this study are based on a condition survey of concrete pavements that have been in long-term public use for nearly 30 years. Four steps were taken to format the data for analysis: (1) the dataset consists of longitudinal/transverse GPS, route, line, lane, city, endpoint, pavement type, surface distress amount, and flatness per 10 m unit section data collected every two years for the exact locations; (2) this study established primary data for pure earthwork base concrete pavement that has not been repaired for distresses that occurred in the target section; (3) sections that were not repaired but the distressing amount decreased were excluded as outliers, resulting in a total of 7672 data points in the 10 m section, or 76.72 km lane condition survey data; and (4) to predict the progress rate of distress amount by distress, the dataset was built by dividing the data of distress amount surveyed at two-year intervals into baseline and two-year survey values after perfect segment matching using GPS and route mileage information.

4.3. Current State of the Survey Sections

The total length of the analyzed section utilized in this study was 76.72 km, as mentioned in Section 4.2. Eight types of distresses were found to be present in this section—longitudinal/transverse crack, durability, patching, longitudinal/transverse joint spall, scaling, and punchout. From the analysis of the overall amount and distribution of distresses within the target section, scaling, and punchout were 12.43 m2 and 18.40 m2, respectively, within the entire target sections. It was determined that the total amount of distress compared to the extension of the study section was not sufficient for analysis. Thus, it was excluded from the target distress. Furthermore, cracks and joint spalls are divided into longitudinal and transverse at the investigation stage, and distresses in different directions are generated by different causes and mechanisms. However, because this study focused on analyzing the growth rate of the amount of distress, the two distresses in different directions were combined into one. Following these steps, the results of the classification of the four distress that had sufficient data for analysis within the target sections of this study, including SD, are summarized in Table 1 below.

4.4. Particle Filter Model for Surface Distress Prediction

Based on the database that is generated after implementing the four steps of data pre-processing introduced in Section 4.2, we developed a basic regression model that can be used to intuitively check the time series of surface distress on concrete pavement. By incorporating this model, the schematic condition change of the analyzed section can be examined based on the number of years from the moment of distress. Figure 4 shows an example regression-analysis-based baseline trend curve for SD. The baseline trend curve is constructed using five data points (data used for prediction), and those from the target decade for prediction were excluded. At this point, the functional expression with the regression coefficient (R2) closest to one, which indicates the reliability of the regression curve, is found. As shown in Figure 4, the regression coefficient (R2) is 0.9752, which is relatively high. However, it can be seen that the prediction accuracy for the data to be predicted (not the data used for prediction) is significantly low. Furthermore, the regression results for the four representative distresses that constitute the SD in Figure 5 indicate that there are some limitations in predicting the data points through general regression modeling.
In other words, if we find and specify the best functional expression through regression analysis, the data to be predicted can be analyzed to avoid a decreasing trend in a continuous form. Thus, it was inferred that higher particle filtering is required.

5. Results

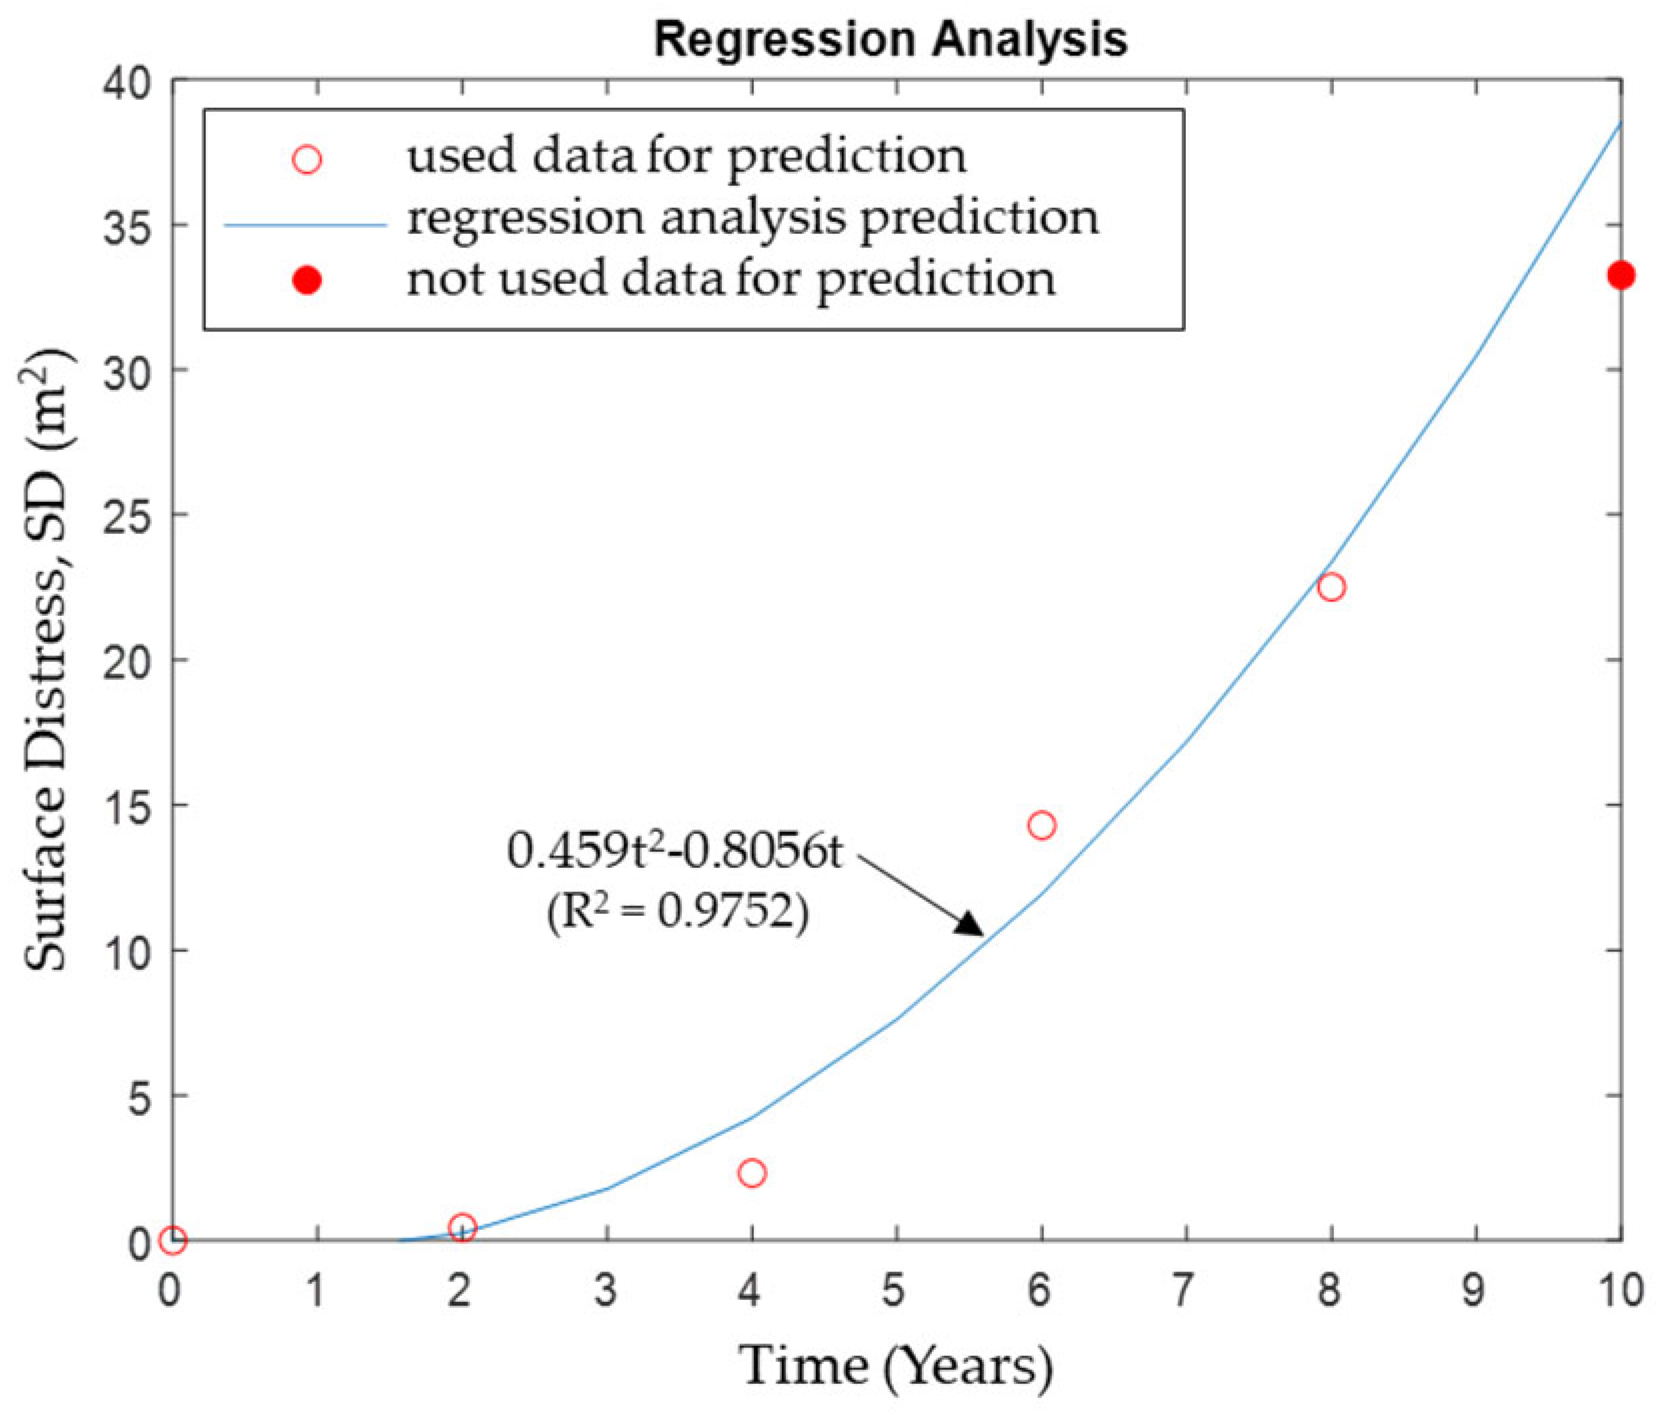
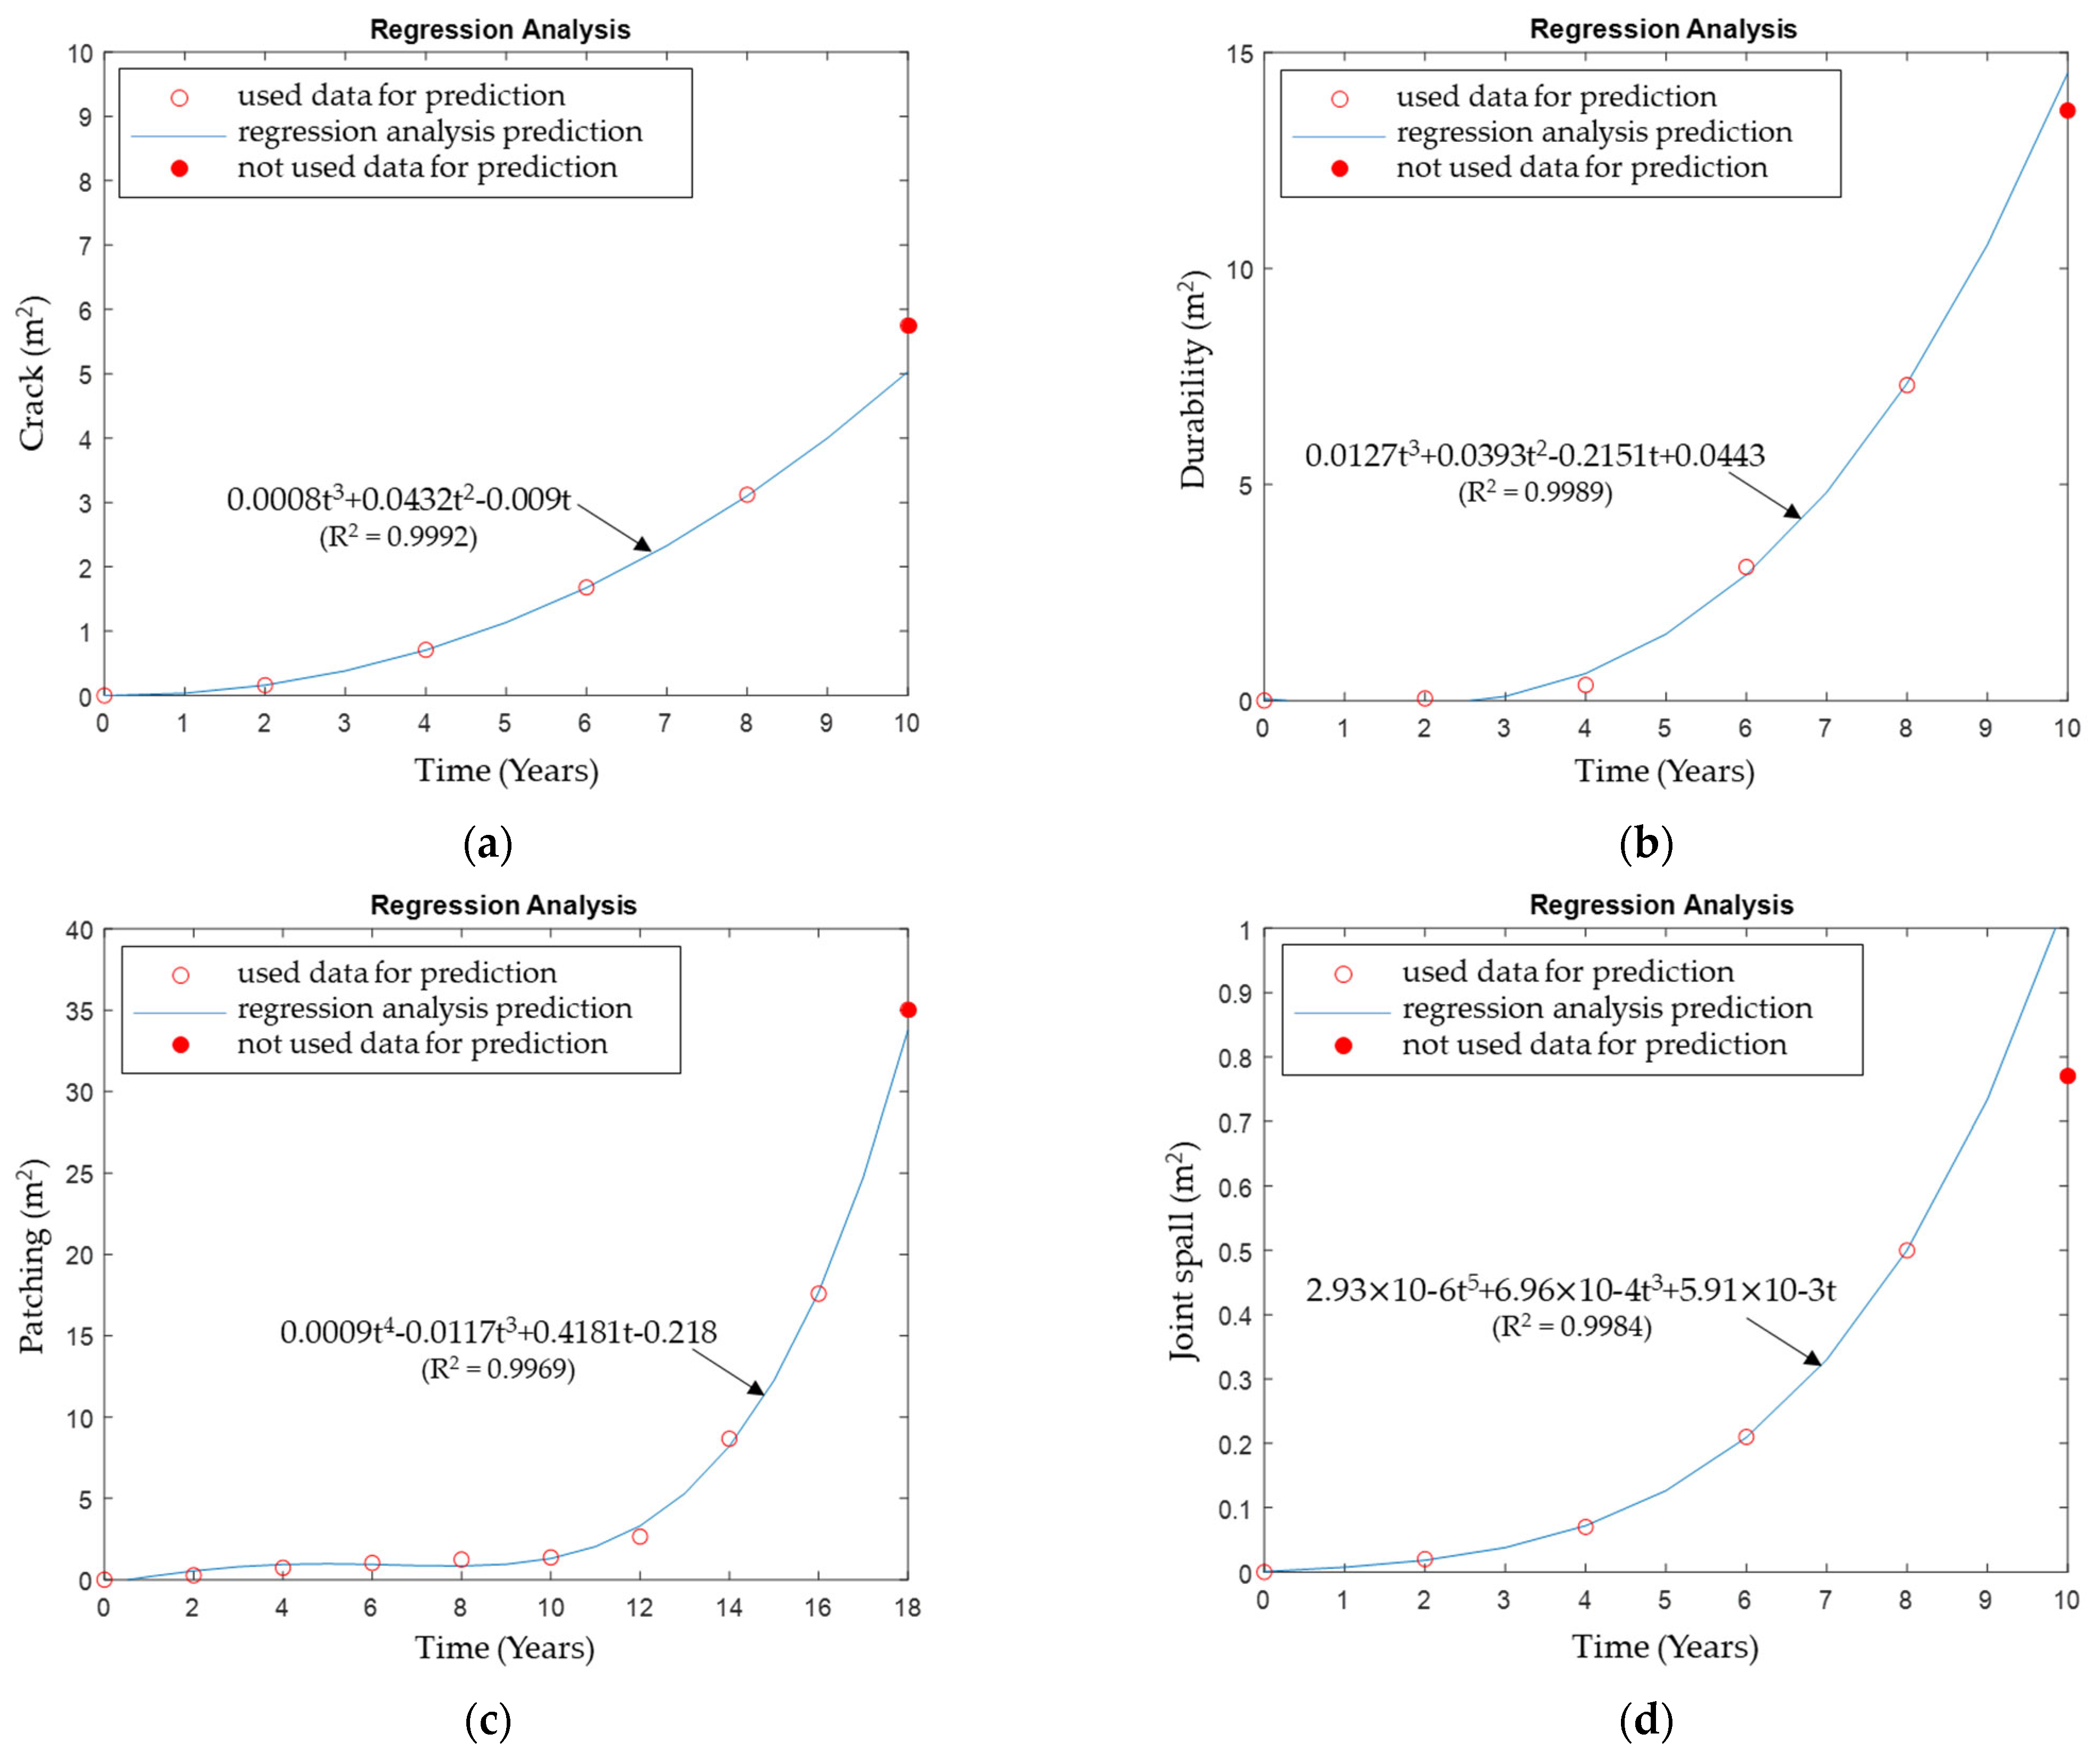
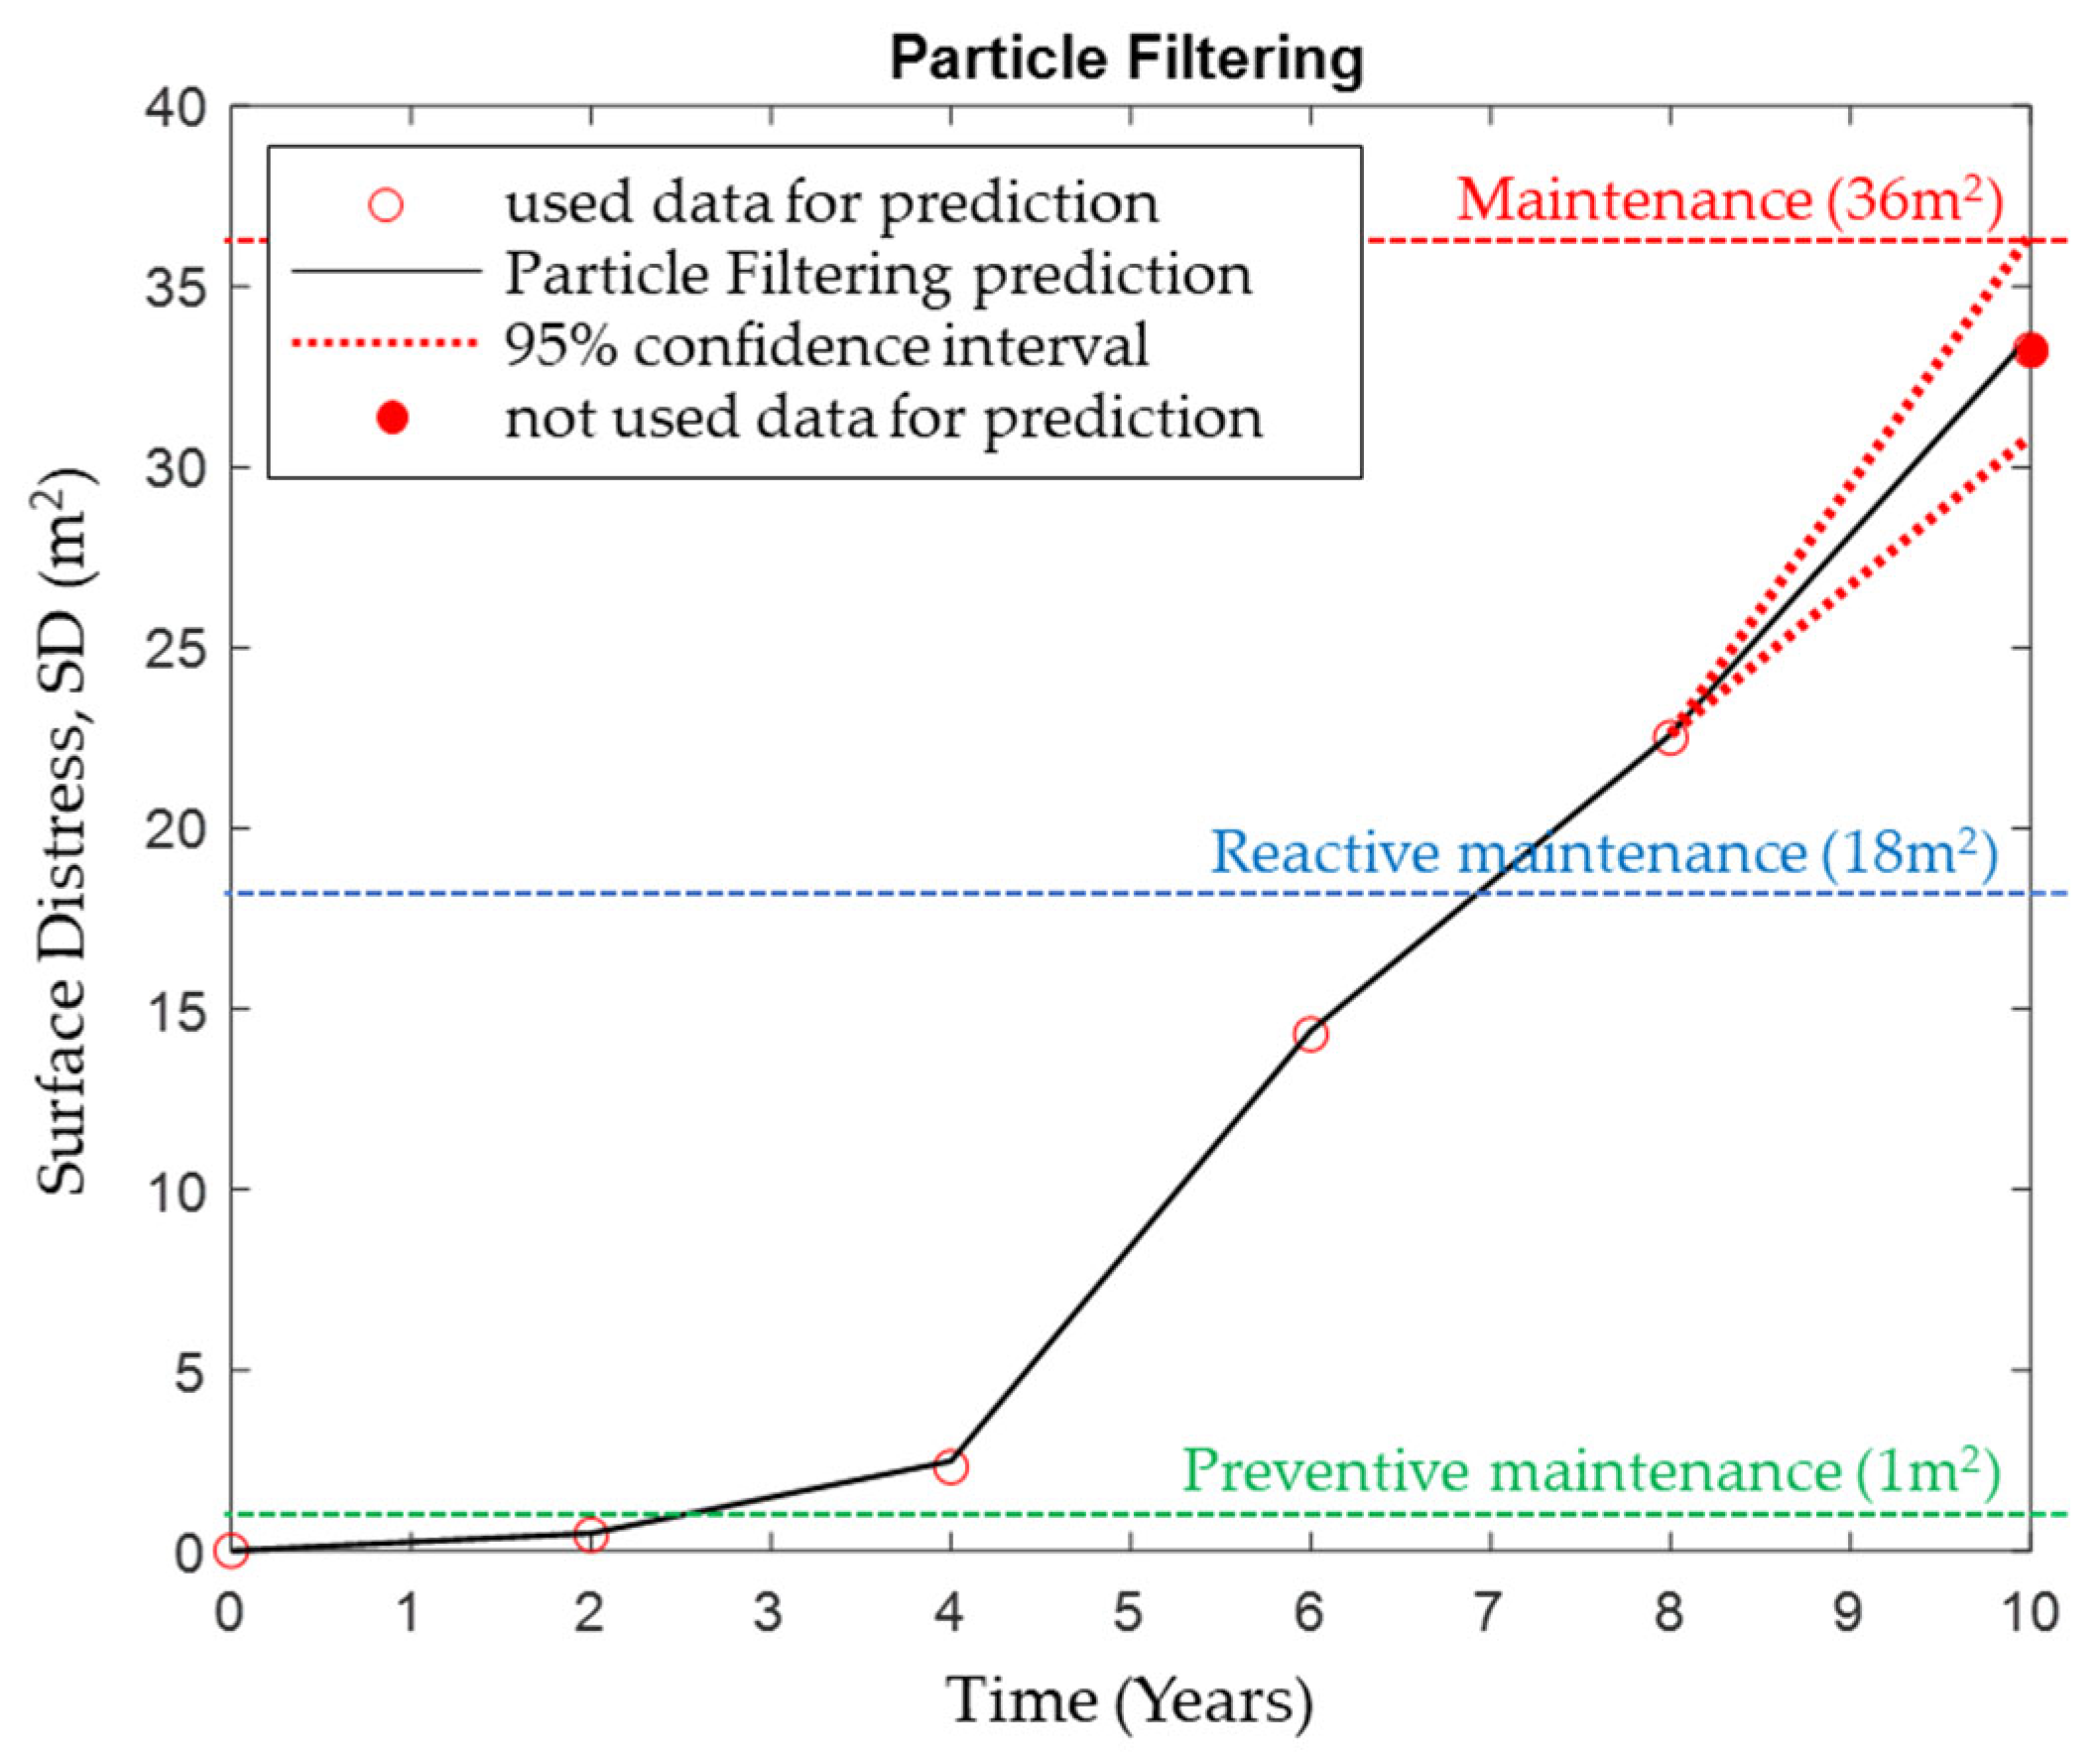
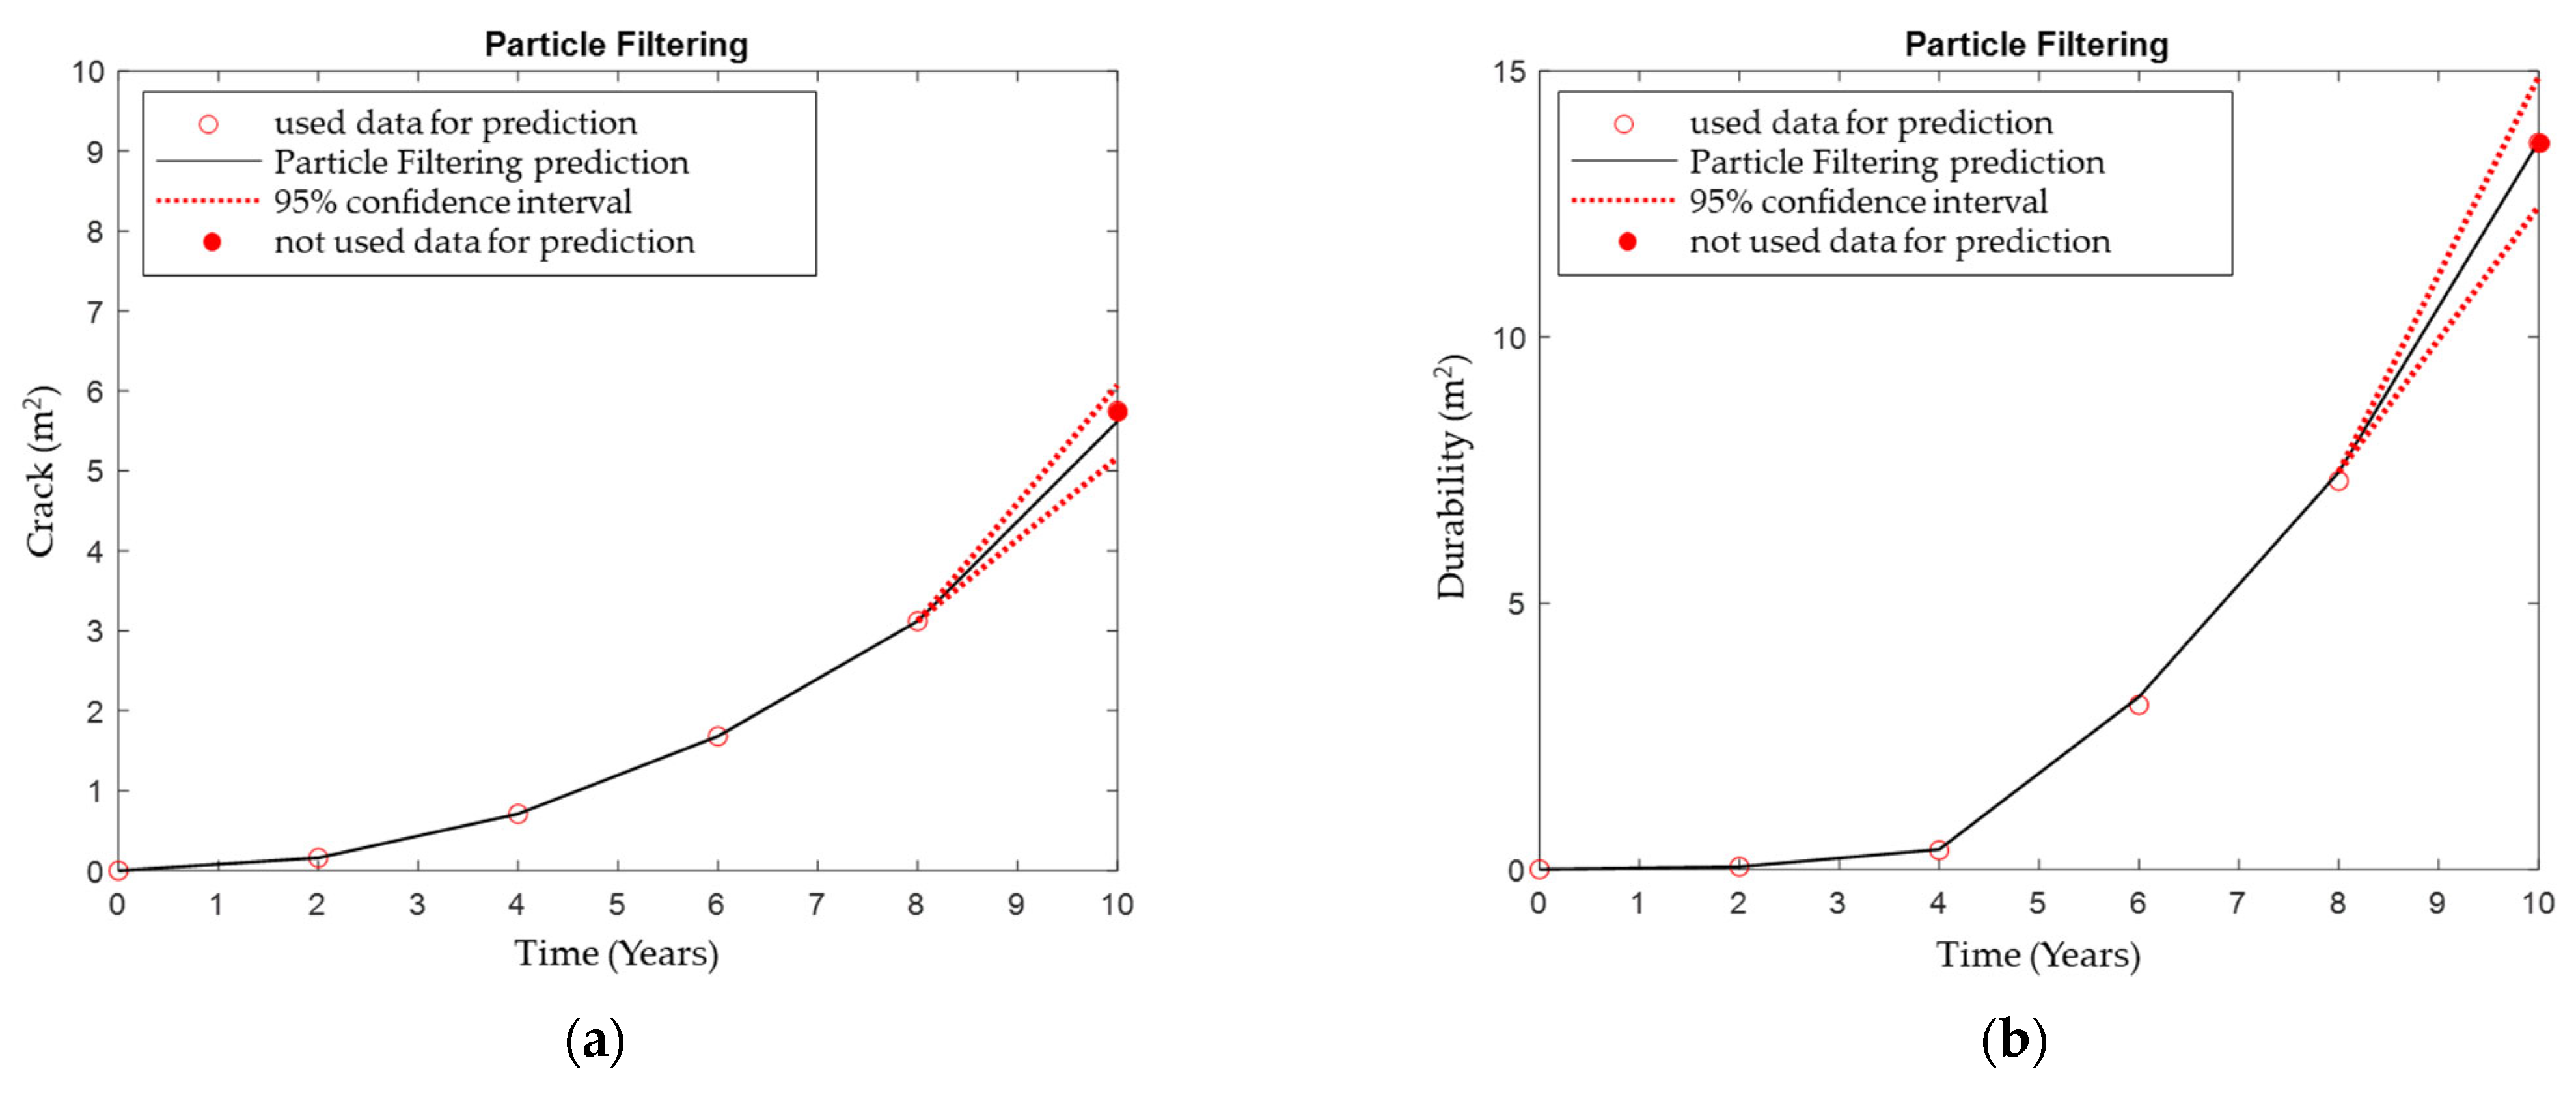
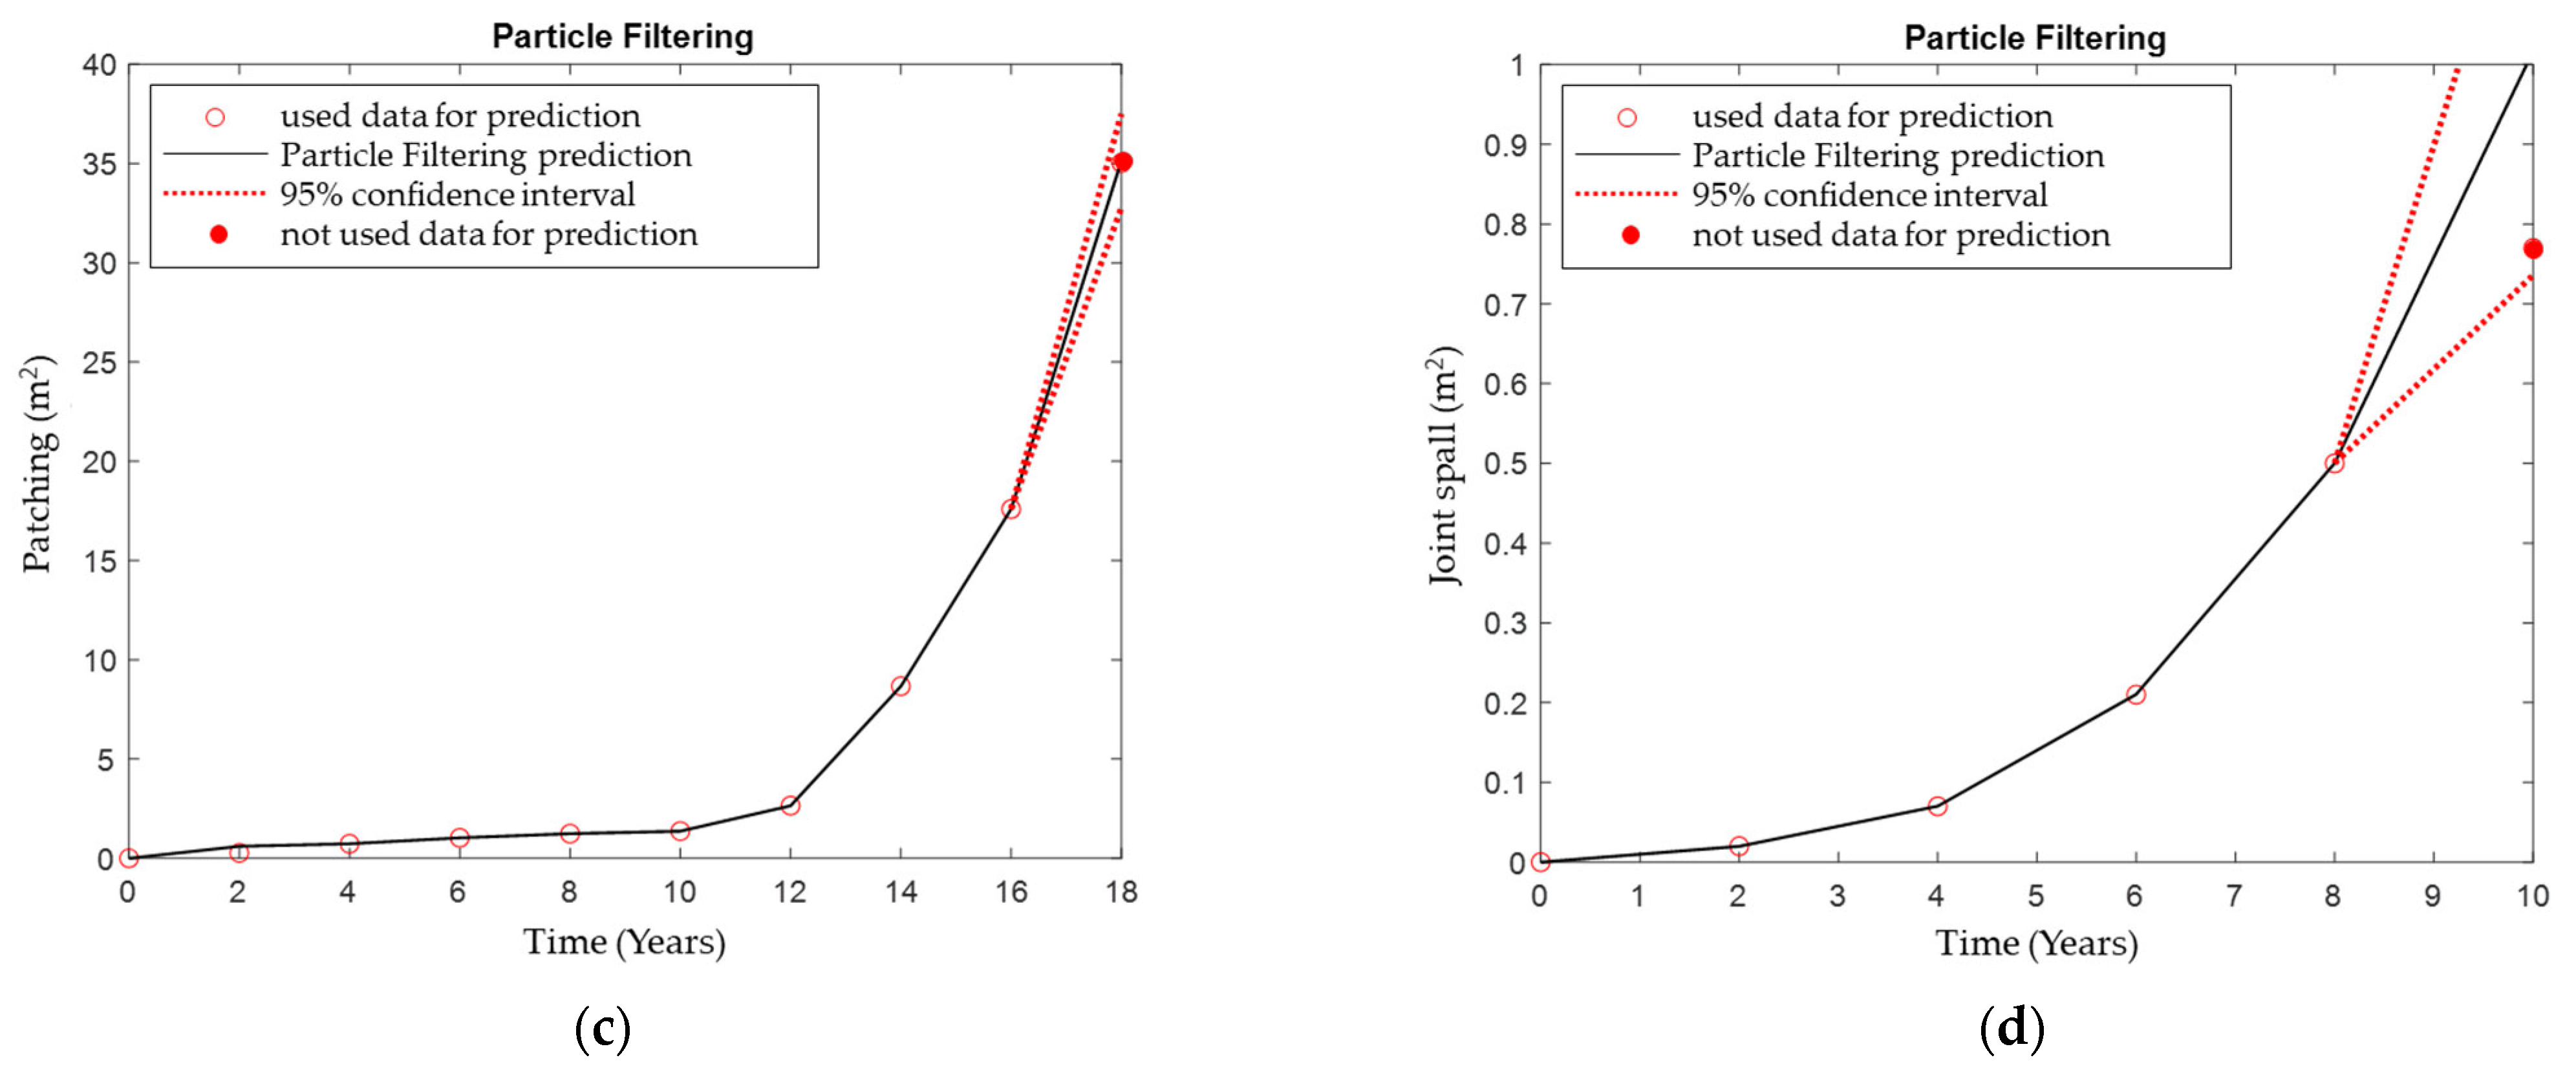
5.1. Suggestion of Surface Distress Prediction Model

Before presenting the full-scale particle filtering results, as seen in Figure 6 (SD) and Figure 7 (by distress), the prediction models within the training interval (eight years before the distress occurrence in the case of Figure 6 and Figure 7a,b,d, and 16 years before the distress occurred in Figure 7c) learned the coefficient values based on the input base model according to the time series. As a result, the optimal prediction model at the final prediction point was derived using Equations (9) to (13), as shown below. Based on the analysis results and validation, this study proposes the prediction functions for SD and its four distresses, as shown in Equations (9) to (13). However, as mentioned previously, in the case of joint spall (Equation (13)), a new prediction function can be proposed after the quantitative verification of the prediction accuracy through the application/analysis of various influencing factors (e.g., ESALs and environmental loads) in the future.
f S D = 0.27 t 2 + 0.66 t
f C r a c k = 0.00435 t 3 + 0.12285 t + 0.13007
f D u r a b i l i t y = 0.01104 t 3 + 0.14009 t + 0.53623
f P a t c h i n g = 2.88 × 10 5 t 5 0.00414 t 3 + 0.27372 t 0.08113
f J o i n t   s p a l l = 2.85 × 10 6 t 5 + 0.00064 t 3 + 0.0058 t + 0.00068

5.2. Application of Particle Filtering

In this study, Surface Distress was predicted using a particle filtering method that can update the time-dependent system model based on Bayesian theory. Through the updating process of the particle filtering method, it is possible to predict a system model that reflects the measurements. At this time, the initial distribution of random model variables was assumed to be uniform, and the errors in data and estimates were assumed to follow a normal distribution. Through this, it can be confirmed that the change in surface distress over time can be properly simulated. Additionally, through the updating process, it was confirmed that model variables with higher probability were resampled.
The rate at which the amount of distress evolves from the moment a distress occurred was applied by updating a basic time series regression model (Figure 4 and Figure 5) using particle filtering techniques. Furthermore, the distress amount at the final prediction point derived from particle filtering and regression modeling was verified in terms of accuracy with the actual data already collected. Figure 6 shows the results of the integration of particle filtering to each of the five available data points (detected data) by setting the SD regression model function to initial information. To clarify the meaning of SD on the prediction curve, the maintenance application baselines are shown together (preventive maintenance (1 m2), reactive maintenance (18 m2), and maintenance (36 m2)). Based on the number of particles utilized in the previous paper [8], 15,000 particles were generated. The analysis revealed that particle filtering can predict unused data for prediction with a very high accuracy of 98.78%.
Prediction accuracy can be expressed with the concept of relative error, as shown in Equation (14). Here, ε R . E denotes the relative error rate between the actual data and the predicted data, and D i s t r e s s S D , p r e d i c t e d and D i s t r e s s S D , d e t e c t e d denote the predicted distress and the actual distress by particle filtering, respectively. The predictive validity of particle filtering was established by demonstrating the accuracy of predictions for SD and each of the four representative distress types (crack, durability, patching, and joint spall). Additionally, the accuracy of predicting the actual distress was assessed in the regression analysis.
P r e d i c t i o n   a c c u r a c y   % = 1 ε R . E = 1 D i s t r e s s S D , p r e d i c t e d D i s t r e s s S D , d e t e c t e d D i s t r e s s S D , d e t e c t e d
Another finding that can be derived from the particle filtering presented in Figure 6 is the difference in the time when the expected management standard is attained through each forecasting method. Pavement management is carried out on an annual basis, with the budget for the next year’s maintenance being set aside in the current year. In this case, the time when the primary preventive maintenance is reached is the same for both forecasting methods, with a relatively moderate increase of 2.563 to 2.864 years. However, when full-scale reactive maintenance is required, the period is 6.377 years for particle filtering and 7.140 years for regression modeling, indicating a difference in the required budget. The exploration of this difference in prediction timing and the analysis of how prediction accuracy influences management decisions will be conducted in detail.
Table 2 is to help understand Figure 7, which numerically shows the average delta for the progression rate of distress in time intervals (per 2 years) for the detected data.
In our research, we have undertaken a comparative analysis predicated on time series data related to pavement performance to authenticate the suitability of our proposed approach utilizing particle filtering. We have contrasted this approach against three principal methodologies that have been previously employed in time series data analysis within studies concerning pavement management data: Polynomial Regression, LSTM, and DNN. We aimed to corroborate the aptness of particle filtering through this comparison. It is important to note that, unlike Polynomial Regression, both LSTM and DNN are variants of artificial neural network models capable of incorporating temporal aspects through their ability to process complex patterns within long-term learning data. This attribute renders them fitting for a comparative evaluation against the results derived from our study.
The analysis results in Figure 6 and Figure 7, and Table 3 show that the prediction accuracy of particle filtering is higher than that of regression analysis, LSTM, and DNN, and that it ranges from 3.3% to 23.64%.
Following an examination of average prediction accuracies across four predictive methods targeting all variables except “joint spall”, we discerned that linear regression yielded an average accuracy rate of 90.39%, LSTM reported at 86.52%, and DNN reported at 81.04%. Contrastingly, particle filtering outperformed these methodologies by achieving a remarkable average accuracy score reaching up to 99.01%. Such outcomes do not insinuate any deficiencies inherent in alternative analytical procedures; instead, they imply that our chosen data format harmonizes optimally with the particle filtering methodology, thereby resulting in superior prediction accuracies.
Based on these findings, it is incumbent upon future studies to delve into the ramifications associated with adopting database configurations optimized for diverse methodologies, thereby highlighting the need for analytical strategies capable of engendering models which align more closely with supplied datasets.
However, in the case of joint spall, the deviation from the actual public data at the point of prediction (in this study, about 10 years from the moment of distress) was quite large. Particularly, if the current amount of joint spall was 0.5 m2, the survey value two years later for the same section was 0.76–1.33 m2. Thus, the explanatory power of the predicted value was not high as the deviation was very large. The predictive power for joint spall was 67.96% for particle filtering and 63.87% for regression modeling, indicating significantly low accuracy levels. Additionally, in the case of both LSTM and DNN, an inability to effectively learn and comprehend the trends inherent within “joint spall” data rendered their predictive capabilities ineffectual. This suggests that it is necessary to calibrate the model through future research by considering complex factors that can affect the occurrence and progression of various distresses in actual concrete pavement, such as traffic volume and environmental loads.

6. Conclusions

This study proposes the application of particle filtering, a machine learning technique, for predicting the future pavement condition of concrete pavement and the rate of progression of individual distresses with higher accuracy. To achieve this, we first defined representative distresses of concrete pavement occurring in the analyzed section developed a prediction model for each distress, and verified their superiority compared to the existing regression modeling method. The key findings of this study are summarized as follows:
  • This study proposed a method to secure a high level of predictive power based on particle filtering, a machine learning technique, using long-term Korean pavement performance data collected nearly 30 years ago. This method was validated through a comparison with the existing regression modeling approach.
  • The prediction accuracy for each variable is analyzed, revealing that particle filtering yielded a 3.3% to 14.67% higher prediction accuracy compared to general regression modeling. This allows for an analysis of the impact of individual distress or surface distress prediction accuracy on the maintenance budget for road pavement management in the future.
  • Prediction accuracy using the particle filtering of crack, durability, and patching, except for joint spall, exhibits a prediction accuracy ranging from 97.72 and 99.86%. This indicates a quite high prediction power and considerable reliability.
  • Particle filtering is found to be more suitable for deriving reliable results when predicting road pavement performance data compared to regression modeling with a single model, as it considers the probabilistic characteristics of all available training data in a time series manner.
  • The low explanatory power of joint spall results from the distribution of the actual survey values at the prediction points failing to form a normal distribution. In this case, predictive power could be improved by normalizing the data distribution at each point, possibly by securing a longer extension (especially the Long-Term Performance Pavement database) compared to the one in this study, which covers a 76.72 km lane.
In conclusion, the findings of this study highlight the importance of machine learning-based approaches, particularly particle filtering, for predicting the future condition of road pavements with higher accuracy. The results presented in this research contribute to the field of road pavement management and can serve as a foundation for further studies on distress detection using computing technology and long-term performance data.

Author Contributions

Conceptualization, D.J. and J.L.; methodology, J.L.; software, J.L.; validation, D.J. and J.L.; formal analysis, D.J.; investigation, D.J.; resources, C.B.; data curation, J.L.; writing—original draft preparation, D.J. and J.L.; writing—review and editing, S.Y. and D.A.; visualization, D.J. and J.L.; supervision, D.J.; project administration, D.J.; funding acquisition, S.Y. All authors have read and agreed to the published version of the manuscript.

Funding

This research was carried out as a part of the “Development of technology to reduce risk factors on the road surface (grant number: RS-2023-00243421)” project funded by the Korea Agency for Infrastructure Technology Advanced (KAIA). The research support is greatly appreciated.

Institutional Review Board Statement

Not applicable.

Informed Consent Statement

Not applicable.

Data Availability Statement

The data utilized in this study was collected by the government of South Korea for public purposes, and it is difficult to make it public as the decision to disclose is beyond the authority of the research team.

Conflicts of Interest

The authors declare no conflicts of interest.

References

  1. Choi, S.H.; Do, M.S.; You, S.H.; Cho, C.S. Determination of Visual Based Asphalt Pavement Crack Condition Using Deep Learning. Int. J. Highw. Eng. 2018, 20, 75–83. [Google Scholar] [CrossRef]
  2. Lee, Y.J.; Jeon, S.I.; Kim, R.E. A Computer-vision-based classification of road surface roughness grade using Machine Learning Techniques. Int. J. Highw. Eng. 2021, 23, 75–81. [Google Scholar] [CrossRef]
  3. Lee, J.S.; Kim, J.H.; Kim, J.R. Use of Deep Learning Image Classification Models and Vehicle Mounted Cameras for Automatic Pavment Pothole Detection. Int. J. Highw. Eng. 2021, 23, 25–34. [Google Scholar] [CrossRef]
  4. George, K.P.; Rajagopal, L.S.; Lim, L.K. Models for Predicting Pavement Deterioration. Trans. Res. Rec. 1989, 1215, 1–7. [Google Scholar]
  5. Johnson, K.D.; Cation, K.A. Performance Prediction Development Using Three Indexes for North Dakota Pavement Management System. Transp. Res. Rec. 1992, 1344, 22–30. [Google Scholar]
  6. Shah, Y.U.; Jain, S.S.; Tiwari, D.; Jain, M.K. Development of Overall Pavement Condition Index for Urban Road Network. Behav. Sci. 2013, 104, 332–341. [Google Scholar] [CrossRef]
  7. Jung, D.H.; Suh, Y.C.; Nam, J.H. Life of Asphalt Overlay over Old Concrete Pavements According to Time of Overlay. Int. J. Highw. Eng. 2019, 21, 69–76. [Google Scholar] [CrossRef]
  8. Lee, J.H.; Jung, D.H.; Lee, M.S.; Jeon, S.I. A Feasibility Study for the Prediction of Concrete Pavement Condition Index(CPCI) based on Machine Learning. Appl. Sci. 2022, 12, 8731. [Google Scholar] [CrossRef]
  9. Kulkarni, R.B.; Miler, R.W. Pavement Management System: Past, present, and future. Transp. Res. Rec. 2003, 1853, 65–71. [Google Scholar] [CrossRef]
  10. Dong, Q.; Chen, X.; Dong, S.; Ni, F. Data Analysis in Pavement Engineering: An Overview. IEEE Trans. Intell. Transp. Syst. 2021, 23, 22020–22039. [Google Scholar] [CrossRef]
  11. Deori, S.; Choudhary, R.; Tiwari, D.; Kumar, A. HDM-4 Deterioration Modelling: Validation and Adoption for Flexible Pavements with Modified Bituminous Road Surfacing. Balt. J. Road Bridge Eng. 2019, 14, 208–226. [Google Scholar] [CrossRef]
  12. Seyed, A.H. Data-Driven Framework for Modeling Deterioration of Pavements in the State of Iowa. Ph.D. Thesis, Iowa State University, Ames, IA, USA, 2020. [Google Scholar]
  13. Liu, H.; Li, Y.; Liu, C.; Shen, G.; Xiang, H. Pavement Distress Initiation Prediction by Time-Lag Analysis and Logistic Regression. Appl. Sci. 2022, 12, 11855. [Google Scholar] [CrossRef]
  14. Suh, Y.C.; Jung, D.H.; Park, K.W. Comparison of CRCP and JCP based on 30-year performance history. Int. J. Pavement Eng. 2021, 22, 1651–1658. [Google Scholar] [CrossRef]
  15. Al-Falahi, M.; Kassim, A. Automated Data Collection System of Pavement Distresses: Development, Evaluation & Validation of Distress Types and Severities. IOP Conf. Mater. Sci. Eng. 2019, 471, 062015. [Google Scholar]
  16. Arudi, R. Developing Pavement Performance Prediction Models and Decision Trees for the City of Cincinnati; Final Report, FHWA/OH-2006/14; Ohio Department of Transportation: Columbus, OH, USA, 2006. [Google Scholar]
  17. Ghassan, A.L.; Rick, L.; Gilbert, B.; Kamran, A. Development of Alternative Pavement Distress Index Models; Final Report; Department of Civil & Environmental Engineering, Michigan State University: Ann Arbor, MI, USA, 2003. [Google Scholar]
  18. Ahmed, K.; Abu-Lebdeh, G.; Lyles, R.W. Prediction of pavement distress index with limited data on causal factors: And auto-regression approach. Int. J. Pavement Eng. 2006, 7, 23–35. [Google Scholar] [CrossRef]
  19. Chen, D.; Cavalline, T.L. Development and Validation of Pavement Deterioration Models and Analysis Weight Factors for the NCDOT Pavement Management System; Final Report, NCDOT Project 2011-01, FHWA/NC/2011-01; Federal Highway Administration: Washington, DC, USA, 2011. [Google Scholar]
  20. Fatih, B.; Omar, S.; Mazin, A.Z. Pavement Management Performance Modeling: Evaluating the Existing PCI Equations; InTrans Project 13-455; Iowa Department of Transportation: Ames, IA, USA, 2014. [Google Scholar]
  21. Amir, S.; Sara, M.; Berthold, B.; Shahriar, R. An Overview of Pavement Degradation Prediction Models. J. Adv. Transp. 2022, 2022, 7783588. [Google Scholar]
  22. Justo-Silva, R.; Ferreira, A.; Flintsch, G. Review on Machine Learning Techniques for Developing Pavement Performance Prediction Models. Sustainability 2021, 13, 5248. [Google Scholar] [CrossRef]
  23. Mers, M.; Yang, Z.; Hsieh, Y.A.; Tsai, Y. Recurrent Neural Networks for Pavement Performance Forecasting: Review and Model Performance Comparison. Transporation Res. Rec. 2023, 2677, 610–624. [Google Scholar] [CrossRef]
  24. Sirhan, M.; Bekhor, S.; Sidess, A. Implementation of Deep Neural Networks for Pavement Condition Index Prediction, American Society of Civil Engineers. J. Transp. Eng. Part B Pavements 2022, 148, 04021070. [Google Scholar] [CrossRef]
  25. Haddad, A.J.; Chehab, G.R.; Saad, G.A. The use of deep neural networks for developing generic pavement rutting predictive models. Int. J. Pavement Eng. 2021, 23, 4260–4276. [Google Scholar] [CrossRef]
  26. Hosseini, S.A.; Alhasan, A.; Smadi, O. Use of Deep Learning to Study Modeling Deterioration of Pavements a Case Study in Iowa. Infrastructures 2020, 5, 95. [Google Scholar] [CrossRef]
  27. Garcia-Segura, T.; Montalban-Domigo, L.; Llopis-Castello, D.; Lepech, M.D.; Sanz, M.A.; Pellicer, E. Incorporating pavement deterioration uncertainty into pavement management optimization. Int. J. Pavement Eng. 2020, 23, 2062–2073. [Google Scholar] [CrossRef]
  28. Karimazadeh, A.; Shoghli, O. Predictive Analytics for Roadway Maintenance: A Review of Current Models, Challenges, and Opportunities. Civ. Eng. J. 2020, 6, 602–625. [Google Scholar] [CrossRef]
  29. Chopra, T.; Parida, M.; Kwatra, N.; Chopra, P. Development of pavement Distress Deterioration Prediction Models for Urban Road Network Using Genetic Programming. Adv. Civ. Eng. 2018, 2018, 1253108. [Google Scholar] [CrossRef]
  30. Issa, A.; Samaneh, H.; Ghanim, M. Predicting pavement condition index using an artificial neural networks approach. Ain Shams Eng. J. 2021, 13, 101490. [Google Scholar] [CrossRef]
  31. Yu, Q.; Sikai, C.; Majed, A.; Miltos, A.; Samuel, L. IRI Estimation Based on Pavement Distress Type, Density, and Severity: Efficacy of Machine Learning and Statistical Techniques. J. Infrastruct. Syst. 2022, 28, 4. [Google Scholar]
  32. Ali, A.A.; Heneash, U.; Hussein, A.; Ali, S.I.; Khan, S. Models Development for Asphalt Pavement Performance Index in Different Climate Regions Using Soft Computing Techniques. J. Soft Comput. Civ. Eng. 2022, 7, 20–42. [Google Scholar]
  33. Simon, D. Optimal State Estimation: Kalman, H-Infinity, and Nonlinear Approaches; John Willey & Sons: Hoboken, NJ, USA, 2006; pp. 461–483. [Google Scholar]
  34. Jeong, M.C.; Lee, S.J.; Cha, K.; Zi, G.; Kong, J.S. Probabilistic model forecasting for rail wear in Seoul metro based on Bayesian theory. Eng. Fail. Anal. 2019, 96, 202–210. [Google Scholar] [CrossRef]
  35. Lee, S.J.; Zi, G.; Mun, S.; Kong, J.S.; Choi, J.H. Probabilistic prognosis of fatigue crack growth for asphalt concretes. Eng. Fract. Mech. 2015, 141, 212–229. [Google Scholar] [CrossRef]
  36. Ristic, B.; Arulampalam, S.; Gordon, N. Beyond the Kalman Filter: Particle Filters for Tracking Applications; Artech House Publishers: Boston, UK; London, UK, 2004. [Google Scholar]
Figure 1. Flow chart of predicting concrete pavement based on surface distress in six steps (M&R: Maintenance and rehabilitation).
Sustainability 16 00573 g001
Figure 2. Intuitive schematic. (a) The particle filtering of surface distress; (b) a close-up of the (k)th step.
Sustainability 16 00573 g002
Figure 3. Conceptual diagram of trend analysis of distress amount change based on the same distress amount survey section at 2-year intervals. (a) Sections where the same amount of distress was investigated every 2 years; (b) time series trend analysis based on the same distress amount survey section in a 2-year cycle.
Sustainability 16 00573 g003
Figure 4. Primary prediction curve about surface distress.
Sustainability 16 00573 g004
Figure 5. Basic prediction curve. (a) Crack; (b) Durability; (c) Patching; (d) Joint spall.
Sustainability 16 00573 g005
Figure 6. Comparison of detected data and particle filtering prediction about surface distress.
Sustainability 16 00573 g006
Figure 7. Comparison of detected data and particle filtering prediction. (a) Crack; (b) Durability; (c) Patching; (d) Joint spall.
Sustainability 16 00573 g007aSustainability 16 00573 g007b
Table 1. Classification of representative defects of Korean concrete pavement and amount of distress in the target section.
ContentMax.
(m2)
Min.
(m2)
Count
(EA)
Summation of Distress Amount (m2)Average Distress Amount
(m2)
Average Except 0 (m2)Distress
Amount Standard Deviation (m2)
SDreference32.600.0062881798.010.290.851.44
after 2 yr.35.050.0062886579.711.051.432.68
Crackreference4.150.006771599.040.090.560.33
after 2 yr.9.500.0067712366.180.350.690.76
Durabilityreference2.330.00767215.220.000.630.05
after 2 yr.19.740.007672452.460.062.410.67
Patchingreference32.450.007527868.450.125.141.25
after 2 yr.35.030.0075273360.040.453.882.23
Joint spallreference0.620.00626160.560.010.110.04
after 2 yr.4.130.006261274.960.040.150.14
Table 2. Average delta for progression rate of distress in time intervals about detected data and number of intervals used in the analysis.
DivisionAverage Delta for Progression Rate of Distress in Time Intervals about Detected Data
(Distress Delta Per 2 Years)
Number of Intervals Used in the Analysis
(EA)
0~2 Years2~4 Years4~6 Years6~8 Years8~10 Years10~12 Years12~14 Years14~16 Years16~18 Years
SD0.441.8811.988.2110.74----6288
Crack0.160.550.971.442.63----6771
Durability0.050.312.734.216.35----7672
Patching0.270.460.300.210.131.286.028.9217.447527
Joint spall0.020.050.140.290.27----6261
Table 3. The comparison of prediction accuracies between particle filtering, regression analysis, LSTM, and DNN at the prediction point for reaching the actual distress.
DivisionActual Distress (m2)Particle FilteringRegression AnalysisLSTMDNN
Predicted Distress (m2)Prediction Accuracy (%)Predicted Distress (m2)Prediction Accuracy (%)Predicted Distress (m2)Prediction Accuracy (%)Predicted Distress (m2)Prediction Accuracy (%)
SD33.2533.6598.7838.5384.1129.6489.1428.9186.95
Crack5.755.6297.725.0387.474.8183.484.5679.31
Durability13.6513.6799.8614.5293.5912.4491.1411.1781.83
Patching35.0335.1499.6933.7696.3928.8482.3326.6476.05
Joint spall0.771.0267.961.0563.87----
Disclaimer/Publisher’s Note: The statements, opinions and data contained in all publications are solely those of the individual author(s) and contributor(s) and not of MDPI and/or the editor(s). MDPI and/or the editor(s) disclaim responsibility for any injury to people or property resulting from any ideas, methods, instructions or products referred to in the content.

