1. Introduction
The motivation behind this study lies in the intricate interplay between economic factors, environmental concerns, and the tourism industry’s dynamics in Slovenia. Over the observed period from January 2000 to December 2021, the study seeks to unravel the complex relationships between CO2 emissions, economic variables, and their collective impact on the hospitality sector and vice versa. The aim of this study is to check whether there are connections between time series and some possible influences among them. Moreover, it is beneficial to check the links between the hospitality industry’s gross wages and sustainability concerns and chronic staff shortages, which can also determine the quality of destination management. A time series is one of the most potent tools to isolate such information. Overall, the study connects previous results on this theme, which are limited at present, and novelty information from the time series data for the case of Slovenia. The essential methodology tools are used, whereas some advanced ones are proposed for use in further studies.
Within tourism, the hospitality industry is a crucial contributor [
1] to Slovenia’s economy; it is imperative to comprehend how various factors, including prices, monetary and fiscal components, and external variables such as CO
2 emissions, influence wages within this sector. The study’s primary objective is to illuminate potential long-term associations between these variables, both internally and externally. There are few studies that check the influence of several factors, including CO
2, on wages, and this research gap is essential to explore. The specific objective is to analyse 18 time series to obtain no more than three factors that impact wages in tourism overall, and vice versa.
One of the external variables under scrutiny is environmental degradation, represented by CO2 emissions. The study’s motivation is to understand how these emissions interact with the economic landscape and subsequently affect wages in the hospitality industry. The research aims to contribute to a deeper understanding of this sector’s sustainability and quality dynamics by examining these relationships.
Furthermore, the study aims to validate its hypotheses through advanced analytical methods like principal components analysis and regression analysis. By doing so, it aspires to provide robust evidence that connects economic shocks, and significant events such as European accession and the financial crises, with the trajectory of CO2 emissions over time. The European Union’s (EU) Green Deal is of the utmost importance to the present commission and intends to transform the continent into the first climate-neutral region in the world. Slovenia, a member of the EU since 2004, is dedicated to achieving net-zero greenhouse gas emissions by 2050, following the commission’s guidelines. As a result, this analysis has weight beyond Slovenia, serving as a model for more extensive research. Furthermore, the southern region of the EU is a sought-after vacation spot with a considerable influence on national economies.
The broader context of the Sustainable Development Goals (SDGs) underscores this investigation’s motivation, particularly key action 12, which pertains to sustainable consumption and production. The study’s insights into the dynamics of sustainable tourism development in Slovenia align with the goals of achieving economic growth while minimising environmental impact; nevertheless, there is a growing appetite for travel because of raising wages.
The study’s motivation stems from the urgency of understanding and addressing the intricate relationships between economic, environmental, and tourism-related variables in Slovenia. By shedding light on these connections, the research aims to provide valuable insights for policymakers, industry stakeholders, and researchers working towards a sustainable and prosperous future for the country’s hospitality sector.
The presentation of a literature review is the starting point for conducting in-depth research; this literature review is used to design a conceptual model for determining the connection between wages in the hospitality industry and other studied variables. At the end of the research, the findings are formulated. The model is designed by applying the time series data methods used in the principal methods of analysing and forecasting time series data. The study identified three crucial research areas by utilising principal component analysis and additional regression analysis. One of these areas is the hospitality industry, which plays a significant role in the service sector and is an essential tourism component. Previously, scholars have extensively researched the impact of both the tourism and hospitality industries on the environment, and vice versa. Since these industries are primarily studied within the field of economics, it is vital to examine all three aspects. Therefore, the study utilises initial econometric techniques to analyse time series patterns.
The structure of this paper is designed to provide a comprehensive exploration of the interrelationships between CO
2 emissions, economic variables, and wages within the hospitality industry of Slovenia.
Section 2 delves into the contextual framework of the study, shedding light on the limited existing research in this domain and identifying the research gap. It also outlines the second specific objective of the study, which aims to discern a concise set of impactful variables from a pool of 18 time series.
Section 3 elucidates the methodology that was adopted, explaining the analytical techniques employed, notably principal components and regression analyses, to assess the relationships among the variables.
Section 4 presents the meticulously gathered and analysed data, revealing the intricate dynamics between the CO
2 emissions, economic factors, and wages. In
Section 5, the discussion is focused on the implications of the findings, linking them to SDG 12 and the pursuit of sustainable tourism development in Slovenia. Finally,
Section 6 encapsulates the study’s conclusions, highlighting its contributions to the existing body of knowledge and suggesting avenues for further research in the field of sustainable tourism economics.
2. Literature Review, Research Gap and Hypotheses Development
The literature review in this study provides a comprehensive overview of the existing research landscape concerning the intricate interplay between CO2 emissions, economic variables, and wages within the hospitality industry context, with a specific focus on Slovenia. The economic significance and the ecological footprint of the hospitality sector have increased interest in sustainable development discourse. However, despite the sector’s importance, explorations of how CO2 emissions, economic factors, and wages intersect are few, creating a distinct research gap.
2.1. Sustainability in the Hospitality Industry
Sustainability considerations have progressively gained prominence in the hospitality industry, driven by environmental concerns and evolving consumer preferences. Prior research has examined sustainable practices such as energy-efficient technologies [
2], waste reduction [
3], and sustainable supply chain management [
4]. However, a notable void exists in understanding the complex connections between environmental sustainability, economic variables, and wages in this sector [
5,
6].
One recent study [
7] utilises a literature review approach to examine how hospitality organisations can embark on the journey of environmental sustainability. The research examines the challenges and strategies of the hospitality industry and its stakeholders, addressing growing concerns about the environmental degradation caused by unchecked tourism growth. As global situations like climate change develop, hospitality enterprises increasingly focus on mitigating their ecological impact. This study seeks to uncover barriers hindering the hospitality sector from achieving environmental sustainability and proposes strategies to enhance guest satisfaction, firm and destination reputation, revenue streams, and the competitive edge, from which various stakeholders could benefit, as well as the broader ecological landscape.
Overall, the SDGs focus on a broad spectrum of factors. Therefore, addressing a pressing societal issue, the paper by de Visser-Amundson [
8] introduces a multi-stakeholder partnership to reduce food waste in the Dutch hospitality industry through a “Food Waste Challenge”, resulting in a 21% average decrease in food waste after employing behavioural interventions across 172 participating restaurants. This research contributes to the sustainable development goals, emphasising the significance of collaborative initiatives in curbing problems such as food waste for a more sustainable hospitality sector.
2.2. Economic Factors and Wage Dynamics
The hospitality industry’s financial dynamics are intricately tied to broader economic factors, including inflation, exchange rates, and fiscal policies [
9]. Prior studies have investigated the influence of economic fluctuations on various aspects of the industry, from tourist demand to investment patterns. Nevertheless, explorations of how these economic factors coalesce with CO
2 emissions [
10] and subsequently impact wage structures within the sector have been notably limited [
11].
The study [
12] investigates the impact of the broader US economy on employee turnover rates in the hospitality industry while also delving into the unique challenges posed by the COVID-19 pandemic regarding turnover dynamics; the findings reveal a strong correlation between overall economic conditions and employee turnover, with crucial theoretical and practical implications for the hospitality sector.
Another [
13] research paper investigates the perceptions and experiences of wage theft in the Australian context, particularly within the hospitality industry, uncovering how societal constructs and enforcement mechanisms contribute to its prevalence, and advocates for more comprehensive criminological exploration to address the underlying social and structural aspects of wage theft.
The subsequent study examines the growth and profit dynamics of the Norwegian restaurant industry. The authors of [
14] use the theory of profit persistence and the law of proportionate effect, revealing that Gibrat’s law does not hold, as small businesses exhibit faster growth and higher profitability, while also highlighting the impact of debt ratios and working capital on profitability, thereby offering valuable insights for both the industry and other stakeholders.
2.3. CO2 Emissions and the Hospitality Industry Sector
The studies of CO
2 emissions within the hospitality sector [
15] have predominantly centred on environmental impact assessments and carbon footprint reduction strategies [
16,
17]. Research has often emphasised the sector’s role in carbon emissions due to energy consumption- and travel-related activities [
18]. However, the sparseness of studies that holistically examine the connections between the CO
2 emissions, economic variables, and rising wages is striking, necessitating a more comprehensive investigation [
19].
Another study [
20] investigates the intricate relationship between tourism, environmental impact, and socioeconomic factors in Italy’s regions using an extended Stochastic Impacts by Regression on Population, Affluence, and Technology (STIRPAT) framework. From 1995 to 2019, the analysis dissects five key pathways influencing carbon dioxide emissions: tourism, climate, demographic, economic, and techno-infrastructural variables. The findings illuminate significant connections between tourism-related activities and environmental degradation, with waste and electricity consumption attributed to tourism contributing to heightened carbon emissions. The Tourism Development Index, discerned through principal component analysis, emerges as a noteworthy determinant of CO
2 releases. Notably, the study reveals varied emission patterns across Italy’s regions, with northern areas displaying more significant emissions and southern and central regions demonstrating a lower environmental impact. Furthermore, the study underscores the adverse effects of airport density, gross domestic product growth, and ecological investments, while precipitation emerges as a mitigating factor in carbon emissions. This research enhances our understanding of the multi-faceted dynamics of tourism, economic development, and environmental consequences, providing insights for informed policy-making and sustainable growth.
A further study [
21] addresses challenges in implementing green and sustainable practices within the hotel industry. Using the Hotel Carbon Management Initiative (HCMI) framework, critical performance indicators (CPIs) are identified and prioritised through the Analytic Hierarchy Process (AHP). The research formulates key CPIs such as air pollution, energy efficiency, water conservation, noise pollution, and waste management, aiming to promote sustainable growth and reduce carbon emissions in the Indian hotel industry. While the study primarily focuses on urban hotels, its findings have implications for risk reduction and obtaining maximum returns on investment. The research advocates for the adoption of HCMI as a model for environmental improvements and to achieve sustainable practices in the broader hospitality sector, contributing to future-ready circular economies.
2.4. Research Gap and Study Objective
The synthesis of the existing literature underscores the research gap that this study seeks to address. The paucity of research integrating CO
2 emissions, economic dynamics, and wage structures in the hospitality industry presents an opportunity for novel insights. Thus, the primary objective of this study is to delve into this uncharted territory, examining how these variables interact and identifying potential long-term linkages that can shape sustainable development within the Slovenian hospitality industry. Moreover, according to the literature review and
Table 1, few studies deal with a spectrum of variables.
The scarcity of comprehensive studies of the broad spectrum of variables influencing the hospitality industry, especially its intricate relationship with the environment and tourism demand, leaves a research gap. The existing research predominantly focuses on a limited range of determinants, particularly energy pricing factors. However, the hospitality industry operates within a complex web of interrelated variables that extend far beyond price considerations [
38]. This knowledge gap underscores the need for a more holistic understanding of the sector’s dynamics, including the multi-faceted interactions that shape its economic viability, environmental impact, and responsiveness to shifting tourism demand (
Figure A3,
Appendix B). A more comprehensive exploration is essential to unravel the intricate tapestry of influences that drive the hospitality industry and its symbiotic connection with the environment, prices, wages and tourist behaviour.
2.5. Hypotheses Development
The hypotheses are divided into four sections based on the study’s objective and the identified research gap.
Hypothesis 1. A complex, powerful interplay exists between CO2 emissions, economic factors, and wages in the hospitality industry in Slovenia.
Hypothesis 2. CO2 emissions, economic factors, and wages in the hospitality industry collectively contribute to shaping the sector’s long-term sustainability and economic resilience.
Hypothesis 3. A principal components analysis of the eighteen time series variables will reveal no more than three significant components that strongly impact both wages in the hospitality industry and broader tourism dynamics.
Hypothesis 4. A thorough examination of the interplay between CO2 emissions, economic variables, and wages will offer valuable insights into how to achieve sustainable tourism development in Slovenia as a case study with global merit.
3. Materials and Methods
3.1. Data
Our study’s foundation comprises robust and credible data sources, namely the Statistical Office of the Republic of Slovenia (SORS) (SORS 2023) [
39], the Statistical Office of the European Commission (Eurostat 2023) [
40], the European Central Bank (ECB 2023) [
41], and the National Oceanic and Atmospheric Administration (NOAA 2023) [
42]. It is worth noting that data are available for public use at the statistical office, which offers the opportunity to access these data.
It is assumed that the data collected from these reputable sources accurately reflect the economic and environmental dynamics within the hospitality industry context in Slovenia. The data vector is presented in
Table 1. Our analysis builds upon the premise that the chosen variables represent the most pertinent indicators of these dynamics, with other influencing factors playing a comparatively minor role. This idea is used to standardise tools used to monitor the economic and environmental aspects of tourism sustainability [
43,
44,
45,
46].
The collected time series variables have been thoughtfully categorised into distinct categories, which are presented in
Table 1. The environmental category comprises crucial CO
2 emissions data, a fundamental measure of the sector’s ecological impact. The tourism category encompasses variables such as tourist arrivals, including domestic and foreign arrivals, capturing the industry’s activity and appeal.
Within the hospitality industry domain, we examine the gross wages within the hospitality sector, a pivotal aspect of the sector’s economic landscape. Furthermore, the macroeconomic realm encompasses a range of vital variables. The fiscal dimension is represented by changes in Value-Added Tax (VAT) and the exchange rate between the Euro and the United States (US) (USD) dollar, which significantly influence economic dynamics.
The pricing aspects are carefully dissected, encompassing prices within the hospitality industry, including prices in the catering and hotel industries. Additionally, we explore prices within the Slovenian and Euro area, including industry production prices and service and energy prices, as well as the prices of food and beverages. The study also incorporates inflation indices at the national level and within the Euro area. A detailed selection of variables and the recent literature review is presented in
Table 1.
By utilising this comprehensive array of time series variables, our study ensures a holistic examination of the economic, environmental, and macroeconomic aspects that collectively shape the intricate relationships within the hospitality industry wages in Slovenia. This meticulous categorisation allows for us to discern patterns and connections that may offer valuable insights into sustainable development strategies for the sector.
3.2. Methods
Before COVID-19, tourism and hospitality were thriving sectors, yet concerns over their substantial carbon footprint emerged. One of the most recent studies [
47] investigates how a hotel’s corporate social responsibility (CSR) activities impact the pro-environmental behaviour (PEB) of its employees. It also examines the mediating role of environmental-specific transformational leadership (ESTFL) and the moderating effect of green perceived organisational support (GPOS) on this relationship. Using structural equation modelling (SEM) on employee-collected data, the research finds that CSR practices directly influence PEB, as does ESTFL. GPOS also plays a significant role. This study provides valuable insights with both theoretical and practical implications.
Three methodological approaches are implemented in our study [
48], which covers the period from January 2000 to December 2021. First, the literature presented in the previous section deals with the theoretical knowledge of the studied variables. Second, indices are reviewed using a descriptive analysis based on a preliminary literature study. Third, four hypotheses were tested using principal components analysis and regression analysis. Quantitative hypothesis testing analysis is followed by a presentation of the results, along with their significance and implications. Although the focus is on all three methodological steps, the core of the research is a quantitative analysis, for which the Statistical Package for the Social Sciences 21 (SPSS) was used.
The main idea of the principal components’ method is to derive one or more new variables (preferably as few as possible) from a set of variables, which should capture as much of the variance in the primary variables as possible. This is a data-reduction method with only a few variables, which provides a better overview of the data than the whole set of variables. The new variables are organised from the most important to the least necessary, where importance means that the first principal component explains the primary data’s variance as much as possible.
The study of the relationships between the variables, in which we look for a new set of variables (containing fewer than the measured variables) representing what the observed variables have in common, is actually a factor analysis. The research aims to determine whether fewer indirectly observed variables or factors explain the relationships between the observed variables.
The factor model and the principal components’ method are estimated in two steps: the first is an assessment of the share of the variance in the studied variables, explained by common factors (communalities) using the model assessment methods, and the second is factor weight estimation with rotations. Factor model estimation methods include the principal axes (principal axis factoring), maximum likelihood method, unweighted least squares method, generalised least squares method and image factoring method.
With the help of the principal components’ method and factor analysis [
49], we tried to determine whether certain common factors can be found for the variables included in the model. The purpose of factor analysis is primarily to verify the results of the principal components’ method. The basis of the factor model is the assumption that there is a relationship between the variables
(
),
(
) and
(
):
where the labels mean:
The assumptions for the general factor model are first, that specific factors are orthogonal to each other (
, if
), second, that each specific factor
is orthogonal to each common factor
(
for each
and
), third, that common factors are orthogonal to each other (
if
holds), and fourth, that variables
,
and
should be centered
. We can now derive the following factorial equation:
where the labels mean:
—variance in common factors;
—variance in specific factors (of course, the latter must be as small as possible).
With this, we split the variance in the measured variable into a part explained by common factors and a specific variance.
4. Results
This primary objective is to assess the applicability of traditional analytical methods, like regression and factor analysis. Drawing on economic theory, this study leveraged the principal components method to uncover fundamental components. We identified two factors that elucidated the inconsistency between the variables. The principal components method effectively summarises the data, minimising information loss by reducing the data dimensionality.
All three approaches aim to ascertain whether relationships between the observed variables can be explained by fewer indirectly observed factors. This multi-faceted methodological exploration advances the understanding of variable relationships and their underlying factors.
4.1. Quantitative Approach
4.1.1. Descriptives of Summary Statistics
The study identified a comprehensive set of 18 time series variables, drawing from a diverse range of parameters, and amassed a robust dataset comprising 264 observations. Subsequently, the collected data were analysed, yielding a detailed set of summary statistics providing insights into the distribution and characteristics of the variables under investigation.
Examining summary statistics obtains valuable insights into the characteristics of the variables under consideration. Notably, the integration order of the time series variable aligns with theoretical expectations, while the prices exhibit near-I(2) behaviour, and the environmental variable approaches I(1). These observations can be gleaned from the skewness and kurtosis results in
Table 2. The impact of the pandemic is evident in the data, with instances of minimum values equaling zero, a particularly noteworthy phenomenon. It is essential to acknowledge the unique handling of the data during April 2020, during which there were zero tourist arrivals in Slovenia, necessitating the substitution of 0 with the integer 1. This adjustment was made to ensure the coherence of mathematical expressions and the accuracy of the subsequent data analysis. The distribution of indices departs from normality, with kurtosis failing to attain the threshold of 3. While the study refrains from conducting the Jarque Berra test in this context, factor analysis remains a primary methodological approach.
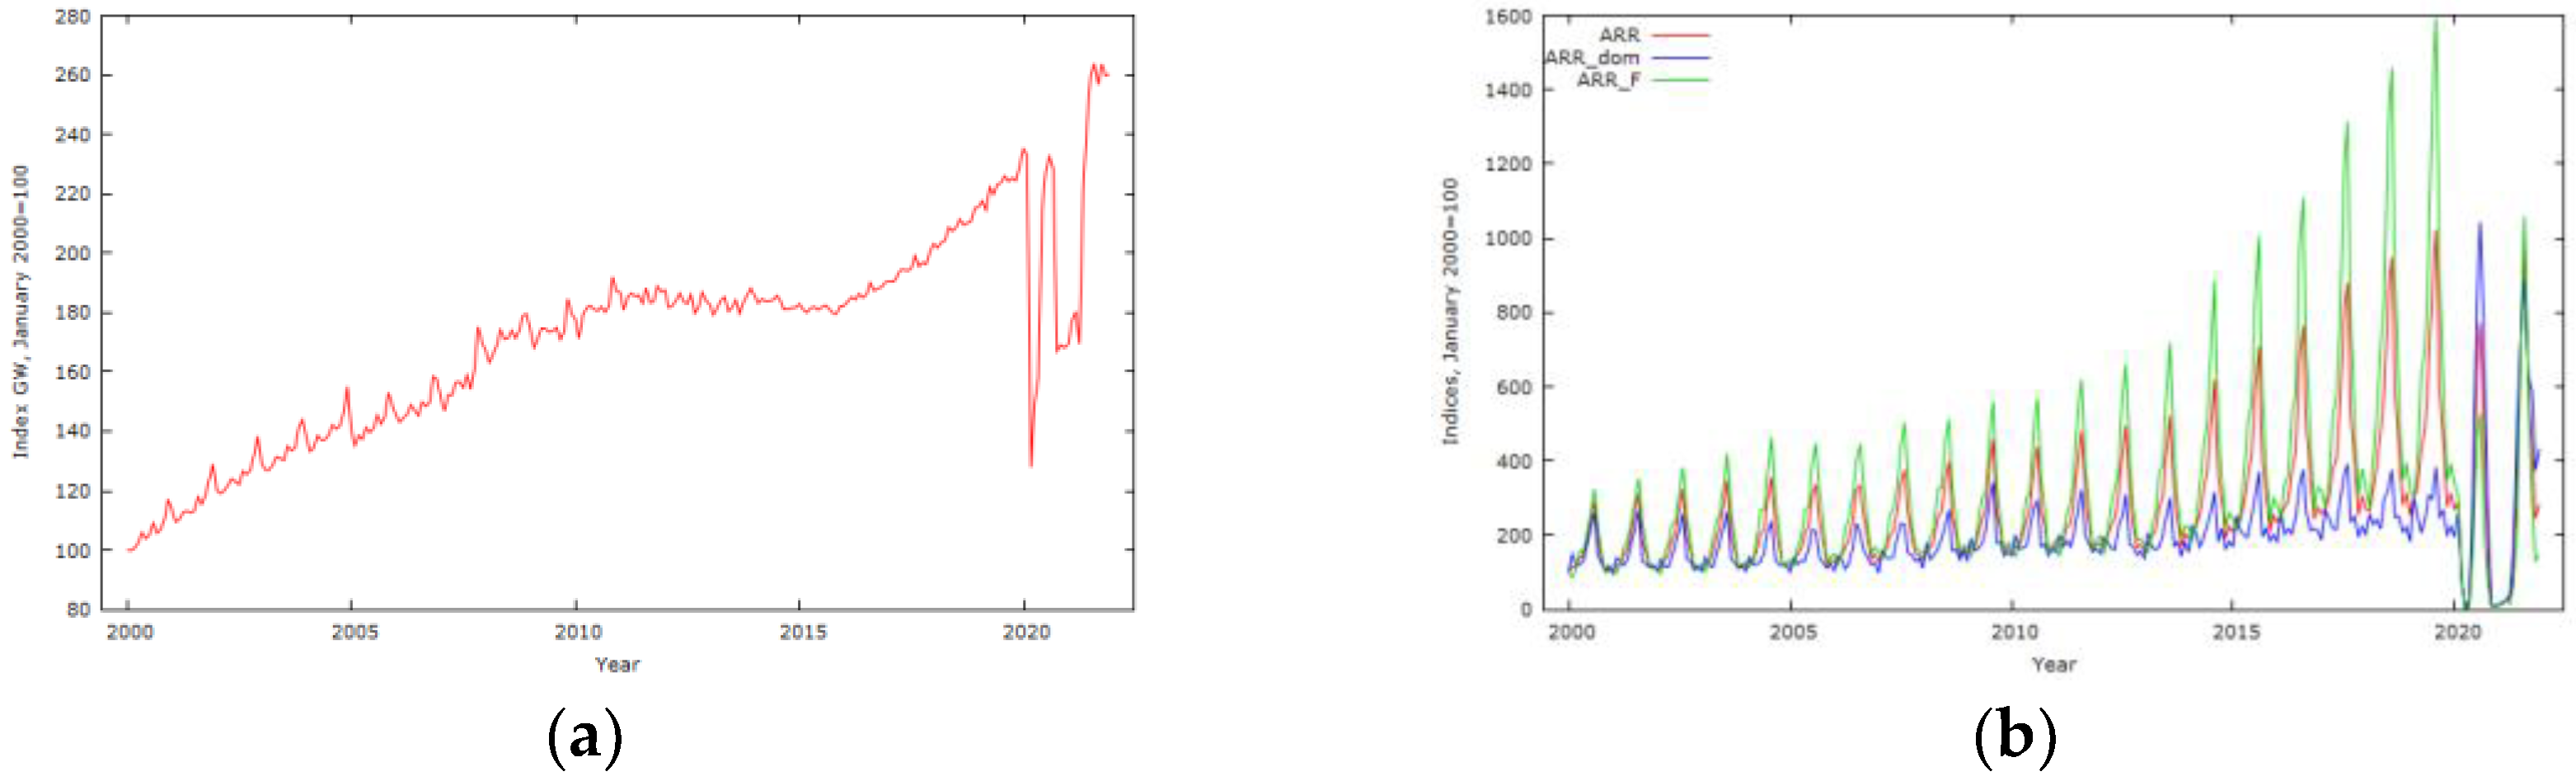
The visual representations in
Appendix A substantiate the trends observed in the analysis. A consistent upward trajectory characterises the parameters under investigation, punctuated by a significant shock during the pandemic and notable volatility in exchange rates. These visualisations are categorised into four sectors, mirroring the organisation of
Table 2. Tourism arrivals and energy prices exhibit the highest levels of variability, warranting closer attention to the ethical research trajectory. Similarly, wages in the hospitality industry and prices follow this non-standard pattern, reflecting Slovenia’s unique context across 264 observations. Notably, this analysis underscores Slovenia’s trajectory toward development, evidenced by elevated prices and a sophisticated service pricing framework. For instance, the inflation index in Slovenia stands at 166.93, surpassing the Eurozone’s 124.05. The increase in hospitality industry prices in Slovenia is equally remarkable, peaking at 218.92, compared to the Eurozone’s 146.90.
4.1.2. Principal Component Analysis
The outcomes of the factor analysis using principal component analysis provide significant insights into the interrelationships among the variables under scrutiny. With most variables demonstrating commonalities surpassing a threshold of 0.5, barring the exchange rate, the analysis indicates a substantial shared variance among the observed parameters (
Table 3).
Utilising the scree plot and the
Table 4, two dominant components emerge, yielding two novel variables derived from the factor analysis and thus encompassing the 20 variables considered in this study. The initial iteration involving these two factors elucidates their capacity to explain over 88% of the covariance among variables, as detailed in
Table 4, and present the factors’ contribution weights. These weights underscore the significance of each time series, with values exceeding 0.5 of their covariances for the corresponding dependent factor, providing a comprehensive perspective of their interplay and influence within the analysed system.
The component matrix outcomes, as illustrated in
Table 5, provide a compelling depiction of the underlying structure of the dataset. Notably, the first component distinctly captures the economic dimensions, prominently featuring variables such as wages in the hospitality industry. This observation underlines the industry’s persistent economic focus, suggesting that financial considerations, including wages, significantly influence its dynamics. The second component’s composition aligns with expectations, revealing a nuanced interplay between positive tourism indicators and adverse environmental effects. In this intricate balance, the factor analysis offers distinct insights: from the dataset of 18 variables and 264 observations, it becomes evident that gross wages in the hospitality industry are primarily driven by economic factors, with limited environmental influence, while their correlation with tourist arrivals remains non-significant.
Conversely, the second component highlights the notable role of exchange rates and carbon dioxide emissions, which negatively affect tourism arrivals. Additionally, this component underscores the strong covariance between tourist arrivals and both domestic and foreign arrivals, signifying their collective impact on overall tourism dynamics. This insight has valuable implications for managerial strategies within the Slovenian context. It is crucial to think about domestic and foreign tourist arrivals when suggesting a balanced approach to sustainable tourism management. In conclusion, the factor analysis provides multi-faceted insights into the intricate relationships among variables, offering valuable guidance for the industry’s strategic decision-making processes.
From a broader perspective, the environmental impact on prices within the Slovenian and Eurozone contexts has a notably positive correlation. This sheds light on an inflation-driven process, which is particularly intriguing given the prevalent high inflation rates during 2008 and 2023. This observation underscores the intricate connection between environmental factors and pricing dynamics, which is especially pertinent in the current economic landscape derived from the first component. Nonetheless, the subsequent section tests this hypothesis, further elucidating the underlying mechanisms and relationships at play. Therefore, the first component (K1) is an economic environment, and the second one (K2) is a tourism environment.
4.2. Hypotheses Testing and Regression Analysis
Hypothesis 1: The scarcity of comprehensive studies investigating the multi-faceted influences on wages within the hospitality sector, including CO2 emissions, creates a significant research gap. Therefore, it is hypothesised that a complex, powerful interplay exists between CO2 emissions, economic factors, and wages in the hospitality industry in Slovenia.
Result: Hypothesis 1 is confirmed by covariance from the first common factor, while gross wages in Slovenia are still deeply dependent on fundamental economic relations like inflation, which is covariance by environmental impact. This could be a circle that is not conducive to the demanding process of the wages in the tourism industry, which is most important in the highly competitive market. People should expect further price increases in Slovenia, especially in tourism.
Hypothesis 2: Considering the limited research addressing the interrelationships between CO2 emissions, economic factors, and wages in the hospitality industry, it is hypothesised that these factors collectively contribute to shaping the long-term sustainability and economic resilience of the sector.
Result: Based on the covariance from the second common factor, Hypothesis 2 is confirmed. However, it is essential to note that the impact of the environment on the hospitality industry is negative. Additionally, if the behaviour of the tourism industry remains unchanged, there could be a decrease in demand. Despite a short-term post-pandemic boom, the long-term factor analysis’ prognosis suggests a negative impact on tourism demand.
Hypothesis 3: Given the unique context of Slovenia and the study’s objective of identifying a minimal set of influential factors, it is hypothesised that a principal components’ analysis of the eighteen time series variables will reveal no more than three significant components that strongly impact both wages in the hospitality industry and broader tourism dynamics.
Result: Hypothesis 3 is confirmed. Two common factors were found.
Hypothesis 4: Against the backdrop of Sustainable Development Goal 12, target 12b and Indicator 12.b.1, which highlight standardising tools to monitor the economic and environmental aspects of tourism sustainability, it is hypothesised that a thorough examination of the interplay between CO2 emissions, economic variables, and wages will offer valuable insights into the development of sustainable tourism in Slovenia as a case study with global merit.
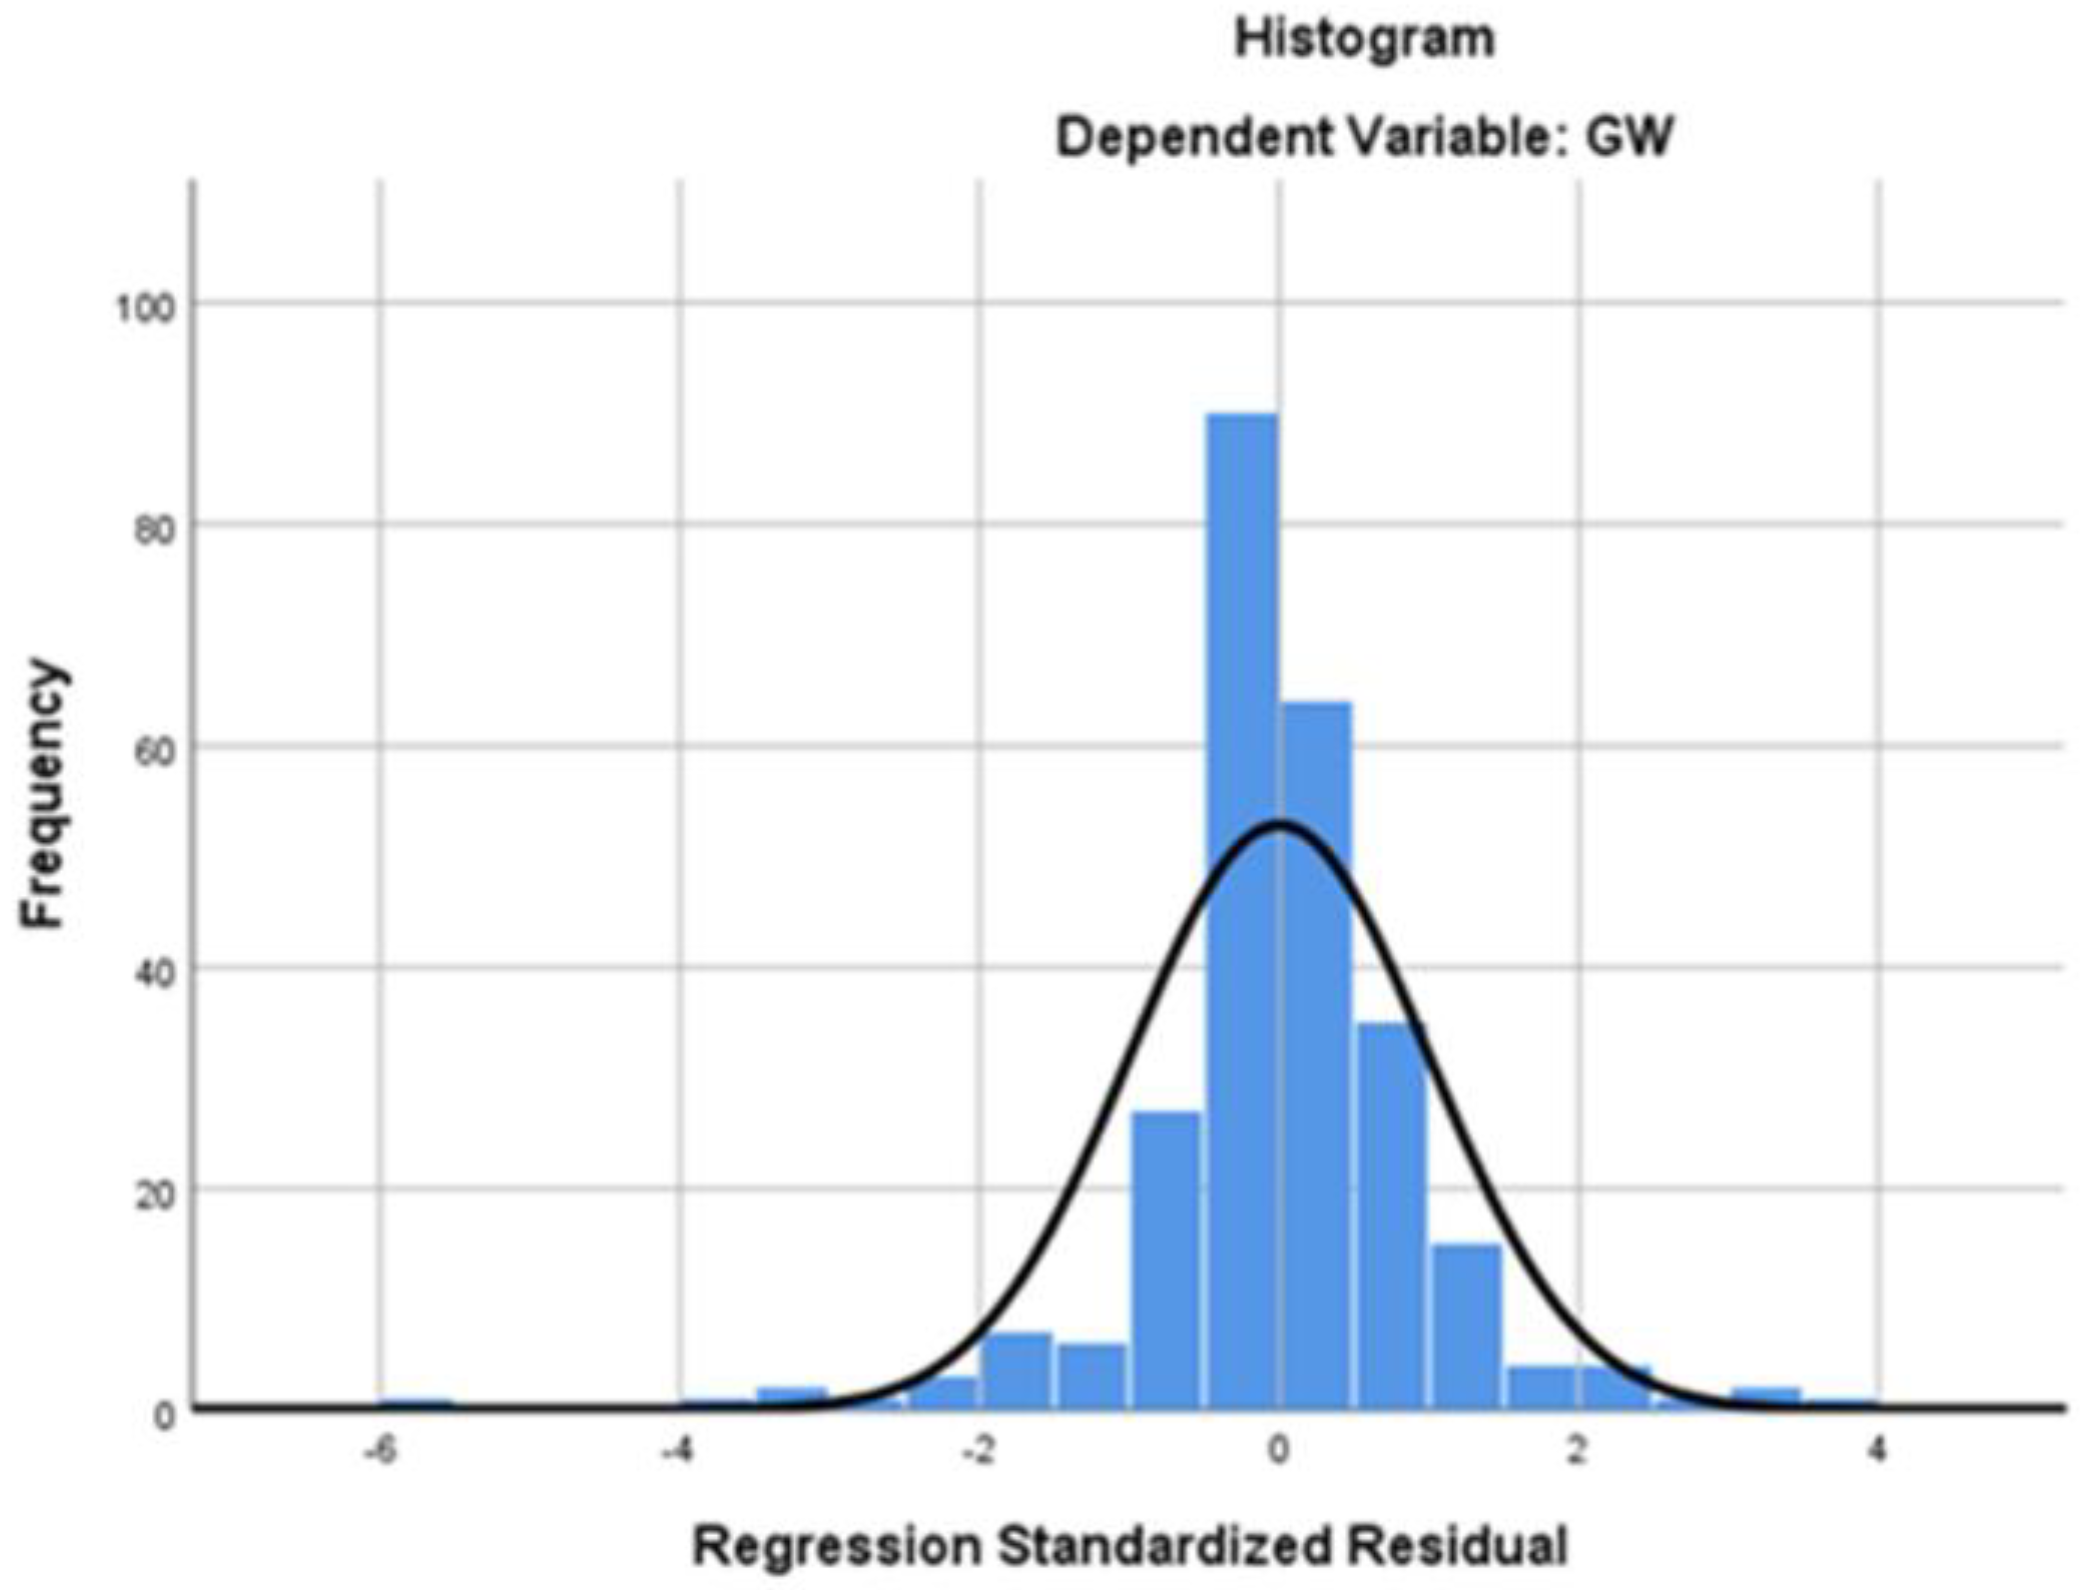
Result: Our model predicts outcomes based on specific variables. Policymakers should incentivise eco-friendly tourism using our model as a benchmark. The regression analysis further recognises that the first gross wages are firmly dependent on K1 (first common factor) and, to a lesser extent, by K2 (second common factor). Therefore, the hospitality industry’s impact on the environment is the root cause of increasing wages, not the other way around. This is probably also due to non-normalities (
Figure 1) that are dependent on inflation rates, seasonality and other pricing growth imbalances in Slovenia. Therefore, the policy and strategies should be the opposite of what have been implemented since 2000. The regression analysis can be calculated as follows:
where the
t statistics are given in parenthesis.
Second, the equation used to determine the impact of tourism uses the same procedure:
where the constant confirms the high average of the tourist arrivals depending on K1 and K2; now, this has a higher impact than K1. Hypothesis 4 is confirmed, but Slovenia is not a case study for a sustainable approach to tourism supply. On the other hand, the interconnections were found between the studied variables, and a mix of domestic and foreign tourists are shown to have a higher impact on tourism demand, with a negative CO
2 footprint.
5. Discussion
The discussion of the summary statistics sheds light on the intricate dynamics of the variables under examination. The integration order patterns align with theoretical expectations, confirming the fundamental nature of the time series variable. Simultaneously, the near-I(2) behaviour of prices underscores the complex interplay of economic factors and pricing trends within the hospitality sector. This implies that price adjustments are driven by short-term fluctuations and longer-term economic forces. The proximity to I(1) observed in the environmental variable underscores its responsiveness to shifts, which could be attributed to environmental policies and initiatives. This differentiation in integration orders highlights the multi-faceted nature of the variables, necessitating nuanced strategies for their management and prediction.
The marked impact of the COVID-19 pandemic is evident in the dataset, as indicated by instances of zero value in various variables. The unique mathematical handling of the zero tourist arrivals that occurred during April 2020 [
50] illustrates the necessity of preserving the continuity of data-processing, even in the face of extraordinary circumstances. Furthermore, the distributional characteristics of the indices, as highlighted by the kurtosis values not reaching 3, underscore the non-normality of the data. At the same time, the present study refrains from conducting the Jarque Berra test. Factor analysis emerges as the central analytical method, lending depth to examinations of these variables’ relationships [
51]. The visual representations in
Appendix A reaffirm the trends observed in the summary statistics, revealing an upward trajectory of parameters, a pronounced pandemic-induced shock, and noticeable volatility in exchange rates. Notably, the differentiation of these visualisations into four sectors corresponds to the categorisation presented in the
Table 2, creating a comprehensive framework for understanding the data dynamics.
Discussions of the factor analysis results provide intricate insights into the complex dynamics underlying the variables’ interactions, enriching our understanding of the studied phenomena. Remarkably, the environmental impact on prices within both the Slovenian and eurozone contexts exhibits a significant positive association. This phenomenon points towards a distinctive inflation-driven mechanism, which is fascinating given the prevailing high inflation rates. This correlation underscores the intricate interplay between environmental considerations and pricing strategies, suggesting a dynamic where environmental factors contribute to inflationary pressures [
52].
In light of these findings, factor analysis facilitated the identification of two primary components, with each encapsulating specific facets of the observed variables. The first component (K1) is aptly labelled the “economic environmental component” [
53], capturing the influence of economic factors intertwined with environmental considerations. The second one (K2), the “tourism environmental component” [
54], encapsulates the relationship between the tourism indicators and environmental dynamics. This categorisation further refines our comprehension of the nuanced connections between variables.
Examining the results in light of the formulated hypotheses, principal component analysis and regression analysis provide profound insights into the intricate dynamics within the hospitality industry. Hypothesis 1, which posited a positive relationship between gross wages in Slovenia and fundamental economic factors, is validated by the observed covariance of the first common factor. This outcome suggests a symbiotic link between wages and inflation, further influenced by environmental impacts. This cyclic dependency could potentially hinder the upward trajectory of wages in the highly competitive tourism market, presenting a noteworthy challenge for sustained growth.
Similarly, Hypothesis 2, exploring the influence of environmental factors on the hospitality industry, is affirmed by the covariance of the second common factor. This validation particularly points to a negative impact of environmental considerations on the industry, highlighting a pressing concern. The persistence of harmful environmental influences over time, particularly amid post-pandemic short-term booms and long-term trends, as indicated by the factor analysis and the second component, accentuates the vulnerability of the hospitality sector’s demand dynamics.
The confirmation of Hypothesis 3 underscores the significance of both domestic and foreign arrivals in shaping tourism indicators.
The regression analysis obtained using Equation (3) reveals that gross wages in the hospitality industry are notably influenced by the first common factor (K1) and, to a lesser extent, by the second common factor (K2). This reinforces Hypothesis 4, which states that wages are deeply connected to economic and environmental influences, and are specifically dependent on inflation rates and other pricing imbalances unique to the Slovenian context. These findings prompt a critical reassessment of policies and strategies, urging a paradigm shift from the approaches that have been used since 2000.
Furthermore, the confirmation of Hypothesis 4 underscores the importance of a sustainable approach to tourism supply. While Slovenia might not yet embody a fully sustainable model, the established interconnections between the variables signify a substantial step towards informed decision-making. Notably, the considerable influence of a mix of domestic and foreign tourists with a negative CO
2 footprint highlights the complex balancing act required for sustainable tourism strategies. Collectively, these insights reframe the discourse around quality in the hospitality industry. This underlines the need for holistic and environmentally conscious approaches to ensure the undustry’s longevity, SDG and resilience [
55].
6. Conclusions
In conclusion, this study delved into the intricate web of relationships within the hospitality industry, shedding light on the multi-faceted interplay of economic, environmental, and tourism factors. Significant insights emerged through a comprehensive analysis of variables and rigorous hypothesis testing. The study’s findings confirm the intricate dependence of gross wages on economic and environmental factors, warranting a reevaluation of existing wage dynamics. The substantial impact of environmental considerations on pricing strategies underscores the need for a balanced approach to pricing amidst inflationary trends. Additionally, the confirmed influence of domestic and foreign arrivals on tourism indicators emphasises the importance of an inclusive approach that can sustainably drive growth in the tourism industry.
Furthermore, the factor analysis revealed distinct components—economic, environmental and tourism environmental components—reflecting the intricate connections between these variables. These insights have substantial implications for industry practices and policies, highlighting the necessity of an environmentally conscious approach to foster growth while minimising negative impacts. As the sector navigates the evolving economic landscapes and heightened environmental concerns, these results offer a roadmap for promoting a resilient and sustainable hospitality industry. This study contributes to the broader discourse on sustainable development through its comprehensive approach, aligning with the SDGs and guiding the industry toward a more balanced and responsible future.
The tourism supply should depend more on the “green” approach than the techniques that have been implemented since 2000. If there are no changes, tourism will suffer from its environmental impact, and demand will sustainably decline. In addition, inflation will rise, and energy prices will explode, which usually comprise a high percentage of the input costs for the hospitality industry. Furthermore, wages could decline, or prices could rise to their peak. If there are no changes, will tourism as we know it end?
6.1. Managerial Implications
The study’s insights have substantial implications for industry practice and policy formulation. As the hospitality sector navigates the intricate web of economic and environmental factors, recognition of the “economic environmental component” underscores the need for strategies that align with inflationary pressures by reducing the carbon footprint. Concurrently, the “tourism environmental component” highlights the importance of shaping tourism policies that harmonise with environmental concerns to increase the demand for tourism services in the future. By distinguishing and understanding these distinct components, stakeholders in the hospitality industry can tailor their approaches to effectively address the complexities of their operational landscape. Furthermore, these findings contribute to the broader discourse on sustainability, aligning with the SDGs, and offer a blueprint for a more balanced and informed industry trajectory.
6.2. Policy Implications
The insights gleaned from this study have significant policy implications for the hospitality industry and beyond. The confirmed interdependence of gross wages on economic and environmental factors emphasises the need for targeted policies that consider financial and environmental sustainability. Policymakers should explore mechanisms that incentivise environmentally responsible practices within the industry while ensuring fair wages. The identified impact of environmental factors on pricing strategies underscores the importance of transparency and eco-consciousness in pricing decisions.
Policies promoting green initiatives and responsible pricing practices can align the industry with evolving consumer preferences and sustainability goals. Moreover, recognising the dual influence of domestic and foreign arrivals on tourism indicators emphasises the need for inclusive policies that cater to diverse tourist segments. Encouraging initiatives that promote both parties could stimulate a well-rounded and resilient tourism sector. Overall, the study’s findings advocate for a holistic policy approach that aligns economic patterns with environmental responsibility, ensuring the long-term sustainability and competitiveness of the hospitality industry in an evolving global landscape.
6.3. Delimitations of the Research
Several delimitations shape the scope of this research, warranting careful consideration when interpreting its findings. Firstly, the study exclusively focuses on the hospitality industry within Slovenia, limiting the generalizability of the results to other geographical or cultural settings. Moreover, the analysis is confined to a specific timeframe, from 2000 to 2021, which may not capture future developments.
Additionally, while efforts have been made to include a diverse range of variables, the study does not encompass all potential determinants affecting the hospitality industry; thus, some factors may have been omitted. While comprehensive, the reliance on secondary data sources may limit the depth of analysis and preclude an exploration of more nuanced aspects. Furthermore, the study’s reliance on covariances and regression analyses highlights associations but does not necessarily imply causation. Lastly, the complexity of the hospitality industry, with its multitude of stakeholders and evolving dynamics, introduces inherent limitations to the ability to fully capture its intricacies. These delimitations can help to provide a nuanced understanding of the research’s scope and underscore the need for cautious interpretation of its findings.
6.4. Limitation of the Research and Further Research Directions
The main limitation of the research is that it was conducted over 22 years. The transferability of the research results to other countries could be assisted by comparison with the cited studies from other countries that explored the field of tourism using a similar methodology. The ability to transfer the research results to other economic sectors in Slovenia is limited. On the other hand, this study provides an excellent example of GDS.
The implications of the research and suggestions for further research are set out in the methodology. Seasonal trends are rare in macroeconomics but can be found in tourism and marketing. Also, seasonal variation trends can be identified for the data that were not log-transformed. The tasks and evaluation presented in this empirical research suggest how econometric models can be usefully applied in empirical research in the hospitality industry. Also, the study presents the economic aspects of wage dynamics in the hospitality industry.
For further research, we would mainly suggest using the periodic time series model. the cointegration vector autoregression model (CVAR), and impulse cointegration and (M)ARCH models. The structural model with deviation correction (SVECM) could also be used with impulse cointegration. We could also compare wages in one country with similar shocks using these approaches. Seasonal fluctuations in variables could also be emphasised more with periodic time series.
6.5. What Comes after Tourism?
Sustainable tourism is probably not the primary goal of policymakers and managers. There is no doubt that tourism will change dramatically by 2030. But what will these changes be and how will they be implemented? Our findings propose new ideas the future research, along with some further thoughts and methods.
6.5.1. Partial Tourism Collapse
While the complete collapse of the tourism industry is unlikely, significant disruptions could arise due to global crises like pandemics, natural disasters, and economic recessions, as demonstrated by COVID-19. Environmental concerns, changing preferences, technological advances, economic shifts, over-tourism, and geopolitical factors contribute to the industry’s vulnerability. These multi-faceted challenges necessitate adaptive strategies and sustainable practices to ensure the tourism sector’s resilience, and could be exciting variables in further research on time series, providing insightful information.
6.5.2. Total Change of Tourism
Potential alternatives could emerge if traditional tourism were to decline due to various factors, e.g., environmental issues. Virtual tourism, achieved through advanced tech, localised exploration, educational travel, sustainable retreats, cultural preservation, uncharted territory adventures, space tourism, novel entertainment experiences, and cross-cultural exchange programs, is possible [
56]. These alternatives would likely coexist, addressing the evolving desire for exploration and connection in a transformed tourism landscape.
6.6. Generalised Findings
According to the EU Green Deal and SDG Key Action 12, the primary results indicate that a solution must be found in an EU country, Slovenia, if the achieve goals are to be achieved. Therefore, the present study aimed to determine factors that could be identified and further researched to achieve this goal inside three sectors.
We identified three main sectors and sciences that have been the subject of research, but did not show any significant impacts on each other: the tourism and hospitality industries, environment and economy sciences. We can conclude that two main factors indicate that K1 is the “economic environmental component” and K2 is the “tourism environmental component”. It is evident that the economy (prices and inflation) impacts the environment, and sustainable tourism growth (tourist arrivals) could have a balsam effect; tourists are likely seeking non-degraded destinations, such as Slovenia. Overall, the wage dynamics are positively associated with environmental degradation.


