1. Introduction
The climate is critical to the world. For millennia, climate change was low-impact and occurred gradually. The human impact on climate change was small because early humans thrived sustainably with abundant plants and animals. Wood was the major source of energy for cooking food and warming homes. Wood sequestrates carbon during its growth through photosynthesis, and the same amount of carbon was released into the atmosphere when burning wood [
1]. In the 19th century, the human population increased explosively due to advancements in medicine and technology. Fossil fuels, made from decomposing plants and animals underneath Earth’s crust and containing carbon, became the prime source of energy. The burning of fossil fuels emits carbon dioxide (CO
2) into the atmosphere [
2]. Driven by industrialisation, population growth, and a higher standard of living, fossil fuel utilisation has been constantly growing. Nowadays, fossil fuels account for 86% of the primary global energy demand [
3].
Greenhouse gases (GHGs) consist of mainly of water vapor (H
2O) with negligible anthropogenetic emission, which has trapped heat and provided a favorable average temperature for planet Earth for thousands of years. However, GHGs also contain CO
2, methane, nitrous oxide, ozone, CFCs, and HCFCs, which come from anthropogenic emissions and have caused the climate change in the past 250–300 years. CO
2 is the primary driver of global warming [
4]. In 2007, the Intergovernmental Panel Climate Change (IPCC) warned that climate change due to human activities was happening and could lead to serious consequences [
2]. Nowadays, most scientists agree that global warming is real and is causing disastrous impacts on the Earth [
4]. Increasing temperatures, widespread melting of snow and ice, and rising sea levels are observed around the world. Extreme natural disasters are happening more frequently and severely. Growing health risks, food shortages, poverty, and displacement are spreading across the world [
5].
In 2018, direct and indirect emissions from the building sector contributed 17.1% of the global GHG emissions; of this percentage, residential buildings emitted almost double the amount of GHGs into the atmosphere as non-residential buildings [
6]. Canada is the top per capita emitter among the top emitting countries and regions, although its total emissions were ranked 10th. If business continues as usual, Canada will emit 798 MtCO
2eq GHGs by 2050 [
7]. Canada has committed to reducing its emissions by 40–45% of its 2005 levels by 2030 and reach net zero emissions by 2050. In 2020, Canada emitted 672 MtCO
2eq GHGs. The building sector contributed 13% of the total emissions, ranked the third largest source of emissions [
8].
Lancet has predicted that the Canadian population will grow steadily in the long term, from 35.98 million in 2017 to a peak 45.17 million in 2078 [
9]. Statistics Canada has forecasted a similar trend in the Canadian population growth, based on the medium-growth scenario, from 38.2 million in 2021 to 56.5 million in 2068 [
10]. Along with population growth, the Canadian residential floor space has increased from 1499 million square meters in 2000 to 2158 million square meters in 2018, which is a 2% compound annual growth rate (CAGR) [
11]. Furthermore, in 2019, the Canadian residential floor area was about three times the size of the commercial and institutional floor space, and the energy consumed by Canadian households was about 1.4 times that consumed by commercial and institutional buildings [
12,
13]. Therefore, carbon reduction in the residential building sector is critical to achieve net zero emission by 2050.
The whole-life carbon (WLC) of buildings refers to the carbon emissions across a building’s lifetime. It commonly includes operational carbon and embodied carbon. Operational carbon is attributed to operational energy consumption during a building’s lifetime, such as energy used for lighting, power, heating, cooling, ventilation, and water services. Embodied carbon is related to building material production, building construction, material replacement, and end-of-life disposal [
14]. Operational and embodied carbon are different but inter-related [
15]. Embodied carbon is a significant part of the whole-life carbon emissions of buildings. While the efficiency of building operation keeps improving, embodied carbon will become the only source of carbon emissions in zero-energy buildings [
16].
A building envelope is a system of materials, components, and assemblies that physically separate the exterior and interior environment. It is crucial to determine and maintain the indoor conditions regardless of the changes in the outdoor environment. Components of building envelopes include the walls, fenestration, roof, foundation, thermal insulation, thermal mass, and external shading devices [
17]. In Canada, more efficient building envelopes and heating equipment have resulted in a 12% decrease in GHG emission between 2005 and 2013 in the building environment, despite a 17% increase in the floor space [
18]. Thermal insulation plays an important role in improving the energy efficiency of buildings [
19]. It not only provides resistance to heat flow and lowers the energy required for heating and cooling through the building envelope, but it also improves comfort. It is one of the most valuable tools in achieving energy conservation in buildings [
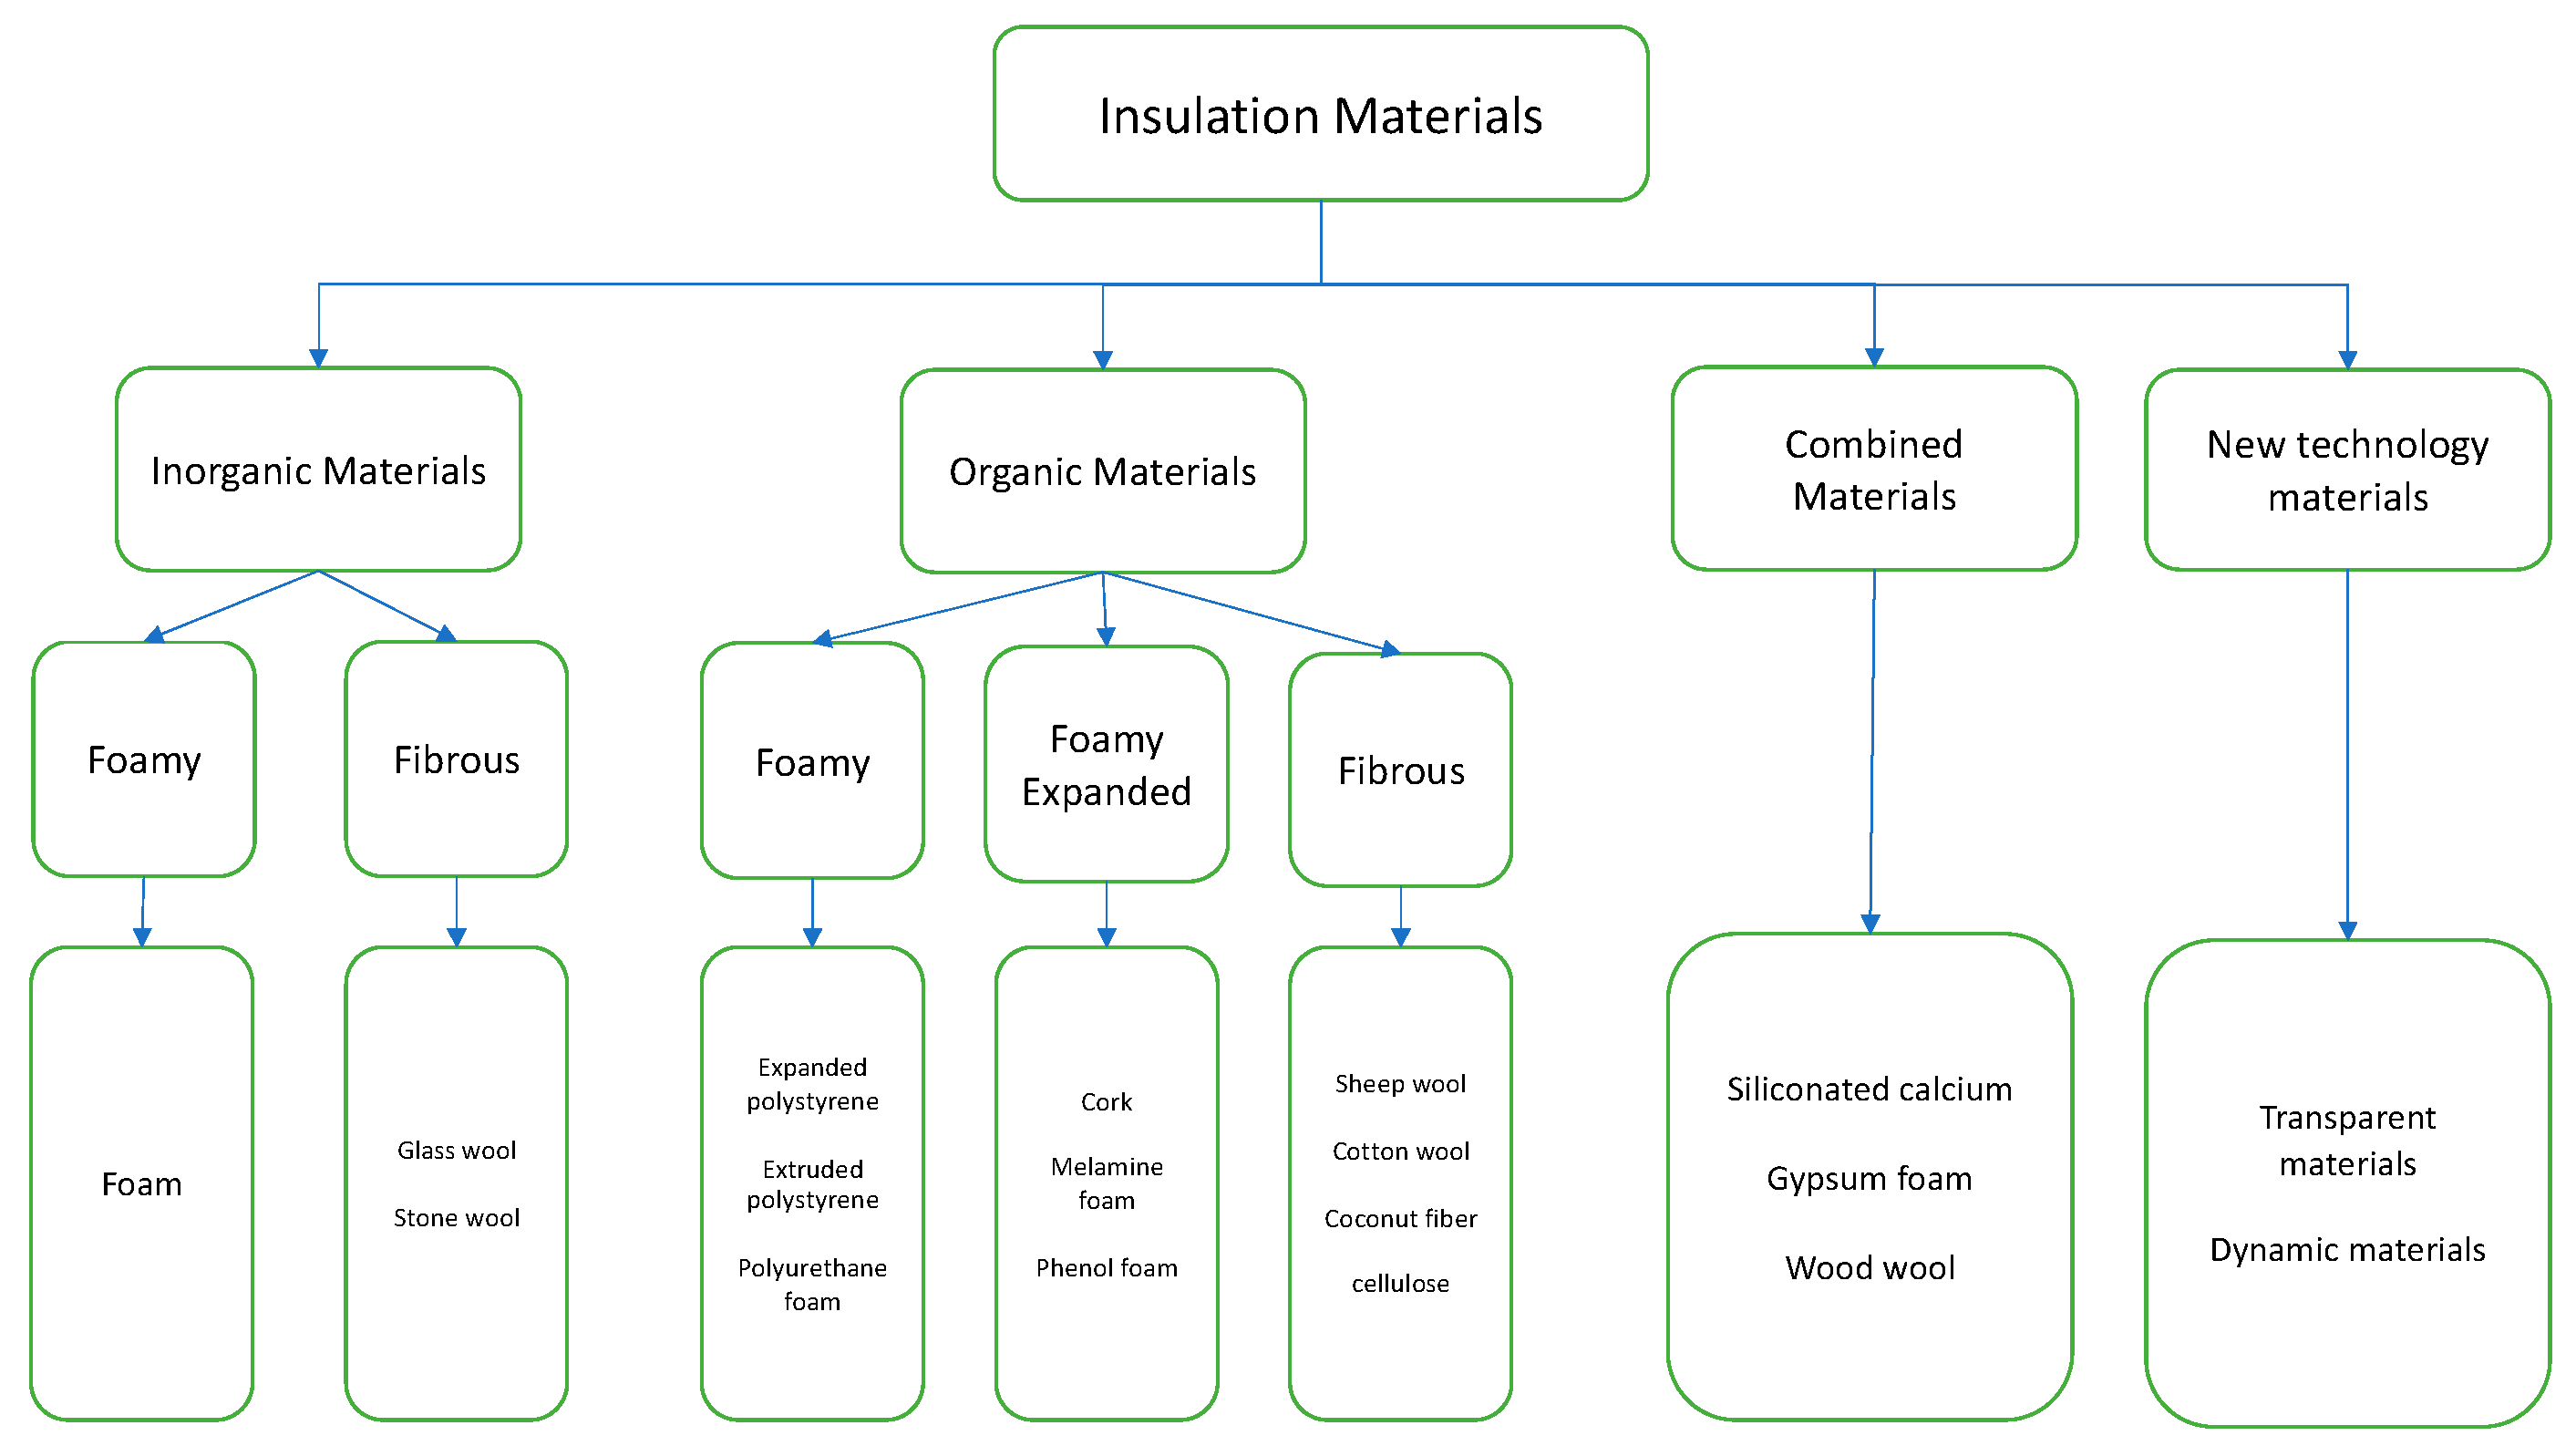
20]. Thermal insulation based on its composition can be divided into four categories: inorganic mineral, organic fossil fuel, combined materials deriving from animal and plants, and new-technology materials. The mainstream insulations under each categories are shown in
Figure 1 [
21].
Globally, the most used insulation materials are made of mineral wool (MW), including, glass wool, stone wool, and fibreglass, and of plastic foams (PFs) such as expanded polystyrene (EPS), extruded polystyrene (XPS), and polyurethane (PUR). In 2015, MW dominated the market with just over 50% of the market share, and PFs accounted for 41% of the market share. The share of PFs will continuously grow because the demand for PFs is growing faster than for the other insulation materials [
22]. MW is derived from inorganic minerals and PFs are derived from organic fossil fuels. Both feature a high level of embodied carbon due to an intensive material production process and impactful raw material extraction [
23]. Furthermore, their carbon emissions are much higher than those of organic plant/animal or innovative insulation materials. Natural insulation materials are competitive alternatives because they contain a high percentage of renewable embodied carbon and they can store carbon. Hemp has the advantages of both low embodied carbon and low GHG emissions [
21].
Hemp is acknowledged worldwide as one of the most used vegetal materials in building and construction in forms of fibres and hurds. HIMs have comparable thermal properties and behavior to MIMs, and they have better environmental performance [
24]. However, the application of hemp for building and construction in Canada is still in its infancy. Although Canada is currently the largest hemp producer in the world, the focus is on hemp oilseed. The recent publications regarding hemp in Canada are largely focused on the impact of legalising marijuana and the popularisation of hemp health products and cannabidiol (CBD) [
25]. There is a lack of studies regarding the potential of using hemp as a sustainable alternative to reduce the GHG emissions of Canadian buildings on a holistic scale.
This paper attempts to examine the extent to which HIMs can replace MIMs in Canadian residential buildings. The potential carbon mitigation from 2025 to 2050 at different levels through HIM substitution is measured and compared to the business-as-usual scenarios. The suitability of HIMs for Canadian private dwellings and the feasibility of implementing HIM substitution is discussed. The purpose of the work is to show the holistic impact that hemp could achieve in reducing emissions from the building sector. It will support further research, such as investigation of an integrated hemp supply chain to bring hemp from the farm to a completely hemp-insulated home and re-evaluate the potential of HIM substitution by using the dynamic life cycle assessment method.
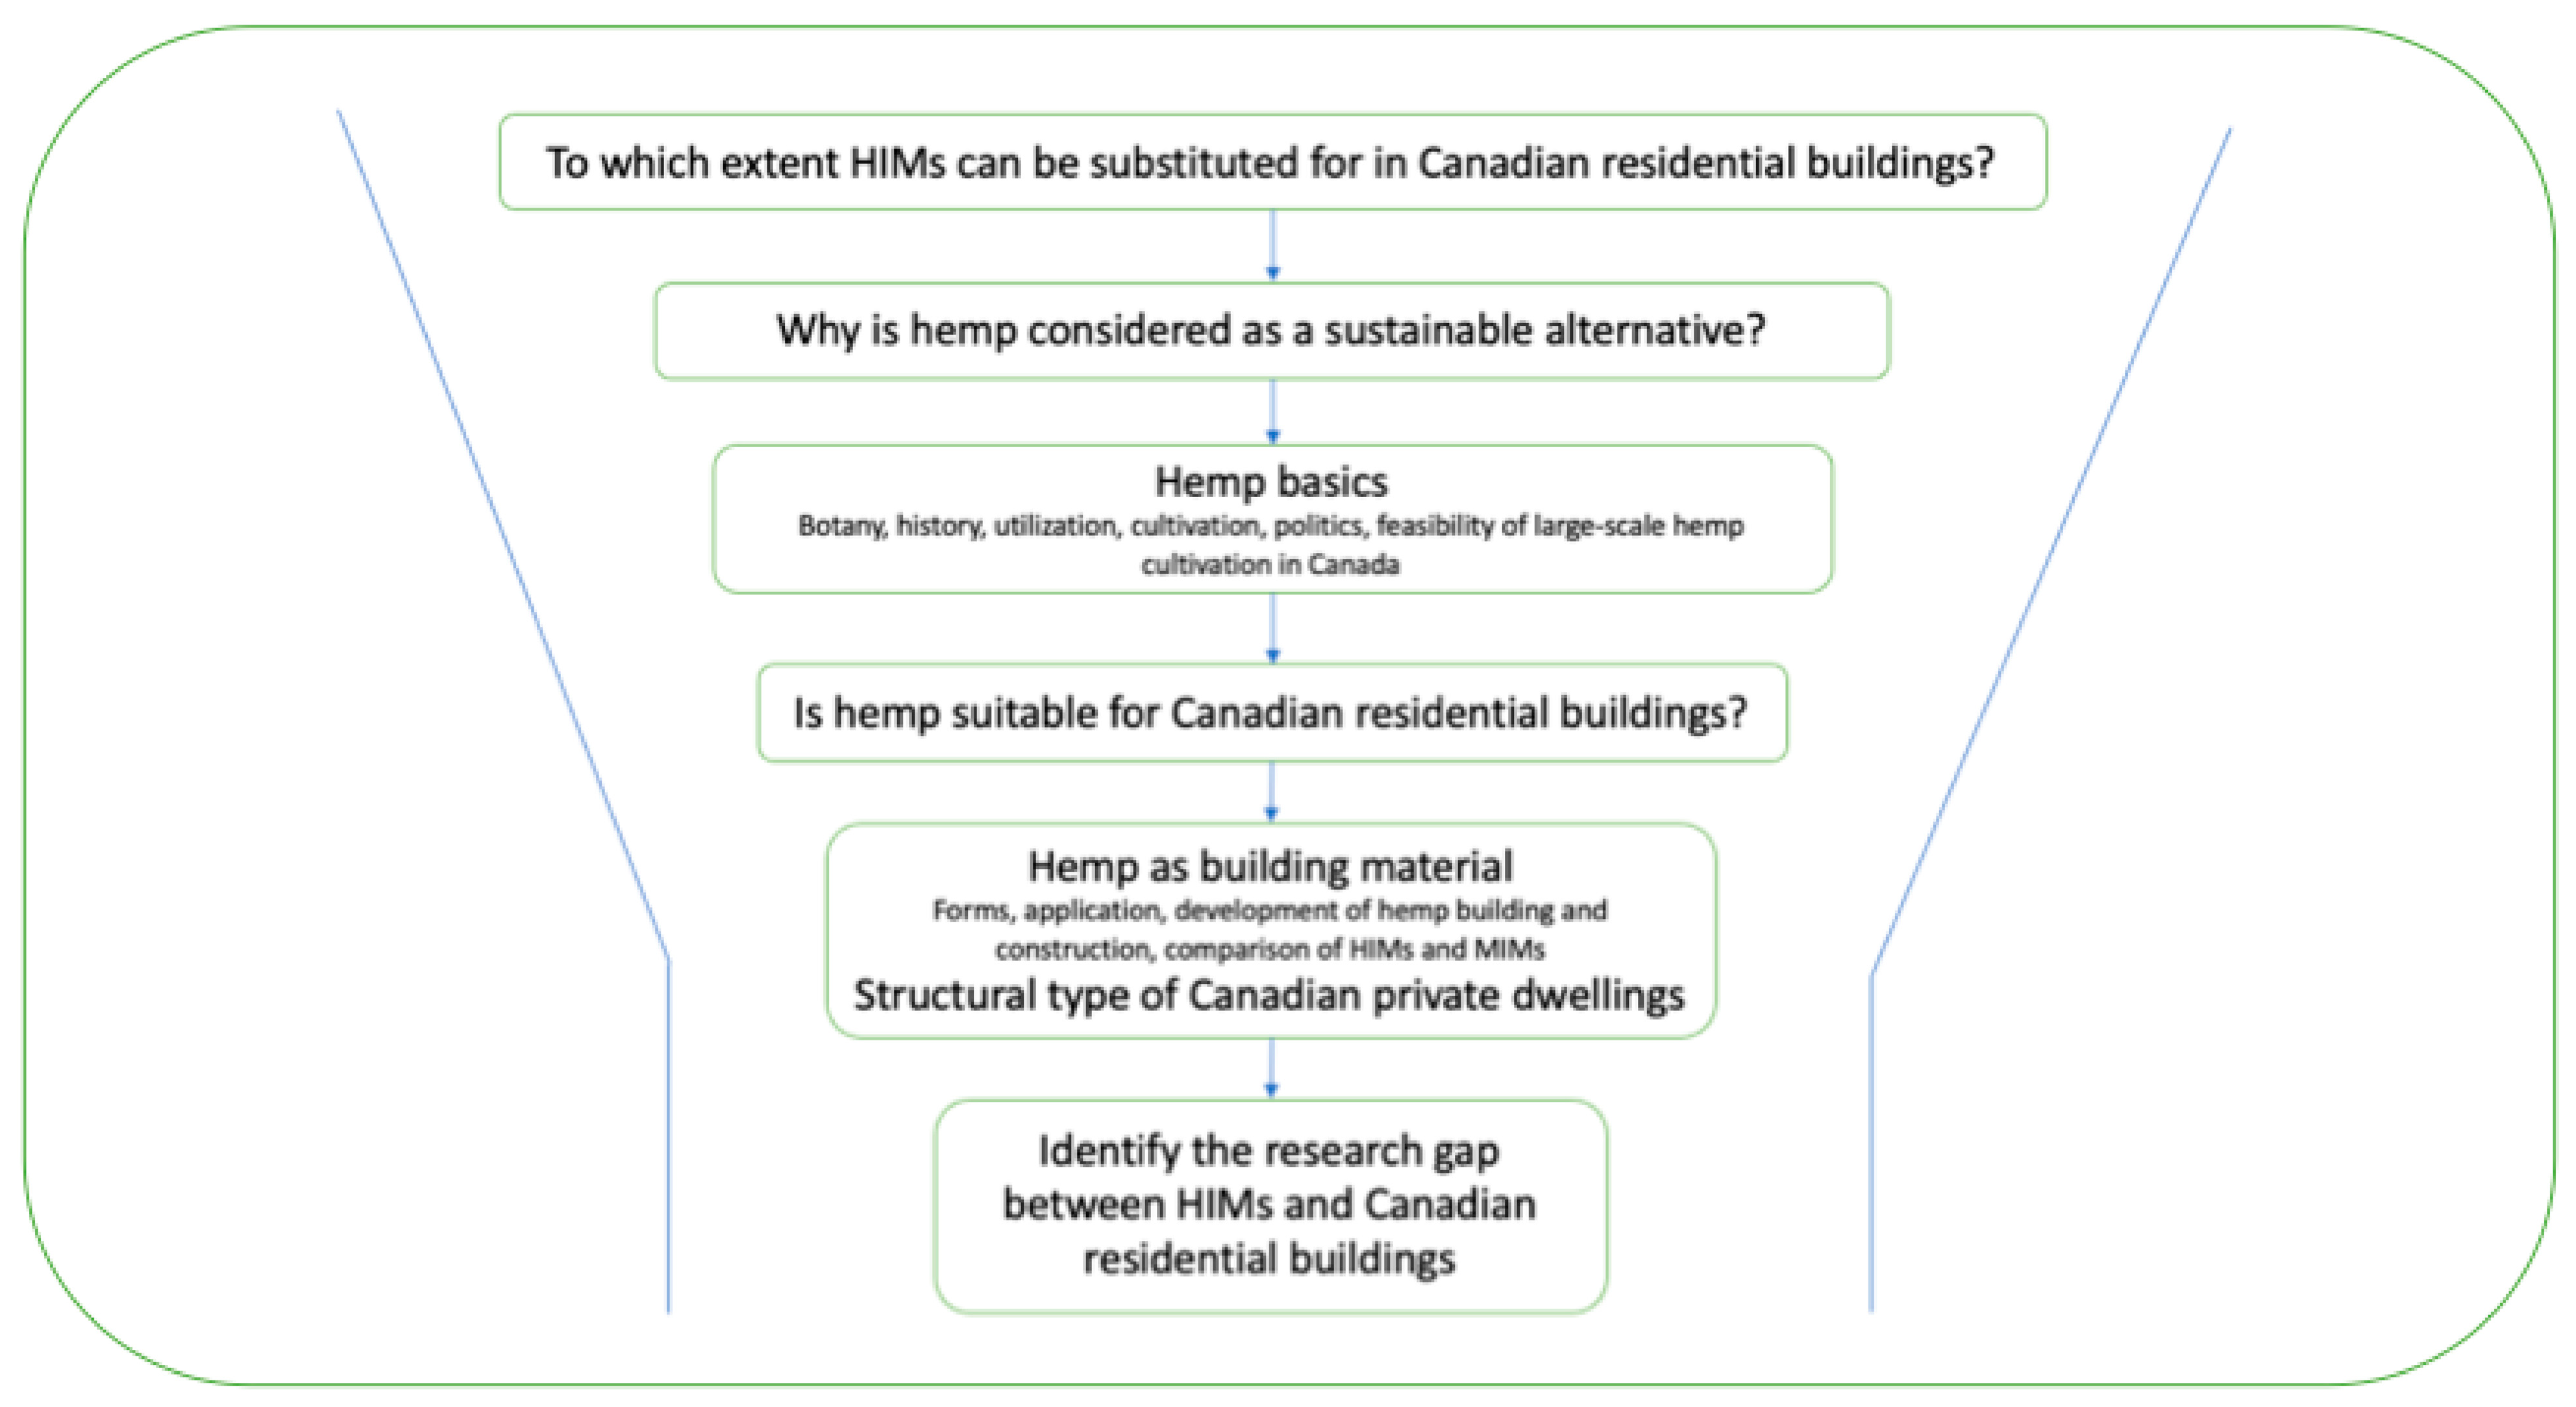
The literature review is focused on the following research aims. First, the basic information of hemp, such as its botany, history, utilisation, cultivation, and politics, and the feasibility of large-scale hemp cultivation in Canada, is reviewed to identify why hemp is considered a sustainable option. Then, the scope is narrowed down to the use of hemp as a building material. The forms of hemp building materials, their applications, the development of hemp in building and construction, the comparison of mechanical properties, the environmental impact of HIMs and MIMs, and the structural types of Canadian private dwellings are reviewed to evaluate the suitability of HIMs for Canadian residential buildings. Then, the research gap between HIMs and Canadian residential buildings is identified. The literature review funnel chart is shown in
Figure 2.
2. Material Substitution
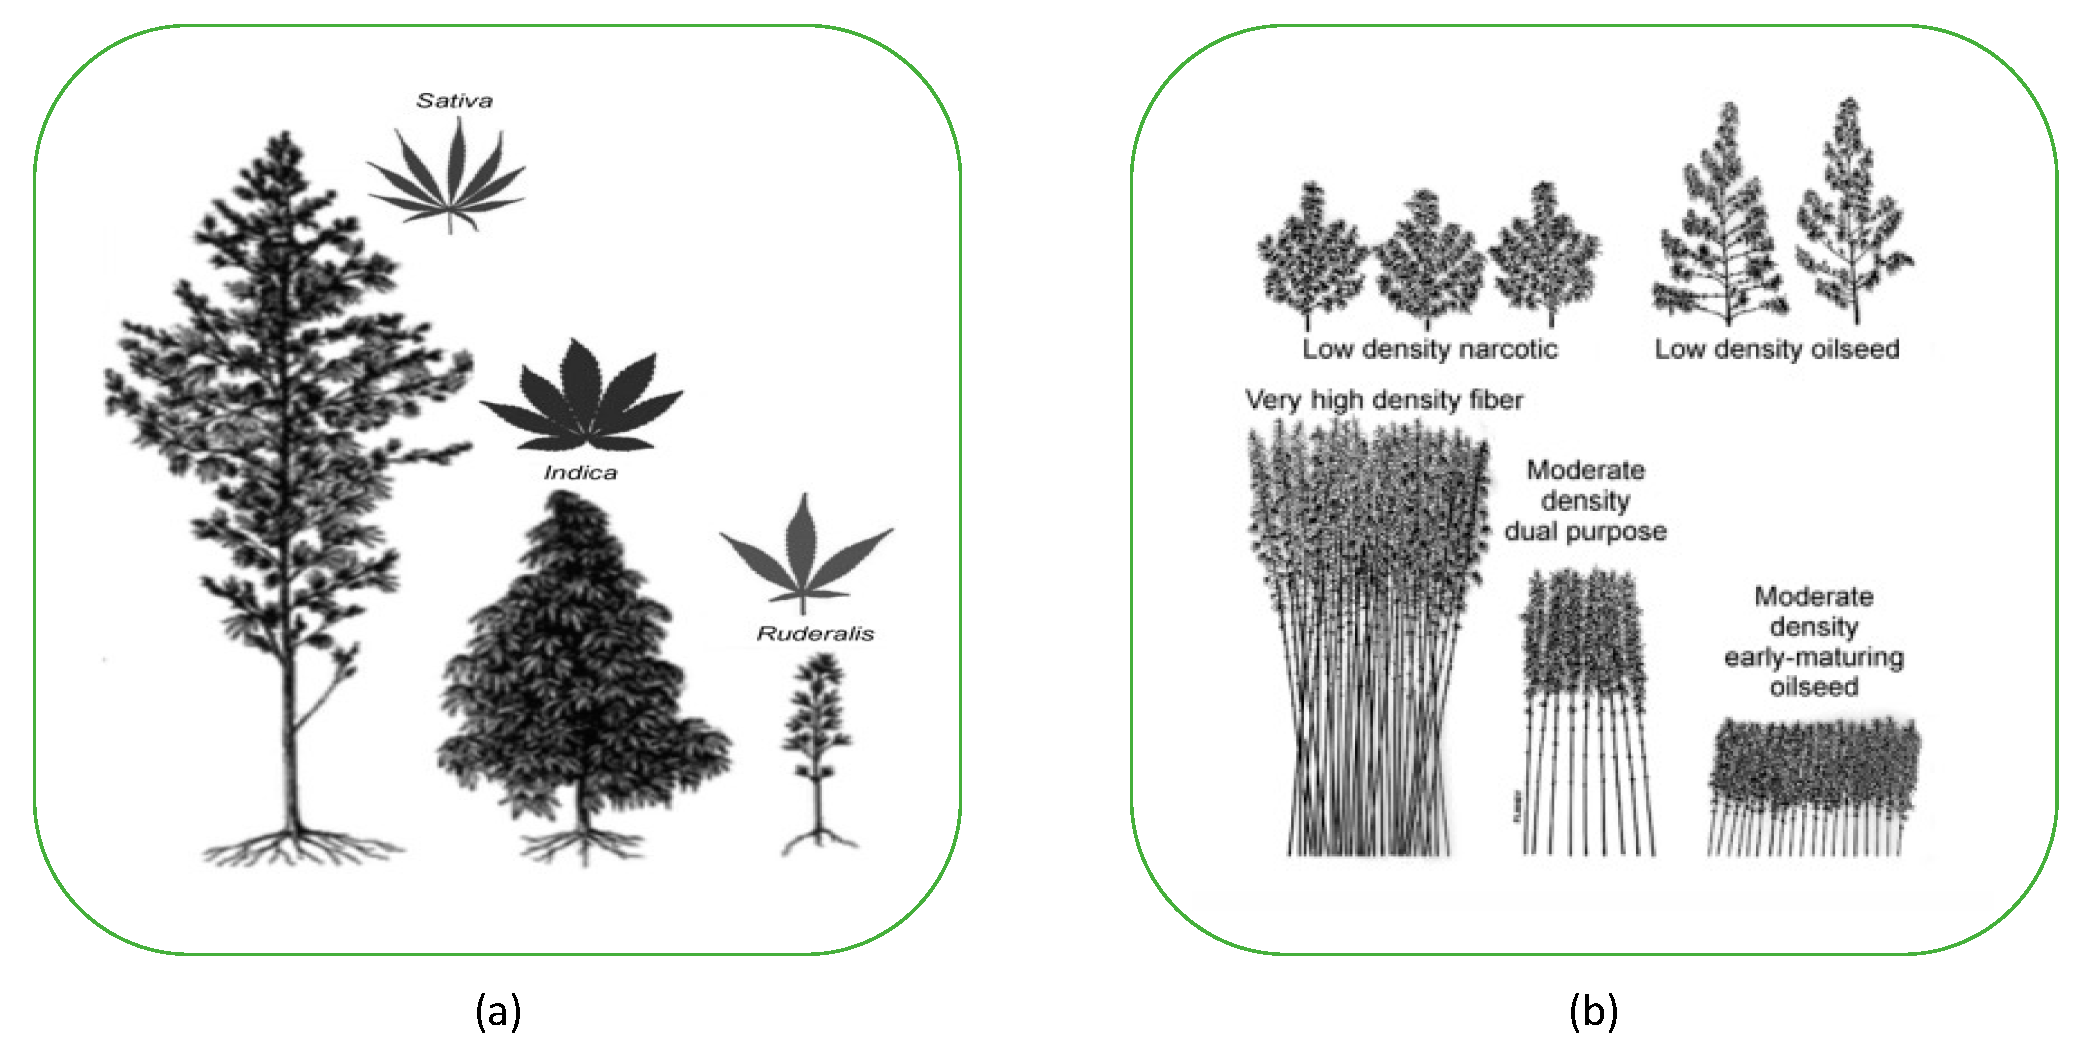
Hemp, or industrial hemp (
C. sativa L.), is an annual C3 herbaceous plant in the Cannabis genus, a species of the Cannabaceae family [
24]. The Cannabis genus includes three subspecies as shown in
Figure 3a:
C. sativa L., hemp;
C. ruderalis, a wild form; and
C. indica L., which features a high content of tetrahydro-cannabinol (THC), the principal cannabinoid content of hemp [
26]. Cannabis is classified as hemp (the source of grain and fibre) if its THC content is below 0.3% and as marijuana (the source of medical and recreational use) if its THC content is above 0.3%; this level can cause hallucinations. Hemp and marijuana have a high level of genetic variability and heterozygosity, which is rare in other plants [
27]. However, they are different [
28]. Depending on its purpose, hemp has different varieties as shown in
Figure 3b: low-density narcotic, low-density oilseed, very-high-density fibre, moderate-density dual purpose, and moderate-density early-maturing oilseed [
28].
Hemp is considered one of the most ancient crops. It originated in central Asia about 10,000 years ago. A continuous record of hemp cultivation dating from 6000 years ago to the present can be found in China [
30]. Hemp migrated to Europe between 1000 and 2000 BC, to South America in 1545, and to North America in 1606. Hemp was the leading cordage fibre in North America from 1840 to 1938, when hemp cultivation was prohibited. This is because hemp was a controversial plant due to the loosely interchangeable use of its common names, i.e., hemp and marijuana. The same reason has caused hemp to be banned in other places around the world over the last century [
28]. Encouraged by the success of hemp legalisation in Western Europe, Canada, and the U.S. legalised hemp cultivation in 1994 and 2018, respectively. Hemp became a modern commodity crop in North America [
31].
Hemp is one of the fastest-growing plants, typically planted in May and harvested in August. It can grow up to 1.5–4 m, depending on variety, in about 4 months. Grown hemp needs very little or no pesticides, herbicides, or fungicides. Its strong taproots can penetrate the soil up to 2–3 m, ventilating the soil while building soil aggregates and preventing erosion. It is an excellent rotation crop for winter wheat and soybean. Increases in the yield of wheat and soybean cultivated after hemp have been observed [
32]. Hemp also has significant environmental benefits. It can remediate contaminated soils through phytoremediation, convert atmospheric CO
2 to biomass through bio-sequestration, and use hemp biomass for bioenergy production [
33].
Hemp is widely adapted to different environments, from the equator to about 60° N latitude in the northern hemisphere, and most of the southern hemisphere [
24]. The ideal temperature for growing hemp is 14 °C, and 5.6–27.5 °C is tolerable. Hemp requires 500–700 mm of available moisture for optimum yield. However, modern techniques can produce 15 t of hemp dry matter with only 250–400 mm water. Hemp, like corn and wheat, prefers loamy soil containing rich organic matter. Hemp is sensitive to photoperiods and not very tolerable to frost [
34]. In general, Canada has an ideal geographic location, temperature, precipitation, and soil to develop hemp cultivation [
35]; hemp has been cultivated in Canada from its eastern to its western regions [
36].
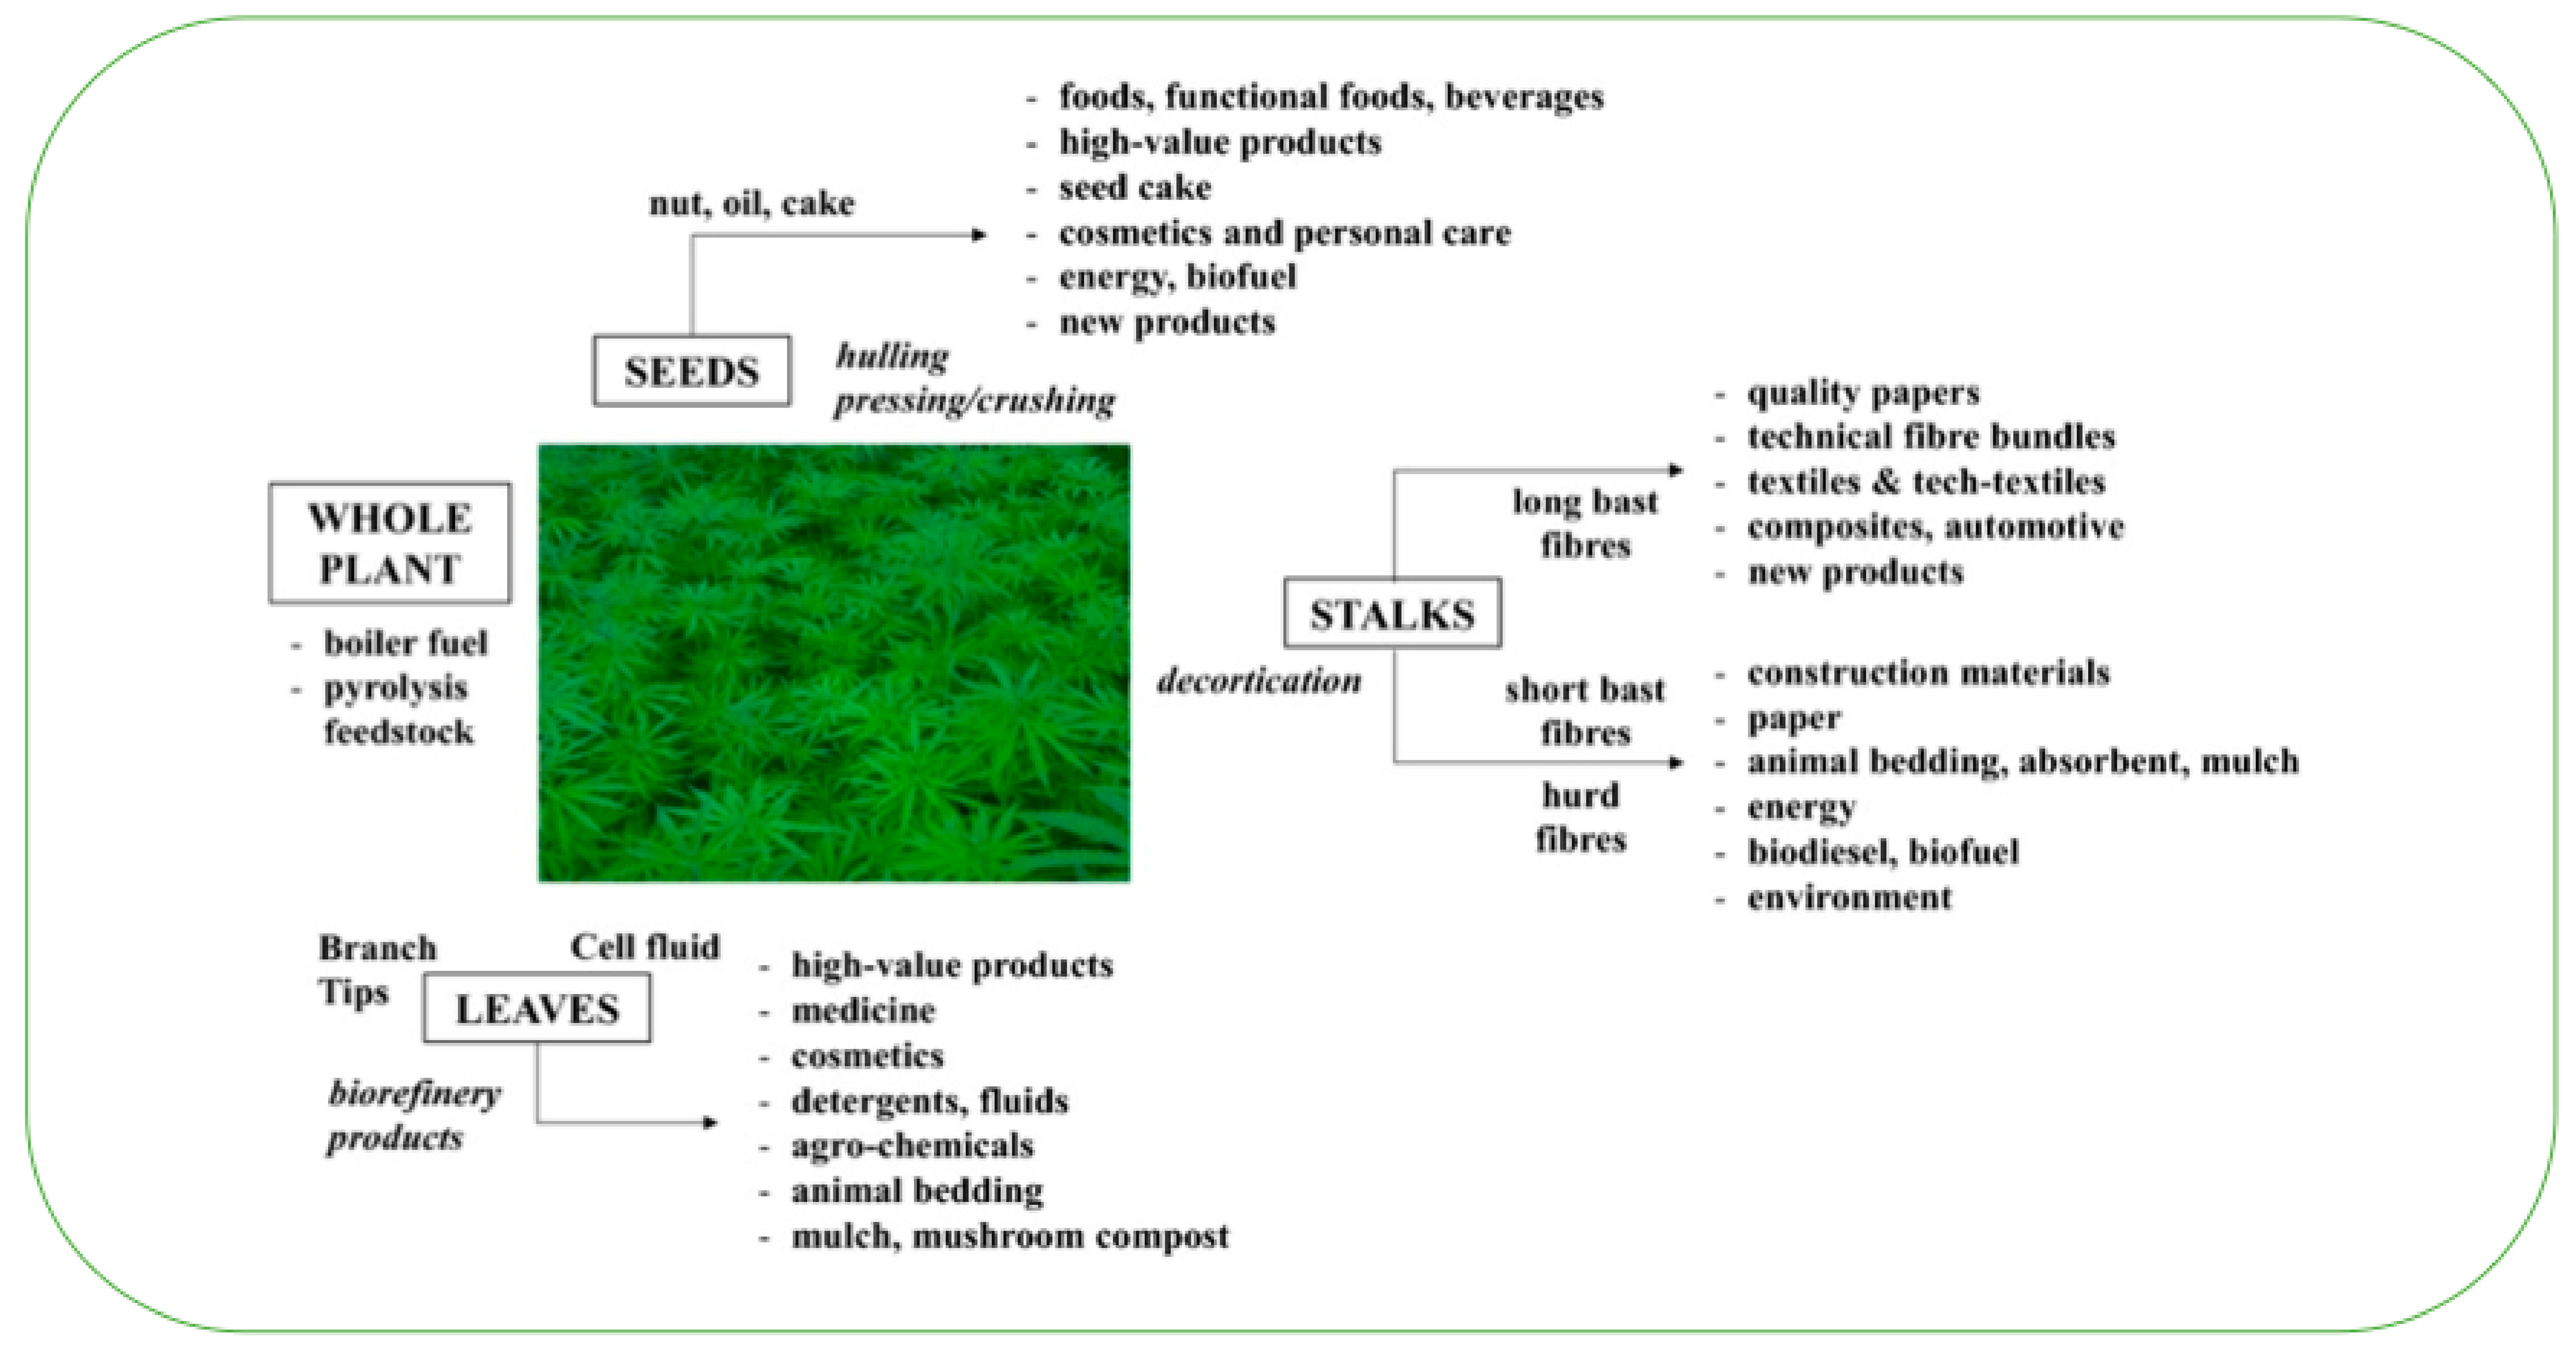
Hemp is primarily an important fibre plant [
30]. As one of the strongest and stiffest natural fibres, hemp fibre is very suitable for textiles, paper, composite products, automotive and construction materials, and many new environmentally friendly products [
37]. Hemp seeds can be used for food, cosmetics, energy, etc.; hemp hurds, the waste by-products, can also be used for animal bedding and construction. As a versatile crop, hemp has been the source of more than 25,000 hemp products for centuries. Many fossil-fuel-based materials and applications can be replaced by hemp-based materials. The modern use of hemp is listed in
Figure 4 [
38].
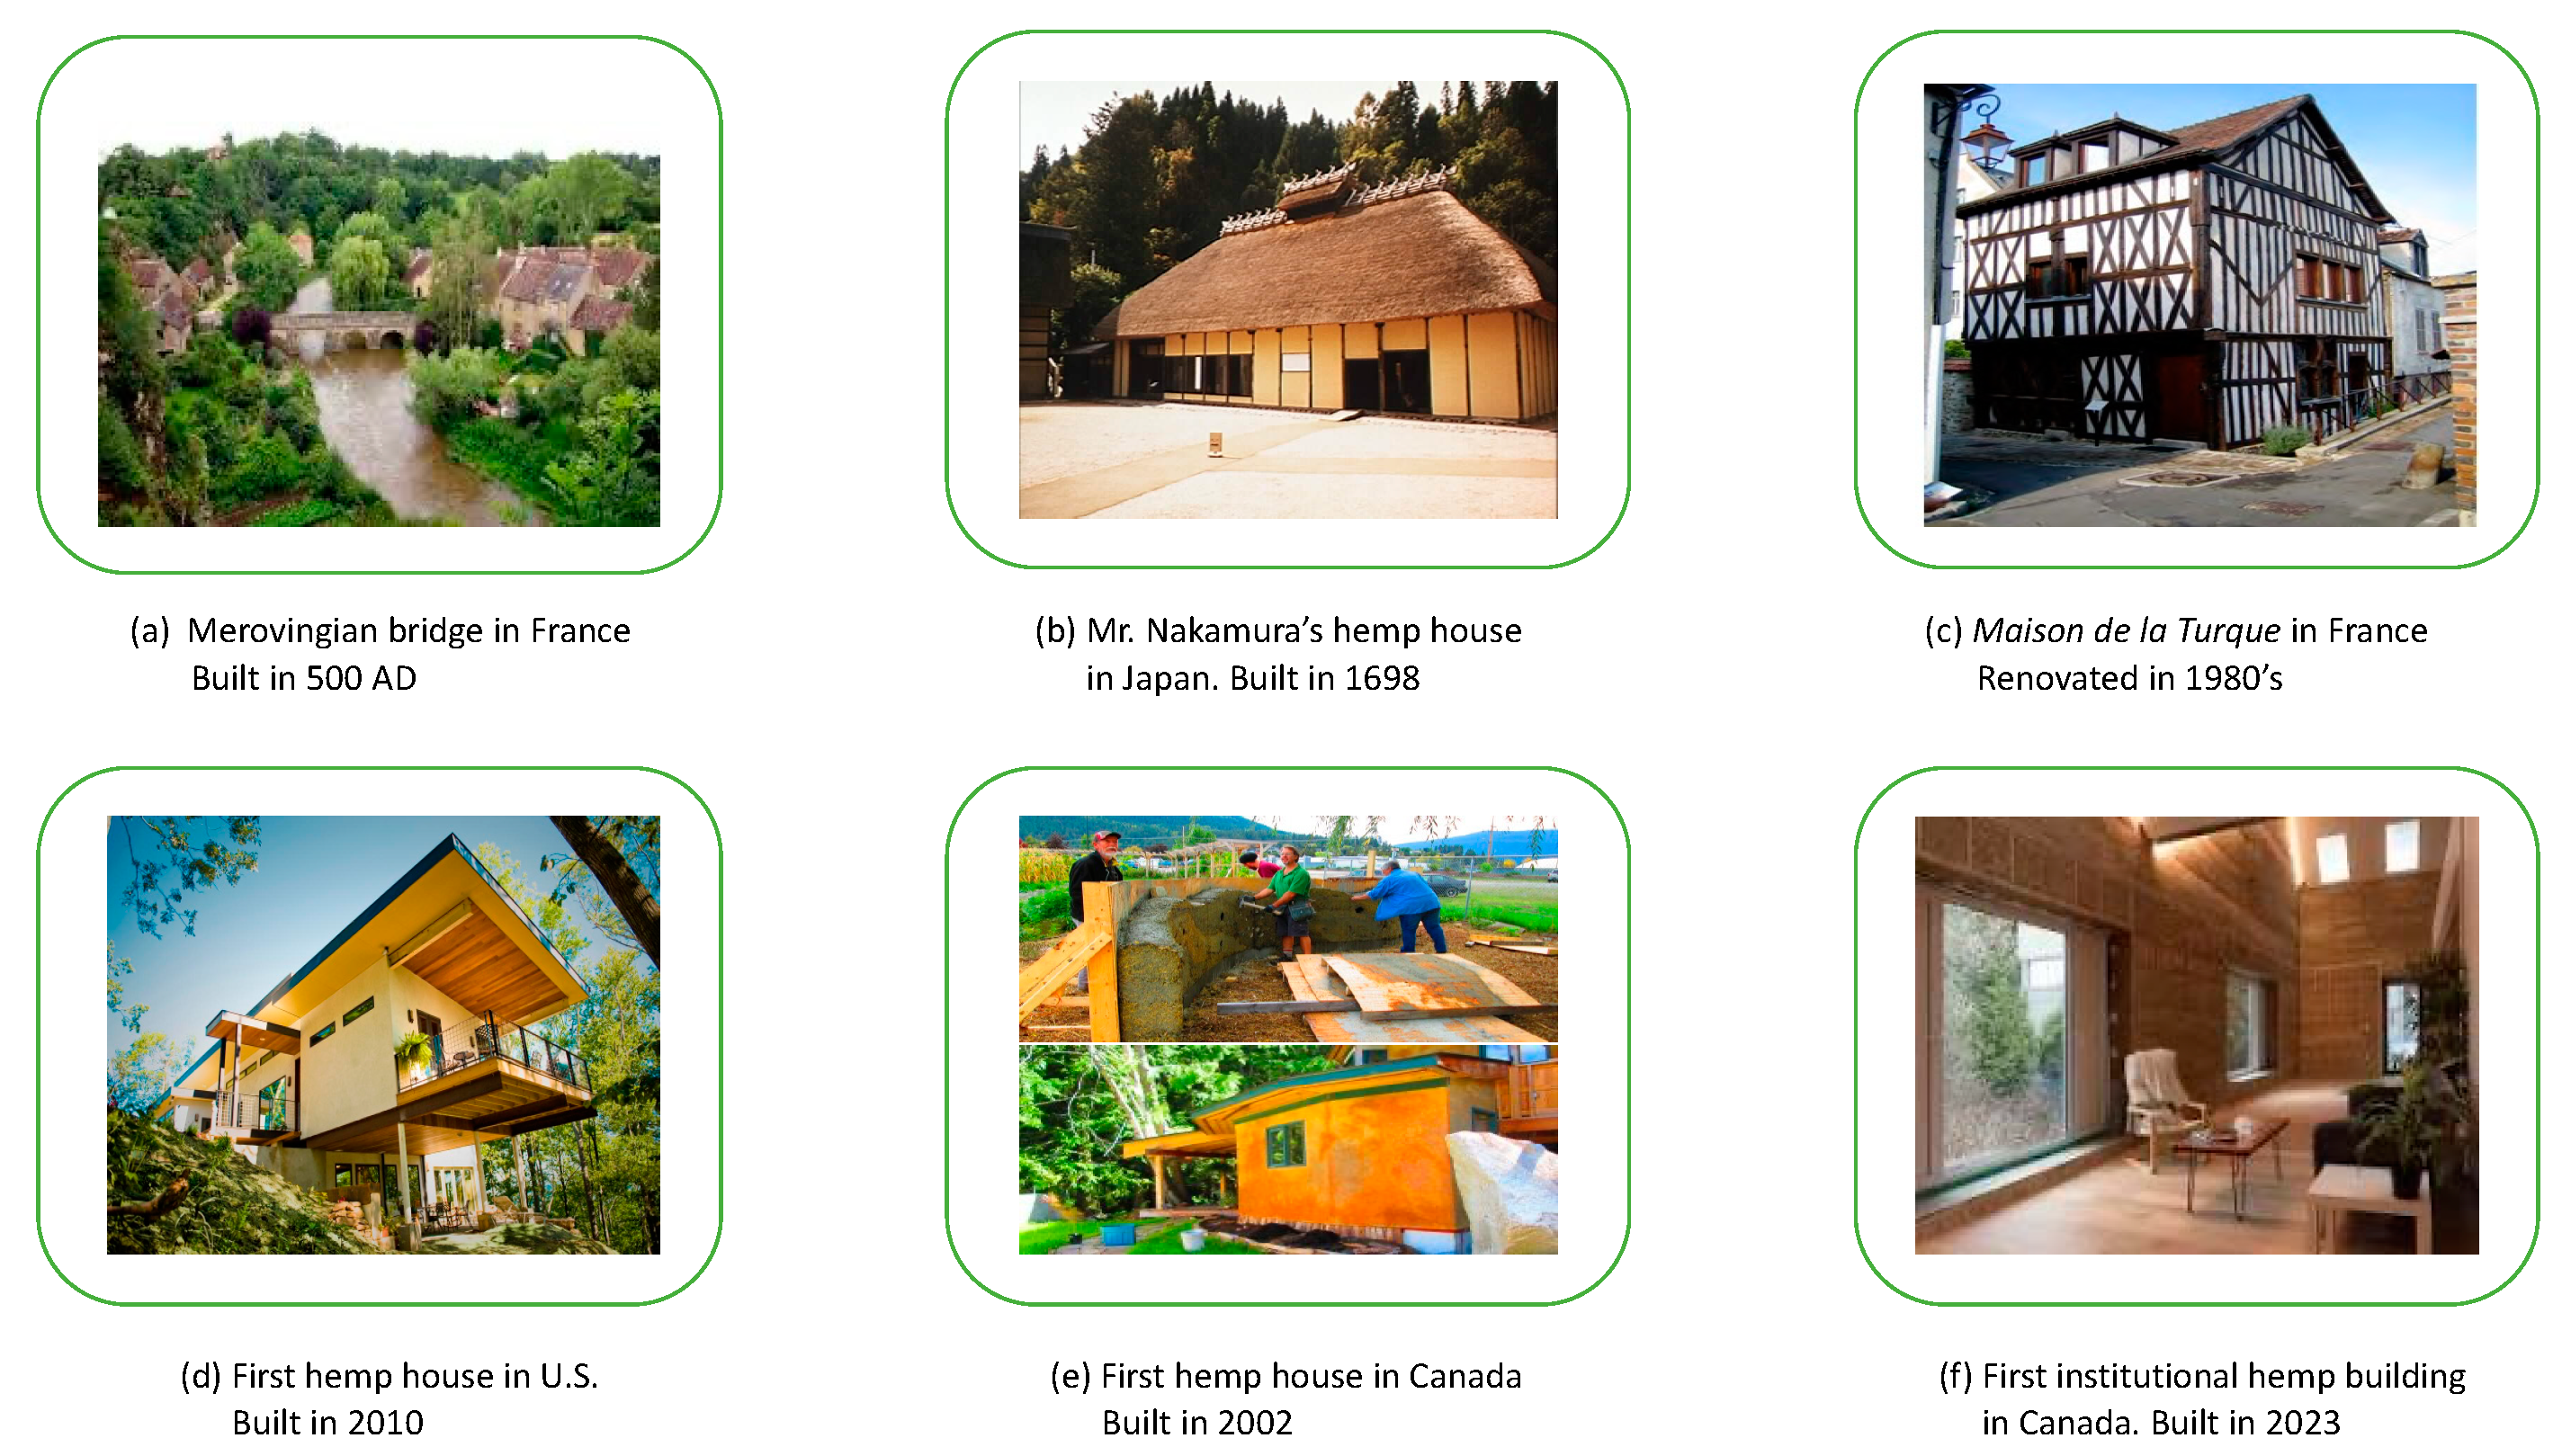
The application of hemp in construction and building can be traced back to 500 AD, when an ancient stone bridge was built with mortar made of hemp (more than 10% hemp) by Merovingians in France. Thanks to the permeability of hemp mortar, the bridge has been in place for centuries [
39]. Mr. Nakamura’s hemp house, built in 1698 in Miasa Mura, Japan, is a hemp museum today [
40]. The modern use of hempcrete as an alternative to replace wattle and daub infills of timber stud walls started in the 1980s in France. It was used for first time in the renovation of the Maison de la Turquie by Charles Rasetti. Since the advancement of hempcrete building technologies and the availability of hempcrete, thousands of hemp buildings have been built in Europe for residential, commercial, and public use [
41]. However, hemp building is still in its infancy in North America. The first hemp house in the U.S. was built in 2010 [
42]; the first hemp house in Canada was built in 2002 [
43]; and the first institutional hemp building was just finished in the UBC Vancouver campus, Canada [
44]. The examples of hemp building and construction around the world in different periods are shown in
Figure 5.
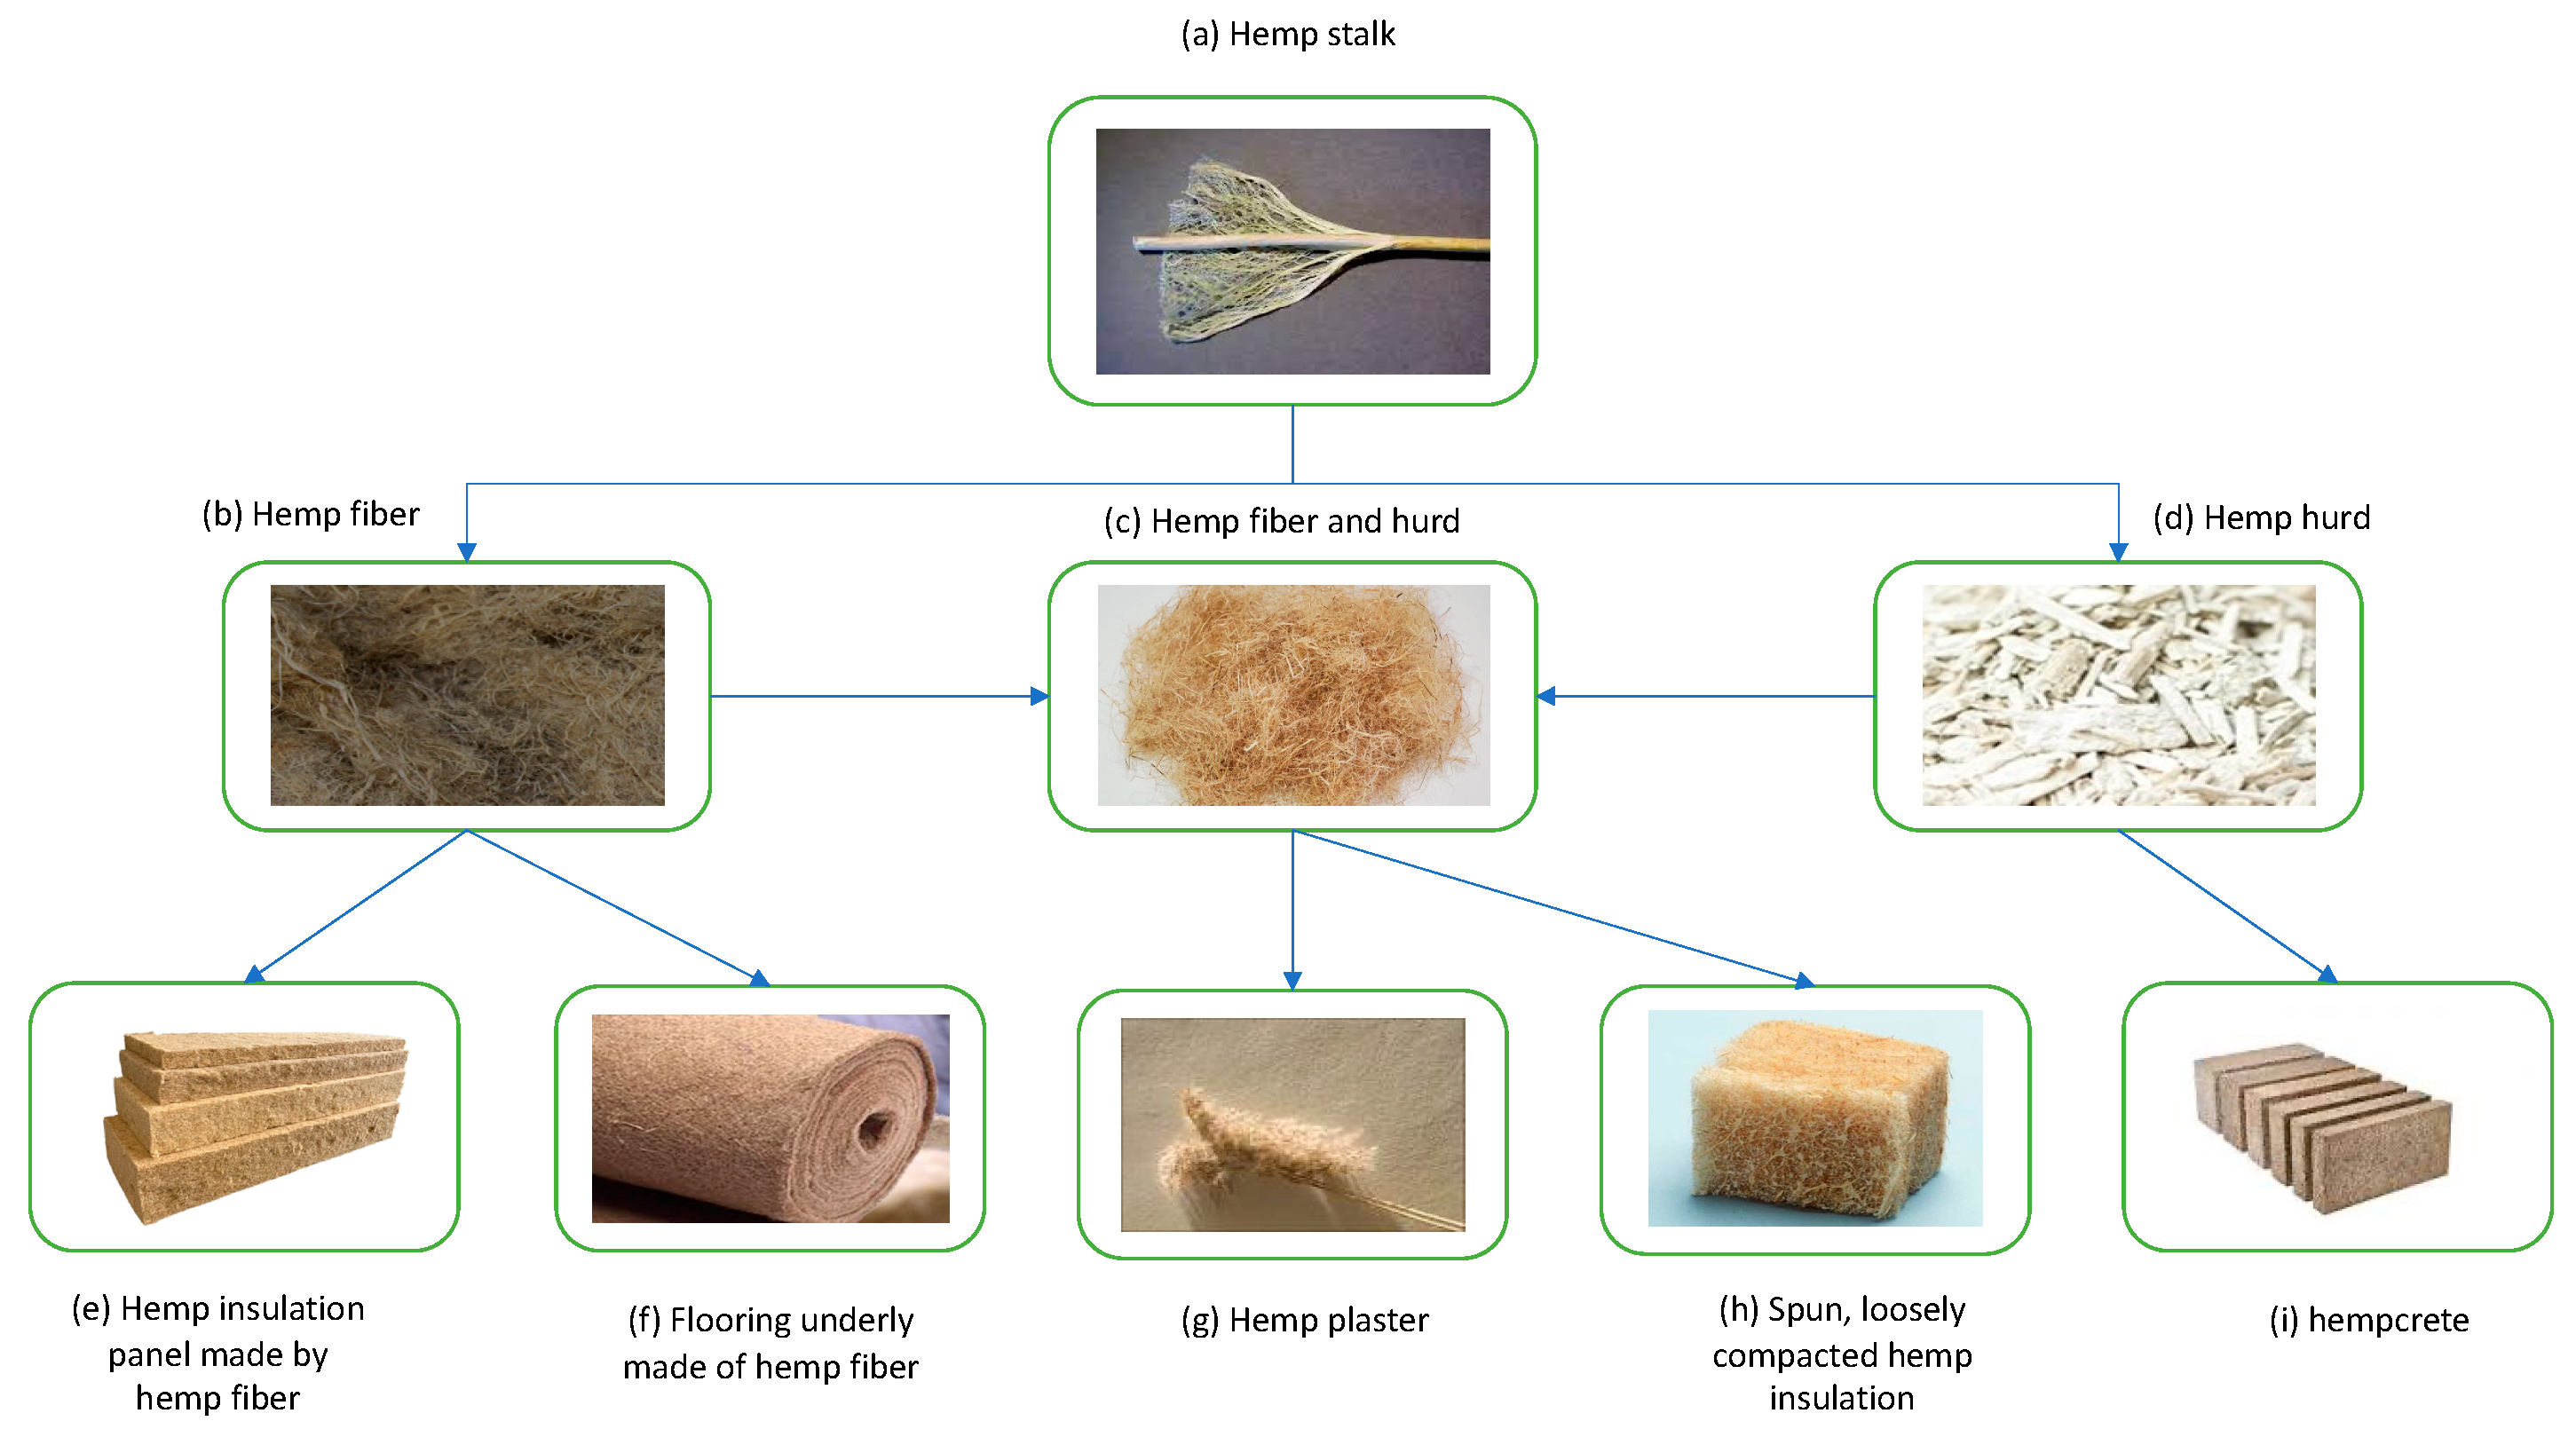
Hemp stalk contains hemp fibre and a woody core (also known as shives or hurds), which can be used to produce different construction materials. Hemp fibres are used to replace synthetic fibres to produce insulation. The hurds are used primarily to produce light and super-light concretes and mortars, as well as infills for cavities and under floors. Typical commercial hemp-based construction products are shown in
Figure 6. Today, over 100 hemp-based construction products are available on the market [
26].
The porous structure of bast fibres enables hemp fibre to be suitable for thermal insulation, and its thermal conductivity is compatible with that of conventional insulations [
49]. Attributed to the CO
2 uptake associated with hemp plant photosynthesis and fibre biodegradability, HF enables comparable thermal insulation performance with much higher levels of environmental compatibility [
50].
HC, also known as hemp concrete or lime hemp concrete (LHC), is a biocomposite mix made of hemp hurds and lime [
51]. A lime-based binder is chosen because of its abundance and the low emissions from its manufacture [
52]. HC can be used for roofs, walls, and floors with adjusted composition through casting, spraying, or pre-casting [
51]. However, HC cannot be used as a direct load-bearing material because of its low compressive strength and modulus of elasticity. HC has good thermal and acoustic insulation properties and can passively regulate humidity in a built environment [
53]. The thermal properties and behavior of an HC wall were found experimentally to be virtually identical to those of a commonly used lightweight concrete insulation material with a similar density [
54]. Thanks to the CO
2 uptake associated with hemp plant photosynthesis and the negative GHG emissions from its manufacture and installation, HC is carbon negative [
55].
HC is very durable, resistant to freeze–thaw salt exposure, mould, and insects [
56]. These properties are very desirable due to Canada’s freezing cold winter [
57] and more frequent floodings caused by climate change [
58]. Furthermore, the heat resistance of hempcrete is better than that of conventional insulation materials due to its permeability. Flame tests have also proven that hempcrete is non-flammable [
59]. Those features make HIMs a better choice than MIMs to combat extreme natural disasters, such as wildfire. Currently, forest fires are happening across Canada with more frequency and intensity; the spread of extreme forest fires caused by climate change has been increasing since 1980 and will continue to worsen until 2090 [
60].
The thermal quality of hemp-based materials is the core value to a building’s users [
61]. Thermal conductivity, the measure of heat flow that passes through a specific type of material, is the main parameter used to express the thermal performance of an insulation material [
62]. The thermal conductivity of commercially available hemp insulation is within the range of all generic groups of insulation and is compatible with those of other fibrous insulation materials [
63].
In Canada, MIMs include fibreglass, rock wool, slag wool, cellulose, and spray foam used for attics and wall cavities. XPS, EPS, PIR, and PUR are used for both continuous sheathing and under-slab applications [
64]. MW includes fibreglass, rock wool, and slag wool [
23]. In 2016, the market share of the top three insulation materials was 44.3% mineral, 23.5% EPS, and 16.7% PIR/PUR [
65]. Overall, insulation materials based on MW and PFs are dominant in Canada, with more than 80% of the market share.
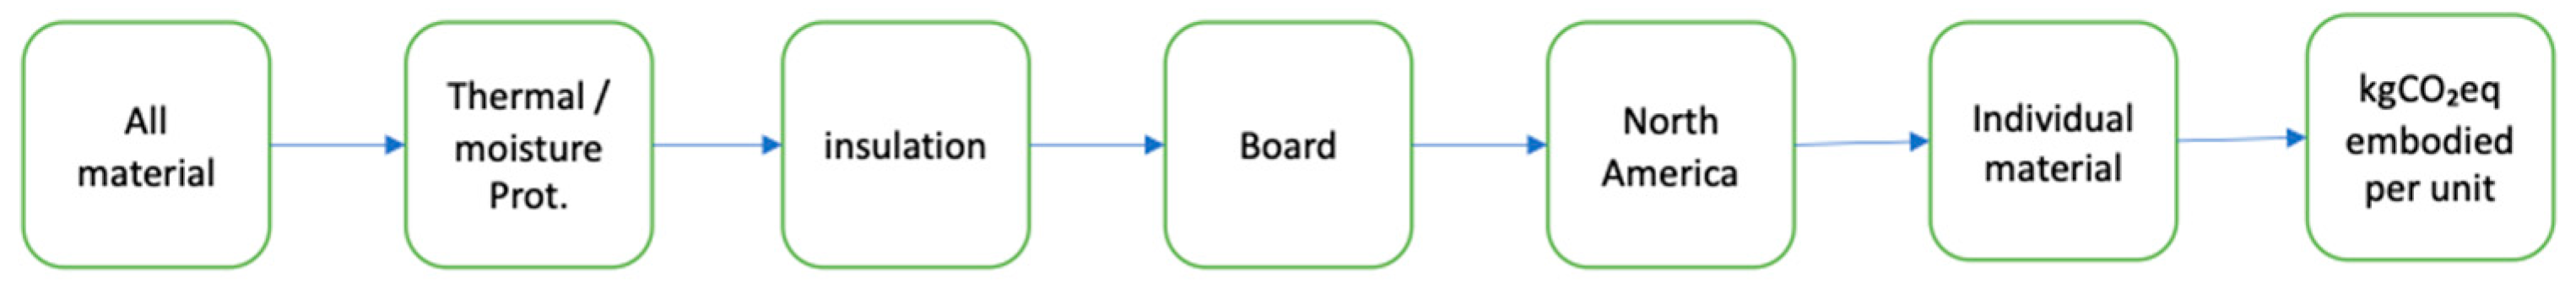
To evaluate the environmental performance of HIMs and MIMs, the Construction Calculator (EC3) was applied to collect embodied carbon data. EC3 is an open access database of construction Environmental Production Declarations (EPDs), with a matching building impact calculator for use in the design and material procurement. EPD, a standardised and LCA-based tool, was developed to enable better comparability of the environmental performance of products [
66]. The process of data collection is shown in
Figure 7.
Published EPDs contain discrepancies and inaccuracies due to the multiple methods of assessment [
67]. The achievable value is picked for comparison because it represents the low value of the category, where more than 20% of products are better than the required specification [
68]. Board-type insulation materials are considered because these are where most EPDs are found, and the
GWP values under the board type come with a minimum 50-year lifespan, while the boundary of the other types, such as blanket, foam in place, and blown, is cradle-to-gate only without consideration of the lifespan [
69]. The
GWP values of each insulation material vary depending on its application; the weighted average values for different intended uses—walls and general, exterior walls, roofs, below grade, duct, and others—are taken for comparison. The expression of the formula is:
where:
= weighted average GWP
= GWP for the intended uses
= number of declared EPDs for intended uses
The
GWP values of HC and HF are not available in EC3. Moreover, the availability of HIMs in the market is limited. Therefore, the
GWP values from the EDPs of a typical HF panel made in Canada by Natur-Chanv/hemp
TM and an HC block made in Belgium by IsoHemp were picked for comparison. The functional unit (FU) for comparison was 1 m
2 of insulation material with a thickness that provides an average thermal resistance RSI = 1 m
2·K/W with a minimum 50-year lifespan. The lifespan of HF is 75 years because no 50-year lifespan is available. Polyiso is used to represent PUR and PIR because both PIR and PUR are produced from the chemical reaction between polyol and isocyanate, with different ratios of isocyanate and different processes [
62].
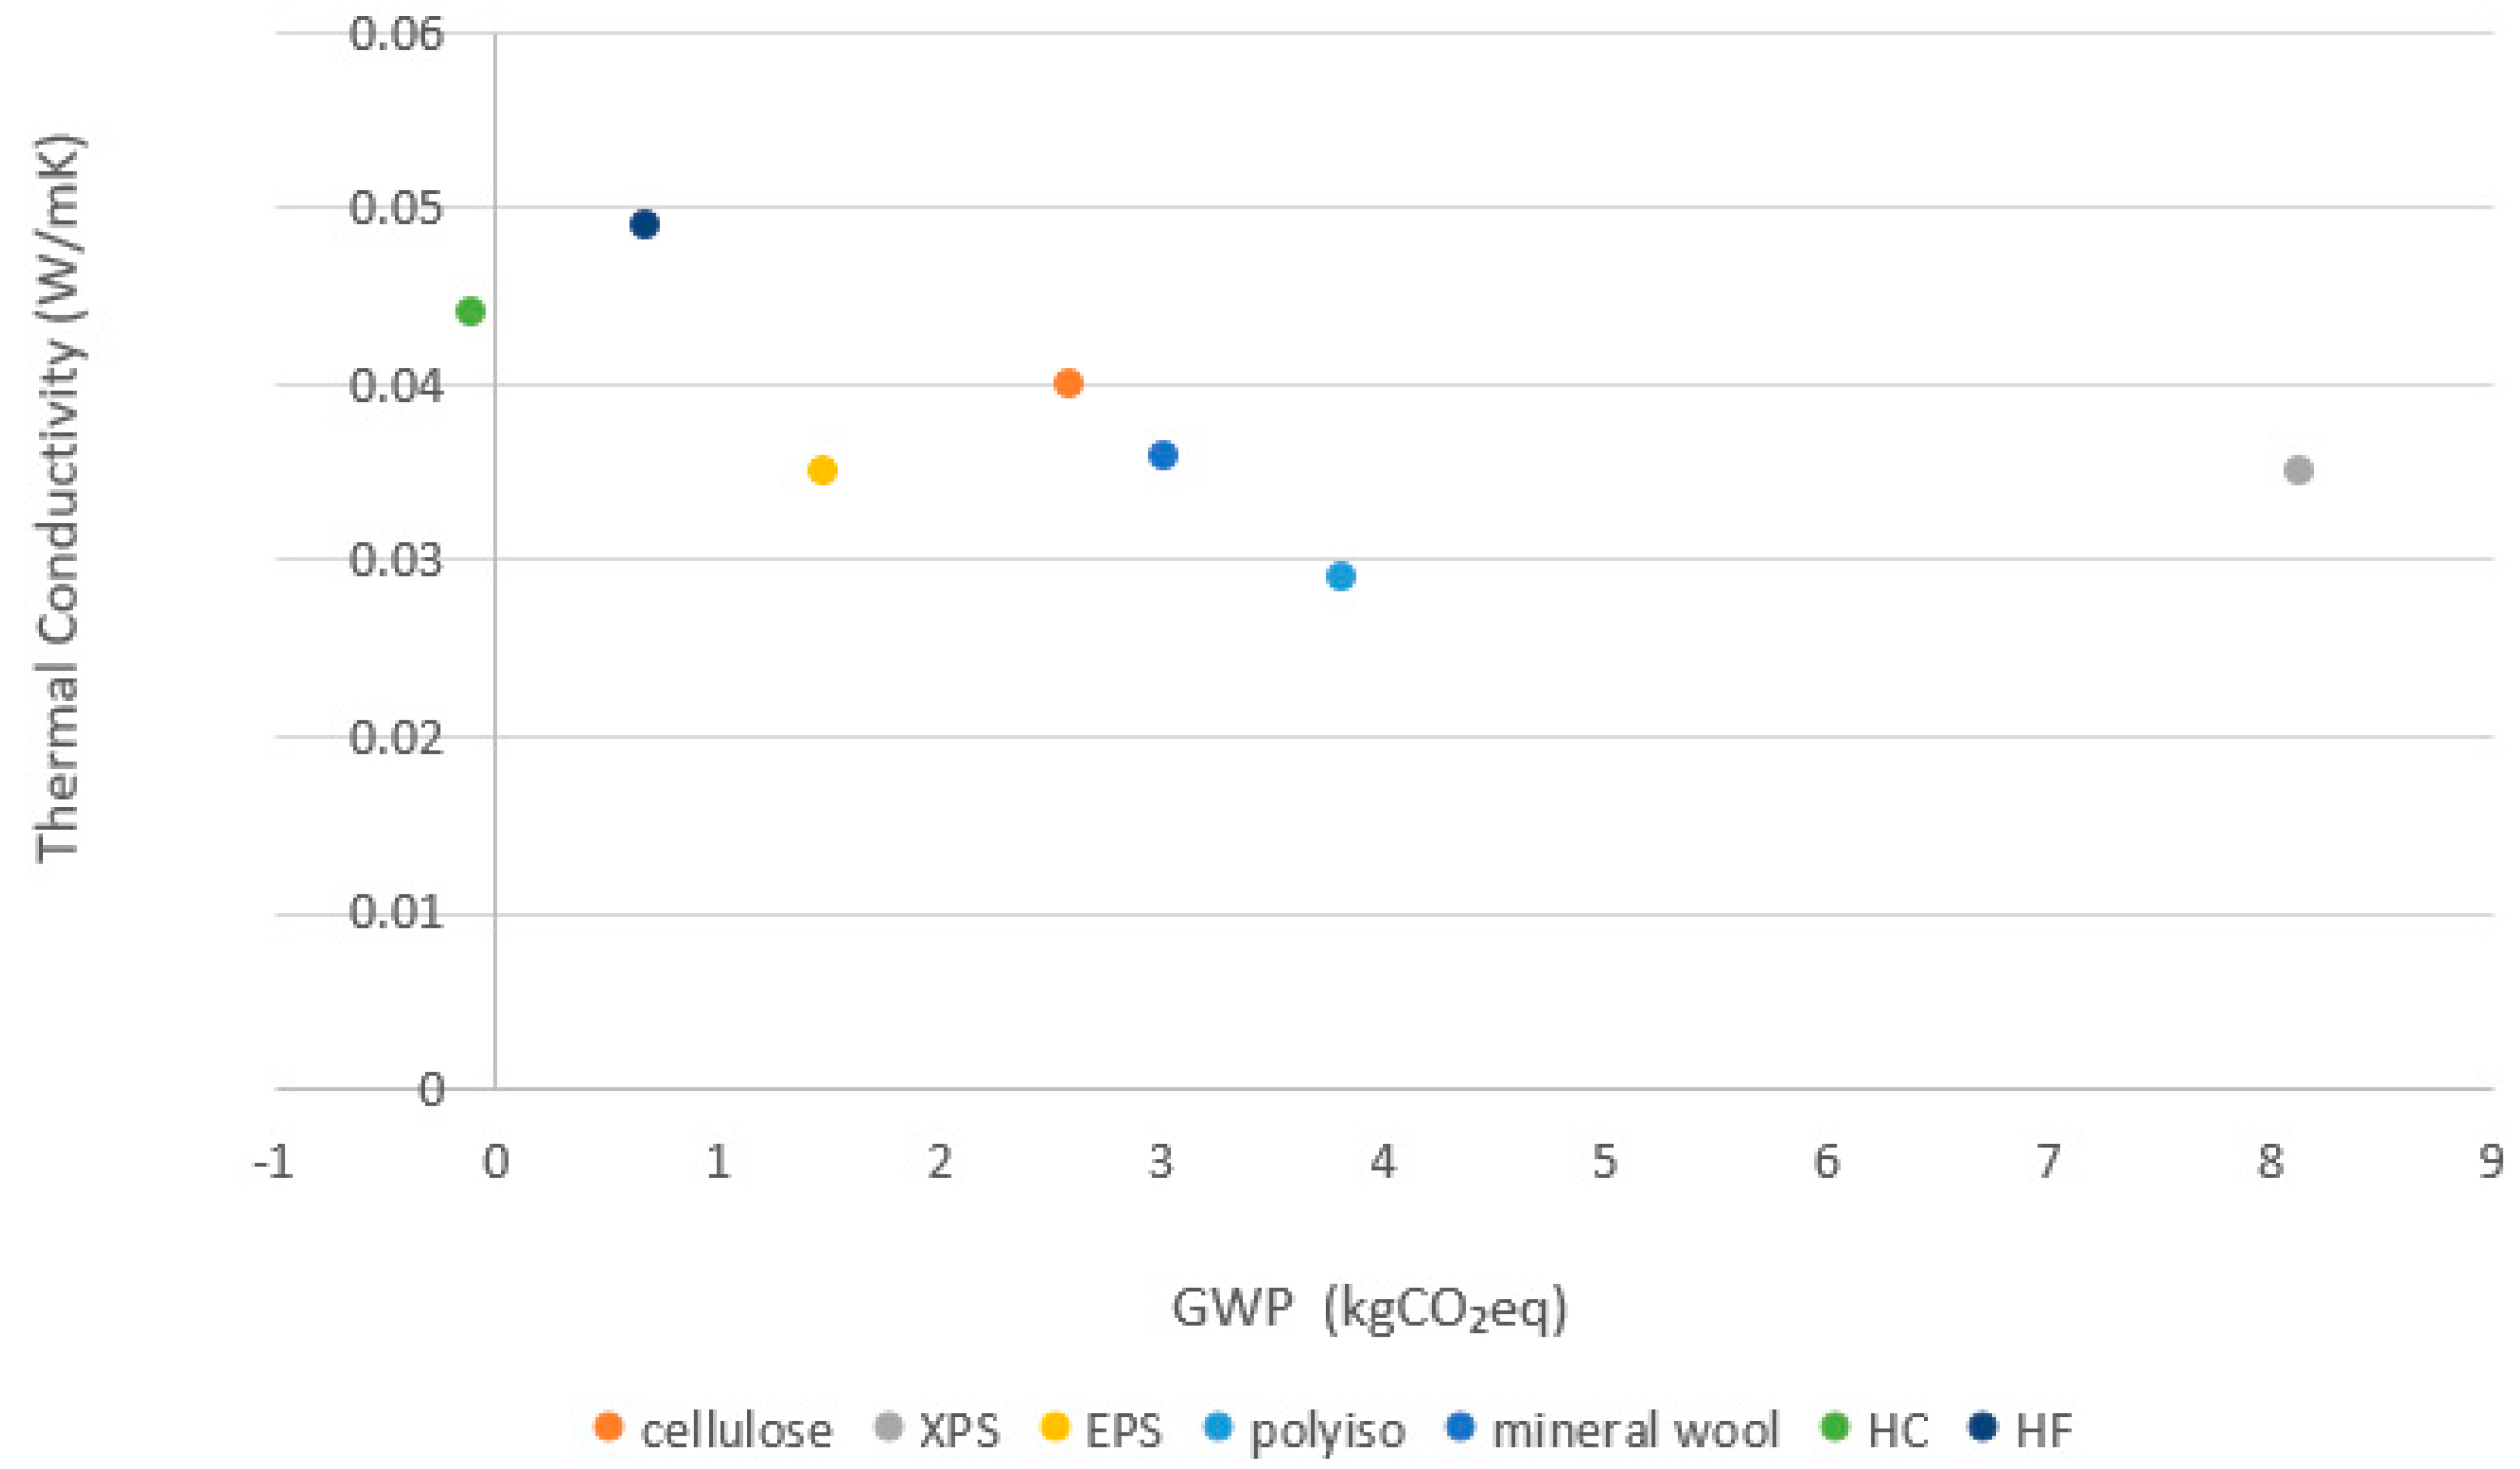
The comparison of thermal conductivity and
GWP values of HIMs and MIMs, shown in
Figure 8 (the relevant calculation in
Appendix A), shows that the thermal conductivity of HF and HC is compatible with that of MIMs. HC is the only insulation with a negative environmental impact; HF is the second-lowest-emission insulation material. Therefore, HIM substitution can significantly reduce GHG emissions while maintaining the comparable thermal performance of buildings.
3. Methodology
Material flow analysis (MFA) systematically assesses the state and changes in the flows and stocks of materials within a system defined in space and time [
70]. It is the primary methodology framework for environmental assessment and is widely implemented in environmental accounting and systems analysis [
71]. Life cycle assessment (LCA) is a well-defined methodology used to assess the environmental impact of a product, process, or activity over its entire life cycle. It is frequently applied to evaluate the environmental impact of building construction [
72]. For example, D’Amico et al. (2020) combined MFA and LCA across both spatial and temporal dimensions to evaluate their carbon mitigation by replacing concrete floors with steel cross-laminated timber [
73]. Considering the similarity of evaluating the environmental impact through building material substitution, MFA and LCA were adopted to evaluate the potential carbon reduction achieved via substituting MIMs with HIMs for Canadian residential buildings from 2025 to 2050.
To assess the
GHG mitigation derived from gradual HIM substitution, the annual
GHG emissions in year
t are expressed as the dot product between two vectors,
and
[
74].
The first vector,
is the material mass quantity in the given year
t; another vector,
, contains the corresponding carbon coefficients (CC), representing the amount of
GHG (CO
2eq) emitted to the atmosphere per unit mass of material. The factor u, ranging from 0 to 100%, represents the percentage of MIMs to be replaced by HIMs at the end of reference period, 2025–2050. The vectors of the chosen materials and corresponding CC are:
where:
= material mass quantity of MIM
= material mass quantity of HIM
= carbon coefficients of MIM
= carbon coefficients of HIM
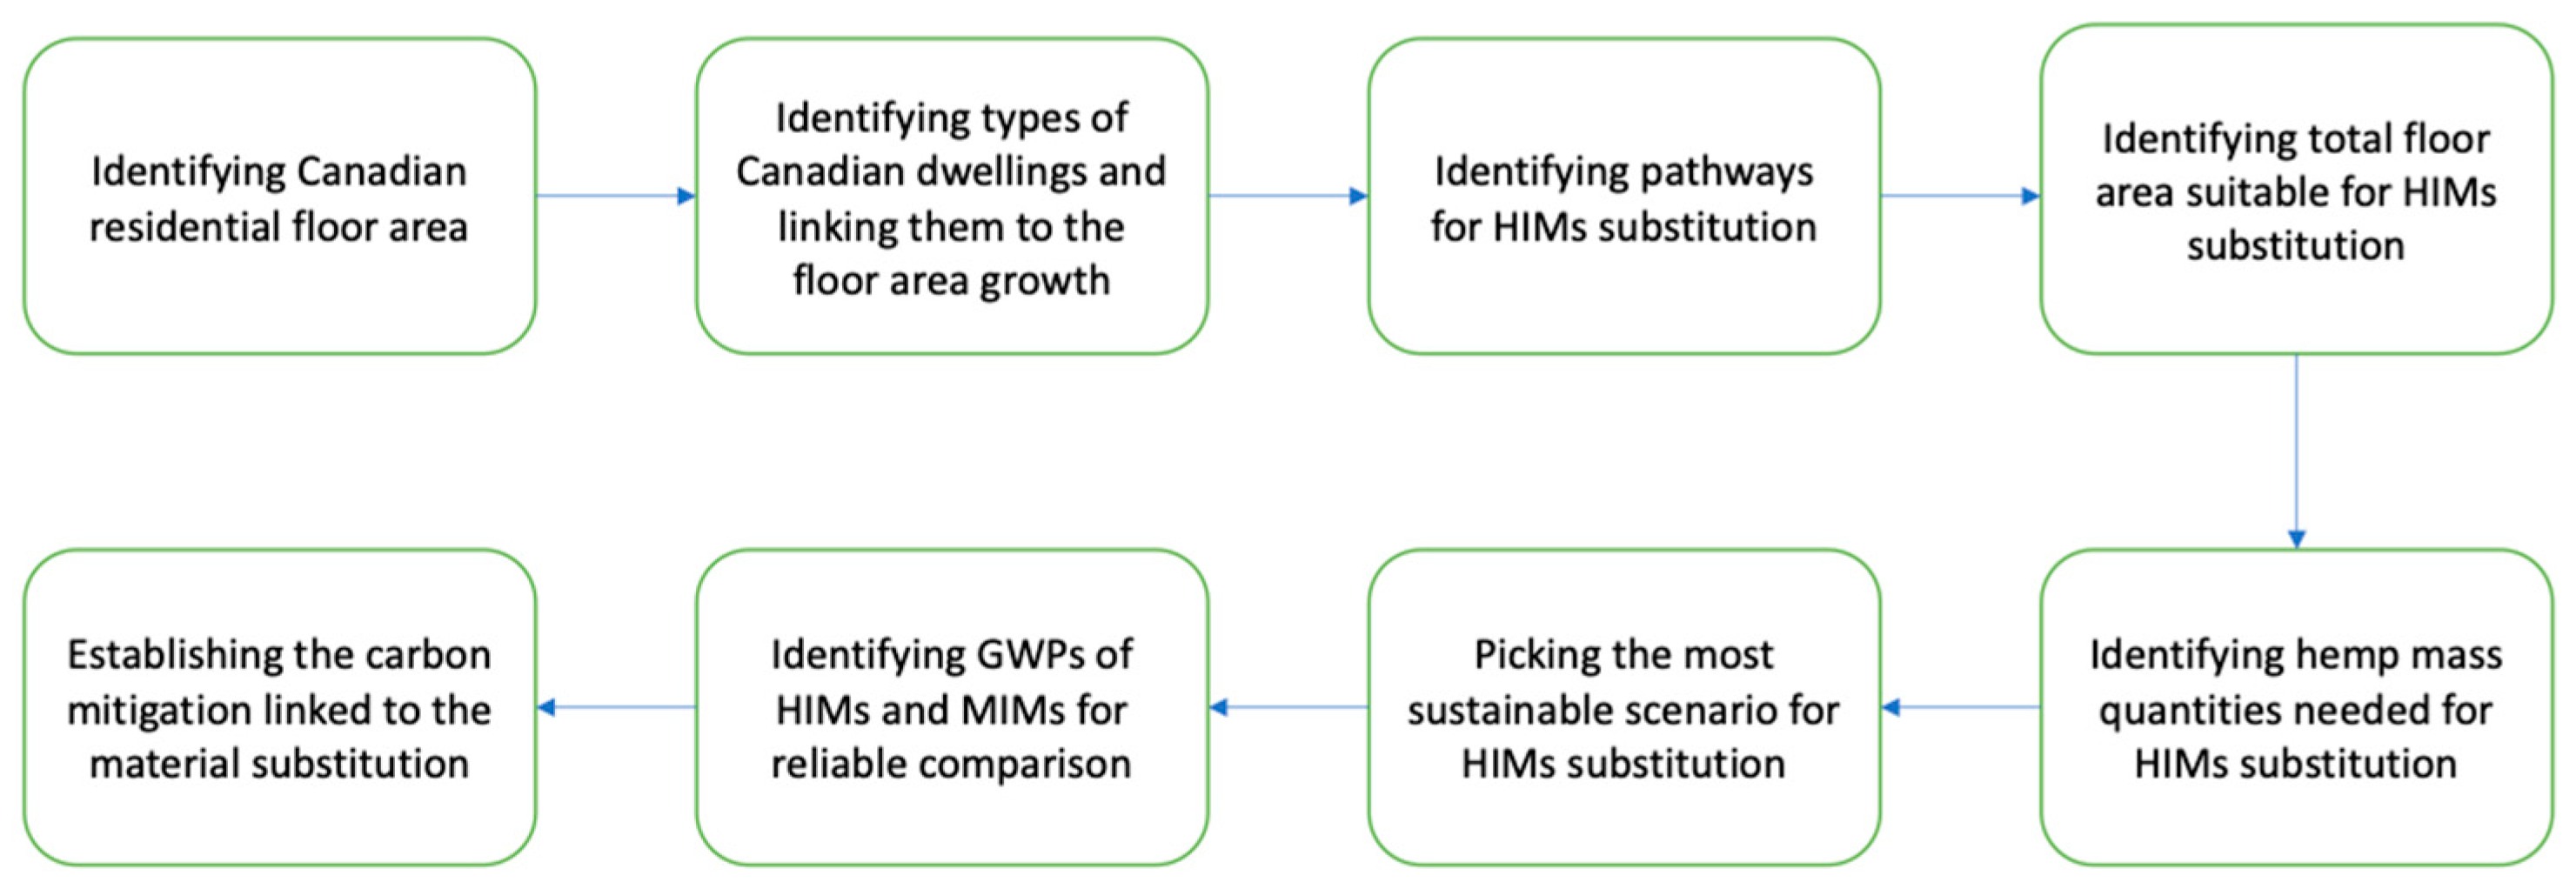
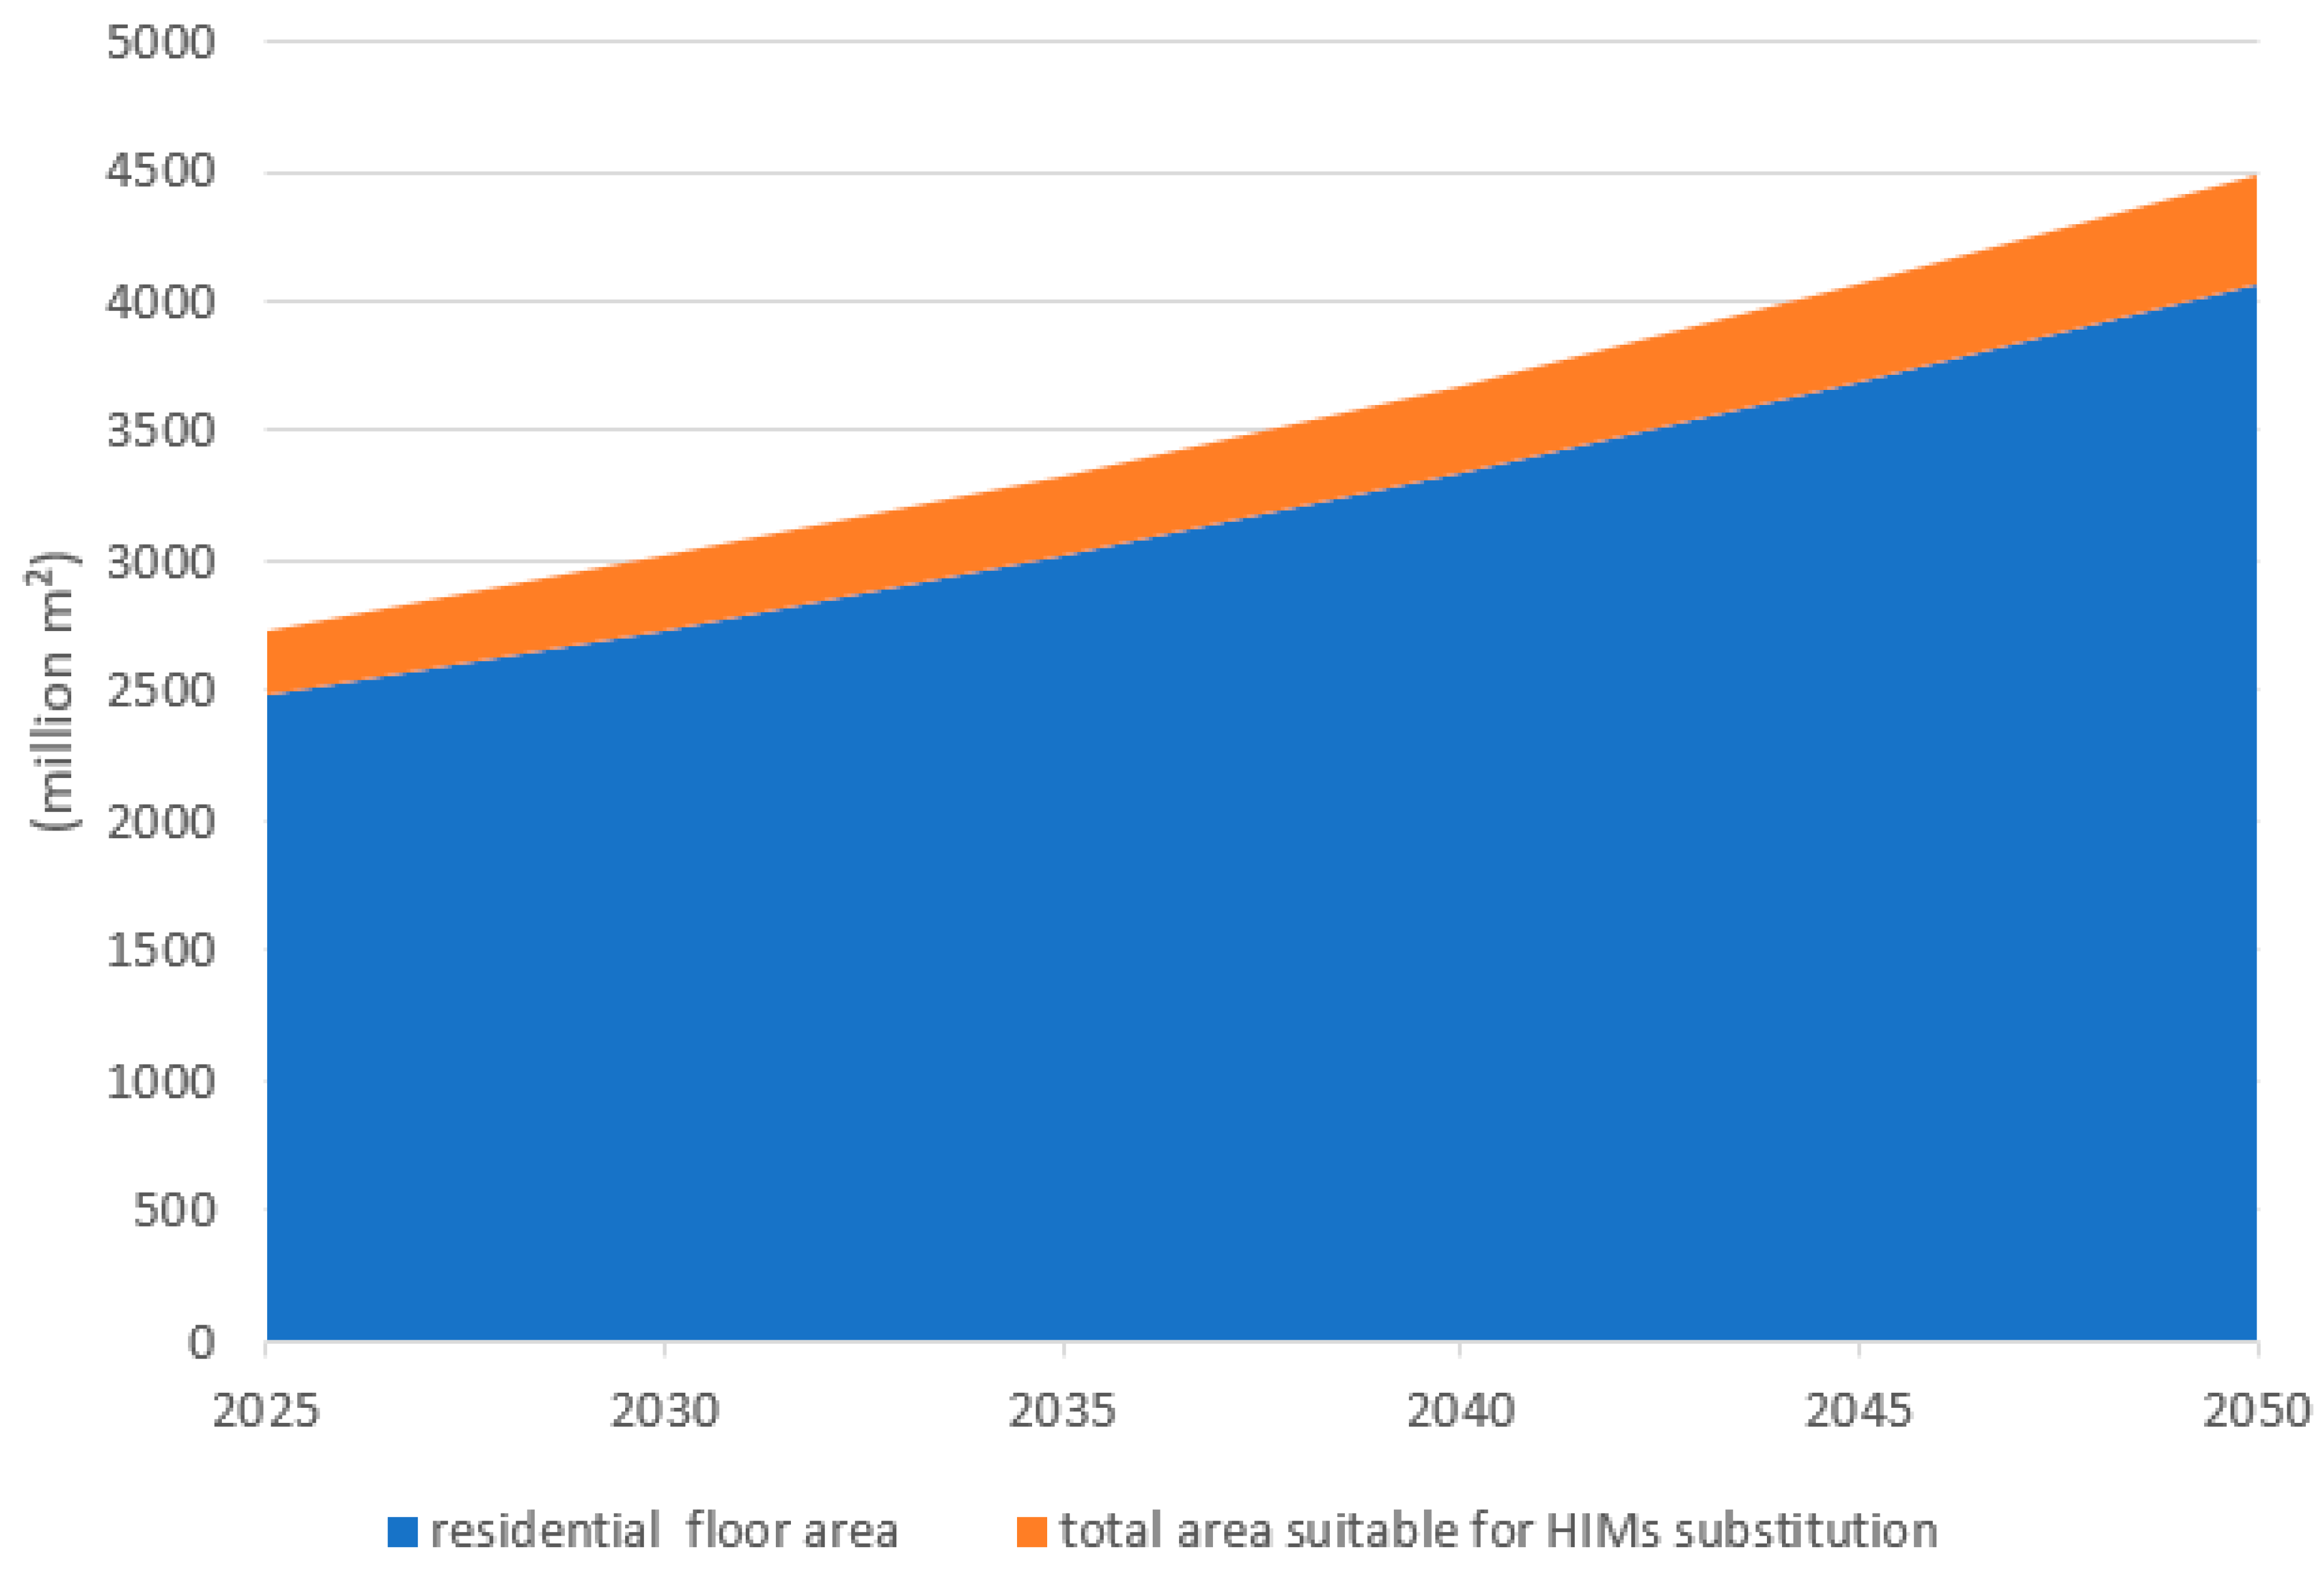
The amount of HIMs needed for substitution in the given year
t is subject to the area suitable for HIMs application and the percentage of MIMs to be replaced by HIMs. The
GHG emitted into the atmosphere per unit of mass are assumed to be the same from 2025 to 2050. The process to identify the carbon mitigation by hemp substitution is explained in
Figure 9:
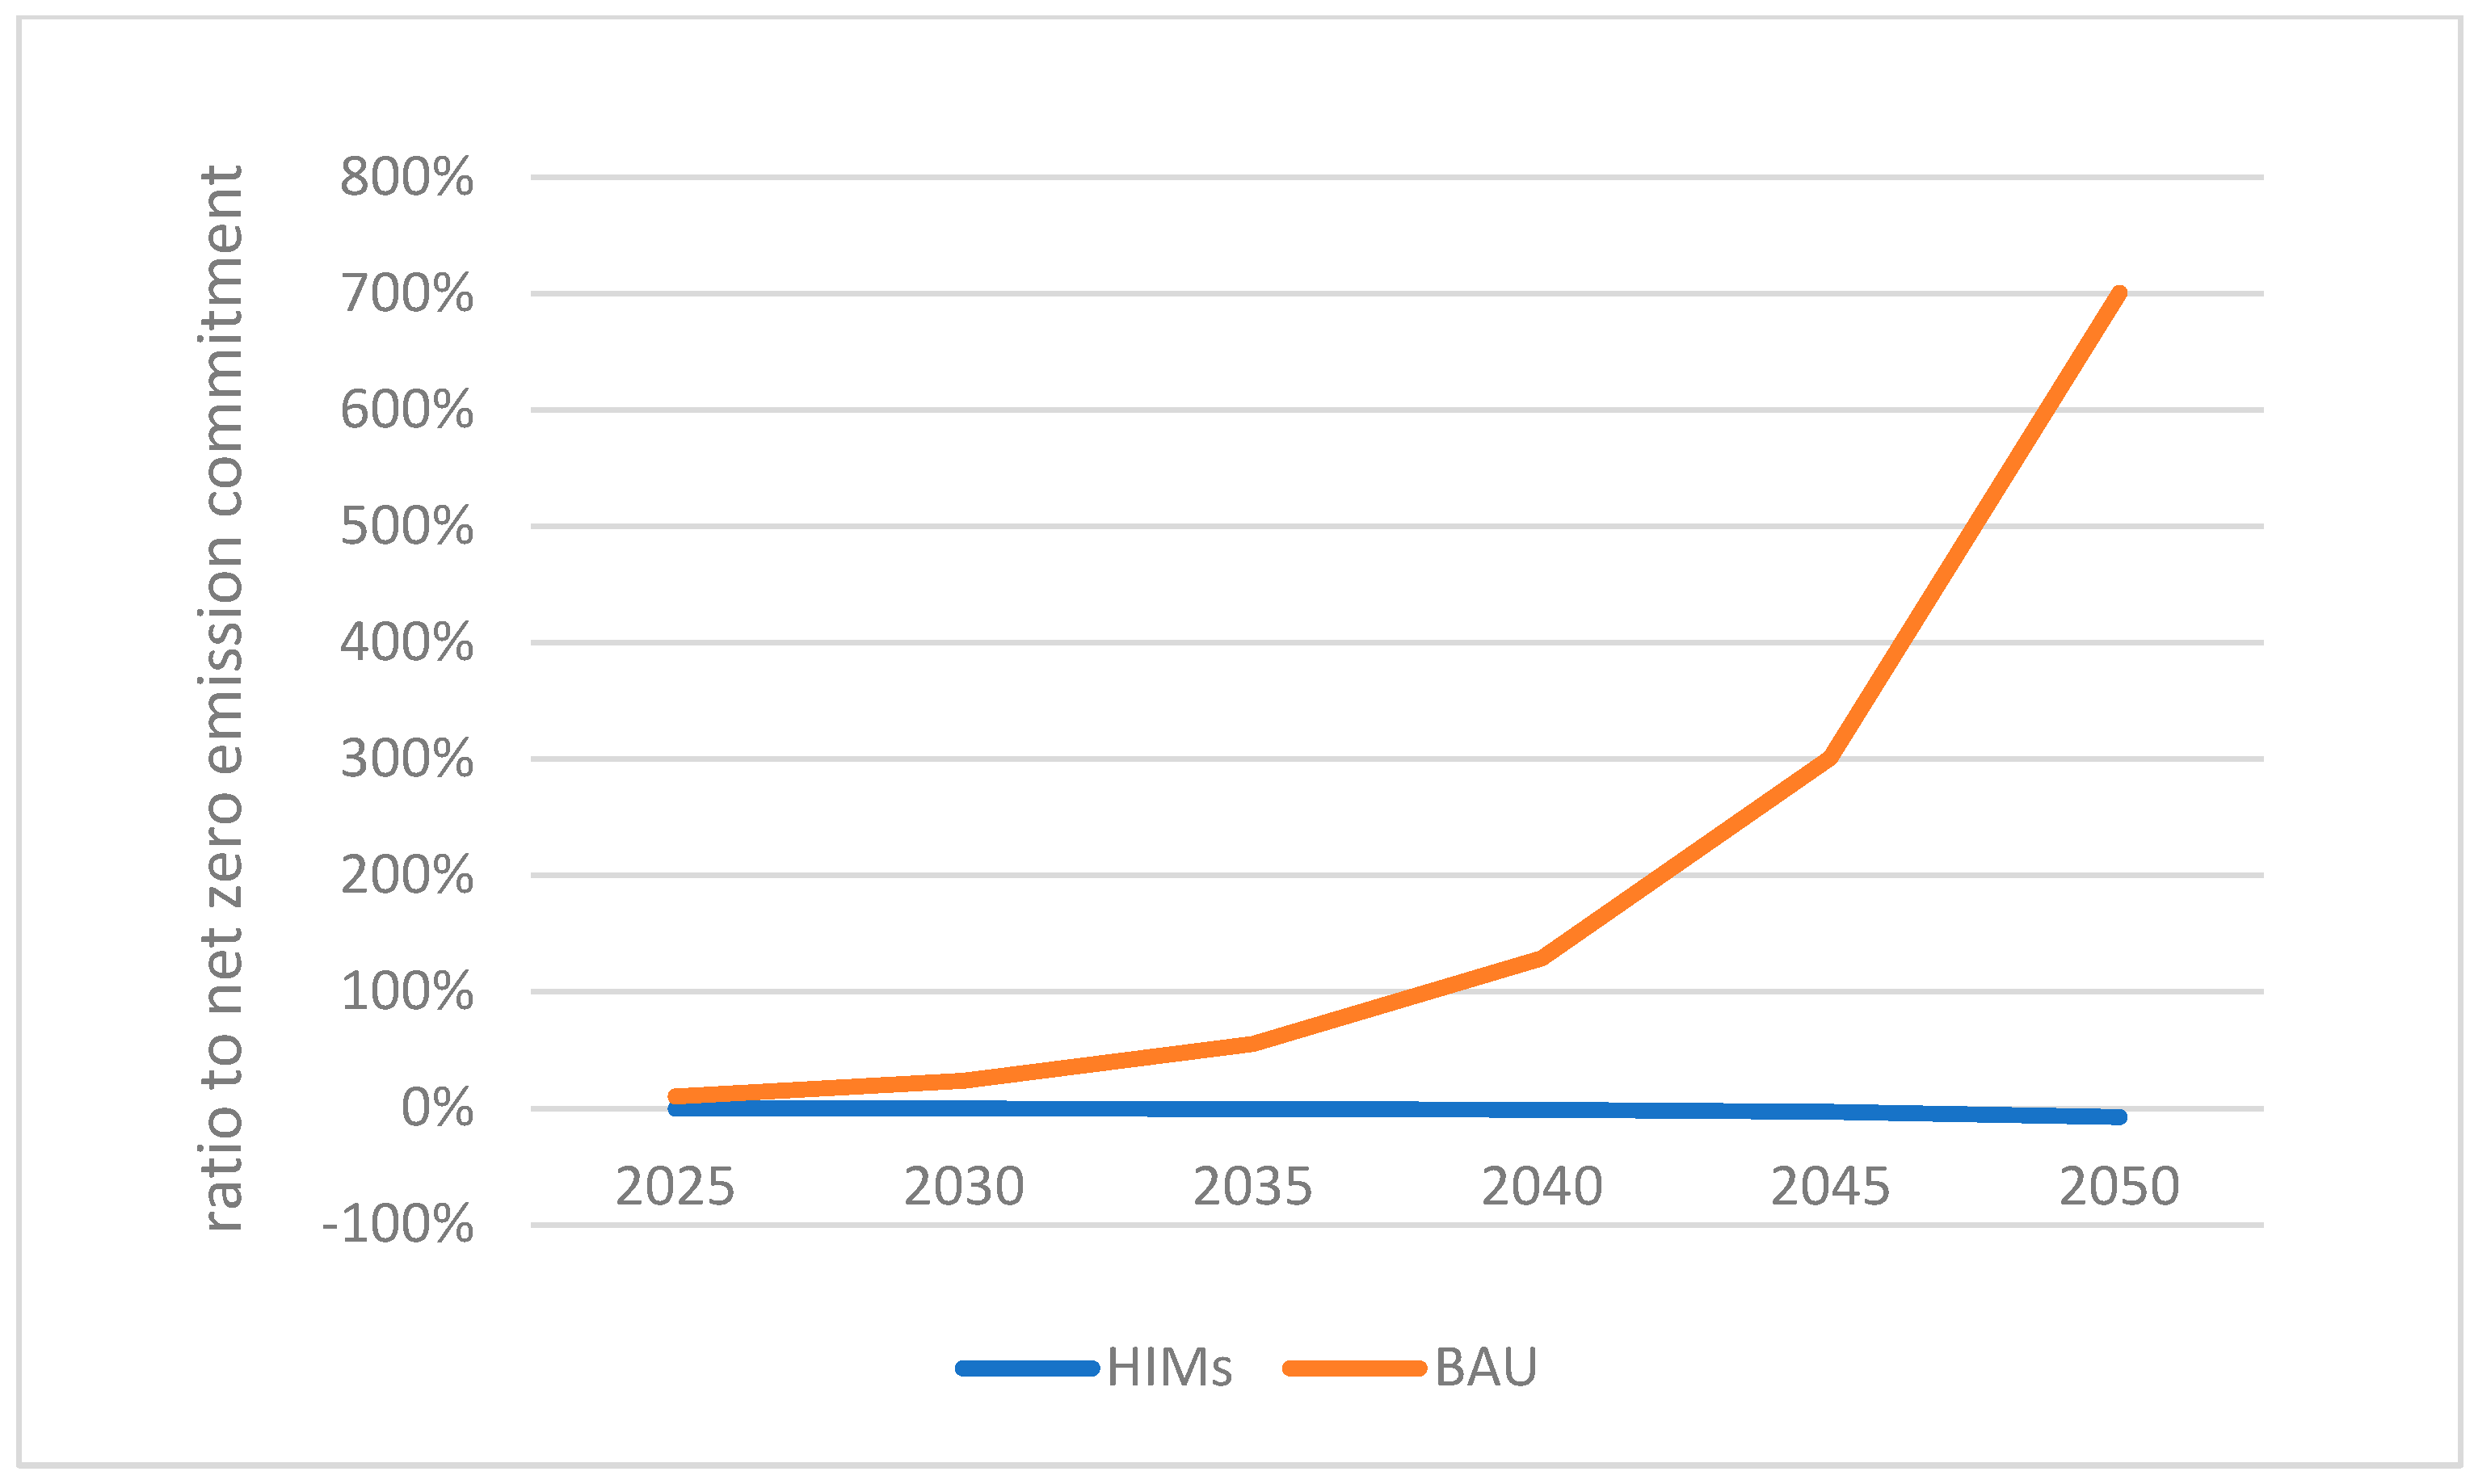
5. Discussion
Existing studies show that wood, bamboo, and straw clay can replace conventional building materials such as concrete, aluminium, and bricks with comparable mechanical properties and significant carbon mitigation [
99]. The comparison of the GWP reduction caused by substitution with hemp and other natural building materials, shown in
Table 2, shows that hemp substitution can mitigate more GWP than other natural materials substitution. Hemp substitution can sequester carbon instead of emitting carbon.
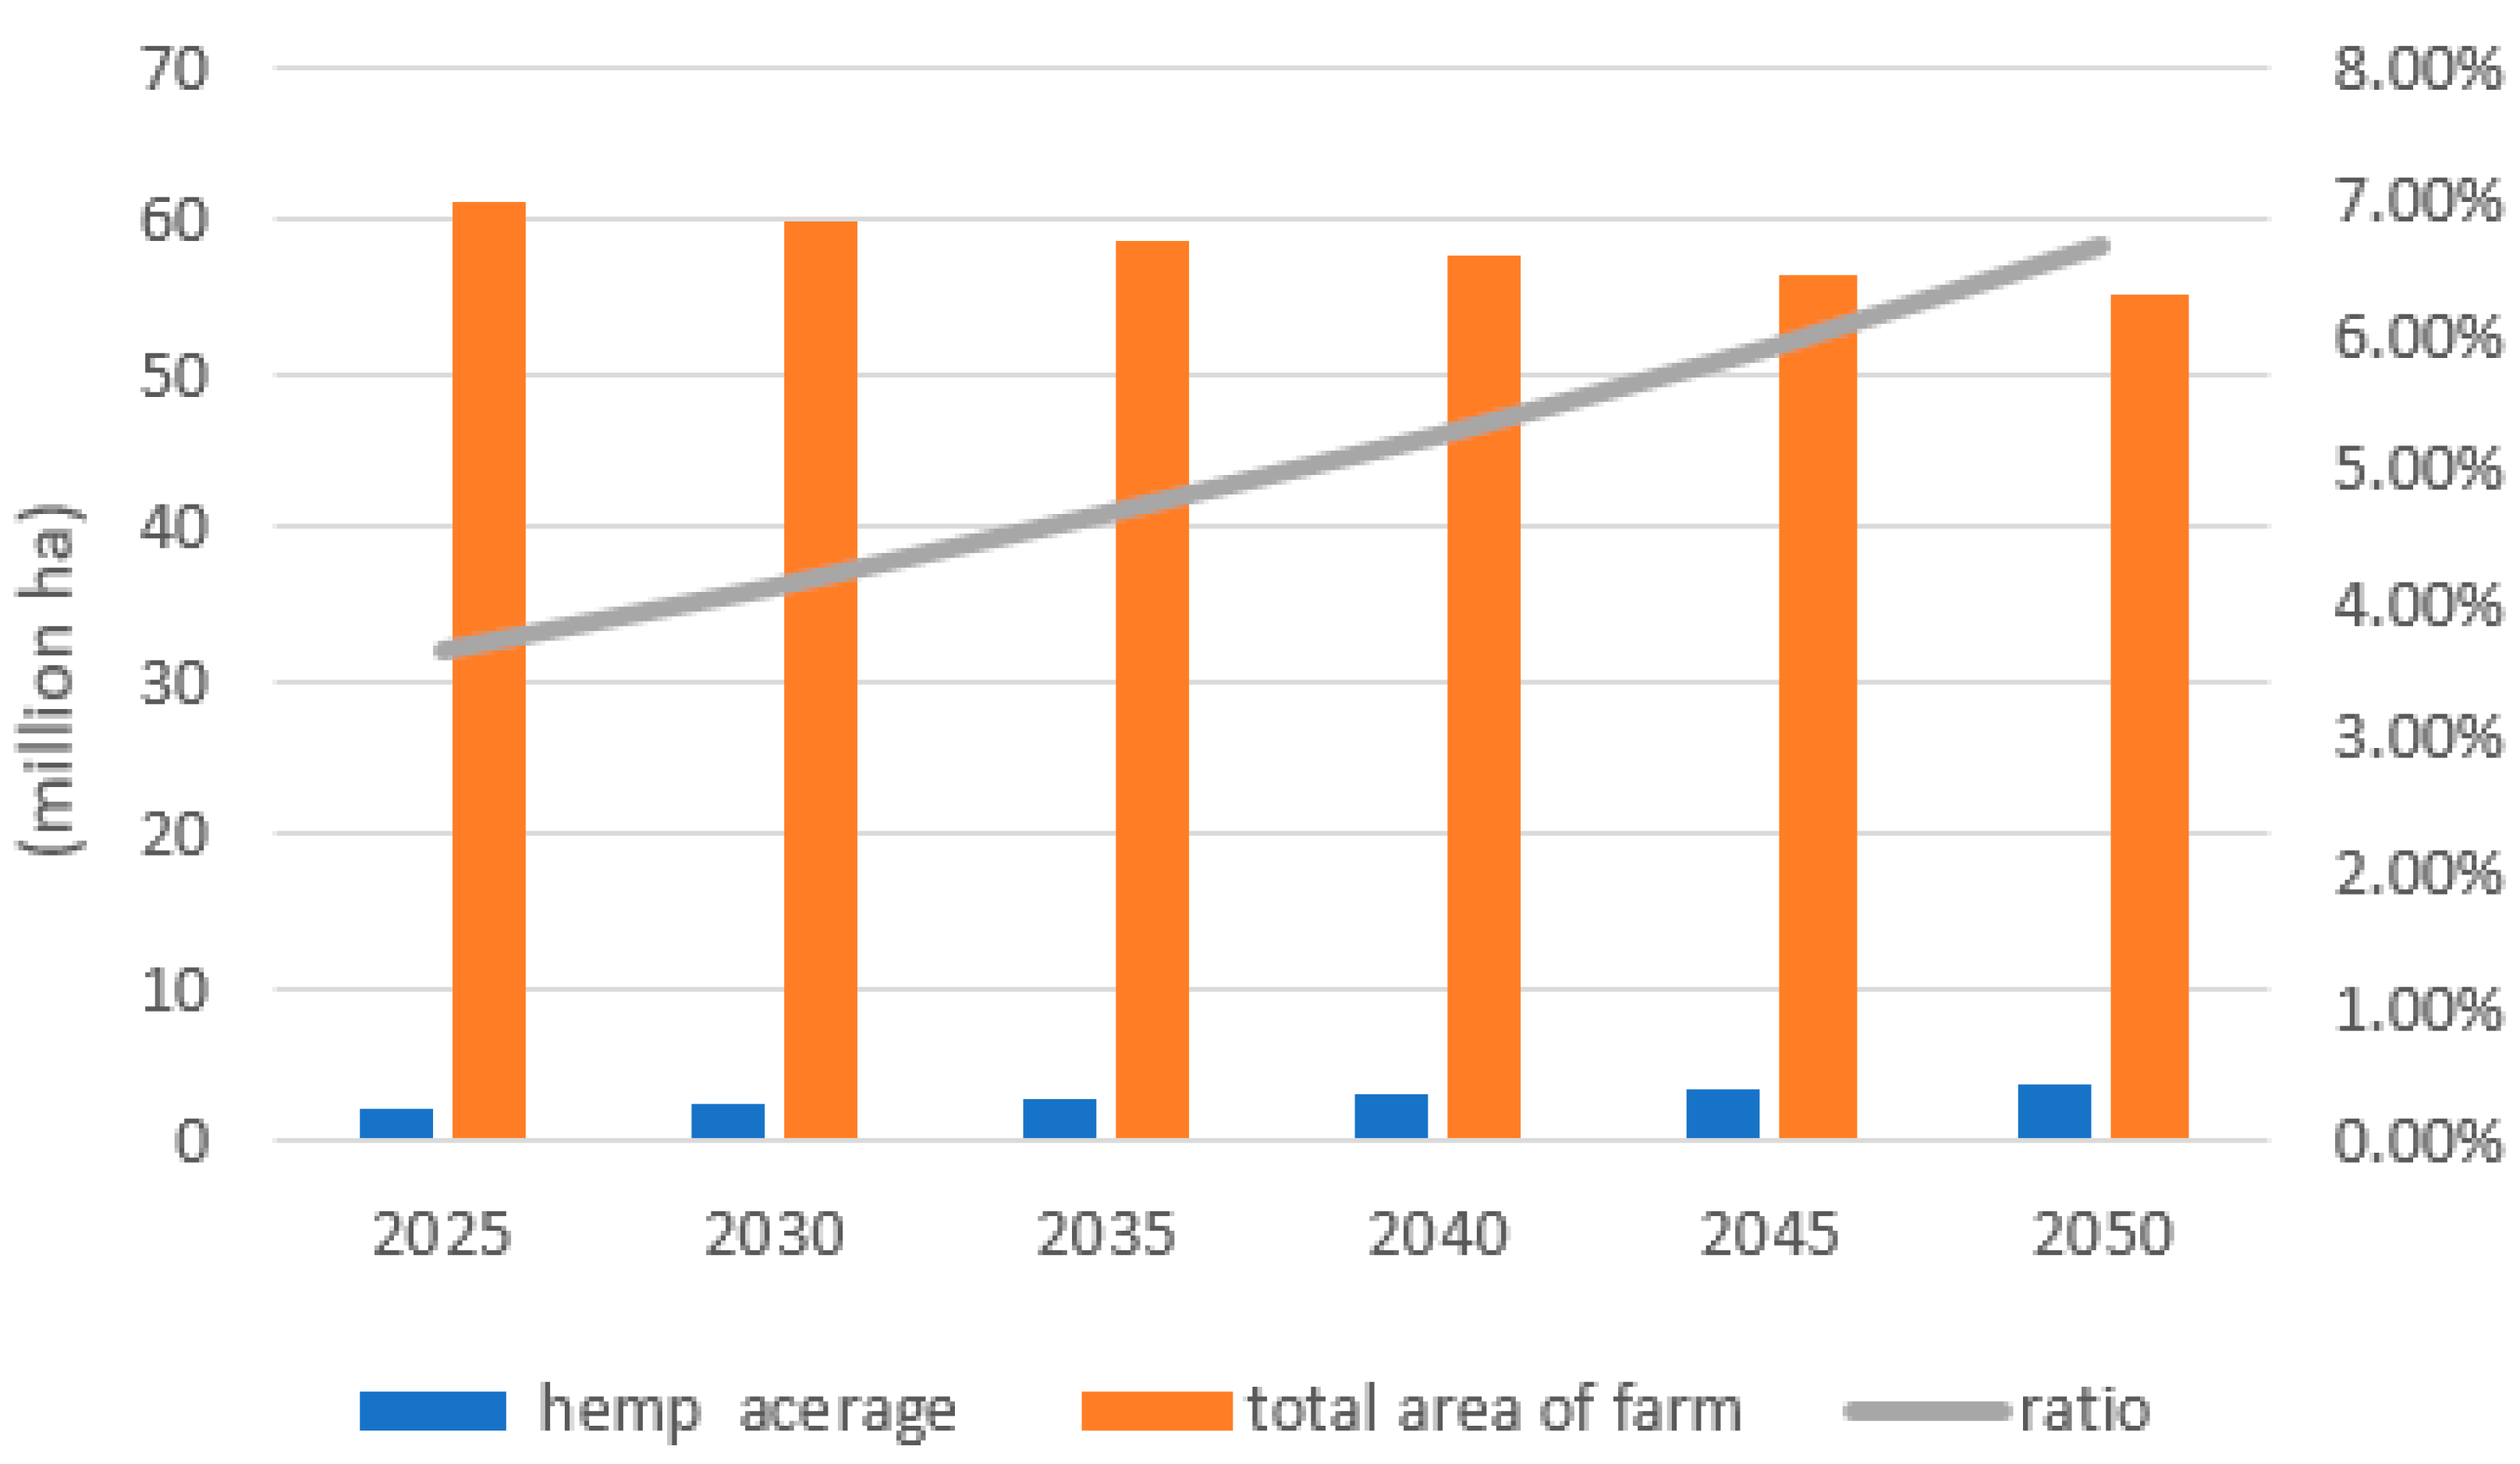
Although there is plenty of farmland in Canada available for hemp cultivation, and Canada is the largest hemp producer, with 555,853 ha hemp acreage in 2018 [
34], the primary focus of hemp cultivation in Canada is currently the hemp seed, because it is more profitable. Most Canadian hemp seeds are exported to the U.S. Furthermore, unlike many other mature crops subject to substantial research in genetic optimisation, product applications, and equipment design, fibre hemp needs a lot more study to make it competitive alongside other commodities [
25]. Economic consideration is the bottom line for farmers. The estimated return of grain hemp is slightly positive, but that of fibre hemp is now negative [
106]. Therefore, it is a significant challenge to realise mass fibre hemp production in Canada in the short term to meet the requirements for full HIM substitution. The chance to import hemp from other countries is also rare because the overall market size is too small [
34]. However, the increase in global hemp cultivation in the long term is optimistic. Industrial hemp is emerging as a highly successful commercial crop due to its low carbon footprint, efficient land use, and multiple uses [
107]. China, a historically dominant hemp grower and exporter, has committed to substantially increase hemp acreage [
108]. The hemp production in Europe has increased by 70% from 2013 to 2018, driven by emerging demand from industrial textile fibre applications [
109]. The U.S., as the largest importer of hemp products, is turning from a net hemp importer into a hemp producer. The hemp acreage has increased from 0 in 2013 to over 90,000 acres (or 36,421 ha) in 2018. The rapid growth in hemp production in the U.S. will significantly impact the global hemp supply [
110], particularly in Canada, the major exporter of hemp products to the U.S. [
25].
HIMs have been officially approved for use in the construction industry in Europe. HC is commonly used in France, England, Germany, Ireland, Belgium, Luxembourg, and Switzerland [
39]. In October 2022, hemp–lime construction was approved for U.S. residential construction. It is limited to the non-structural, solid infill mix of hemp hurds and their binder in between or around the wall framing [
111]. In Canada, Quebec is the leader and pioneer of hemp construction [
39]. Residential hemp construction projects are permissible under Section 9 of the Ontario Building Code [
112]. However, hemp building has not officially been approved by the National Building Code and the rest of the provinces yet.
In Canada, most hemp stems are burned by farmers due to the lack of decortication equipment to separate the fibre and hurds. The hurds used in Canada for HC are imported from Europe and China [
113]. There is a lack of fine varieties of the hemp cultivar, state-of-the-art techniques to support high-yield cultivation, processing capacity, industrial standards, and coordination between planting and processing [
25]. An integrated hemp supply chain is essential to popularise hemp cultivation and utilisation in Canada.
Furthermore, the current comparison of carbon mitigation is based on the GWP values from traditional LCA results. No time-related conditions were considered, although the impact of releasing the same quantity of pollutant at one time or at a small rate over time is generally different. Dynamic LCA was primarily developed to improve the accuracy of LCA by addressing the inconsistency of temporal assessment [
114]. Therefore, re-evaluating the potential carbon mitigation using dynamic LCA may provide a valuable comparison to the current paper.


