Article

More Interventions, Low Adoption: To What Extent Are the Existing Seed Sources to Blame? The Case of Orange Fleshed Sweet Potato in Central and Northern Malawi

by
Chrispin Sunganani Kaphaika
1,*,
Samson Pilanazo Katengeza
1,2,
Innocent Pangapanga-Phiri
3 and
Madalitso Happy Chambukira
1
1
Department of Agricultural and Applied Economics, Lilongwe University of Agriculture and Natural Resources, Lilongwe P.O. Box 219, Malawi
2
Directorate of Research and Outreach, Lilongwe University of Agriculture and Natural Resources, Lilongwe P.O. Box 219, Malawi
3
Center for Agricultural Research and Development (CARD), Bunda College Campus, Lilongwe University of Agriculture and Natural Resources, Lilongwe P.O. Box 219, Malawi
*
Author to whom correspondence should be addressed.
Sustainability 2023, 15(19), 14390; https://doi.org/10.3390/su151914390
Submission received: 15 July 2023 / Revised: 31 August 2023 / Accepted: 4 September 2023 / Published: 29 September 2023

Abstract

:
Vitamin A dense Orange fleshed sweet potato (OFSP) has the potential to build resilient livelihoods against Vitamin A Deficiency (VAD), food insecurity, and climate change. However, the adoption of OFSP among smallholder farmers in Malawi remains low. Although many scholars across the globe have reviewed the seed systems of OFSP, no empirical study, in Malawi or elsewhere, has modelled how the use of the various sources of vines affect farmers’ seed security and eventual decisions to adopt biofortified OFSP varieties. The study employed a mixed methods approach and used a Triple Hurdle model to analyze the effect of the existing sources of vines on the adoption of OFSP among 721 randomly sampled households in central and northern Malawi. The study also developed a seed security experience score (SSES) in order to assess the capacity of the existing sources of vines to ensure farmers’ seed security. By defining adoption as a three-stage process, and by shifting the seed systems focus to capacity of the existing sources of vines, the study departs from the conventional approaches that most scholars have used to model adoption of OFSP. The study found that the existing sources of vines influenced all the three stages of adoption. The SSES results indicated that the capacity of the existing sources subjected the majority of the farmers to a highly seed insecurity status. Interventions therefore must be designed to address the seed security challenges associated with the existing sources in order to enhance the capacity of the sources for widespread and sustained adoption of OFSP.

1. Introduction

Sweet potato, Ipomoea batatas is among the top 10 most important food and nutrition security crops across the globe and covers approximately 9 million hectares of land [1,2,3,4]. It is an herbaceous perennial root crop of the Convolvulaceae family with flesh colors ranging from white, yellow, cream, purple, and orange [1,5,6]. The crop, commonly grown by resource poor smallholder farmers, easily adapts in almost all agro-ecological conditions in the world and easily fits into various farming systems [7,8,9,10]. In the past two decades, there has been a tremendous increase and improvement in sweet potato yield particularly in the Sub-Saharan African (SSA) region, where farming is the primary source of livelihood for about 90% of the population [11]. According to FAOSTAT data collected between 2018 and 2022, Malawi is among the top 10 sweet potato producing countries in the region and globally. For instance, Malawi was the second largest producer of sweet potato in 2018 with a per capita production of 295.8 kg/capita that surpassed the 50 kg/capita indicator of primary staple food [2].
Meanwhile, in Malawi and many parts of the SSA region, ending hunger and achieving food and nutrition security remains a challenge [12,13]. Climate shocks and other crises have threatened food systems [12,13], exacerbating the region’s food insecurity prevalence to as high as 21.3% [12]. Consequently, malnutrition in the region has remained a major public health concern [13]. The region also risks high prevalence of Vitamin A Deficiency (VAD) due to insufficient consumption of Vitamin A levels, particularly among children under the age of five and women of reproductive age [14]. When experienced early in life, as is the case with under-five children in SSA, VAD results in irreversible negative health and economic outcomes [15].
Realizing that the majority of the populations in SSA rely on agriculture for their livelihoods, food-based approaches that guarantee such sustainable food systems outcomes as agricultural sustainability, food security and healthy diets have been identified as strategic and effective pathways towards combatting micronutrient deficiencies such as VAD [16]. One such approach is the biofortification of staple food crops. Biofortification uses agriculture to solve the food and nutrition insecurity problems among agro-based vulnerable communities who mostly consume food from own production [16,17,18,19,20,21].
Biofortified sweet potato varieties, particularly the drought tolerant Orange Fleshed Sweet Potato (OFSP) have therefore been advocated as an effective strategy to combat VAD while improving the food security status of the resource poor smallholder farmers [19]. Despite having the same agronomic characteristics and benefits as the white fleshed sweet potatoes, the potential of OFSP is in its high levels of beta-carotene, which convert to Vitamin A in the body when consumed, thereby having an ability to supplement high levels of Vitamin A to children and pregnant women [15,20]. Low et al. [15] reported that it takes only 125 g of OFSP to meet the Vitamin A daily needs of a child. OFSP has also been reported to possess better traits than the local white fleshed sweet potato in terms of its yield, shelf life, maturity, taste, and resistance to drought [15,21,22].
Being a nutrient dense crop that is also resilient to climate variability, OFSP has gained massive support from governments (e.g., Ref. [23]) and other stakeholders in the agriculture sector, leading to a tremendous increase in the number of interventions promoting adoption of OFSP among smallholder farmers [22]. Despite the interventions done to promote production and utilization of OFSP, and even with the proven effectiveness of the OFSP to improve food and nutrition security status of the poor, the adoption of OFSP among smallholder farmers in the SSA region remains low and slow, barely breaking through 40% [24]. In Malawi, a recent study by Gatto et al. [22] indicated an adoption rate of only 54%. Empirical studies on factors influencing adoption of OFSP have been done in Kenya, Mozambique, and other African countries except Malawi [22]. Although the previous studies cited seed constraint as one of the key determinants of adoption, there is no study that has quantified the effect of the existing sources of vines on adoption of OFSP among smallholder farmers. As noted by Kilwinger et al. [25], sources of vines have received little research attention.
It was therefore necessary to undertake this study and model adoption of OFSP among smallholder farmers in Malawi with insights from the existing sources of vines. This is on account that not only seed matters, but sources of seed too are crucial [25]. The findings of this study will enable the creation of relevant policies that enable stakeholders engaged in the promotion of OFSP to adjust their approaches for increased and sustained adoption, which would ensure resilient livelihoods against climate variability and food and micronutrient insecurities. This study also contributes to the present issue of building farmers’ resilience to climate change, increased uptake of adaptive improved crop varieties, and overall improved livelihoods by adding an empirical analysis on determinants of OFSP adoption in Malawi, which has not been done to date [22]. Above all, this study adds to the existing technology adoption literature by filling the knowledge gap on how various sources of vines influence the decisions of farmers to adopt OFSP in Malawi and beyond.

Sweet Potato Seed Systems

Sweet potato is a runner plant with a creeping stem that contains internodes. Sweet potato stems, commonly known as vines, usually grow prostrate and expand extensively along the ground—even though some can erect or semi-erect [26]. Despite being a flowering plant, sweet potatoes barely produce botanical seeds that can be used for propagation, and it is hence commonly propagated using stems and sometimes also the tubers. It is therefore known as a vegetatively propagated crop (VPC) [24]. In the case of VPCs, seed refers to these vegetative planting materials. The advantages of using vegetative materials for propagation tend to be outweighed by the disadvantages. According to Ref. [27], vegetative materials are often very bulky and perishable, hence making them difficult to store. Further, vegetative materials also have low production ratio since a parent plant produces less planting materials—unlike botanical seeds. Additionally, vegetative materials permit easy accumulation and transfer of pests and diseases [21,27,28]. Ref. [29] also noted that vegetative materials are prone to seed varietal degeneration since farmers reproduce the same material for seasons.
The nature of VPCs makes the seed systems of such crops quite distinct from the seed systems of other crops [29]. McGuire [30] defined seed systems as the various ways in which farmers obtain seed. These systems are categorized into two extremities with formal systems at one end and informal seed systems at the other end [31,32]. Farmers can get seeds from the formal systems through seed companies, agro-dealers, the government, or NGOs [31]. On the other hand, informal seed systems are farmer managed systems that provide the farmers and their communities with seeds of preferred varieties whose production and distribution is supported by customary practices and regulations [33,34]. With informal seed systems, farmers either use seeds from their own farms or acquire informally from relatives, friends, neighbors, or local markets [31,32,35,36,37]. The overall objective of functional seed systems is to ensure that seeds are timely available and accessible to smallholder farmers in preferable quantities, qualities, and varieties [30,32,34,38]. Given the two systems, farmers tend to use different sources of seeds to meet their seed requirement even though farmers in many countries get most of their seeds from informal sources [31,34,38].

2. Materials and Methods

2.1. Study Area and Data

The study employed a multi-stage sampling method to randomly select 721 farming households from 4 districts, as illustrated in Figure 1. The study used Cochran formula to determine the sample size. This was on account that the proportion of households that were reported to have adopted OFSP was known. The parameters used included a margin of error (e) of 0.05, the estimated proportion of the population that adopted OFSP (p) was 0.54, and the relevant critical z value (z) of 1.96. With appropriate sample size statistical adjustments, the estimated sample size was 823 households. However, only 721 households were reached due to some constraints. The estimated number of households per district, as reported in the 2018 National Population Census report by the National Statistical Office, served as the basis for allocating the sample across the districts using the probability proportion to size (PPS) technique. Although the four districts have a total of 686,923 households, the study only focused on the Extension Planning Areas (EPA) where the Sustainable Food Systems in Malawi (FOODMA) Programme was implemented.
A structured household questionnaire was programmed in a digital data collection platform called Survey Solution for collecting quantitative cross-sectional primary data from the sampled households. For triangulation purposes, the study used semi-structured checklists to collect qualitative data through 11 focus group discussions and 10 key informant interviews. Quantitative data was analyzed using a statistical package called STATA version 17 while qualitative data was analyzed using thematic analysis technique. The descriptive analysis largely used bar charts and histograms to represent the proportions of different categories across the variables of interest.

2.2. Theoretical and Conceptual Frameworks

The study was based on the random utility theory, which posits that a farmer’s decision to adopt a technology is made to maximize expected utility [39]. As rational economic agents and decision makers, farmers adopt a technology that they feel will improve their status quo in one way or another [39,40]. As such, a farmer’s decision whether to adopt or not adopt a given technology conforms strongly to the general theory of utility maximization [41]. Therefore, a farmer is expected to adopt a new technology if the utility derived from adopting the technology is greater than the utility derived from not adopting the technology.
Representing a farmer’s expected utility derived from adopting OFSP as U a and that of not adopting as U n , and letting Y i * represent the latent variable as the difference between the two utilities, i.e., U a and U n , yields the following:
Y i = 1   i f   U i a = β a X i + μ a > ( U i n = β n X i + μ n ) = Y i * > 0 0   i f   U i a = β a X i + μ a < ( U i n = β n X i + μ n ) = Y i * < 0
where U i a and U i n are the ith farmer’s expected utilities of OFSP adoption decision and X i represents a vector of the factors that determined the level of the expected utilities. β a and β n are the coefficients to be estimated while μ a and μ n are error terms with a zero mean and whose distribution is assumed to be identical and independent [42]. Y i is simply the observed decision, which takes the value of 1 if a farmer adopts OFSP and a value of 0 if a farmer does not adopt. However, the process of maximizing the expected utility is subject to budget, time, and production technology constraints [43,44].

2.3. Estimation Strategy and Empirical Model

2.3.1. Effect of the Existing Sources of Vines on Adoption of OFSP

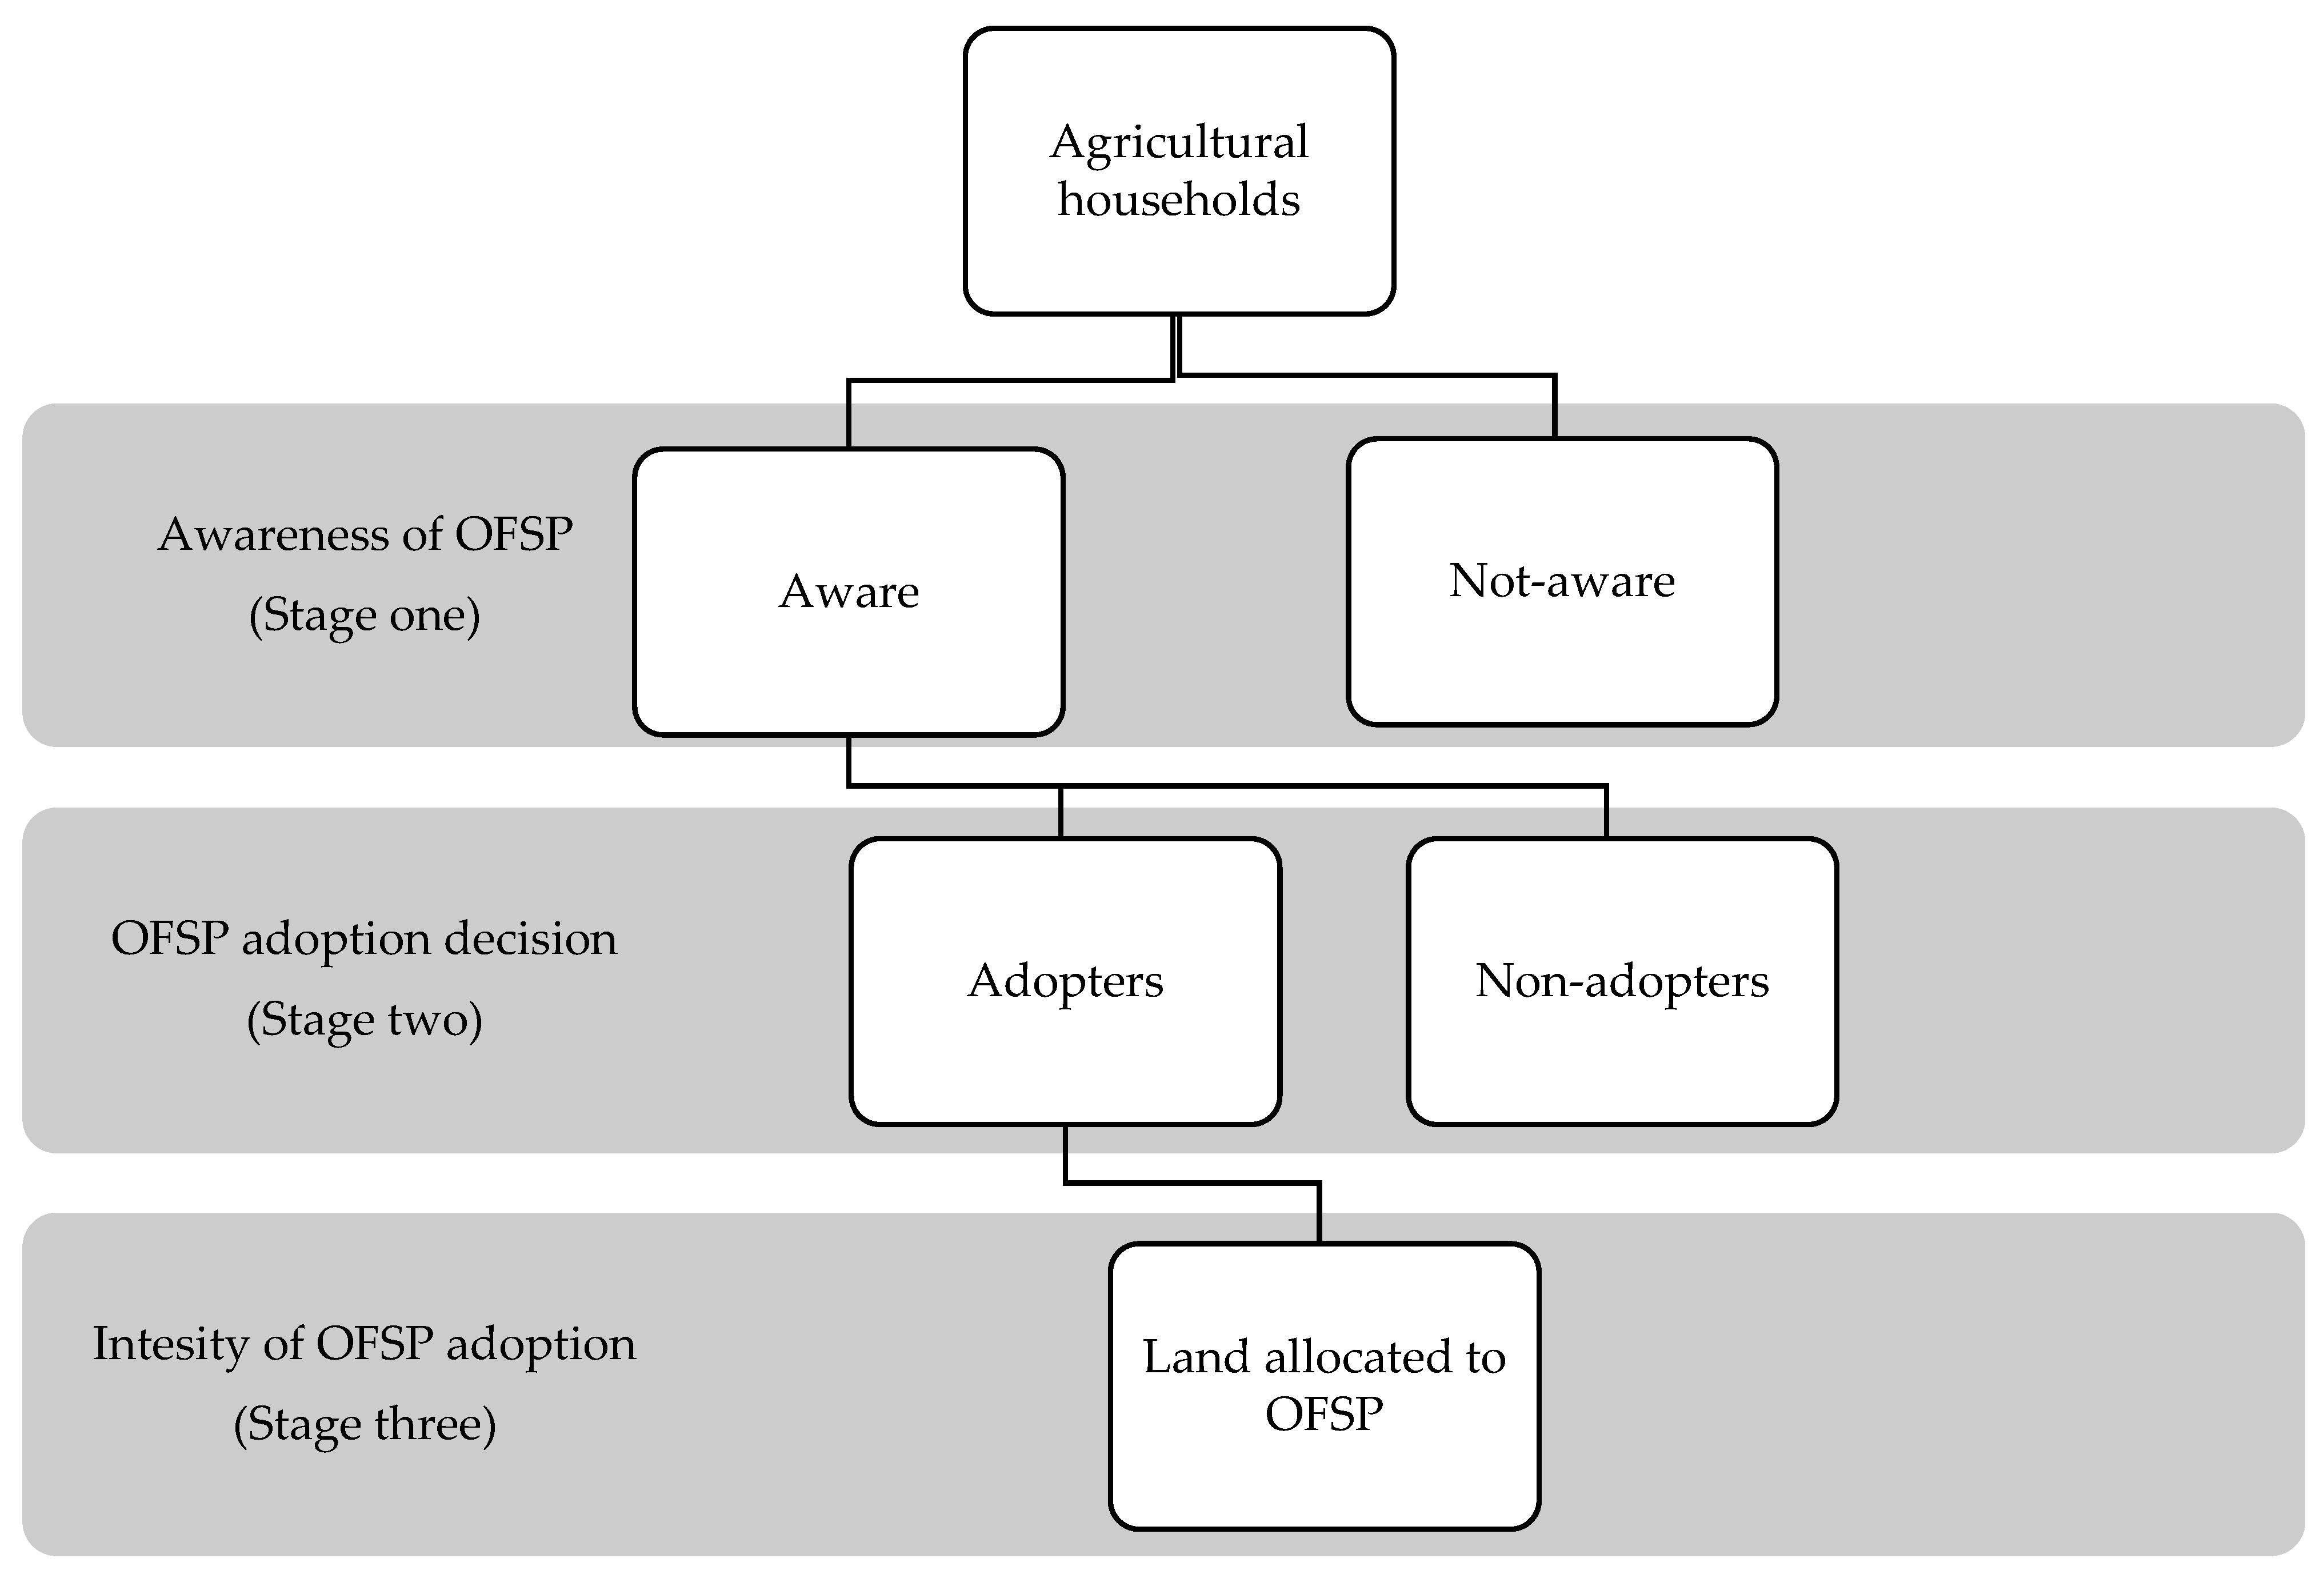
To analyze the influence of the existing seed sources on the adoption of OFSP among smallholder farmers in the study areas, the study modelled adoption as a three-stage process. The study hypothesized that a farming household is first either aware of OFSP or not aware [45]. If the household is aware, it must then decide whether to adopt OFSP or not. If it decides to adopt and produce OFSP, it must then determine the amount of land to be allocated to OFSP [45,46,47]. As such, the study modelled and analyzed OFSP adoption as a three-stage process, as illustrated in Figure 2. In all the three stages, the study hypothesized that the existing sources of vines would play a critical role in influencing the outcome variables, while controlling for demographic, institutional, farm-specific factors, among others [48,49,50].
As illustrated in Figure 2, of the total sampled agricultural households, some farmers were aware of OFSP while others were not. Likewise, among the farmers that were aware of OFSP, some had adopted OFSP while others had not. Given these two scenarios, the study anticipated zeros for some observations. Conditions such as this require appropriate statistical tools that can allow for unbiased and consistent estimates. Hence, limited dependent variable estimation techniques are recommended as appropriate econometric approaches [51,52,53,54,55,56,57]. Common examples of such models as used in literature include Tobit model by Ref. [52], double-hurdle models by Ref. [53] and Ref. [54], and triple-hurdle model by Ref. [51]. The triple hurdle model by Ref. [51] modified the Heckman Selection model by adding another stage while addressing the non-randomness that occurs when moving from one stage to another [57,58]. Following the adoption process in Figure 2, this study therefore employed the triple-hurdle model to analyze the influence of the existing sources of vines on smallholder farmers’ decision-making process with regard to the adoption of OFSP in Malawi.
To assess the factors that determined a smallholder farmers’ awareness of OFSP in stage one and then adopt OFSP in stage two, a Probit model was used in both stages [47]. This was because the dependent variables yielded two outcomes for each stage. The intensity of OFSP adoption in this study was modelled as a continuous variable since it involved positive values of land in the acres allocated to growing OFSP. For this third stage, the study adopted a log-normal model that measures continuous outcomes [51,59], but also considered fractional Probit, a fractional response model as used by Ref. [46] for robustness check.
All the models in the three stages require the use of Maximum Likelihood Estimation. The first two stages used Probit, which employs full likelihood functions while the third stage uses log-normal model, which uses the log-likelihood function. As noted by Refs. [51,59], all the three stages use maximum likelihood estimation (MLE), and hence the three stage likelihood functions can be integrated into one joint but separable likelihood function specified as:
f ( y 1 , y 2 , y 3 x 1 β ,   x 2 γ ,   x 3 δ ) = 1 Φ ( x 1 β ) 1 y 1 = 0 Φ ( x 1 γ ) 1 Φ ( x 2 γ ) 1 y 2 = 0 Φ ( x 2 γ ) ϕ log ( y 3 ) x 3 δ / σ y 3 σ 1 y 2 = 1 1 y 1 = 1  
where y 1 = 1 if the household is aware of OFSP, and hence overcomes the first hurdle, and y 1 = 0 if otherwise; y 2 = 1 if the household adopts OFSP and overcomes the second hurdle, and y 2 = 0 if otherwise; y 3 is the continuous variable for land allocated for OFSP and is positive after thee household passes the two hurdles i.e., y 1 = y 2 = 1 such that y 3 > 0 . On the other hand, β , γ , and δ are vectors of parameters for the first, second, and third stages, respectively, while x 1 , x 2 , and x 3 are vectors of determinants for y 1 , y 2 , and y 3 , respectively. Lastly, Φ and ϕ are the standard normal cumulative distribution and the standard normal probability density functions, respectively, whereas σ represent the standard deviation for the random variable y 3 .
The empirical model was therefore specified as:
Y i j = β 0 j + β 1 S S Y j + ψ j + μ i j ,     μ i j = ~ n 0,1 ,   σ 2 ;     j = 3 ,   i = 1 , . . . , n  
where Y i represents the dependent variable for a given equation/stage j, β 0 j denoted intercept term estimated for a given equation/stage j, β 1 S S Y j represents the coefficient of the variable of interest, existing seed systems (sources of vines as defined by Ref. [30]) for a given equation/stage j, ψ j represents a vector of other explanatory variables together with their parameters estimated, and finally, μ i j represents the error terms with their respective assumptions for a given stage j.
The models were first run separately as recommended by Ref. [51]. Thereafter, the models were run jointly using the conditional mixed process (CMP) estimator with selection on account that the three equations were correlated for an individual, representing decisions that are potentially interdependent [39,60]. CMP estimator is similar to seemingly unrelated regression (SUR) estimator [60]. The CMP first estimates the individual models separately and then jointly. In this study, estimating the models separately, as recommended by Ref. [51] yielded almost identical results as when the models were estimated jointly following Ref. [60]. However, interpretation and discussion have been based on the results of the triple hurdle model whose models were estimated separately following Ref. [51].
Following other studies [51,59,61], the study predicted inverse mills ratios (IMRs) around the probability of being aware of OFSP (IMRAwareness) and around the probability of adopting OFSP (IMRAdoption). The idea behind IMR is to test the hypothesis that the error terms for the three equations are conditionally uncorrelated as applied in the Heckman test for sample selection [51,57]. The predicted IMRs were then included as covariates in the subsequent models against the null hypothesis that the error terms of these three models were conditionally uncorrelated. This means that IMRAwareness was included in the adoption model while the IMRAdoption was included in the intensity of the adoption model.
Including the IMRs in the subsequent models demands that exclusion restriction is imposed on at least one independent variable [51,62,63]. In the first stage, the study imposed an exclusion restriction on the main occupation of the household head, which was significant and relevant in the awareness model but insignificant and assumed irrelevant in the adoption model, in the context of this study. In the second stage, the study imposed an exclusion restriction on club membership, which was significant and relevant in the adoption model but insignificant and assumed irrelevant in the intensity of adoption model, in the context of this study.

2.3.2. Effect of the Existing Sources of Vines on Seed Security of Sweet Potato Farmers

To gain deeper insights into the effect of the existing sources of vines on sweet potato smallholder farmers’ seed security and the adoption of OFSP, the study assessed the capacity of the existing sources of vines in ensuring the sweet potato farmers’ seed security [30,32,38]. Unlike food security, there is no universally recognized scale or indicators of measuring seed security [35]. However, there are Seed Security System Assessment (SSSA) guidelines developed by the FAO [36] and CIAT [37]. Guided by the two SSSA guidelines, the study therefore developed a scale to assess the capacity of the existing sources of vines in ensuring farmers’ seed security.
The SSSA guidelines consider a number of elements when defining seed security: availability, accessibility, varietal suitability, quality, and/or resilience. Largely, the study adapted the concept of seed security pentagon by FAO [36] in normal and extreme weather circumstances. Each of the five sides of the seed security pentagon represents an element of seed security. Ideally, the seed security pentagon is even, having equal sides for each element of seed security, signifying an equal weight for each element [36]. However, FAO [36] points out that in practice, farmers might place varying weights to these seed security elements depending on the conditions.
The study however adapted the seed security elements to reflect the capacity of the existing sources of vines while controlling for other conditions such as droughts. The capacity of the existing sources of vines was assessed based on four pillars of seed security: seed availability, seed access, varietal suitability, and seed quality. This was because there was no reported extreme weather or social event in the study area to justify the inclusion of the element of resilience. Farmers were asked whether vines from source were adequate and available at the right time (seed availability), of preferred variety (varietal suitability), affordable (seed access), and of good quality (seed quality). The study therefore used these five critical components of seed security to estimate a Seed Security Experience Score (SSES) based on one year recall period. In order to standardize the scale, the study assigned an equal weight to all five components. The SSES was computed as presented in Equation (4):
S S E S = i = 1 5 X i W i  
where S S E S represents the seed security experience score for a household; W i represents the weight assigned to each of the five components, which in this case is 0.2. X i represents the binary component, which takes the value of 1 if the farmer considers the corresponding variable as met, and 0 if otherwise as follows: X 1 = 1 if the farmer considered vines from the source to be adequate, 0 if otherwise; X 2 = 1 if the farmer considered vines from the source to be of good quality, 0 if otherwise; X 3 = 1 if the farmer considered vines from the source to be available at the right time, 0 if otherwise; X 4 = 1 if the farmer considered vines from the source to be of the desired variety, 0 if otherwise; X 5 = 1 if the farmer considered vines from the source to be affordable, 0 if otherwise. The possible scores range between 0 and 1, with 0 representing farmers that are highly seed insecure and 1 representing farmers that are highly seed secure.
Table 1 below presents and defines the variables used in the triple hurdle models.

3. Results

3.1. Descriptive Results

3.1.1. Awareness, Adoption, and Intensity of Adoption of OFSP

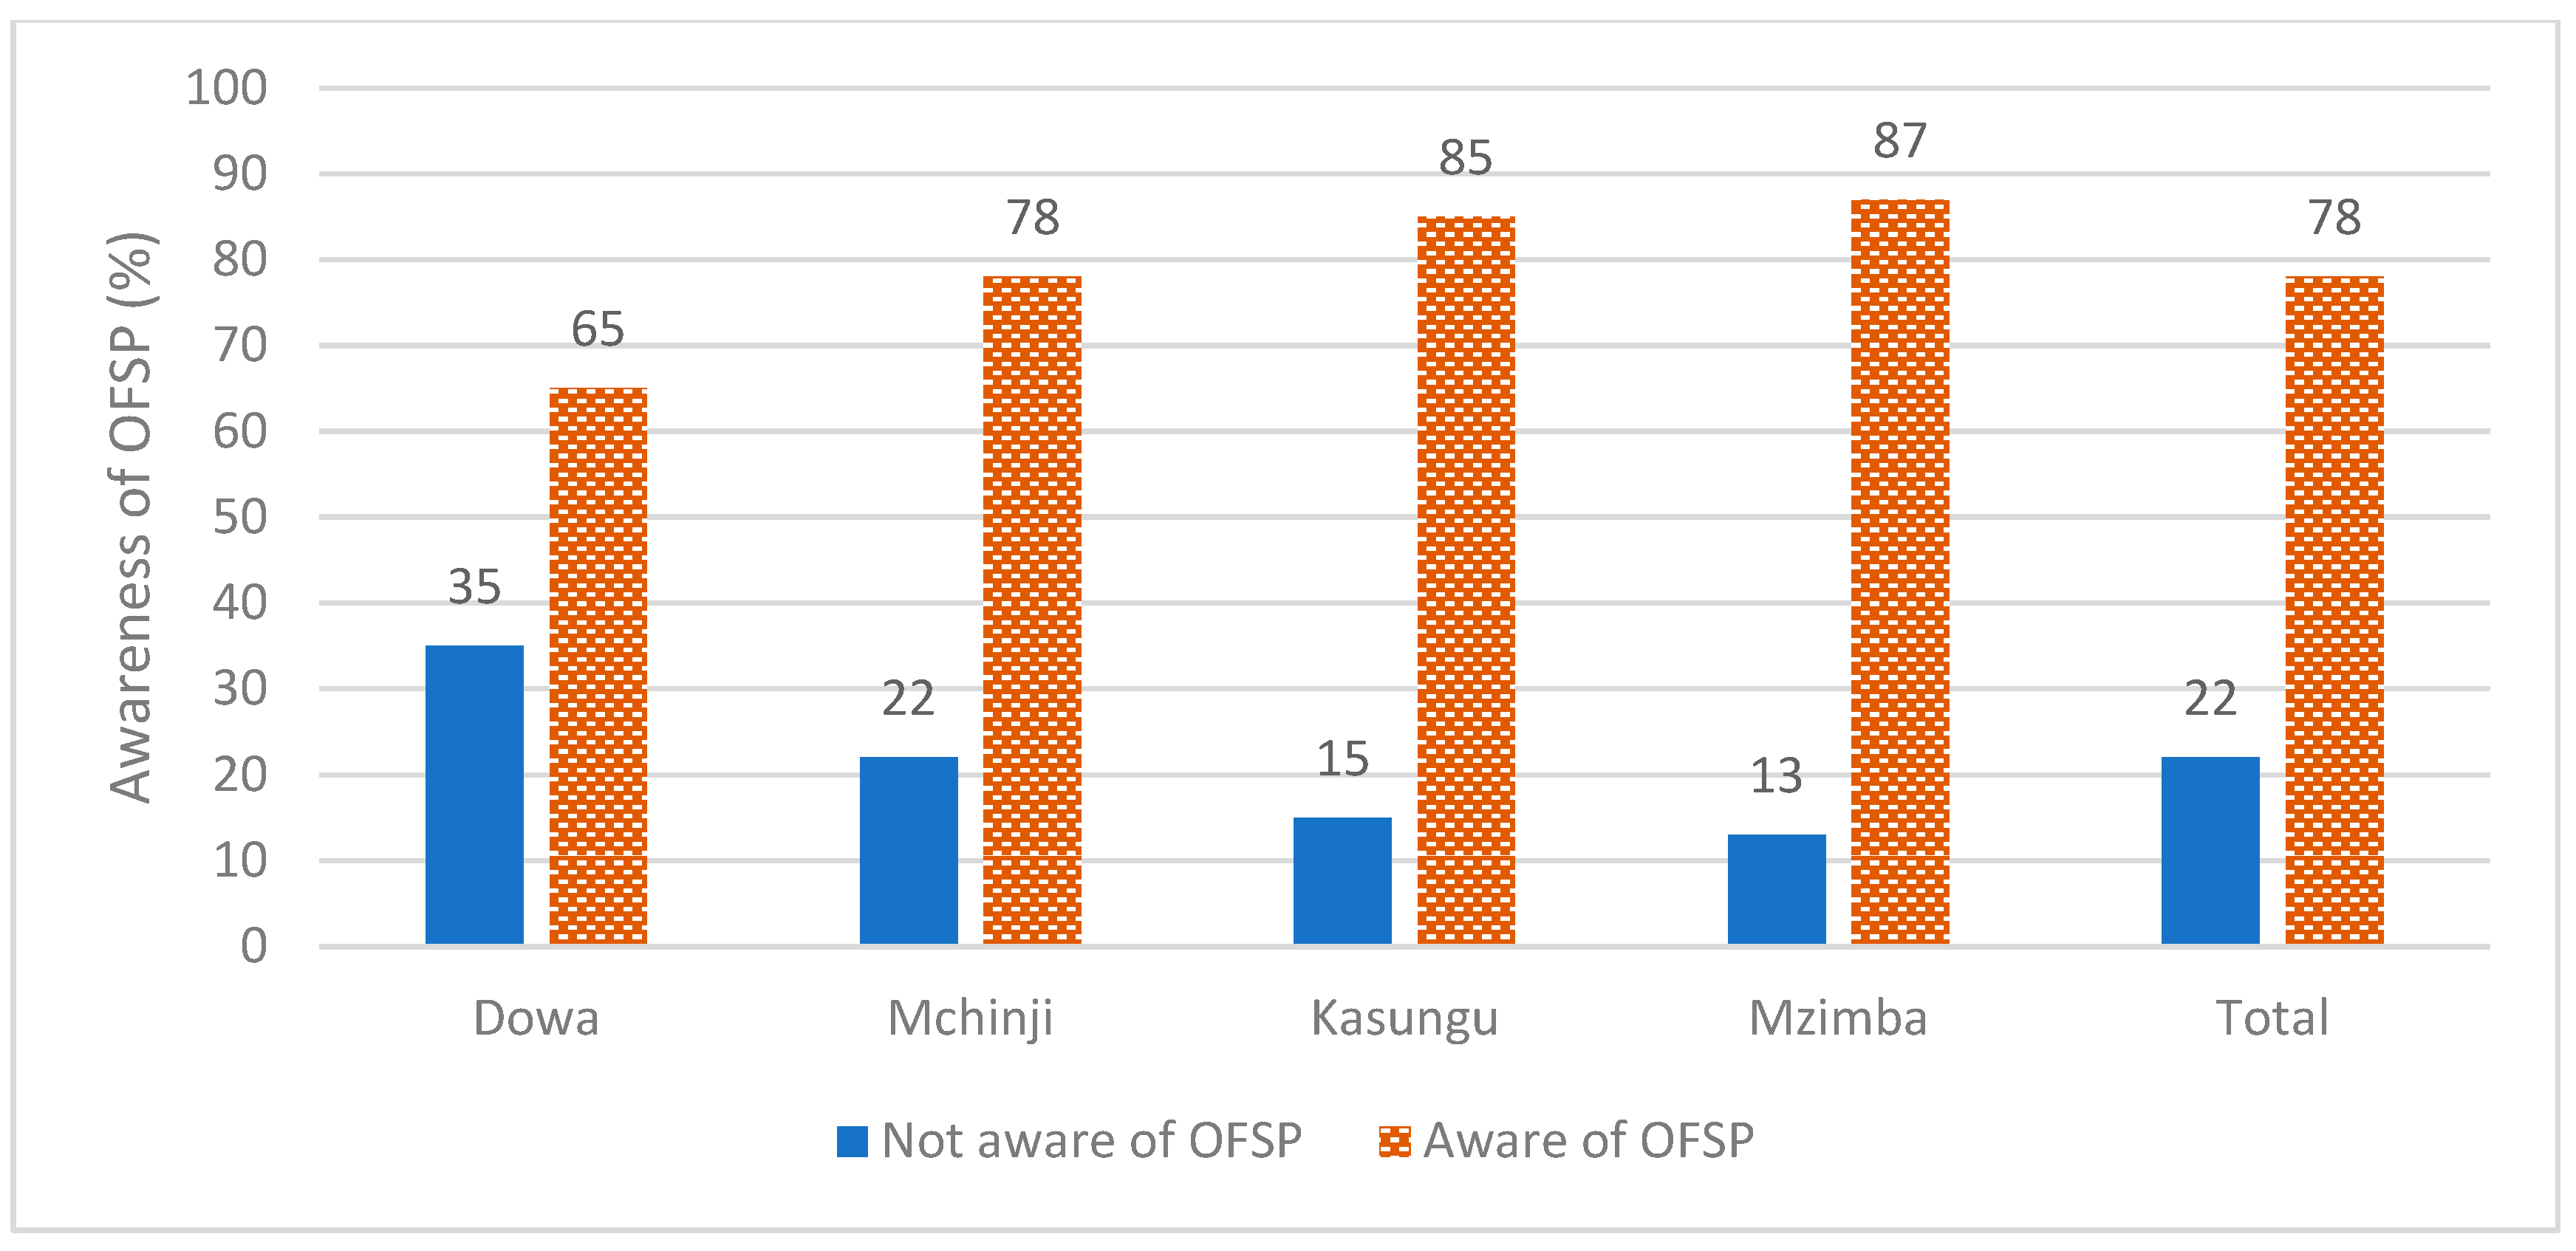
The study found that 78% of the sampled households were aware of OFSP while 22% were not aware of the bio-fortified sweet potato variety (Figure 3).
Results in Table 2 show that 35% of the non-adopters did not adopt because they were not aware of the crop whereas 65% did not adopt OFSP despite being aware of the variety. Adoption was more likely for farmers that were aware.
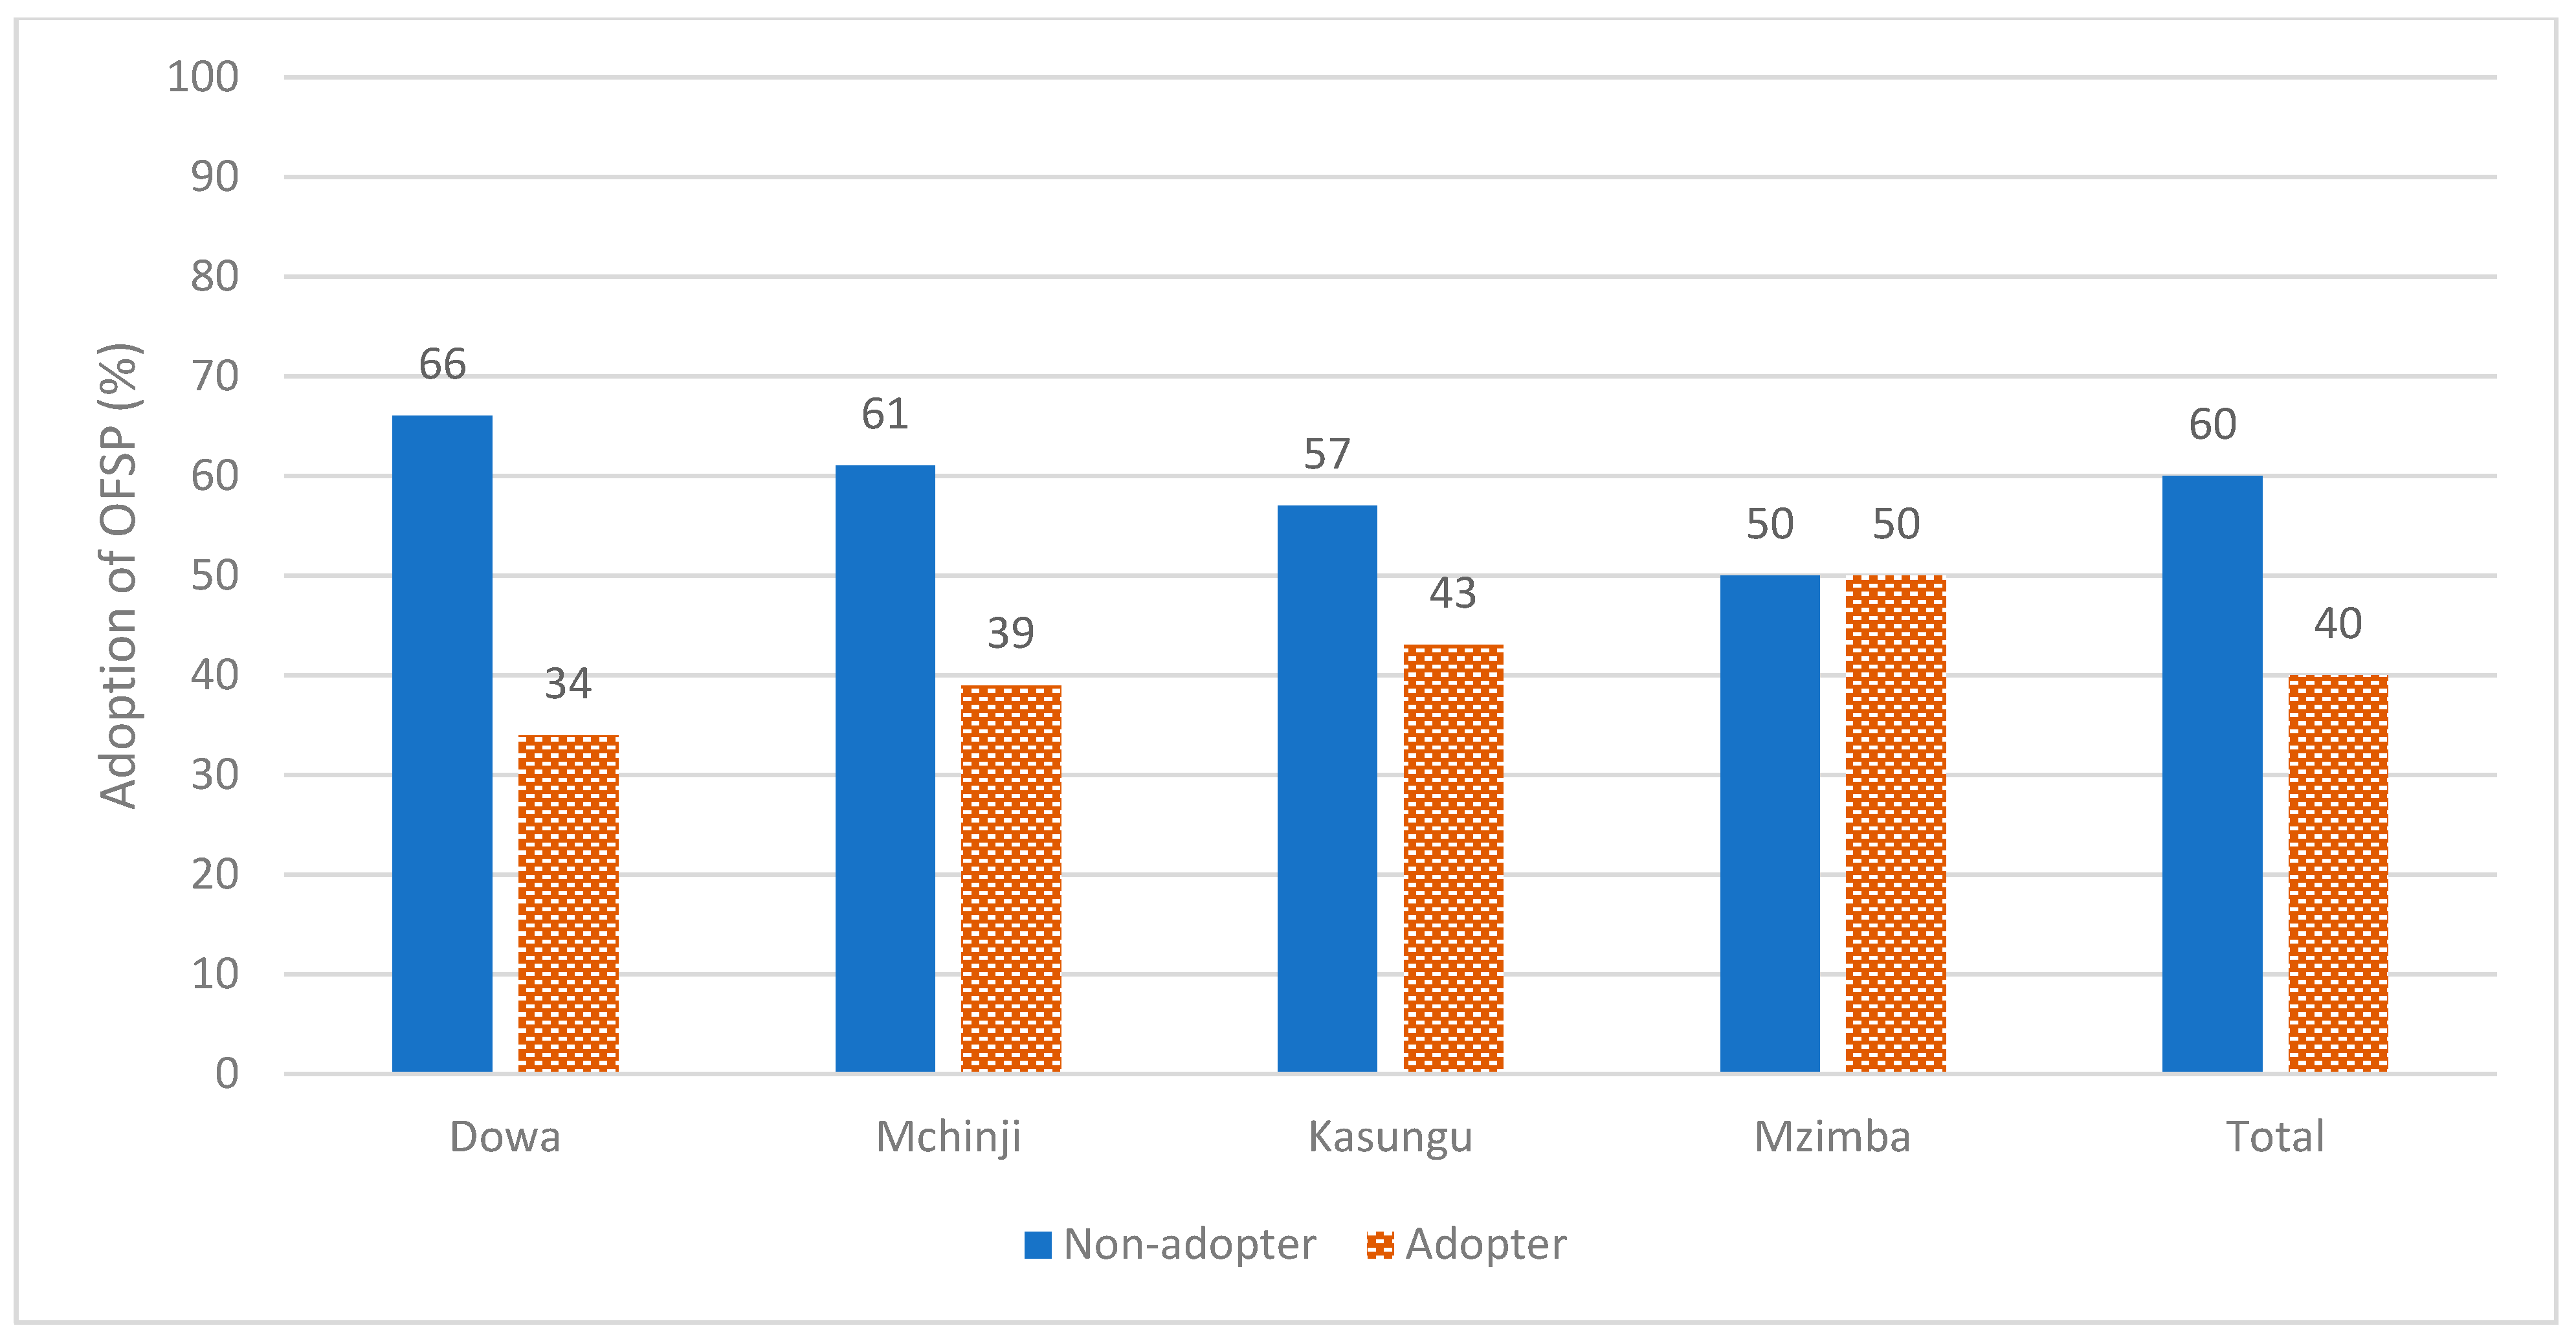
Further, the study found that 40% of the sweet potato farming households that were sampled for the study adopted OFSP while 60% did not adopt OFSP (Figure 4).
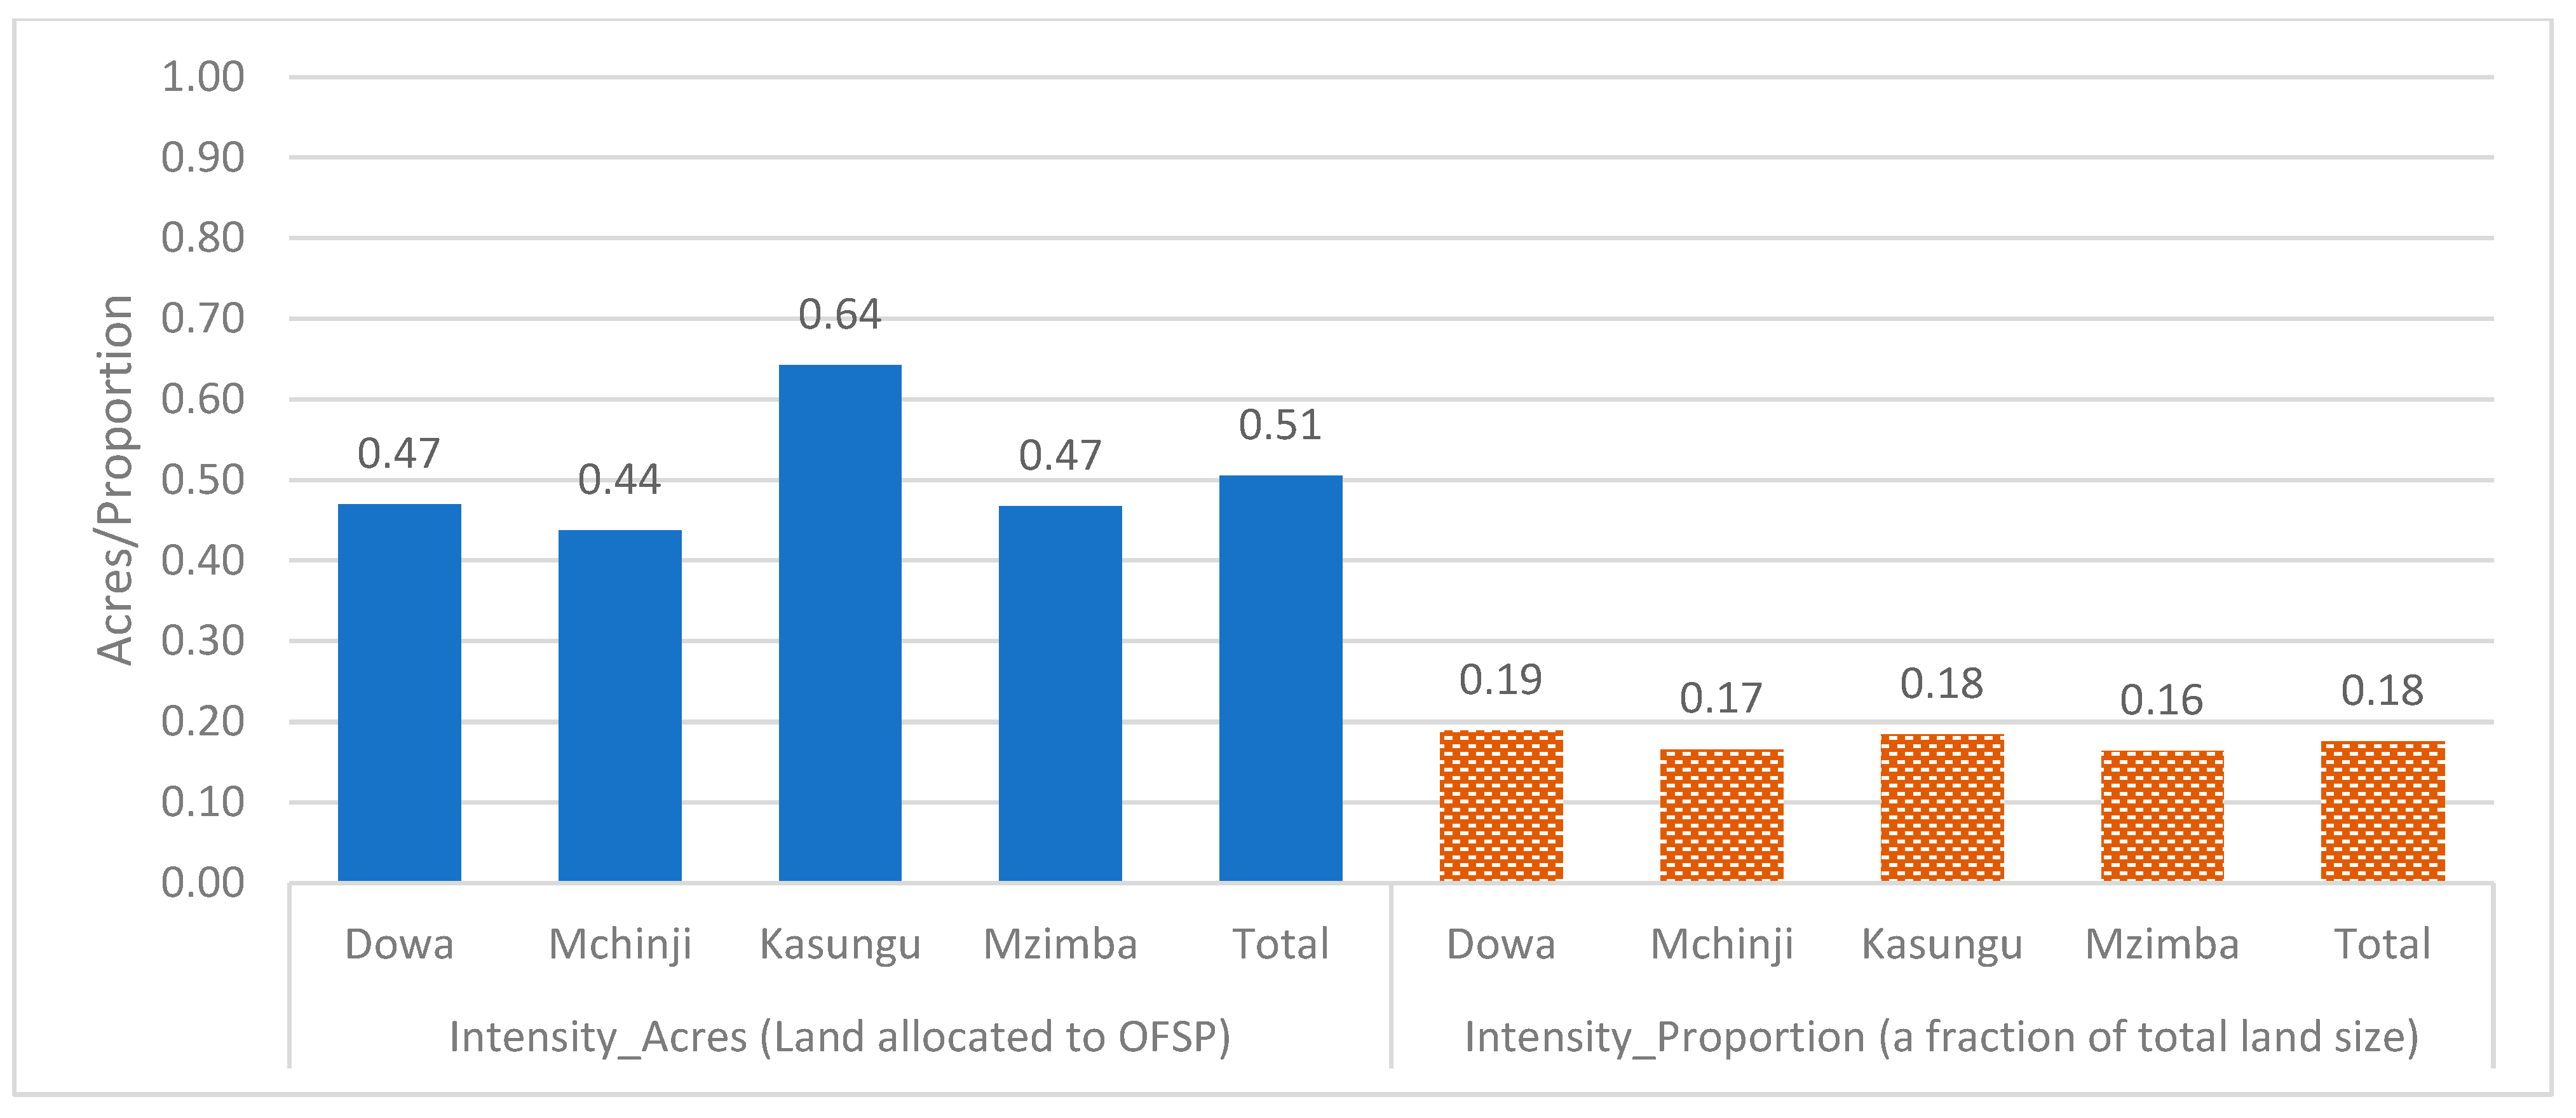
In the context of this study, the intensity of adoption of OFSP means acreage of land that is under OFSP cultivation. It has also been defined in terms of the amount or proportion of land allocated to OFSP. As such, to intensify OFSP adoption in this study means the decision to increase acreage allocated to OFSP (Figure 5). The intensity of adoption has been used as a measure of smallholder farmers’ level of commitment and investment channeled towards production of OFSP.
Results in Figure 5 show that the average land allocated to OFSP for the sampled households was 0.51 acres, which translated to a land share of 18% when measured as a proportion of total land size.

3.1.2. The Existing Sources of Vines

The study hypothesised that farmers would source their vines from either their own vine preservation, friends and relatives, local market, NGOs or projects, or the government or extension service officers. The sources were categorised into formal (NGO/Project and Government) and informal (own vines, friends and relatives, and local markets).
The results in Table 3 show that 42% purchased their vines (with money or equivalent), 37% relied on own vines, and 22% received free vines from friends and relatives. This means that, in the 2021/2022 growing season, all adopter and non-adopter households sampled for the study relied on informal sources of vines. This entails that the sweet potato sector in Malawi is largely dominated by informal sources of vines.
However, farmers indicated that they got their first OFSP vines from formal sources such as NGOs through projects, and government through extension workers. The Government of Malawi (GoM), through the Department of Agricultural Research Services (DARS) in collaboration with International Potato Centre (CIP) and other partners, bred and released the first OFSP vines in 2009. In order to promote OFSP in the country, GoM later embarked on a national wide OFSP vine distribution to smallholder farmers, through the Agricultural Wide Sector Approach (ASWAP). NGOs such us the International Potato Centre (CIP) and others complemented the efforts of the government by implementing interventions that promoted OFSP through breeding and dissemination of new OFSP varieties to farmers, with particular focus on the drought-prone areas in the southern region. In some cases, very few farmers received the vines and passed them on to others for free upon multiplication. In other cases, a community nursery was established where vines were communally multiplied and later shared in smaller quantities among members. However, farmers indicated that ever since they got the first vines from either government or NGO projects, no farmer has accessed vines from these formal sources again. As such, all vines used in 2021/2022 were recycled. The average age of the OFSP vines farmers used was 6 consecutive seasons with minimum and maximum years of 5 and 10, respectively.

The Existing Sources of Vines and Farmers’ Seed Security

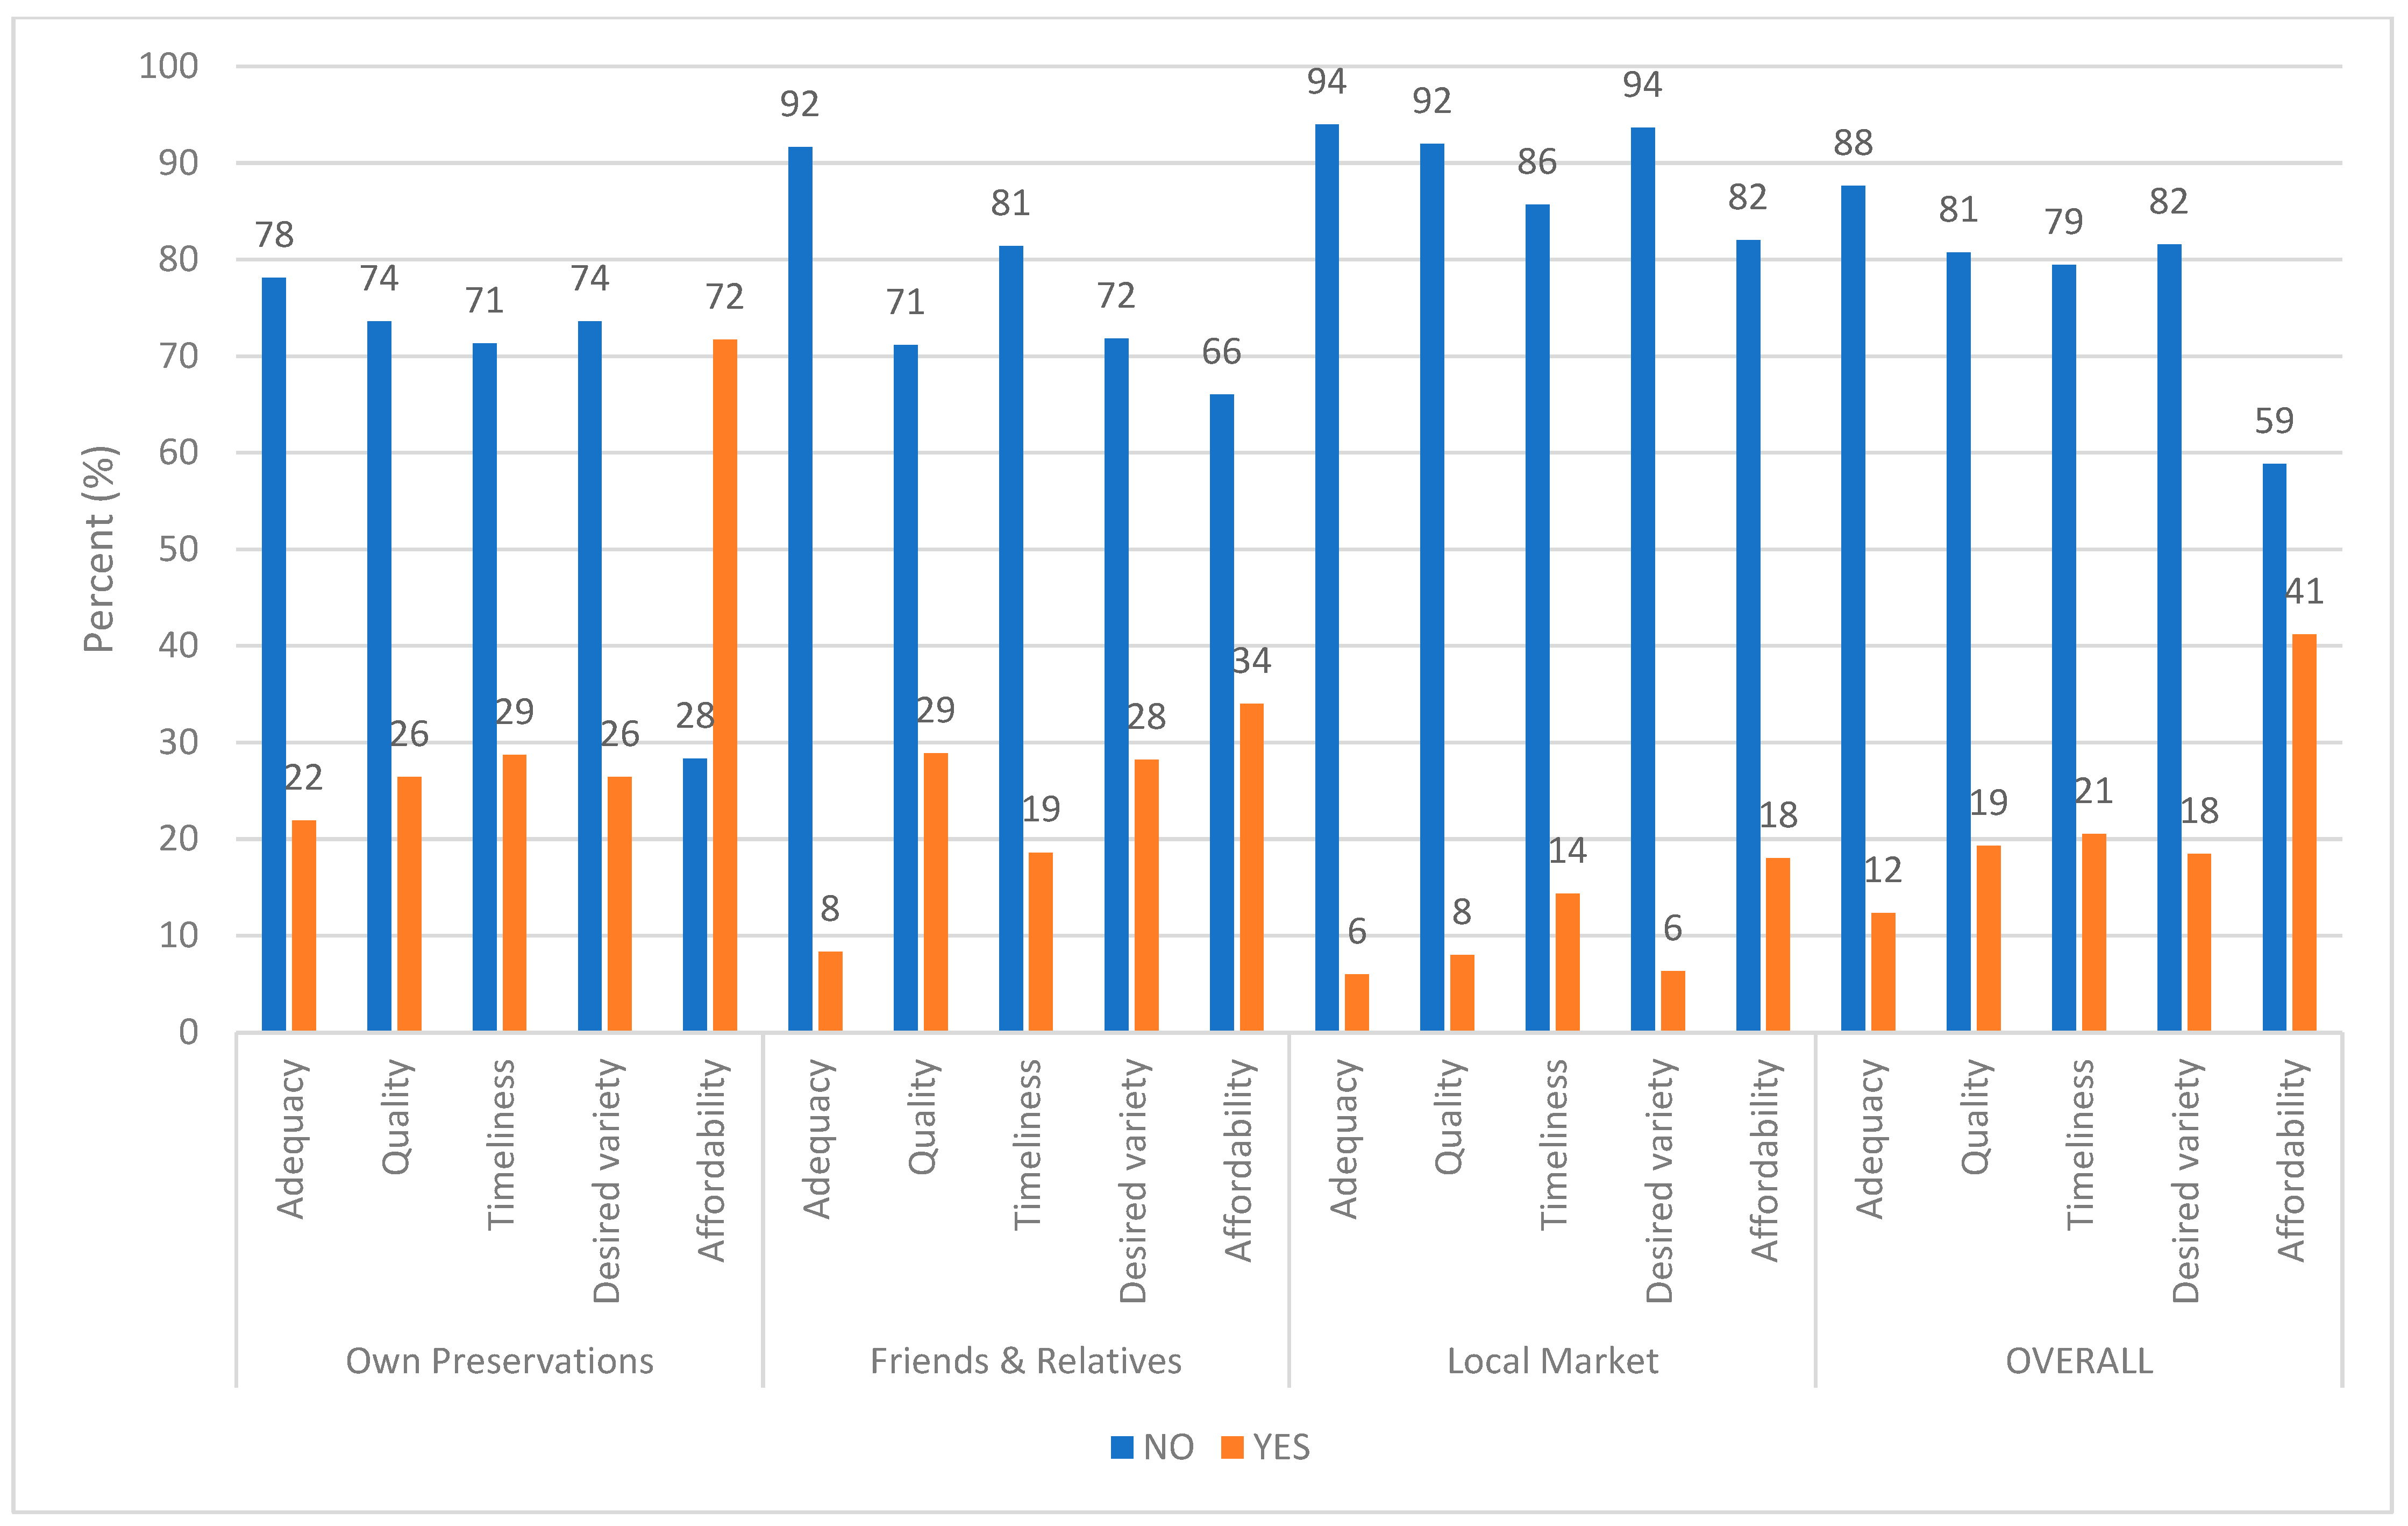
Figure 6 presents the farmers’ responses to the five yes or no seed security statements that were used in the assessment. All results were significant at 1% using Chi-square statistic.
Overall, the results indicate that the majority of the farmers did not consider vines from the existing sources to be adequate (88%), of good quality (81%), timely (79%), of desired variety (82%), nor affordable (59%). The trend was similar across the specific sources. However, it is worth noting that a majority of the farmers that used their own vines (72%) found the vines from the source to be affordable. Unlike the other sources, the proportion of farmers who considered the vines not to be favorable were relatively higher for local market in all the five components of assessment. In terms of quality of vines, the study established that all vines used by the farmers were recycled for an average of six years. Quality of vines was therefore assessed using other attributes than the cleanliness of vines. The study also established that the majority of the sweet potato farmers got OFSP vines by chance and not choice, and that it did not matter which OFSP variety they acquired.

3.2. Household’s Socio-Economic, Demographic, Institutional Characteristics

The results in Table 4 present key socio-economic, demographic, and institutional characteristics of the sampled households disaggregated by adoption of OFSP. The results show that 78% of the sampled sweet potato farming households were male headed whilst 22% were female headed and the mean age for the household heads was 44.33 years. A total of 70% of the heads were married while 30% were single i.e., unmarried, divorced, or widowed. Sampled households had an average household size of 5.25. The findings on gender, age, and household size concur with the findings of other researchers in Mozambique, Ghana, and Nigeria [64,65,66].
Results further show that the household heads had attained an average of 6 years of formal education, and that 90% of these household heads regarded farming as their main occupation. The household heads own an average land size of 3.04 acres and attain an average annual off-farm income of MWK 314,000 (USD 301.05). The results suggest that sweet potato production in the study area is mainly done by middle-aged, married, low-income smallholder farmers with low levels of education. The results in Table 4 further show that out of the sampled households, 13% had accessed credit, 30% owned a functional television or radio, 69% belonged to a farmer club, and 49% had accessed extension services. Only 47% of the sampled households had ever participated in a nutrition sensitive agriculture. The results suggest that the sampled sweet potato households had limited access to information and financial services. However, results show that adopters were better off than non-adopters in terms of project participation, club membership, and access to extension as compared to their counterparts. These findings corroborate with the findings of similar studies done in other countries [64,65,66].

3.3. Empirical Results

3.3.1. The Triple Hurdle Estimates of the Determinants of Adoption of OFSP among Smallholder Farmers

The empirical results for the triple hurdle model are presented in Table 5. In terms of wellness of the estimated models and the subsequent results, the study carried out diagnostic tests for econometric problems, and where problems were identified, appropriate remedial measures were taken to ensure that estimates were consistent and efficient. Multicollinearity and heteroskedasticity were the econometric regression problems that were checked. The test results found no grave problem of multicollinearity among the independent variables in all the three models since variance inflation factors (VIF) were all below the cut-off point of 10. The mean VIFs were 3.08, 3.23, and 1.36 for the first, second, and third models, respectively. The diagnostic tests, however, detected the problem of heteroskedasticity in the third model (p = 0.0022). As such, the study used robust standard errors in all the models to correct this problem for valid inferences. The study considered participation in the nutrition-sensitive project to be non-random and hence endogenous. This endogeneity problem was addressed by purifying participation using the Heckman two-stage regression approach method [54,57,69].
The coefficient for IMRAwareness in the adoption model was 1.067 with a p-value of 0.116 while the coefficient for IMRAdoption in the intensity of adoption model was 0.113 with a p-value of 0.780. This meant that both IMRs were not statistically significant and hence the study failed to reject the null hypothesis. As such, the models were re-estimated while excluding the IMRs as covariates from the subsequent models [51]. For robustness check, the study used a conditional mixed process (CMP) with sample selection to run all the three models at once, as proposed by Ref. [60]. The CMP triple hurdle model produced comparable results for inference. However, interpretation and discussion were based on the triple hurdle model, as proposed by Burke et al. [51].
The study found that sourcing vines from friends/relatives was positively correlated with awareness and adoption of OFSP but negatively correlated with intensity of adoption of OFSP. Farmers that sourced vines from friends and relatives were 8% more likely to be aware of OFSP as compared to those that used own preservations, holding other factors constant, and 10% more likely to adopt OFSP compared to farmers who used vines from their own preservations, holding other factors constant. Results were significant at 5% level of significance. However, although sourcing vines from friends and relatives had a positive correlation with awareness and adoption of OFSP, it had a negative correlation with intensity of adoption. Results indicate that farmers who sourced vines from friends/relatives were 27% less likely to intensify adoption of OFSP (i.e., allocate more land to OFSP) compared to those that used vines from own preservation, holding other factors constant. Results were statistically significant at 1% level of significance.
On the other hand, the study found that sourcing vines from a local market was negatively correlated with awareness and intensity of adoption of OFSP but positively correlated with intensity of adoption of OFSP. Sourcing vines from a local market or elsewhere, with money or equivalent, had a negative correlation with awareness of OFSP. This means that farmers that used purchased vines were 5% less likely to be aware of OFSP, holding other factors constant, and results were significant at 10% level of significance. Although the results for local market source on adoption were not statistically significant, the direction of influence for local market source on adoption was positive but with a very small effect size of 0.8%. The results mean that farmers who sourced vines from local markets were 0.8% more likely to adopt OFSP compared to those that used own preservations, holding other factors constant. For intensity of adoption of OFSP, the results indicated that farmers who sourced vines a local market were 17% less likely to intensify adoption of OFSP compared to those that used vines from their own preservation, holding other factors constant. Results were significant at 10% level of significance.
The study further identified other control variables that were significantly correlated with awareness, adoption, and intensity of adoption. In line with the findings of other OFSP adoption studies done in other countries [64,65,66,69,71], the determinants of awareness include location, gender of household head, main occupation of household head, nutrition sensitive projects, decentralized vine multipliers, access to credits, distance to sweet potato farm plot, and soil fertility. In the adoption model, the key determinants included years of farming experience of household head, household off-farm income, nutrition sensitive projects, decentralized vine multipliers, club membership, access to extension, distance to sweet potato farm plot, soil fertility status, and taste. Lastly, the key determinants of intensity of adoption of OFSP included location, nutrition-sensitive projects, purpose for cultivating sweet potato (selling, or both consumption and selling), extension service, and taste.

3.3.2. The Existing Sources of Vines and Farmers’ Seed Security Experience Score

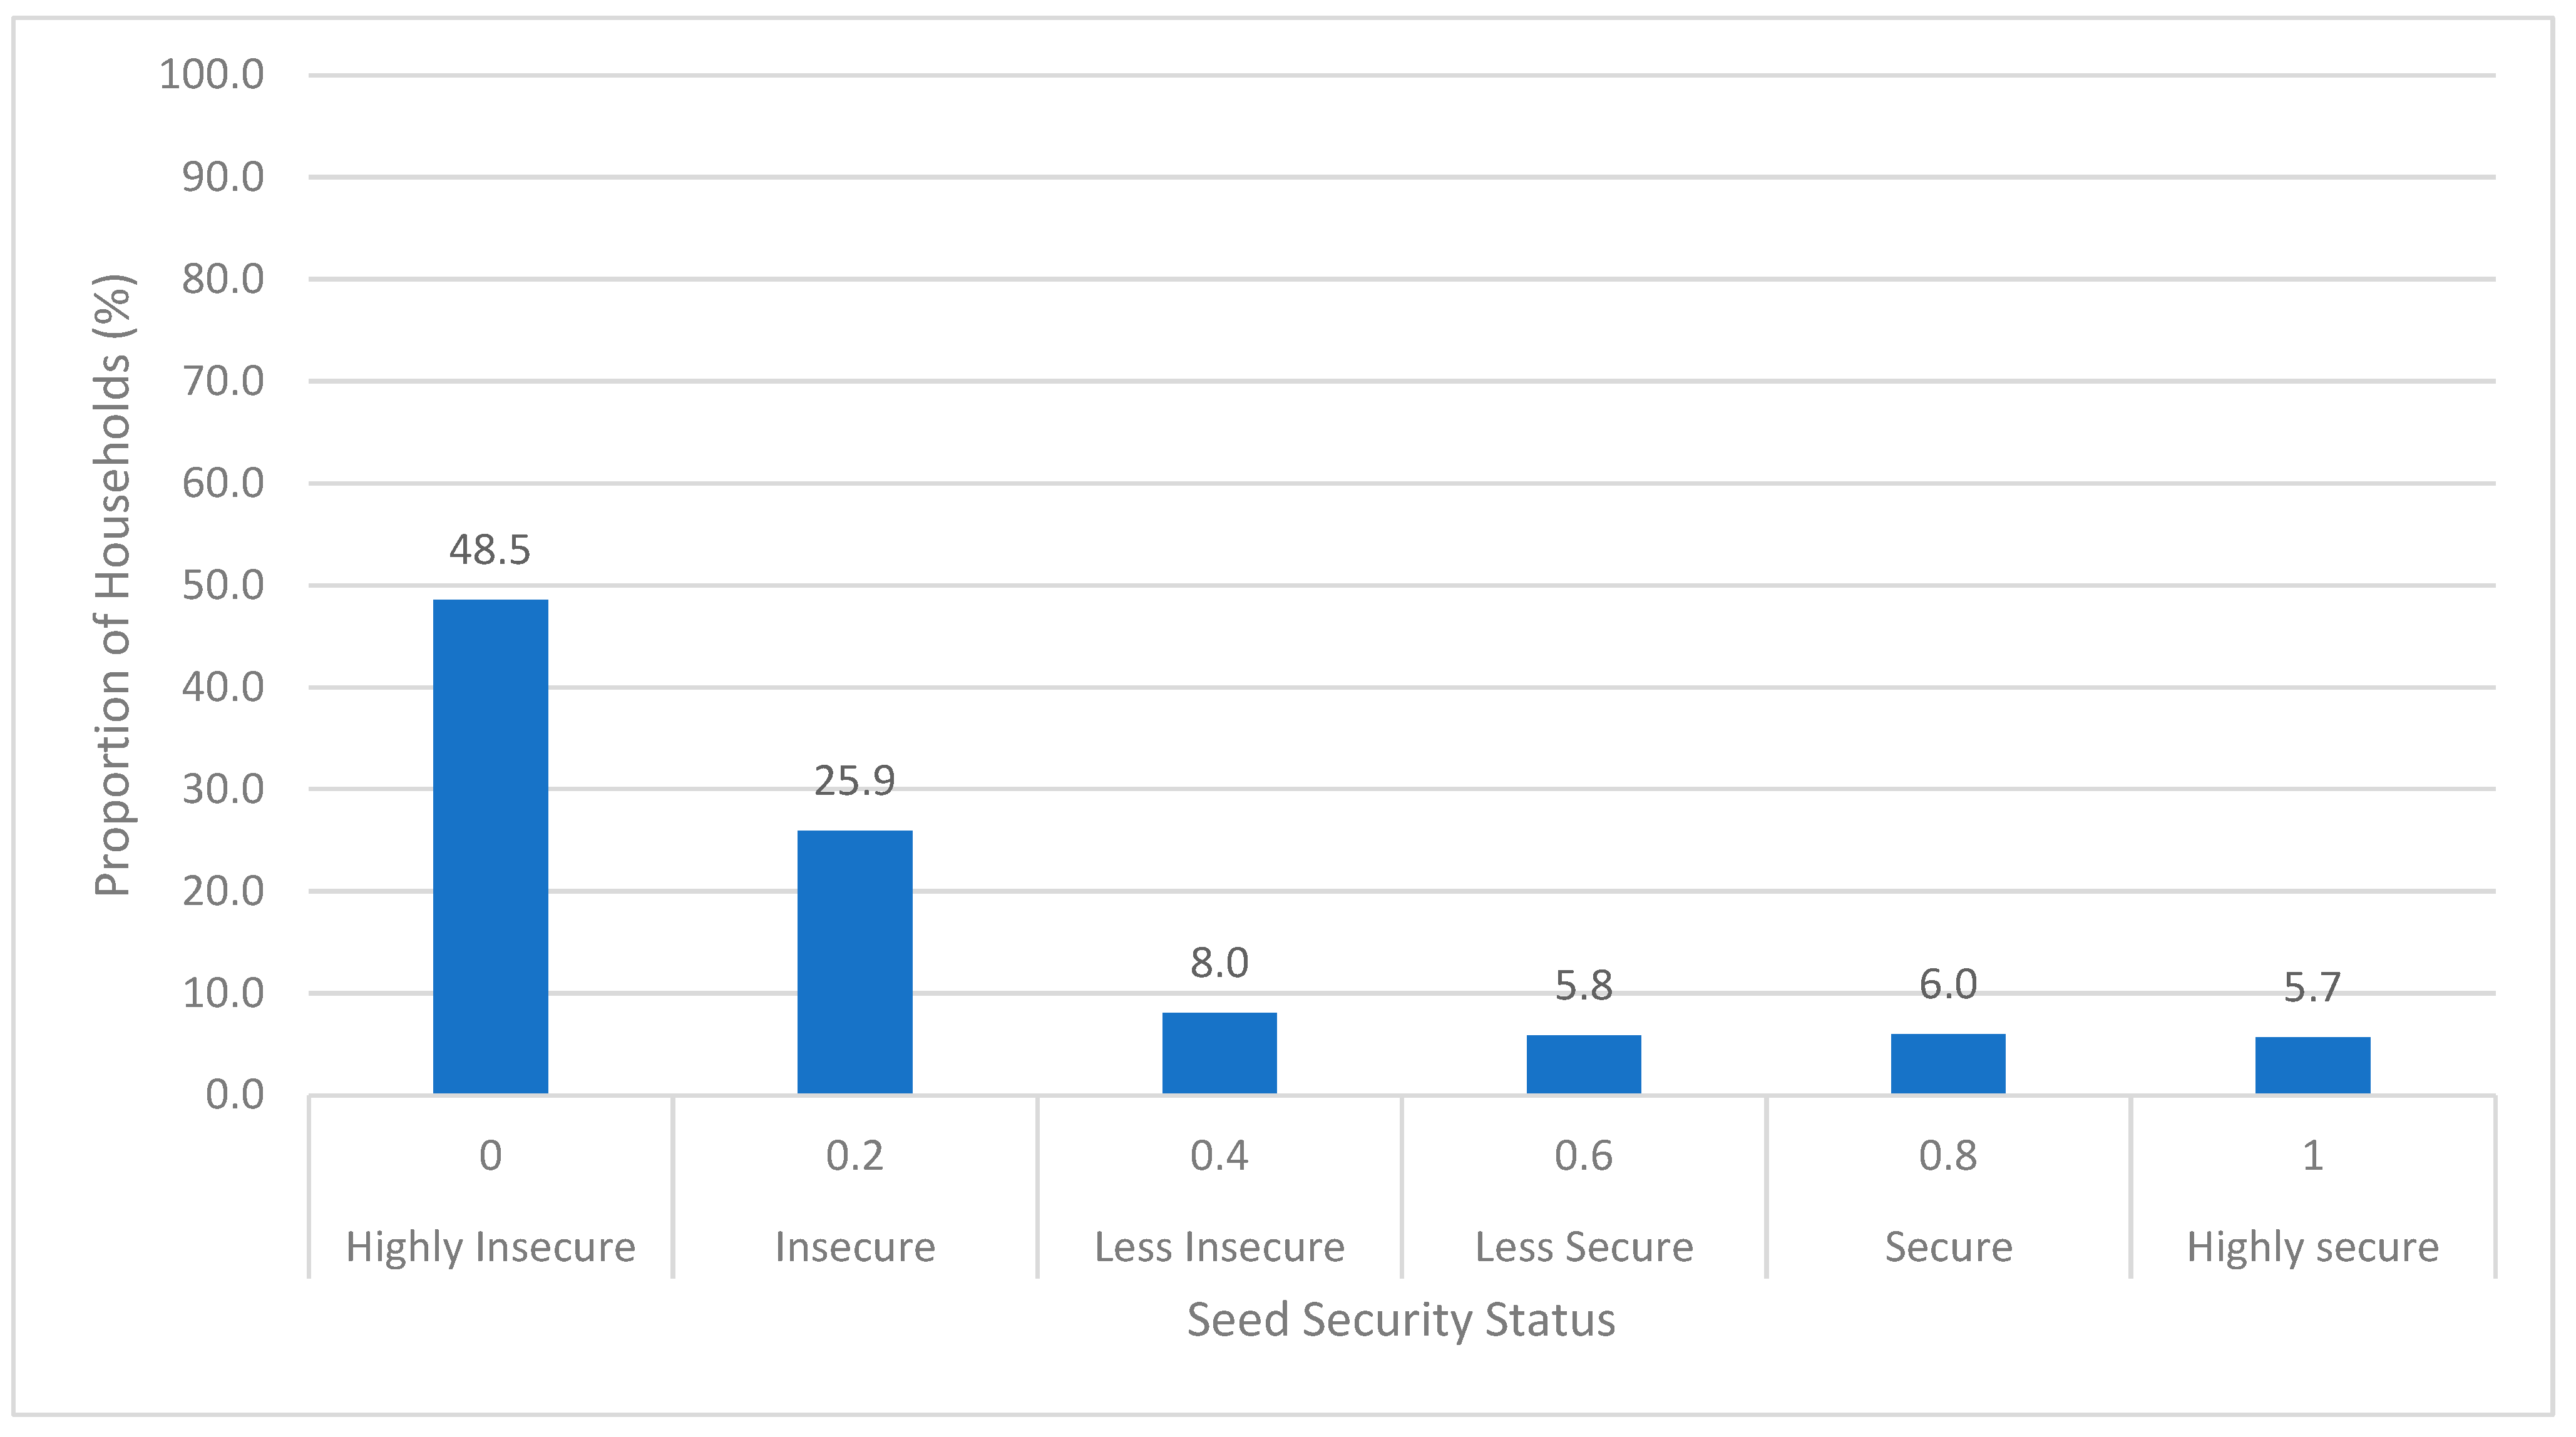
The SSES results presented in Figure 7 show that the majority of the farmers (48.5%) were highly seed insecure. These are households that considered the vines from source to be inadequate, not of good quality, not available at the right time, not of the desired variety, and unaffordable. On the contrary, only 5.7% of the households were found to be highly seed secure, having considered the vines from their main sources to be adequate, of good quality, available at the right time, of the desired variety, and affordable. Furthermore, 13.8% of the households were within the transition phase (less insecure/secure).

4. Discussion

4.1. Effect of the Existing Sources of Vines on the Adoption of Orange Fleshed Sweet Potato

Sourcing vines from friends and relatives increased farmers’ probability of being aware of OFSP as well as the probability of adopting OFSP. The positive correlation between the friends and relatives source and awareness as well as the adoption of OFSP can be explained in terms of the benefits of social capital [76,77]. Sharing is considered as a valuable social and cultural value, making friends and relatives a costless and convenient source of information about new agricultural technologies and hence increasing the farmers’ chances of being aware of OFSP. Furthermore, in terms of adoption, sourcing vines from friends or relatives, as opposed to other sources, is associated with social values and networking, making this source a convenient, trusted, less risky, and less costly source of vines, hence increasing the farmers’ probability of adopting OFSP. The results concur with the findings of Ref. [76] and Ref. [77], who indicated that farmers exchange planting materials as guided by their social norms and networks and involve less monetary transactions costs while sharing a variety of planting materials suitable for given agro-ecological conditions. The friends and relatives source, however, reduced the probability of adopters to increase the acreage of land allocated to OFSP. The negative correlation that this source had with the intensity of adoption could be due to the low capacity of the sources. The source limits the farmers’ access to vines in terms of quantity and quality, as noted by Mwangi et al. [35] and Almekinders et al. [29], hence preventing farmers from increasing the amount of land allocated to OFSP.
On the other hand, the study found that sourcing vines from a local market reduced the farmers’ probability of being aware of OFSP. This different result supports the notion by Kilwinger et al. [25] that farmers have different perceptions of the benefits and disadvantages of seed sources. The negative correlation between local market source and awareness of OFSP can be explained in terms of the opposing motives that exist between the market setup and the social networking setup [25,29]. Sources that charge money or equivalent for their vines tend to be driven by other factors and motives other than social networking values, leading to information asymmetry between sellers and buyers. This reduces the probability of farmers becoming aware of the variety. Moreover, local markets as sources of vines are informal and unregulated channels and are more likely to supply vines that are contaminated and degraded [28,30]. As such, there is a higher production risk associated with vines procured from a local market or any informal channel that sells vines as compared to vines from own preservation. Farmers would therefore be reluctant to increase the acreage for OFSP production when solely using vines that are purchased from an informal source. Most importantly, the fact that monetary transactions are involved, purchasing vines from an informal source also increases the production costs and risks as compared to using own preservations. The results concur with the findings of McGuire [30] and Kilwinger et al. [77] who indicated that farmers are less likely to use let alone intensify production when there are high transaction costs involved when procuring seeds.
It is worth noting that all the existing informal sources of vines were negatively correlated with the intensity of adoption of OFSP among the smallholder farmers when compared to using vines from own preservations. This means that farmers using either friends and relatives or local market sources were less likely to allocate more land to OFSP compared to those that used vines from own preservations. This could be due to the low capacity of both sources to meet the demands of the farmers [29,35]. Efforts by government and development practitioners promoting adoption of OFSP must aim to strengthen the capacity of the existing sources of vines in order to enhance the supply of high-quality vines and meet the demands of the farmers [29]. There is need for increased investment towards the breeding efforts and development of effective seed delivery mechanisms in order to increase the availability and accessibility of high-quality vines [24].
The study further noted that other factors such as nutrition sensitive projects, access to extension, decentralized vine multipliers, and taste, among others, maintained significance in at least two of the three models. The results corroborate with the findings of other OFSP adoption studies in Mozambique [65], Zambia [71], Kenya [69], and Ghana and Nigeria [64,66]. We therefore further recommend the need to increase the investment towards nutrition sensitive projects in order to increase the number of beneficiaries. There is also a need to improve the delivery of extension services by designing interventions that empower and incentivize extension workers. We further recommend for breeders to consider taste and other varietal and sensory attributes of OFSP when breeding OFSP varieties. In order to enhance the capacity and sustainability of decentralized vine multipliers, the study recommends the establishment of and investment in vine multiplication centers integrated within the existing public extension structures as opposed to the current models that are project-based and use individual vine multipliers. Lastly, there is need to invest towards the commercialization of OFSP varieties given that the results show that farmers consider OFSP to possess a market value that, if exploited, has the potential to improve household income.

4.2. The Existing Sources of Vines and Farmers’ Seed Security Status

The results in Figure 6 and Figure 7 indicate that the capacity of the existing sources of vines is limited, and hence the majority of the sweet potato smallholder farmers were highly seed insecure. Similar results were reported in Kenya by Mwangi et al. [35]. To enhance sweet potato seed security of the farmers, OFSP interventions must strengthen the capacity of the existing sources. As earlier recommended by Almekinders et al. [29], future seed systems interventions need to be dynamic and adaptive if seed systems are to reach their full potential.

5. Conclusions

The findings of this study imply that all other existing vines sources negatively influence the intensity of adoption of OFSP among smallholder farmers when compared to using vines from own preservations. The study also concludes that the existing sources are responsible for the high seed insecurity status of the sweet potato farmers. As such, state and non-state approaches and interventions promoting OFSP must be designed to address the seed security challenges associated with the existing sources in order to enhance the capacity of the sources for widespread and sustained adoption of OFSP. Future studies can focus on using longitudinal data to better understand the existing sources of vines as determinants of farmers’ adoption decisions.

Author Contributions

Conceptualization, C.S.K.; methodology, C.S.K., S.P.K., M.H.C. and I.P.-P.; formal analysis, C.S.K.; writing—original draft preparation, C.S.K.; writing—review and editing, S.P.K., I.P.-P. and M.H.C.; visualization, C.S.K.; supervision, S.P.K. and I.P.-P.; funding acquisition, C.S.K. All authors have read and agreed to the published version of the manuscript.

Funding

This research was funded by the Sustainable Food Systems in Malawi (FOODMA) Programme implemented by the Lilongwe University of Agriculture and Natural Resources (LUANAR) in collaboration with the Norwegian University of Life Sciences (NMBU).

Institutional Review Board Statement

Not applicable.

Informed Consent Statement

Informed consent was obtained from all subjects involved in the study.

Data Availability Statement

Not applicable.

Acknowledgments

The authors wish to thank the following for their commitment and contribution towards this research at different stages: all extension workers and farmers in the study areas; the entire team of the Programmes Coordinating Office of LUANAR; and all the research assistants.

Conflicts of Interest

The authors declare no conflict of interest. The funders had no role in the design of the study; in the collection, analyses, or interpretation of data; in the writing of the manuscript; or in the decision to publish the results.

References

  1. Woolfe, J.A. Sweet Potato: An Untapped Food Resource; Cambridge University Press: Cambridge, UK, 1992. [Google Scholar]
  2. FAOSTAT. Production and Area Harvested Statistics for Sweet Potato. 2020. Available online: https://data.un.org/Data.aspx?d=FAO&f=itemCode%3A122 (accessed on 1 February 2022).
  3. CIP. Unleashing the Potential of Sweet Potato in SubSaharan Africa: Current Challenges and Way Forward, Social Sciences, Working Paper No.2009-1, 2009. CIP/WorkingPaper. Available online: https://cgspace.cgiar.org/handle/10568/108748 (accessed on 2 March 2022).
  4. CIP. Commercialization of Orange-Fleshed Sweetpotato Based Products in Malawi. 2007. Available online: https://www.sweetpotatoknowledge.org/wp-content/uploads/2017/10/SPHI17-Commercialization-of-Orange-fleshed-sweetpotato-products-in-Malawi.pdf (accessed on 2 March 2022).
  5. Bovell-Benjamin, A.C. Sweet potato: A review of its past, present, and future role in human nutrition. Adv. Food Nutr. Res. 2007, 52, 1–59. [Google Scholar] [PubMed]
  6. Yang, J.; Moeinzadeh, M.H.; Kuhl, H.; Helmuth, J.; Xiao, P.; Haas, S.; Liu, G.; Zheng, J.; Sun, Z.; Fan, W. Haplotype-resolved sweet potato genome traces back its hexaploidization history. Nat. Plants 2017, 3, 696–703. [Google Scholar] [CrossRef] [PubMed]
  7. Chipungu, F. Ethno-Botanic and Genetic Variations among Sweetpotato Accessions Grown in Malawi. Ph.D. Thesis, University of Malawi, Chancellor College, Zomba, Malawi, 2008. [Google Scholar]
  8. Moyo, C.; Benesi, I.; Chipungu, F.; Mwale, C.; Sandifolo, V.; Mahungu, N. Cassava and sweet potato yield assessment in Malawi. Afric. Crop Sci. J. 2004, 12, 295–303. [Google Scholar]
  9. Chipungu, F.; Changadeya, W.; Ambali, A.; Saka, J.; Mahungu, N.; Mkumbira, J. Adaptation of sweet potato [Ipomoea batatas) (L.) Lam] genotypes in various agro-ecological zones of Malawi. Afr. J. Biotechnol. 2018, 17, 531–540. [Google Scholar]
  10. Low, J.W.; Ortiz, R.; Vandamme, E.; Andrade, M.; Biazin, B.; Grüneberg, W.J. Nutrient-Dense Orange-Fleshed Sweetpotato: Advances in Drought-Tolerance Breeding and Understanding of Management Practices for Sustainable Next-Generation Cropping Systems in Sub-Saharan Africa. Front. Sustain. Food Syst. 2020, 4, 50. [Google Scholar] [CrossRef]
  11. FAOSTAT. Production and Area Harvested Statistics for Sweet Potato in 2019. Available online: https://data.un.org/Data.aspx?d=FAO&f=itemCode%3A122 (accessed on 10 February 2021).
  12. United Nations. The Sustainable Development Goals Report. United Nations Publications, Department of Economic and Social Affairs. 2020. Available online: https://sdgs.un.org/publications/sustainable-development-goals-report-2020-24686 (accessed on 1 February 2022).
  13. FAO. The State of Food Security and Nutrition in the World: Building Climate Resilience for Food Security and Nutrition; Food and Agriculture Organization of the United Nations: Rome, Italy, 2018; Available online: https://www.fao.org/documents/card/en/c/I9553EN (accessed on 1 February 2022).
  14. Beal, T.; Massiot, E.; Arsenault, J.E.; Smith, M.R.; Hijmans, R. Global trends in dietary micronutrient supplies and estimated prevalence of inadequate intakes. PLoS ONE 2017, 12, e0175554. [Google Scholar] [CrossRef] [PubMed]
  15. Low, J.; Arimond, M.; Osman, N.; Cunguara, B.; Zano, F.; Tschirley, D. A food-based approach introducing orange fleshed sweet potatoes increased vitamin A intake and serum retinol concentrations in young children in rural Mozambique. J. Nutr. 2007, 137, 1320–1327. [Google Scholar] [CrossRef]
  16. Low, J.; Mwanga, R.; Andrade, M.; Carey, E.; Ball, A. Tackling vitamin A deficiency with biofortified sweetpotato in sub-Saharan Africa. Glob. Food Sec. 2017, 14, 23–30. [Google Scholar] [CrossRef]
  17. Webb, G.A.; Grant, F.; Watkinson, M.; Okuku, H.S.; Wanjala, R.; Cole, D.; Levin, C.; Low, J. Promotion of orange fleshed sweet potato increased vitamin a intakes and reduced the odds of low retinol-binding protein among postpartum Kenyan women. J. Nutr. 2017, 147, 955–963. [Google Scholar]
  18. Naico, A.; Lusk, J. The value of a nutritionally enhanced staple crop: Results from a choice experiment conducted with orange-fleshed sweet potatoes in Mozambique. J. Afr. Econ. 2010, 19, 536–558. [Google Scholar] [CrossRef]
  19. Gilligan, D.O. Biofortification, agricultural technology adoption, and nutrition policy: Some lessons and emerging challenges. Econ. Stud. 2012, 58, 405–421. [Google Scholar] [CrossRef]
  20. Mitra, S. Nutritional Status of Orange-fleshed Sweetpotato in Alternating of Malnutrition through a Food-Based Approach. Nutr. Food Sci. 2012, 2, 8. [Google Scholar] [CrossRef]
  21. Andrade, M.; Ricardo, J.; Naico, A.; Alvaro, A.; Makunde, G.; Low, J.; Ortiz, R.; Gruneberg, W.J. Release of orange-fleshed sweetpotato (Ipomoea batatas [l.] Lam.) cultivars in Mozambique through an accelerated breeding scheme. J. Agric. Sci. 2016, 155, 919–929. [Google Scholar] [CrossRef]
  22. Gatto, M.; Okello, J.; Pradel, W.; Kwikiriza, N.; Mgomezulu, W.; Nyirenda, Z.; Okuku, H.; Suarez, V.; Van Vugt, D.; Chipungu, F.; et al. Adoption and Effects of Orange-fleshed Sweetpotato Varieties in Malawi; International Potato Center: Lima, Peru, 2021. Available online: https://cgspace.cgiar.org/handle/10568/112937 (accessed on 21 January 2022).
  23. Government of Malawi. National Agricultural Investment Plan. 2018. Available online: https://www.scotland-malawipartnership.org/ (accessed on 29 September 2021).
  24. McEwan, M.A.; Almekinders, C.J.M.; Andrade-Piedra, J.J.L.; Garrett, K.A.; Kumar, L.; Mayanja, S.; Omondi, B.A.; Srinivasulu Rajendran, S.; Thiele, G. “Breaking through the 40% adoption ceiling: Mind the seed system gaps.” A perspective on seed systems research for development in One CGIAR. Outlook Agric. 2021, 50, 5–12. [Google Scholar] [CrossRef] [PubMed]
  25. Kilwinger, F.B.M.; Marimo, P.; Rietveld, A.M.; Almekinders, C.J.M.; Van Dam, Y.K. Not only the seed matters: Farmers’ perceptions of sources for banana planting materials in Uganda. Outlook Agric. 2020, 49, 119–132. [Google Scholar] [CrossRef]
  26. Harrison, H.F.; Jackson, D.M. Response of two sweet potato cultivars to weed interference. Crop Prot. 2011, 30, 1291–1296. [Google Scholar] [CrossRef]
  27. Bentley, J.W.; Andrade-Piedra, J.; Demo, P.; Dzomeku, B.; Jacobsen, K.; Kikulwe, E.; Kromann, P.; Kumar, L.; McEwan, E.; Mudege, N.; et al. Understanding root, tuber, and banana seed systems and coordination breakdown: A multi-stakeholder framework. Crop Improv. 2018, 32, 599–621. [Google Scholar] [CrossRef]
  28. Jacobsen, K.; Omondi, B.A.; Almekinders, C.; Alvarez, E.; Blomme, G.; Dita, M.; Iskra-Caruana, M.-L.; Ocimati, W.; Tinzaara, W.; Kumar, P.L.; et al. Seed degeneration of banana planting materials: Strategies for improved farmer access to healthy seed. Plant Pathol. 2018, 68, 207–228. [Google Scholar] [CrossRef]
  29. Almekinders, C.J.; Walsh, S.; Jacobsen, K.S. Why interventions in the seed systems of roots, tubers and bananas crops do not reach their full potential. Food Sec. 2019, 11, 23–42. [Google Scholar] [CrossRef]
  30. McGuire, S.; Sperling, L. Seed systems smallholder farmers use. Food Sec. 2016, 8, 179–195. [Google Scholar] [CrossRef]
  31. Almekinders, C.J.M.; Louwaars, N.P. The importance of the farmers’ seed systems in a functional national seed sector. J. New Seeds 2002, 4, 15–33. [Google Scholar] [CrossRef]
  32. Sperling, L.; Boettiger, S.; Barker, I. Integrating Seed Systems. Planning for Scale Brief #3. Ag Partner XChange. 2013. Available online: https://seedsystem.org/wp-content/uploads/2014/03/Integrating-Seed-Systems-.pdf (accessed on 1 November 2022).
  33. Almekinders, C.J.M.; Louwaars, N.P.; De Bruijn, G.H. Local seed systems and their importance for an improved seed supply in developing countries. Euphytica 1994, 78, 207–216. [Google Scholar] [CrossRef]
  34. Almekinders, C.J.M.; Beumer, K.; Hauser, M. Understanding the relations between farmers’ seed demand and research methods: The challenge to do better. Outlook Agric. 2019, 148, 16–21. [Google Scholar] [CrossRef]
  35. Mwangi, C.W.; Ateka, J.; Mbeche, R.; Ateka, E. Seed Security for Vegetatively Propagated Orphaned Crops and Its Implication for Household Food Security in Rural Kenya: A Case of Sweet Potato (Ipomea batatas). J. Agric. Food Res. 2020, 2, 100087. [Google Scholar] [CrossRef]
  36. FAO. Seed Security Assessment: A Practitioner’s Guide; FAO: Rome, Italy, 2016. [Google Scholar]
  37. CIAT; CRS; SNS-MARDNR; UEA; FAO; World Concern; Save the Children; ACDI/VOCA; Save the Children and World Vision. A study funded by the United States Agency for International Develop-ment, Office of Foreign Disaster Assistance. In Seed System Security Assessment, Haiti; (USAID/ODFA); International Center for Tropical Agriculture: Arusha, Tanzania, 2010. [Google Scholar]
  38. Van Etten, J.; López Noriega, I.; Fadda, C.; Thomas, E. The contribution of seed systems to crop and tree diversity in sustainable food systems. In Mainstreaming Agrobiodiversity in Sustainable Food Systems: Scientific Foundations for an Agrobiodiversity Index; Bioversity International: Rome, Italy, 2017; Volume 180, pp. 81–101. [Google Scholar]
  39. Greene, W. Econometric Analysis, 5th ed.; Pearson Education, Inc.: Upper Saddle River, NJ, USA, 2003. [Google Scholar]
  40. Ghimire, R.; Huang, W.C. Household wealth and adoption of improved maize varieties in Nepal: A double-hurdle approach. Food Sec. 2015, 7, 1321–1335. [Google Scholar] [CrossRef]
  41. Marenya, P.P.; Barrett, C.B. Household-level determinants of adoption of improved natural resources management practices among smallholder farmers in western Kenya. Food Policy 2007, 32, 515–536. [Google Scholar] [CrossRef]
  42. Besley, T.; Case, A. Modeling technology adoption in developing countries. Am. Econ. Rev. 1993, 83, 396–402. [Google Scholar]
  43. Shiferaw, B.; Kebede, T.; You, L. Technology adoption under seed access constraints and the economic impacts of improved pigeon pea varieties in Tanzania. Agric. Econ. 2008, 39, 309–323. [Google Scholar]
  44. Asfaw, S.; Shiferaw, B.; Simtowe, F.; Lipper, L. Impact of modern agricultural technologies on smallholder welfare: Evidence from Tanzania and Ethiopia. Food Policy 2012, 37, 283–295. [Google Scholar] [CrossRef]
  45. Adams, M. Agricultural Extension in Developing Countries; Macmillan Press Ltd.: London, UK, 1982. [Google Scholar]
  46. Katengeza, S.; Holden, S.; Lunduka, R. Adoption of Drought Tolerant Maize Varieties under Rainfall Stress in Malawi. J. Agric. Econ. 2018, 70, 198–214. [Google Scholar] [CrossRef]
  47. Fisher, M.; Holden, S.; Thierfelder, C.; Katengeza, S.P. Awareness and adoption of conservation agriculture in Malawi: What difference can farmer-to-farmer extension make? Int. J. Agric. Sustain. 2018, 10, 10–80. [Google Scholar] [CrossRef]
  48. Mulugo, L.; Kyazze, F.B.; Kibwika, P. Unravelling technology-acceptance factors influencing farmer use of banana tissue culture planting materials in central Uganda. Afr. J. Sci. Technol. Innov. Dev. 2020, 12, 453–465. [Google Scholar] [CrossRef]
  49. Murongo, M.; Wangai, K.J.; Mwine, T.J. Farmer-based dynamics in tissue culture banana technology adoption: A socio-economic perspective among small holder farmers in Uganda. Afr. J. Agric. Res. 2018, 13, 2836–2854. [Google Scholar] [CrossRef]
  50. Obuobisa-Darko, E. Socio-Economic Determinants of Intensity of Adoption of Cocoa Research Innovations in Ghana. Int. J. Afr. Asian Stud. 2015, 12, 29–40. [Google Scholar]
  51. Burke, W.; Myers, R.; Jayne, T. A triple-Hurdle Model of Production and Market Participation In kenya’s Dairy Market. Am. J. Agric. Econ. 2015, 97, 1227–1246. [Google Scholar] [CrossRef]
  52. Tobin, J. Estimation of Relationships for Limited Dependent Variables. Econometrica 1958, 26, 24–36. [Google Scholar] [CrossRef]
  53. Cragg, J.G. Some statistical models for limited dependent variables with application to the demand for durable goods. Econom. J. Econom. Soc. 1971, 39, 829–844. [Google Scholar] [CrossRef]
  54. Heckman, J. Sample Selection Bias as a Specification Error. Econometrica 1979, 47, 153–161. [Google Scholar] [CrossRef]
  55. Amemiya, T. Tobit Models: A Survey. J. Econom. 1984, 84, 3–61. [Google Scholar] [CrossRef]
  56. Amemiya, T. Advanced Econometrics; Harvard University Press: Cambridge, MA, USA, 1985. [Google Scholar]
  57. Wooldridge, J. Econometric Analysis of Cross-Section and Panel Data; The MIT Press: Cambridge, MA, USA, 2010; Available online: https://www.jstor.org/stable/j.ctt5hhcfr (accessed on 2 November 2022).
  58. Cameron, A.; Trivedi, P. Micro-Econometrics Using Stata; Stata Press: College Station, TX, USA, 2010. [Google Scholar]
  59. Sakala, I.C.; Kalinda, T.H.; Nknonde, C.; Burke, W.J. Adoption of ox-drawn minimum tillage ripping by smallholder farmers in Zambia. Agric. Econ. Res. Policy Pract. S. Afr. 2021, 60, 335–351. [Google Scholar] [CrossRef]
  60. Roodman, D. Fitting fully observed recursive mixed-process models with cmp. Stata J. 2011, 11, 159–206. [Google Scholar] [CrossRef]
  61. Thebulo, C.D. Implementation Factors Affecting Adoption and Extent of Adoption of Tephrosia Vogelli, Gliricidia Sepium and Cajanus Cajan technologies among Smallholder Farmers in Malawi: The Case of Agroforestry in Thyolo, Kasungu and Mzimba Districts. Master’s Thesis, Lilongwe University of Agriculture and Natural Resources, Lilongwe, Malawi, 2017. [Google Scholar]
  62. Burke, W.J. Evidence against imposing restrictions on hurdle models as a test for simultaneous versus sequential decision making, Am. J. Agric. Econ. 2019, 101, 1473–1481. [Google Scholar] [CrossRef]
  63. Sartori, A. An Estimator for Some Binary-Outcome Selection Models without Exclusion Restrictions. Political Anal. 2003, 11, 111–138. [Google Scholar] [CrossRef]
  64. Adekambi, S.A.; Okello, J.J.; Abidin, P.E.; Carey, E. Effect of exposure to biofortified crops on smallholder farm household adoption decisions: The case of orange-fleshed sweetpotato in Ghana and Nigeria. Sci. Afr. 2020, 8, e00362. [Google Scholar] [CrossRef]
  65. Jogo, W.; Bocher, T.; Grant, F. Factors influencing farmers’ dis-adoption and retention decisions for biofortified crops: The case of orange-fleshed sweetpotato in Mozambique. Agrekon 2021, 60, 445–459. [Google Scholar] [CrossRef]
  66. Adekambi, S.A.; Okello, J.J.; Rajendran, S.; Acheremu, K.; Carey, E.; Low, J.; Abidin, P.E. Effect of varietal attributes on the adoption of an orange-fleshed sweet potato variety in Upper East and Northern Ghana. Outlook Agric. 2020, 49, 311–320. [Google Scholar] [CrossRef]
  67. Amponsah, E.K.; Aboagye, E.; Agyemang, O.S. Crop technology adoption among rural farmers in some selected regions of Mali. J. Sustain. Dev. 2013, 6, 25–35. [Google Scholar] [CrossRef]
  68. Adesina, A.A.; Baidu-Forson, J. Farmers’ perceptions and adoption of new agricultural technology: Evidence from analysis in Burkina Faso and Guinea, West Africa. Agric. Econ. 1995, 13, 1–9. [Google Scholar] [CrossRef]
  69. Kaguongo, W.; Ortmann, G.F.; Wale, E.; Darroch, M.A.G.; Low, J. Factors influencing adoption and intensity of adoption of orange flesh sweetpotato varieties: Evidence from an extension intervention in Nyanza and Western province, Kenya. Afr. J. Agric. Res. 2012, 7, 493–503. [Google Scholar]
  70. Arslan, A.; McCarthy, N.; Lipper, L.; Asfaw, S.; Cattaneo, A. Adoption and intensity of adoption of conservation farming practices in Zambia. Agric. Ecosyst. Environ. 2014, 187, 72–86. [Google Scholar] [CrossRef]
  71. Mwiti, F.; Okello, J.J.; Munei, K.; Low, J. Farmer demand for clean planting material of biofortified and non-biofortified vegetatively propagated crop varieties: The case of sweetpotato. Sci. Afr. 2020, 8, e00400. [Google Scholar] [CrossRef]
  72. Pangapanga-Phiri, I.; Mungatana, E.D. Adoption of climate-smart agricultural practices and their influence on the technical efficiency of maize production under extreme weather events. Int. J. Disaster Risk Reduct. 2021, 61, 102322. [Google Scholar] [CrossRef]
  73. Barrett, C. Smallholder Market Participation: Concepts and Evidence from Eastern and Southern Africa. Food Policy 2010, 33, 299–317. [Google Scholar] [CrossRef]
  74. Hunecke, C.; Engler, A.; Jara-Rojas, R.; Poortvliet, P.M. Understanding the role of social capital in adoption decisions: An application to irrigation technology. Agric. Syst. 2017, 153, 221–231. [Google Scholar] [CrossRef]
  75. Slijper, T.; Urquhart, J.; Poortvliet, P.M.; Soriano, B.; Meuwissen, M.P.M. Exploring how social capital and learning are related to the resilience of Dutch arable farmers. Agric. Syst. 2022, 198, 103385. [Google Scholar] [CrossRef]
  76. McGuire, S.J. Securing Access to Seed: Social Relations and Sorgum Seed Exchange in Eastern Ethiopia. Hum. Ecol. 2008, 38, 217–229. [Google Scholar] [CrossRef]
  77. Kilwinger, F.B.M.; Rietveld, A.M.; Groot, J.C.J. Culturally embedded practices of managing banana diversity and planting material in central Uganda. J. Crop Improv. 2019, 33, 456–477. [Google Scholar] [CrossRef]
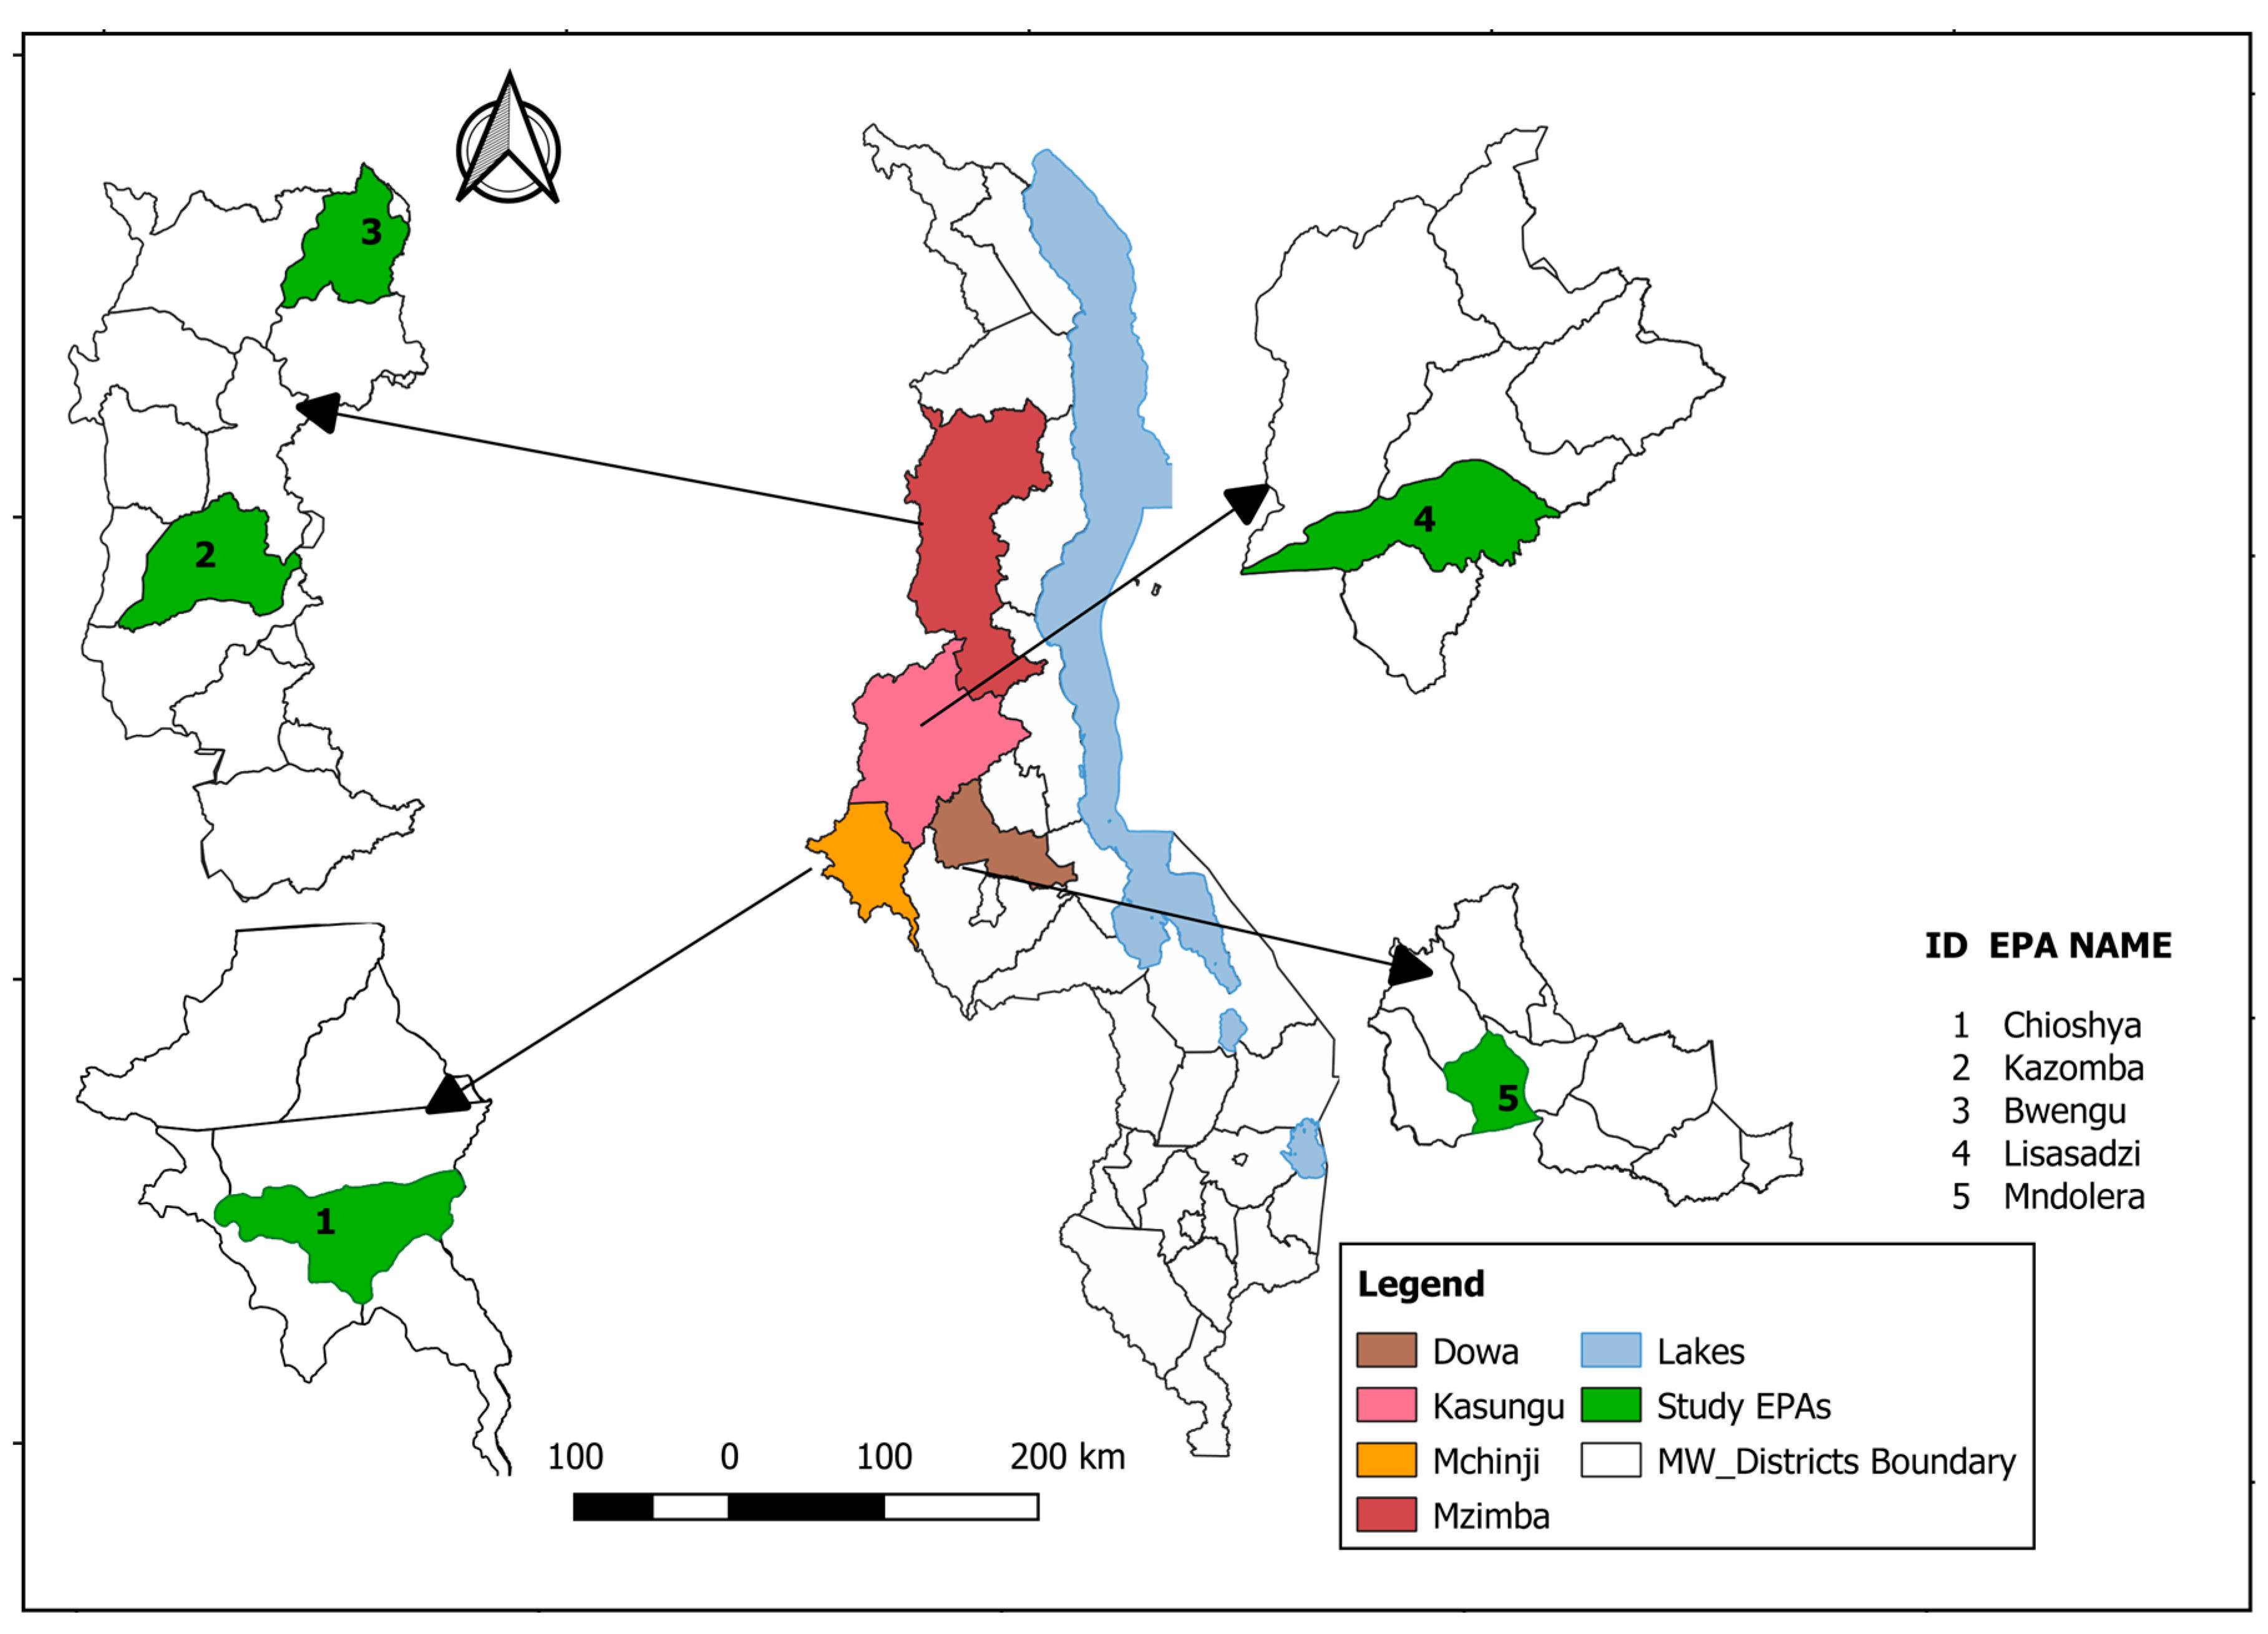
Figure 1. Map showing the study areas (source: authors).
Sustainability 15 14390 g001
Figure 2. The adoption process of OFSP (adapted from Ref. [51]).
Sustainability 15 14390 g002
Figure 3. Farmers’ awareness of OFSP by District and Total.
Sustainability 15 14390 g003
Figure 4. Farmers’ adoption of OFSP by District and Total.
Sustainability 15 14390 g004
Figure 5. Farmers’ OFSP adoption Intensity (acres and proportion) by District and Total.
Sustainability 15 14390 g005
Figure 6. Farmers’ perceptions on the capacity of the existing sources of vines to supply adequate, good quality, affordable vines of the desired varieties at the right time.
Sustainability 15 14390 g006
Figure 7. The seed security experience scores for sampled households.
Sustainability 15 14390 g007
Table 1. Variables used in the study and their expected sign of influence.
VariableExpected Sign of InfluenceReference
Y1Y2Y3
Dependent Variables
Awareness (Y1) (1 = Aware, 0 = Otherwise) [47,64]
Adoption (Y2) (1 = Adopted, 0 = Otherwise) [47,65,66,67,68]
Intensity of Adoption (Y3) (Land in acres or as a proportion of total land size) [51,69,70]
Independent Variables
Age of HH Head (years) ± ± ± [66,71]
Education of HH Head (years) ± ± ± [65,66]
Gender of HH Head (1 = male, 0 = female) ± ± ± [65,71]
Years of farming experience (years) ± ± ± [65,72]
Household size (Number of household members) + + + [65,66]
Household Off-farm Income + + + [40]
Land ownership (acres) + + + [65]
Purpose for cultivating sweet potato (1 = Own consumption 2 = Selling 3 = Both) [73]
Existing Sources of Vines (1 = Own preservation 2 = Friends/Relatives 3 = Bought 4 = NGO Project 5 = Government) ± ± ± [24,25,30,31]
Participation in nutrition sensitive project (1 = Yes, 0 = Otherwise) + + + [69]
Access to extension (1 = Yes, 0 = No) + + + [47,65]
Access to credit (1 = Yes, 0 = No) ± ± ± [43,72,74]
Farmer clubs/association membership (1 = Yes, 0 = Otherwise) + + + [65,75]
Distance to sweet potato plot (kilometers) [69]
Taste attribute (1 = if farmer considered taste, 0 = if otherwise) ± ± ± [66]
Table 2. Distribution of non-adopters by awareness in the study area.
DistrictNon-AdoptersAdopters
Not Aware (%)Aware (%)Not Aware (%)Aware (%)
Dowa4951991
Mchinji3169595
Kasungu2674199
Mzimba27730100
Pooled3565496
Table 3. The farmers’ main sources of vines in the 2021/2022 growing season.
Source of VinesSeed Source TypeTotal
FormalInformal
Freq.%Freq.%Freq.%
Own vines0026536.7526536.75
Friends/Relatives0015621.6415621.64
Bought from local market0030041.6130041.61
NGO/Project000000
Government/extension000000
Total00721100721100
Table 4. Characteristics of the sampled households in the study area.
VariablePooled
(n = 721)
Adopters
(n = 291)
Non-Adopters (n = 430)Significance
MeanStd. dev.MeanStd. dev.MeanStd. dev.p-Value
Sex of HH Head (1 = Male, 0 = Female)0.780.410.790.410.770.420.611
Age of HH Head (Years)44.3314.7046.2114.4343.0714.770.005 ***
Marital status of HH Head (1 = Married, 0 = Otherwise)0.760.430.760.430.760.430.911
Main Occupation of HH Head (1 = Farming, 0 = Otherwise)0.900.290.920.280.900.310.321
Education of HH Head (Years)6.013.696.573.845.633.540.001 ***
Household size (Number of persons)5.251.885.341.705.191.990.2942
TV/radio (1 = Present, 0 = Otherwise)0.300.460.340.470.280.450.085 *
Project participation (1 = Yes, 0 = No)0.470.500.660.480.350.480.000 ***
Total land size (Acres)3.042.093.482.332.741.860.000 ***
Farmer Club membership (1 = Member, 0 = Otherwise)0.610.490.720.450.540.500.000 ***
Access to credit (1 = Yes, 0 = No)0.130.340.180.380.100.310.004 ***
Annual off farm income (MWK′000)3144123314383033930.376
Access to extension (1 = Yes, 0 = No)0.490.500.650.480.390.490.000 ***
Note: *** p < 0.001, * p < 0.1 for both t-test and chi-square statistics.
Table 5. Estimates of factors affecting awareness, adoption, and intensity of adoption.
VariableAwarenessAdoptionIntensity
Probit
(n = 721)
Probit
(n = 561)
Lognormal
(n = 291)
ME (SE)ME (SE)Coeff. (SE)
District (Dowa)
Mchinji (1 = Yes)0.1121 ***−0.0286−0.0291
(0.0390)(0.0538)(0.0819)
Kasungu (1 = Yes)0.1284 ***−0.09360.1659 *
(0.0432)(0.0585)(0.0994)
Mzimba (1 = Yes)0.1577 ***−0.02080.0235
(0.0448)(0.0646)(0.1179)
Sex of HH Head (1 = Male)0.0666 *0.0088−0.0195
(0.0344)(0.0507)(0.0823)
Occupation (1 = Farming)0.1012 **
(0.0446)
Farming experience (Years)0.00120.0030 *−0.0010
(0.0012)(0.0016)(0.0028)
Education Level of HH Head (Years)0.00240.00680.0160
(0.0046)(0.0063)(0.0101)
Household Size (Persons)−0.0065−0.0105−0.0089
(0.0082)(0.0119)(0.0199)
Household off-farm Income −0.00000.0001 **0.0000
(0.0000)(0.0000)(0.0001)
Nutrition Sensitive Project (1 = Yes)0.1687 ***0.1492 ***−0.1752 **
(0.0306)(0.0409)(0.0745)
Availability of a Vine Multiplier (1 = Yes)0.1229 *0.1576 **0.0534
(0.0731)(0.0696)(0.1190)
Purpose (Consumption)
Selling (1 = Yes)0.0015−0.07600.7702 ***
(0.0916)(0.1313)(0.3197)
Both consumption and selling (1 = Yes)0.01220.00710.2184 ***
(0.0297)(0.0431)(0.0689)
Group Membership (1 = Yes)0.00260.0917 **
(0.0321)(0.0447)
Access to credit (1 = Yes)0.0931 **0.03140.1183
(0.0448)(0.0554)(0.0864)
Access to extension (Times of contact)0.01320.0294 **0.0405 *
(0.0095)(0.0119)(0.0208)
Sources of Vines (Own)
Friends/Relatives (1 = Yes)0.0798 **0.1026 **−0.2678 ***
(0.0364)(0.0511)(0.0913)
Bought from market (1 = Yes)−0.0525 *0.0084−0.1720 *
(0.0341)(0.0471)(0.0876)
Total land size (Acres)0.01290.01090.0533 ***
(0.0080)(0.0099)(0.0197)
Distance to sweet potato farm plot (Kilometres)0.0410 ***−0.0420 ***0.0289
(0.0097)(0.0143)(0.0211)
Soil fertility Perception (1 = Fertile)−0.1038 ***0.0934 **−0.0499
(0.0323)(0.0428)(0.0850)
Taste0.1368 **0.2665 ***
(0.0605)(0.0981)
Constant−1.1561 ***
(0.1892)
Note: *** p < 0.001, ** p < 0.05, * p < 0.1; ME: Marginal Effects; SE: Standard Errors (in parentheses).
Disclaimer/Publisher’s Note: The statements, opinions and data contained in all publications are solely those of the individual author(s) and contributor(s) and not of MDPI and/or the editor(s). MDPI and/or the editor(s) disclaim responsibility for any injury to people or property resulting from any ideas, methods, instructions or products referred to in the content.