Article

Measuring and Indexing the Durability of Electrical and Electronic Equipment

by
Hamidreza Habibollahi Najaf Abadi
*,
Jeffrey W. Herrmann
and
Mohammad Modarres
Center for Risk and Reliability, A.J. Clark School of Engineering, University of Maryland, College Park, MD 20742, USA
*
Author to whom correspondence should be addressed.
Sustainability 2023, 15(19), 14386; https://doi.org/10.3390/su151914386
Submission received: 26 July 2023 / Revised: 28 September 2023 / Accepted: 28 September 2023 / Published: 29 September 2023

Abstract

:
Due to the large and unsustainable use of valuable natural resources and electronic waste generation worldwide, which poses risks to human health and the environment, different organizations have initiated efforts to shift from a linear economy to a circular economy. A crucial aspect of promoting a circular economy is improving product durability, which can reduce resource extraction and waste because products remain in use for a longer period. Methods for measuring and indexing durability should encourage consumers to buy more durable products and incentivize manufacturers to compete in improving durability. This paper reviews past research on measuring product durability. It proposes an overall framework based on the promise of product life as well as its readiness to perform required functions for indexing durability. Finally, it presents an example of durability assessment. The proposed framework enables manufacturers to improve the design and communication of product durability. Furthermore, it supports establishing durability standards by standard development organizations and promotes sustainability through durability initiatives.

1. Introduction and Motivation

Electronic waste (e-waste) is a rapidly growing waste stream. In 2019, 53.6 million tons of e-waste were generated globally, estimated to reach around 74.7 million tons by 2030 [1]. A typical mobile phone over its lifetime has a carbon footprint of 60 kg, 85% of which is attributed to materials and the production of the phone. Considering that 5.3 billion mobile phones have been thrown away in the form of e-waste in 2022 alone, with only 17% of its materials recycled, one can appreciate the enormity of e-waste for just one of many electronic products in use [2]. This considerable amount of e-waste contains toxic and hazardous materials that can harm the physical and mental health of humans. Physical health problems such as miscarriages, changes in thyroid function and development, decreased lung function, and mental issues (such as changes in temperament and behavior) are some of the recognized health issues caused by exposure to e-waste [3,4]. In addition, water and soil contamination and greenhouse gas emissions leading to global temperature rise are notable examples of e-waste environmental impacts [5,6]. Therefore, the negative impact of e-waste on the environment and ecosystem is significant and not sustainable.
In addition, a substantial amount of valuable material resources is currently being used for manufacturing electronic and electrical equipment (EEE). EEE contains up to 69 elements, including valuable metals such as gold, silver, and copper and critical raw materials such as cobalt, palladium, and indium [1]. Generated e-waste from printed circuit boards, which exist in every EEE, contains more than 1000 different substances, including organic material (30%), metals (40%), and ceramics (30%) [7]. However, just 17.4% of e-waste is formally collected and recycled [1], so a significant portion of produced EEE will be discarded in landfills. This pattern of producing and disposing of EEE increases the need for raw material extraction, which has substantial health and environmental impacts [8]. In conclusion, implementing some sustainability goals to decrease the use of limited material resources and reduce the generation of e-waste is desirable.
In the context of products, practical sustainability goals include minimizing the negative environmental impacts of e-products and the excessive use of limited resources. These goals can be attained through smart design and responsible usage [9]. One such process recently implemented in some countries is transitioning from the current linear economy toward a circular economy. A circular economy aims to create a closed-loop system for the product life cycle and maximize the utilization of materials by employing recycling, remanufacturing, reusing, and long-lasting products. Governments worldwide have recognized the importance of transitioning to the circular economy by enacting laws, programs, and regulations to implement this transition. Examples of such efforts include the Circular Economy Action Plan, which is part of the Green Deal in Europe, France’s Anti-Waste and Circular Economy Law, and China’s Circular Economy Promotion Law.
Consumers’ attitudes expressed by their purchasing choices and behaviors could significantly affect the promotion and adoption of the circular economy through market demand, influencing businesses to adopt more sustainable and circular products [10,11]. Therefore, it would be essential to enable and inform consumers to support the circular economy by measuring and presenting the degree of circularity of products. One of the key aspects of the circular economy that should be measured is the product’s longevity or, more comprehensively, the ownership risk, which includes both the expected useful life of the product and the manufacturer’s assurance of a minimum life. Extending the lifespan of products reduces the disposal of products and the need to produce replacements. This minimizes both waste generation and the need for extracting material resources, which are critical characteristics of a circular economy.
Recent efforts in this area suggest the implementation of a so-called durability index [12]. Assessing a measure of product durability and sharing it with the public gives consumers useful information and motivates better manufactured products. Thus, there are two ways in which this indexing system can improve durability. First, durability information can guide consumers to purchase more long-lasting products, which may decrease demand for less durable products, causing manufacturers to stop production. Second, it incentivizes manufacturers to make more durable products. Despite its advantages, there is currently no practical method for indexing product durability.
This paper proposes a framework for measuring and indexing product durability. The principal novelty of the proposed indexing framework is that it takes a holistic approach to durability. Therefore, it systematically identifies and assesses various quantifiable product attributes influencing its physical durability. It aims to provide a formal mechanism to support testing, optimizing, and communicating product durability during its design, production, and use. For this purpose, the first step is to define durability and identify the fundamental attributes of a product that affect its durability. Indexing relevant attributes and combining them yields an index for product durability. Although the proposed framework is applicable to a wide range of EEE, the authors’ primary focus in this paper centers on evaluating handheld consumer electronics. Therefore, the framework has been specifically tailored with these products in mind. This paper is organized as follows. Section 2 describes the role of product durability in a circular economy model. Section 3 provides an overview of the literature on durability. Section 4 presents the proposed framework. The application of the proposed framework is demonstrated in Section 5. Finally, Section 6 summarizes the conclusions of this paper.

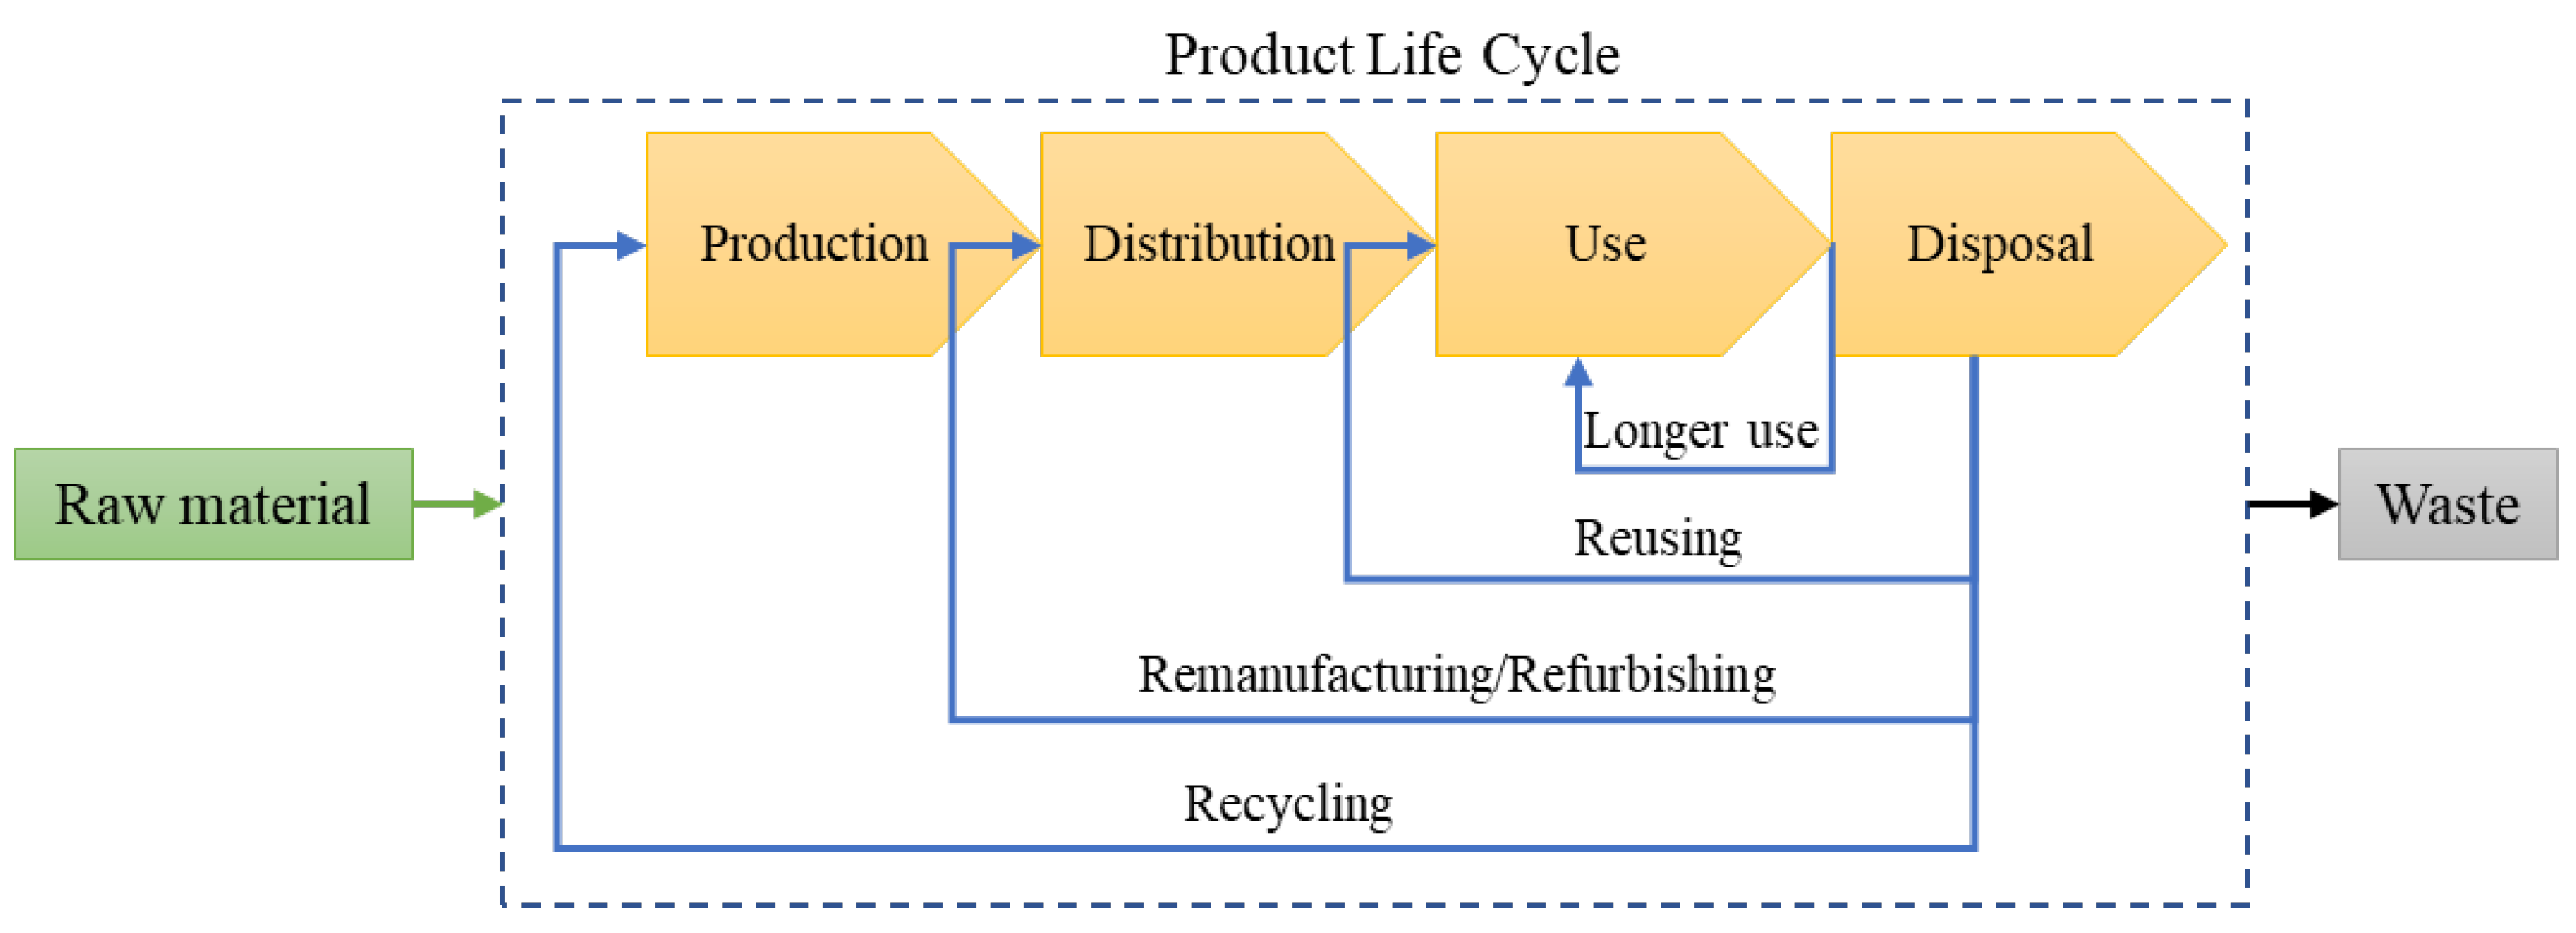
2. Circular Economy and Role of Product Durability

A circular economy is a strategy adopted by many governmental and private agencies and manufacturers to support resource and environmental sustainability, with the aim of minimizing e-waste generation and resource consumption. Unlike a traditional linear economy in which products are discarded as waste and there is no effort to keep them in the use cycle, a circular economy aims to keep materials in use as long as possible [13], ideally indefinitely, through recycling, remanufacturing, refurbishing, reusing, and longer use. Figure 1 illustrates the basic concept of a circular economy [14].
Recycling involves redirecting materials away from the waste stream and processing them to return them to productive use [15]. Remanufacturing involves restoring used products, which may be defective, to like-new condition by replacing the damaged parts and then distributing them for use. Refurbishing is similar to remanufacturing but involves a minimal restoration, such as cleaning and testing for slightly used or unused products without significant defects, such as cosmetic issues [16]. Reusing refers to extending the life of properly functioning products that the original owner no longer needs through reselling or passing them onto others in a secondary market [17]. Longer use refers to improving durability to postpone disposal.
An ideal circular economy eliminates or minimizes the transfer of natural resources into waste, thus reducing adverse health and environmental impacts and promoting natural resource conservation and economic benefits. The objectives of a circular economy are rooted in sustainability [18]. A circular economy has been recognized as a means to achieve sustainability, which is the design, production, use, and disposal of the materials used in products in a way that minimizes negative environmental impacts, preserves resources, and promotes long-term social and economic well-being [18].
One of the main approaches to realizing a circular economy is the longer use of products by increasing their durability. Increasing product durability influences waste generation and resource consumption by extending a product’s life. Although consumers have various reasons for replacing products (e.g., functional failure, dissatisfaction with the appearance, or desire to have the latest version of products), their attitudes toward the circular economy would significantly impact its adoption by their extended use of a product [19]. The cause of 30% of discarded devices is functional failure, which includes damage, malfunction, or inoperable conditions [20]. Specifically for smartphones, failure accounts for 40% of the reasons for their disposal [21]. Thus, improving product durability should reduce the amount of waste generated and decrease the number of replacement products that need to be produced, leading to reduced resource consumption and waste.
Although improving durability enhances circularity and can contribute to sustainability [22], there are exceptions wherein improving durability may not be sustainable. For example, although plastic bottles and cutlery are durable (i.e., they will not wear out rapidly and can be used many times), they are often discarded after only one use and are difficult to recycle. On the other hand, products such as nondurable cardboard furniture and paper bags are more sustainable because they are made from renewable resources and are easier to recycle. A complete discussion of the complicated relationship between durability and sustainability is beyond the scope of this paper. However, despite these limited exceptions, most durable products are more sustainable than nondurable ones and produce less waste, particularly for EEE. In conclusion, embracing circularity leads to improving sustainability, and one of the critical elements of product circularity is the use of more durable products. To quantify and compare durable products, one needs to have measures or indices of durability, which is the main subject of this paper.
Finally, it is critical to note that minimizing resource consumption and e-waste within the broader discourse on sustainability requires the consideration and optimization of various product features, including reliability, repairability, and upgradability, as well as the product’s energy efficiency. Therefore, addressing the trade-offs and synergies between these dimensions becomes paramount to ensure that our efforts for minimizing resource consumption and e-waste contribute holistically to a more sustainable future.

3. Product Durability Literature Review

To develop a framework for measuring and indexing product durability, the first step requires defining durability and identifying the product attributes that affect it. This section summarizes the definitions of durability and highlights the relevant product attributes that previous works have identified.

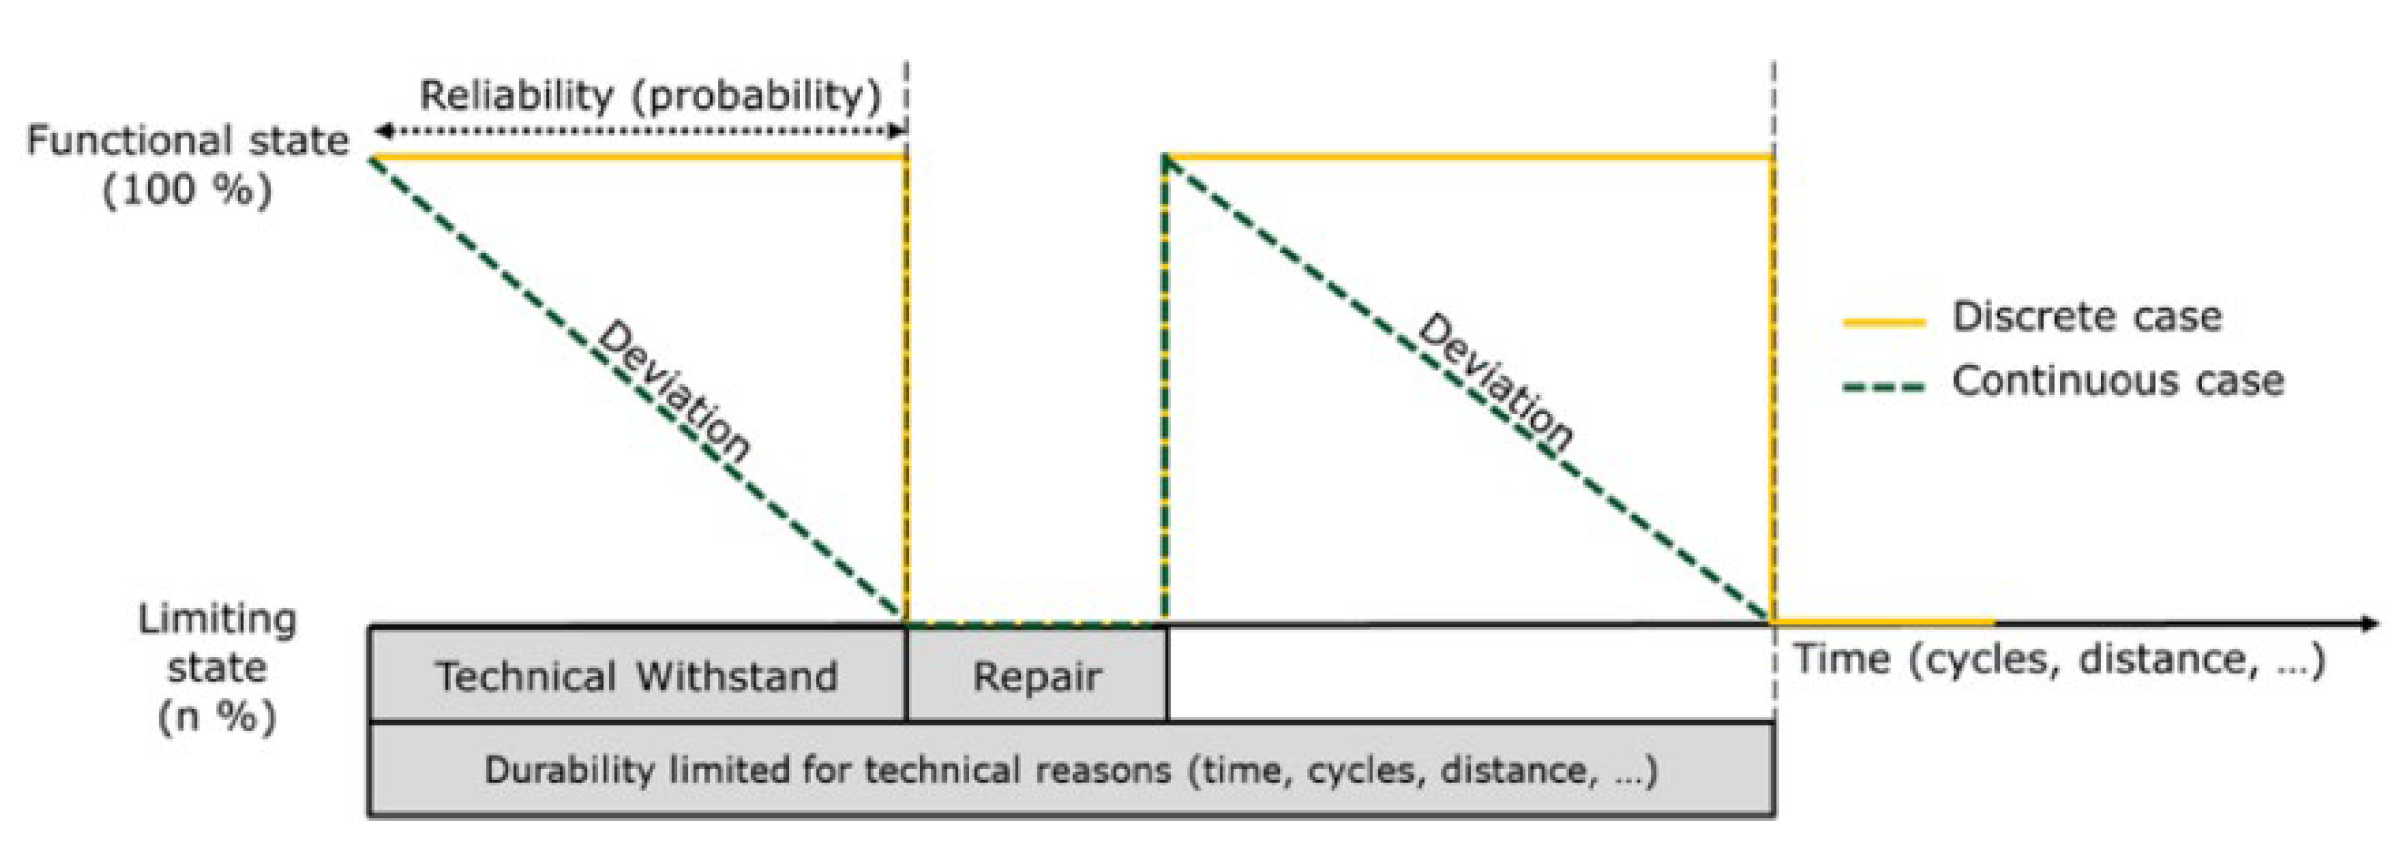
3.1. Durability Definition

The literature offers various definitions of product durability. In general, durability is the ability to withstand damage and endure over time. The term durability comes from the Latin verb durare, meaning “to last” [23]. Webster’s dictionary defines durability as “The ability to withstand wear or decay” [24]. According to the Merriam-Webster online dictionary, durable means “able to exist for a long time without significant deterioration in quality or value”.
Table 1 presents the technical definitions for durability available in the literature. Five major points can be taken from these technical definitions:
  • In some of the definitions, durability is closely linked to product functionality. Therefore, when defining a product’s durability, defining its intended functionality is essential. This is particularly important for EEE products with multiple functionalities (e.g., smartphones can make phone calls, send text messages, and take photographs).
  • In some of the technical definitions, the use conditions of a product have been included as a crucial factor for measuring durability. A product that is used in harsh environments or under heavy usage may experience more wear and lower durability than a product that is used in a less demanding setting.
  • Cooper [25], ISO 19867 [26], and ISO 28842 [27] emphasized the importance of a products’ lifetime being long, extended, and conforming to design specifications. This reflects that durability should be defined based on the expected lifetime.
  • Maintenance and repair affect durability because they can prolong a product’s useful life and ensure that it continues to function at its intended quality and performance level.
  • Several technical definitions are closely related to reliability, which is the probability that a product will perform its intended functions for an expected time under specified use conditions [28]. MIL-STD-721C [29] considers durability as a special case of reliability.
Table 1. Available technical definitions for durability.
ReferenceProvided Definition for DurabilityTarget Product in the Reference
Cooper [25]Ability of a product to perform its required function over a lengthy period under normal conditions of use without excessive expenditure on maintenance or repair-
EN 45552 [30]Ability to function as required, under defined conditions of use, maintenance, and repair, until a limiting state is reachedenergy-related products
MIL-STD-721C [29]A measure of useful life (a special case of reliability)-
ISO 11994 [31]A feature of the product to retain the serviceability until a marginal condition is approached, with a predetermined system of maintenance and repair being usedcranes
ISO 14708-5 [32]Ability of an item to perform a required function under given conditions of use and maintenance, until a limiting state is reachedactive implantable medical devices
ISO 19867 [26]Ability of a cookstove to continue to be operated for an extended period in a safe manner and with minimal loss in performancecookstoves
ISO 11108 [33]The ability to resist the effects of wear and tear when in usearchival papers
ISO 28842 [27]Characteristic of a structure to resist gradual degradation of its serviceability in a given environment for the design service lifeconcrete bridges

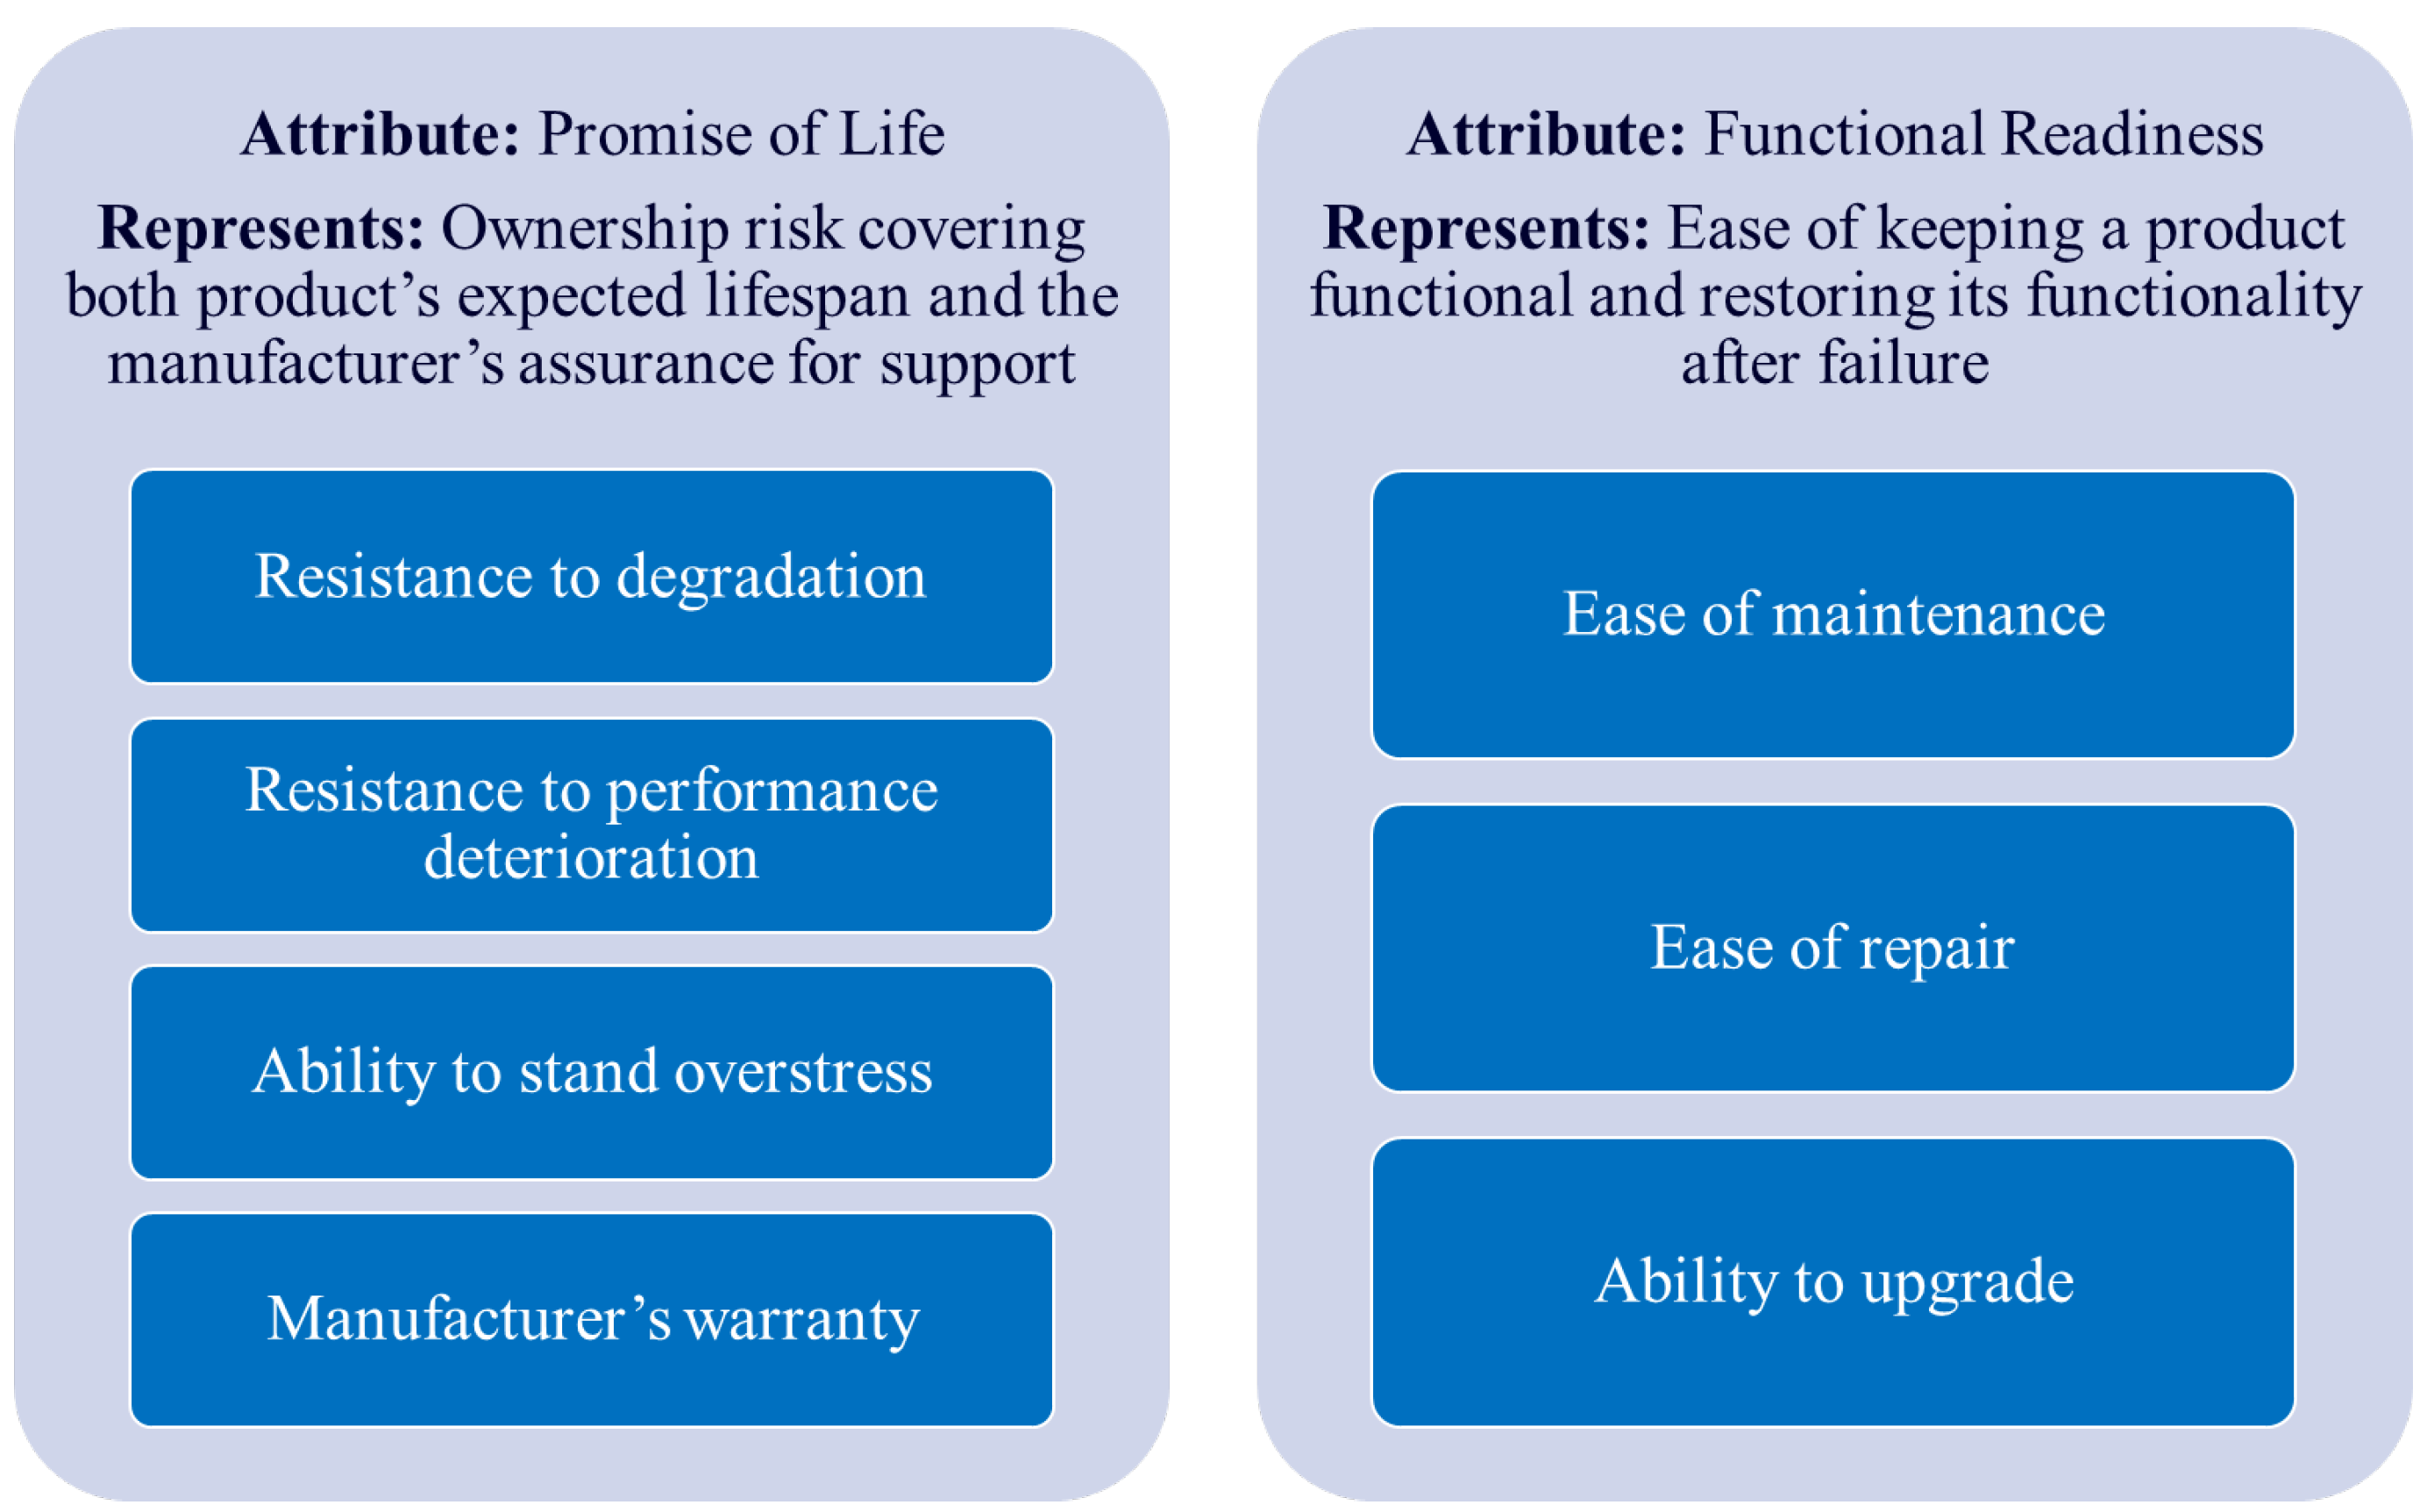
3.2. Durability Attributes

A product’s durability depends on different product attributes to varying degrees. These attributes include reliability, robustness, repairability, upgradability, longevity, and operating lifetime [34]. The characteristics of these attributes overlap, and they can be grouped into a smaller set of more distinctive attributes.
Some previous work has considered durability holistically as an integrated quality of a product and determined its significant attributes. EN 45552 [30] described product durability as a function of its repairability and reliability. They defined the relationship between reliability, repair, and durability, as illustrated in Figure 2. In their definition, two situations of sudden failure (e.g., overstressed failure such as accidental drop) and degradation (e.g., corrosion degradation leading to failure) have been considered as discrete and continuous cases, respectively. Similarly, Cordella et al. [35] considered smartphones’ reliability and repairability attributes to evaluate their durability. In a preparatory study by France’s Agency for Environment and Energy Management (ADEME) on introducing a durability index [34], upgradability was also introduced beside reliability and repairability as the third attribute with a high impact on product durability. The Ministry of Energy Transition of France identified reliability, robustness, and repairability as the attributes for a future durability index [12]. The European Commission has proposed new rules for the durability of mobile phones and tablets, considering reliability, repairability, and software upgradability [36].
Although very limited studies focus on defining and evaluating product durability holistically with its dominant attributes, the individual attributes of durability have been considered separately in the literature. Among all durability attributes, reliability and repairability have been prevalently considered in previous studies. There have also been endeavors to evaluate other durability attributes such as upgradability [37], longevity [38], and operating lifetime [39], although not to the same extent as reliability and repairability attributes. Operating time refers to the time during which a device remains active and functional. Longevity refers to the total ownership lifespan of a device.
Reliability is a well-established knowledge domain. Various standards and handbooks provide guidance for product reliability assessment (reliability testing and data analysis). Using these standards and handbooks, manufacturers can assess the reliability of their products based on laboratory tests (e.g., accelerated life testing) and field data (e.g., returned devices data). Military handbooks and standards are some of the first documents that were developed for reliability assessment [29,40,41]. Besides military documents, other standard development organizations such as IEEE [42], IEC [43], and JEDEC [44] have developed a long list of reliability-related standards, which include general approaches for reliability assessment and some product-specific approaches. In addition to these handbooks and standards, there are many research papers evaluating the reliability of EEE [45,46].
Although product reliability has been extensively studied for a long time, repairability has received greater attention in recent years [47,48]. In recent years, efforts have been made to measure and index product repairability. The French repairability index (FRI) [12], EN 45554 [49], the Joint Research Center repair scoring system [50], the Assessment Matrix for ease of Repair (AsMer) [51], ONR 192102 [52], and the iFixit method [53] are the main well-known repairability indexing methods which, in most cases, were developed after 2018. Additionally, the European Commission has recently proposed a repairability indexing method for mobile phones and tablets [36]. These methods commonly calculate a repairability index by scoring and then aggregating some repair-related criteria, such as the number of steps for disassembling critical parts or the duration of availability of spare parts.
Among the repairability indexing methods, FRI is one of the most recent and the only one now a mandate [12]. Since 1 January 2021, manufacturers should provide a self-assessed repairability index for products in specific EEE categories sold in France. More product categories are being added to the mandate gradually. FRI evaluates the repairability of a product based on five criteria: (1) the availability of repair documents, (2) the possibility of disassembling, (3) the availability of spare parts, (4) the price of spare parts, and (5) a specific criterion that is different for each product category. Each criterion has its own sub-criteria. A final repairability index is the weighted sum of the scores for each criterion, as shown in Table 2. Almost all the other repairability index methods mentioned above follow a similar approach. However, some differences can be seen in the details of the considered key criteria [54]. Still, the overall similarities may result in consistent indexing [55].
Despite the extensive efforts to assess and quantify various durability attributes, an integrated durability indexing method that effectively represents the lifetime of a product has yet to be introduced. As awareness grows regarding the benefits of establishing and utilizing a durability indexing framework, there have been initiatives toward its development. However, a theoretical methodology for quantifying and indexing this product’s quality is still needed.

4. Proposed Framework

Creating a reliable approach to measure and index the durability of EEE relies on a thorough understanding of the product attributes that affect its durability. Overlooking significant attributes may yield a flawed evaluation. This section discusses the notion of durability, identifies its key attributes, and proposes a framework for measuring and indexing durability.

4.1. Defining Durability and its Key Attributes

The definition provided in EN 45552 [30] (Table 1) seems to be the most relevant technical definition for durability, as the standard was published within a framework for assessing product circularity. This definition overlooks one vital aspect, however. Durability is a highly context-dependent term with various meanings for different product categories based on their expected lifetime. For example, the interpretation of durability for a single-use product differs from that of durability for a product that will be used repeatedly over a long lifetime. Therefore, the expected lifetime of a product should be included in the definition, as single-use products should not be indexed poorly because reusing them is undesirable for health and safety reasons. Also, products intended for multiple uses may not necessarily need to be indexed highly for durability solely due to their long lifespan. Taking this point into account, durability can be defined as the product’s ability to deliver its intended function under predefined conditions of use, maintenance, and repair for the expected lifetime of products in its category.
Based on the proposed definition of durability, the attributes that should be considered in a durability index are shown in Figure 3. The main attributes comprising the durability index are the promise of product life and its functional readiness. The promise of life attribute measures the ownership risk covering both the product’s expected lifespan and the manufacturer’s assurance for support. By evaluating this attribute, one can gauge not only the expected lifespan of a product but also the manufacturer’s commitment to providing support, ensuring consumers make well-informed decisions regarding long-lasting products. The product’s functional readiness attribute measures the ease of keeping a product functional and restoring product functionality after failure.
Each of these two major attributes have sub-attributes. The promise of life has four sub-attributes: (1) resistance to degradation, (2) resistance to performance deterioration, (3) ability to stand overstress, and (4) manufacturer’s warranty. Product failure can occur due to prolonged use leading to slow but cumulative degradation such as corrosion. Thus, the measure for the promise of life should reflect the product’s ability to resist degradation. Performance deterioration and degradation can be independent of each other. For instance, the propagation of a crack in a product’s material component represents a form of damage accumulation that may not affect its performance until the crack length reaches a critical value, when it causes the product to cease functioning. The ability to stand to overstress refers to a product’s ruggedness and tolerance for many degradation mechanisms or stress conditions since abrupt failures can happen due to high stress conditions such as a drop. The last sub-attribute of the promise of life is the manufacturer’s warranty, which refers to a manufacturer’s responsibility to support and address a product’s technical issues, ensuring the consumer continues using the product, regardless of their willingness to replace it, based on psychological factors.
The functional readiness attribute comprises three sub-attributes: (1) ease of maintenance, (2) ease of repair, and (3) ability to upgrade. Here, maintenance means preventive maintenance with the goal of preventing future failures and the need for repair by servicing and replacing parts before they break down. The main difference between preventive maintenance and repair is that such maintenance activities are carried out before failure, whereas repair activities are performed after failure to restore the product back to normal operating conditions. The ease of maintenance and repair should be quantified to measure the functional readiness, given their direct impact accurately. In addition, the ability to upgrade, as the ability to enhance product functionality or performance, is a critical factor that influences durability, especially with the rapid advancements in technology and potential changes in consumer preferences. Upgradability serves as a crucial bridge between a product’s initial release and its long-term viability, allowing it to cater to changing consumer needs and emerging technological trends, ultimately enhancing its durability in an increasingly dynamic marketplace. For example, upgradability plays a crucial role in the durability of computers. Users can upgrade system components such as a CPU, RAM, or GPU to keep their system competitive with the latest software and demanding applications. By allowing users to swap out outdated components for more capable ones, upgradable computers postpone the need for complete replacements.

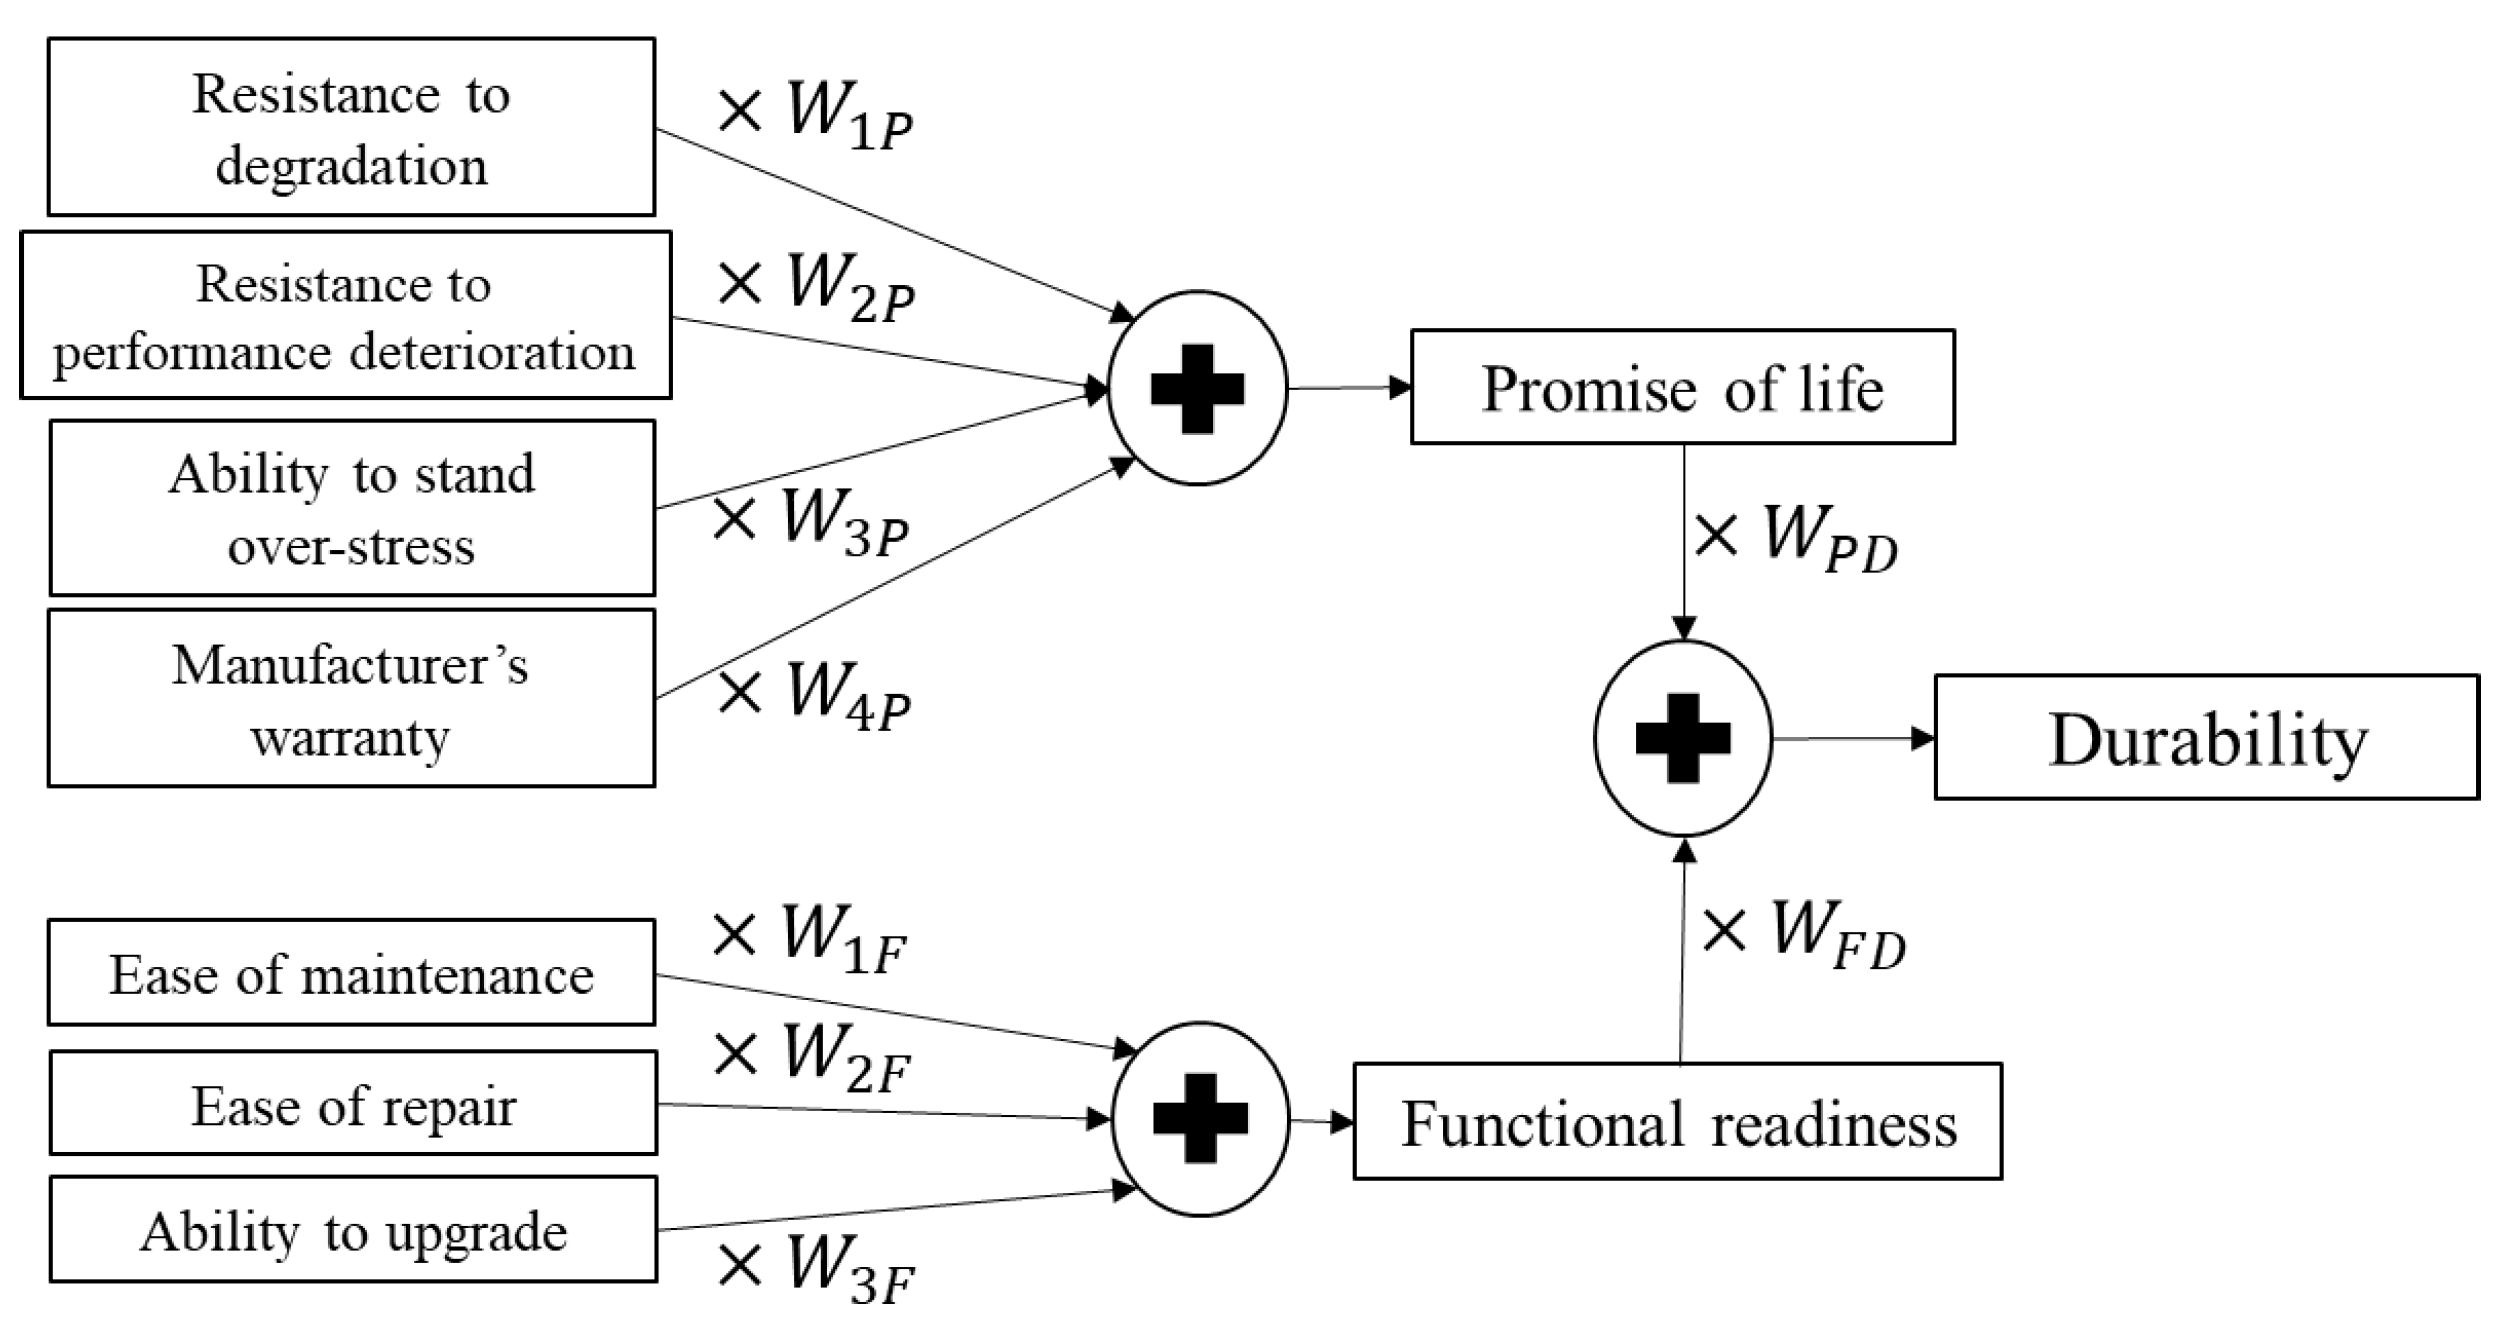
4.2. Durability Index Framework

Each of the sub-attributes of the durability index should be evaluated and measured separately to measure the two primary attributes and determine the durability index. However, not all of the proposed attributes and sub-attributes are relevant to all categories of EEE products. For example, ease of maintenance may not apply to USB flash drives, as simply protecting them from physical damage is typically sufficient. Thus, only the applicable attributes and sub-attributes should be used for a specific product category for the durability index. These applicable attributes should be discussed and determined by a group of subject matter experts in the field.
Two general approaches are proposed for measuring the sub-attributes related to the promise of life. The values can be relative to the other products in the same category that are available on the market, or the values can be measured on an absolute scale. Measuring the sub-attributes under functional readiness is adopted from an available repairability indexing method. This section suggests some methods for measuring and indexing the sub-attributes of durability.

4.2.1. Promise of Life

To assess the promise of life attribute, the product’s resistance to degradation and performance deterioration, as well as its ability to stand overstress, should be evaluated [56]. Additionally, the warranty for the product, as the manufacturer’s assurance for minimum life, should also be included in the evaluation and indexing process. For the first three sub-attributes, a relative index could be derived using the life distribution of the considered product as well as other products in the same category. Furthermore, reliability tests based on these three sub-attributes can be designed and performed to evaluate the product. The outcomes of such tests can be used for absolute indexing. The following subsections describe the indexing methods.

Resistance to Degradation, Resistance to Performance Deterioration, and Ability to Stand Overstress: Relative Index

One can measure a relative index by comparing the product’s life distribution with an associated reference life distribution. The reference life distribution can be obtained by testing a comprehensive sample set of similar products available on the market. The considered sample set should adequately reflect the diversity of products within a specific type in terms of their lifespans. Also, the opinions of the experts as well as the customers’ expectations can be considered for further adjustment of the reference life distribution.
For instance, one method for indexing through this comparison can be inspired by stress–strength analysis [56], where the resulting probability of exceeding the target product life distribution compared with the reference life distribution [57] is used as a basis to assign an index for the sub-attributes.

Resistance to Degradation, Resistance to Performance Deterioration, and Ability to Stand Overstress: Absolute Index

One can measure an absolute index using the incomplete Beta distribution [58]. Incomplete Beta distribution can calculate lower-bound reliability using pass-or-fail tests based on the number of tested products, failures, and confidence level [58]. The obtained reliability lower bound can be considered as an index.
Relevant pass-or-fail tests can be selected by considering the product type and based on its common failure modes and mechanisms. Drop test and ingress test are some examples of assessments of handheld electronics. In addition, different standards for such reliability tests exist that can be considered for this purpose.

Manufacturer’s Warranty

The product warranty can also be indexed absolutely and relatively. For an absolute index, the associated index value for different warranty periods can be determined based on experts’ opinions as well as consumers and/or manufacturers’ expectations, which can be collected through surveys. Also, the proportion of the products of the same kind on the market having lower warranty offerings than the target product can be converted to a relative index.
It is worth mentioning that warranties are complex legal agreements, which can make it difficult for consumers to understand their details without legal expertise. In addition, manufacturers offer various warranty options, including extended coverage plans and exclusions, requiring consumers to navigate intricate terms. The claims process, involving documentation, potential shipping costs, and third-party involvement, further adds to the complexity. In this study, we simplify matters by assuming that all warranties are equivalent except for the commitment period.

4.2.2. Functional Readiness

The ease of repair, maintenance, and the ability to upgrade are the sub-attributes that should be indexed by defining relevant, measurable criteria. It should be noted that implicit in these three sub-attributes is the economics aspect. That is, it may be possible that a product may be functionally repairable, maintainable, and upgradable, but the associated costs at one point in the product’s life become exceedingly high, making the product effectively obsolete. This aspect is recognized for now, but the discussions that follow focus on the functional aspects of these three sub-attributes and consider the economic aspect as an implicit factor. To make it consistent with the objectives of product sustainability, it is desirable to have the economics treated explicitly when indexing the durability of the products. This would be the subject of future extensions of this research. One sub-attribute that has seen the most development for indexing is the ease of repair attribute (also known as repairability), where several indexing methods have been introduced. The following subsections discuss examples of approaches and methods for indexing the sub-attributes of functional readiness.

Ease of Repair

The FRI method is a comprehensive approach that has undergone extensive research and development over recent years. In this paper, the FRI method is considered for measuring the ease of repair, as outlined in Section 3.2 [12]. The overall FRI of a product is determined by four general criteria, namely documentation, disassembly, spare parts availability, and spare parts price, as well as an additional product-specific criterion. While the specific details of indexing for all types of EEE have not been made public yet by the French authority, the framework itself, based on these criteria, remains the same across all EEE, as presented in Table 2.

Ease of Maintenance

In this study, maintenance means preventive maintenance. The main difference between maintenance and repair is that maintenance is performed before failure, while repair is conducted after a failure happens. Maintenance is usually performed to decrease or mitigate the effects of damage and degradation. Damage and degradation refer to the gradual decline in a device’s performance, condition, or quality of a device over time. For example, for a vacuum cleaner, it may become noisier, less efficient in picking up dirt and debris, or shows signs of wear and tear on its parts like brushes or filters [59]. This gradual decline at one point reaches the endurance level of the product when a functional failure occurs. Thus, failure should be defined based on the expected function.
In the assessment of both attributes of maintenance and repair, relatively similar criteria can be considered. We suggest using documentation, parts availability, complexity, and cost as the criteria for quantifying the ease of maintenance. Table 3 shows the proposed criteria and sub-criteria as well as the scales of the scores. The sub-criteria weights should be specific to the product category.

Ability to Upgrade

Evaluating the ability to upgrade is a unique and individual process that must be carried out for each product group separately. It involves two key criteria, namely software upgradability and hardware upgradability. For instance, when evaluating smartphones and computers, software and hardware upgrades must be considered, whereas software upgrades are unnecessary for a lawn mower. By regularly upgrading software, devices can remain compatible with evolving applications, security standards, and user needs, which ensures adequate lifespan. Hardware upgradability can be defined as the ability of a device to have its components or parts updated or improved over time to enhance its performance or functionality. Improving RAM (random access memory) and storage drive in desktop computers are common hardware upgrades. The assessment of the ability to upgrade is typically based on the level of commitment demonstrated by the manufacturers in providing these options over time. The fundamental criteria for evaluating this sub-attribute and examples for weights and score range are presented in Table 4.

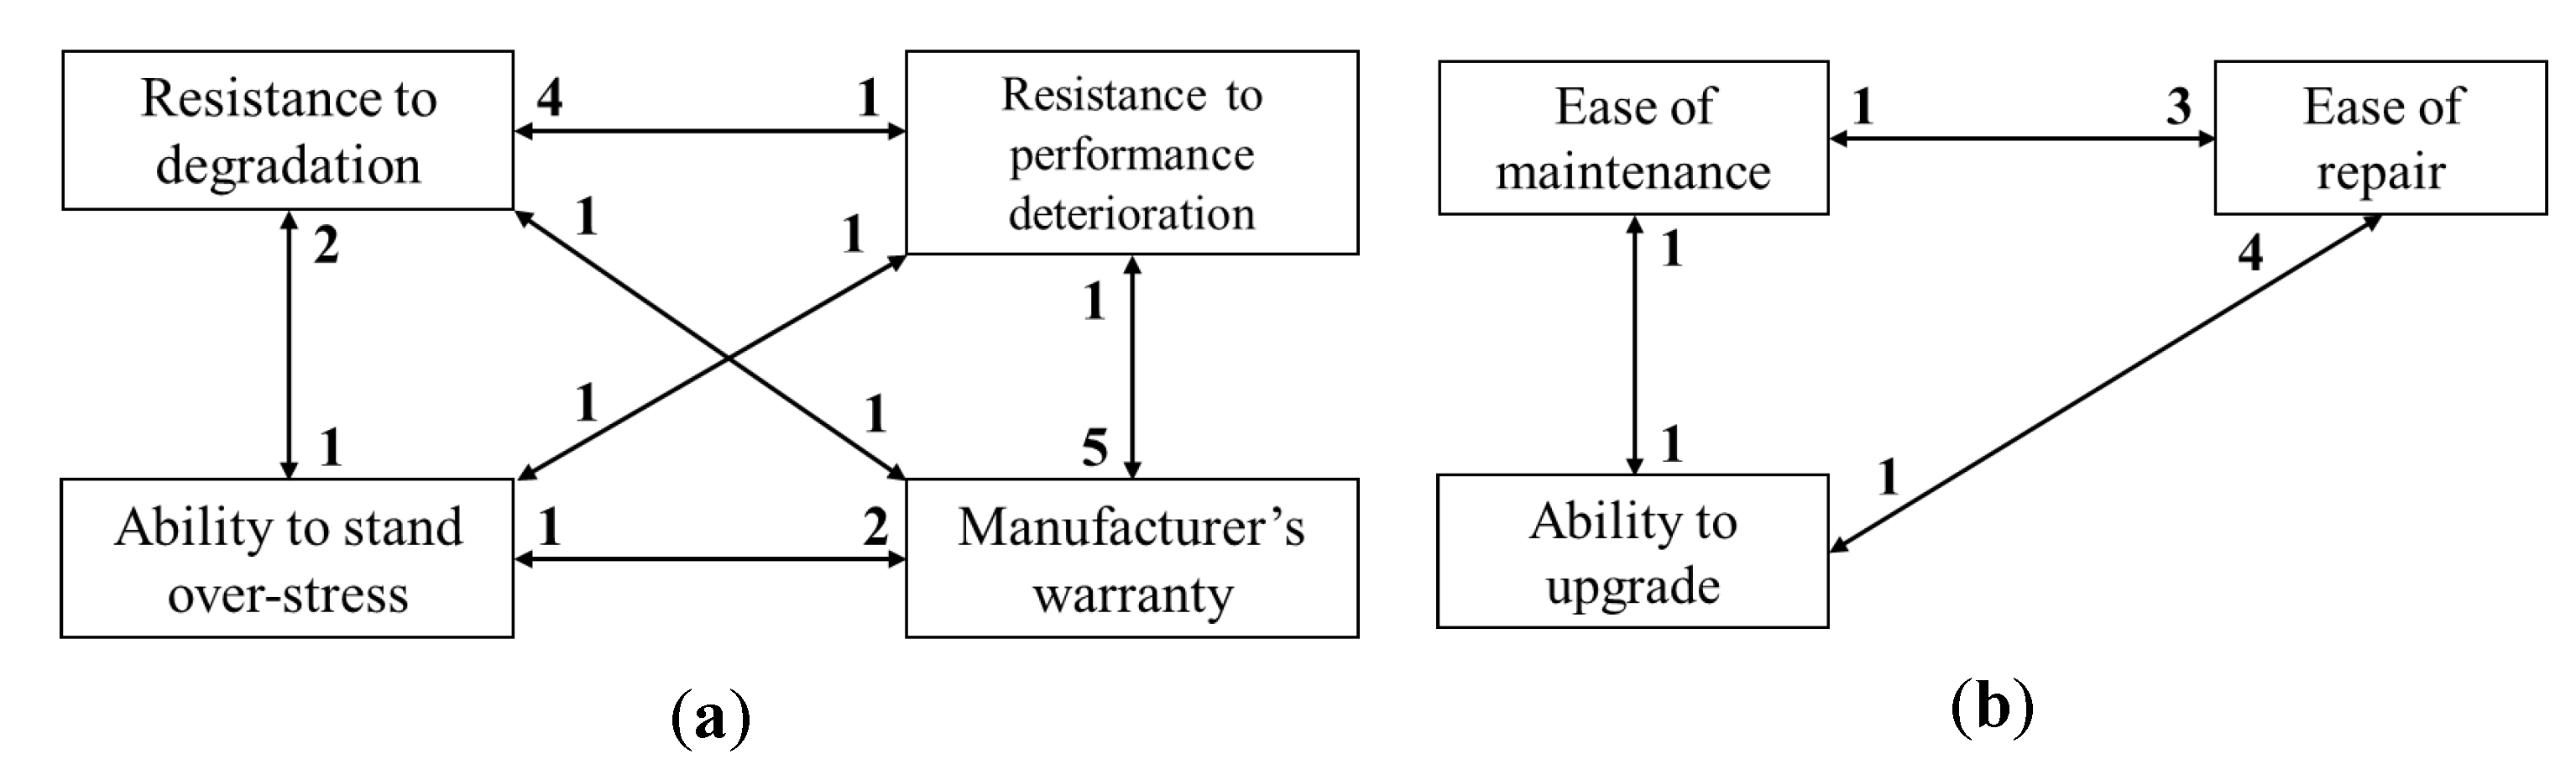
4.2.3. Combining Sub-Attributes and Attributes Indices

This section outlines two ways for calculating and presenting a durability index: (1) as a single index and (2) as a collection of color-coded ordinal measures.

Single Durability Index

Figure 4 illustrates the process of calculating a single durability index using a weighted sum of the proposed durability attributes and sub-attributes. For this purpose, two sets of weights should be predetermined. The first set of weights is used to calculate indices for the durability attributes from their sub-attributes, and the second set is used to calculate the durability index from the two primary attributes (i.e., the promise of life and functional readiness). The analytic hierarchy process (AHP) is proposed for determining the sub-attribute weights through pair-wise comparison of their importance or significance. AHP is a multi-criteria decision-making approach for solving problems with multiple conflicting and subjective criteria [60]. The method involves comparing two elements (sub-attributes) at a time. Ideally, a group of subject matter experts in the relevant field should determine the relative importance of the attributes for each specific product. One can also use swing weighting methods [61] to determine values for the weights. Swing weighting is simpler and more intuitive than AHP for most decision-making scenarios, but AHP’s structured and rigorous approach can be advantageous in situations where precision, consistency, and transparency are paramount [62].

Multi-Measure Durability Index

Due to the fact that a single durability index aggregates multiple measures, it does not provide consumers with information about individual sub-attributes. Although it may be possible to provide consumers with the values for all of the durability attributes and sub-attributes, it may be intimidating and confusing to consumers who are not experts. To overcome this problem, the following approach transforms the measurement for each sub-attribute into an ordinal scale with three values: Below average, Average, and Above average. Associated with each value is a color: red, yellow, and green, respectively. The values are presented using these color-coded scales, as shown in Figure 5. Thresholds for this transformation can either be determined directly by field experts or derived from the distribution of indices across various products of the same type on the market.
One can aggregate the values of sub-attributes by simply counting the number of sub-attributes that have each value. For example, as shown in Figure 5, hypothetical Product X has above-average values on four sub-attributes, average values on three sub-attributes, and below-average values on no sub-attributes. The combination 4-3-0 concisely represents that summary. The combination 3-2-2 represents the durability of Product Y, which has above-average values on three sub-attributes, average values on two sub-attributes, and below-average values on two sub-attributes. Although the combination does not specify which sub-attributes have which values, it does show the distribution of values (on this ordinal scale) across the sub-attributes. In addition to providing a straightforward visual representation, this approach does not require eliciting weights to describe the relative importance of the sub-attributes.

4.3. Implementation of the Proposed Durability Index Framework

The successful implementation of the proposed framework relies heavily on the availability of required information. This information can be obtained through a combination of experimental studies and collaboration with manufacturers. For example, conducting reliability tests allows us to determine the life distribution of the products (which is needed for the relative indexing of the promise of life), while some others like the duration of providing spare parts and supporting software upgrades (which is needed for indexing functional readiness) are determined and known by the manufacturers.
Additionally, an authoritative entity is needed to provide comprehensive instructions encompassing all the necessary guidance and predetermined information required for durability indexing. For example, relative indexing of the promise of life attribute needs reference life distributions which require evaluating products of the same kind from various manufacturers on the market. To ensure consistency across all indices, the determination of the reference life distribution should be entrusted to the authorized authority. Moreover, it is crucial to define the types of tests required for each product category and establish a standardized procedure for conducting these tests. This responsibility should also be assigned to the authorized authority mentioned earlier. Having a centralized body pre-determine the necessary data and testing protocols ensures that the relative and absolute indexing is conducted uniformly and impartially across all products.
On the other hand, manufacturers possess most of the required information about their products for indexing functional readiness. They are aware of the major factors and specifications necessary for indexing functional readiness, such as the ability to disassemble the product and the duration of the availability of maintenance documents. Therefore, there is just a need for clear instructions on how to calculate the index using the available information, which the authorized authority should provide.
The responsibility for calculating and presenting product durability indices can be assigned to manufacturers through self-assessment, similar to the approach implemented for FRI. In this scenario, manufacturers would be required to adhere to predetermined guidelines for determining and disclosing the durability indices of their products. Alternatively, an authorized regulatory body or a third-party entity can be designated to assess the durability index of various products and make the indices publicly available.
Finally, to ensure the indexing framework remains flexible in response to advancing technology and evolving industry standards, it is essential to conduct regular updates. This involves monitoring industry developments and collaborating with experts. These updates can be overseen by an authorized regulatory body or entrusted to a third-party entity.

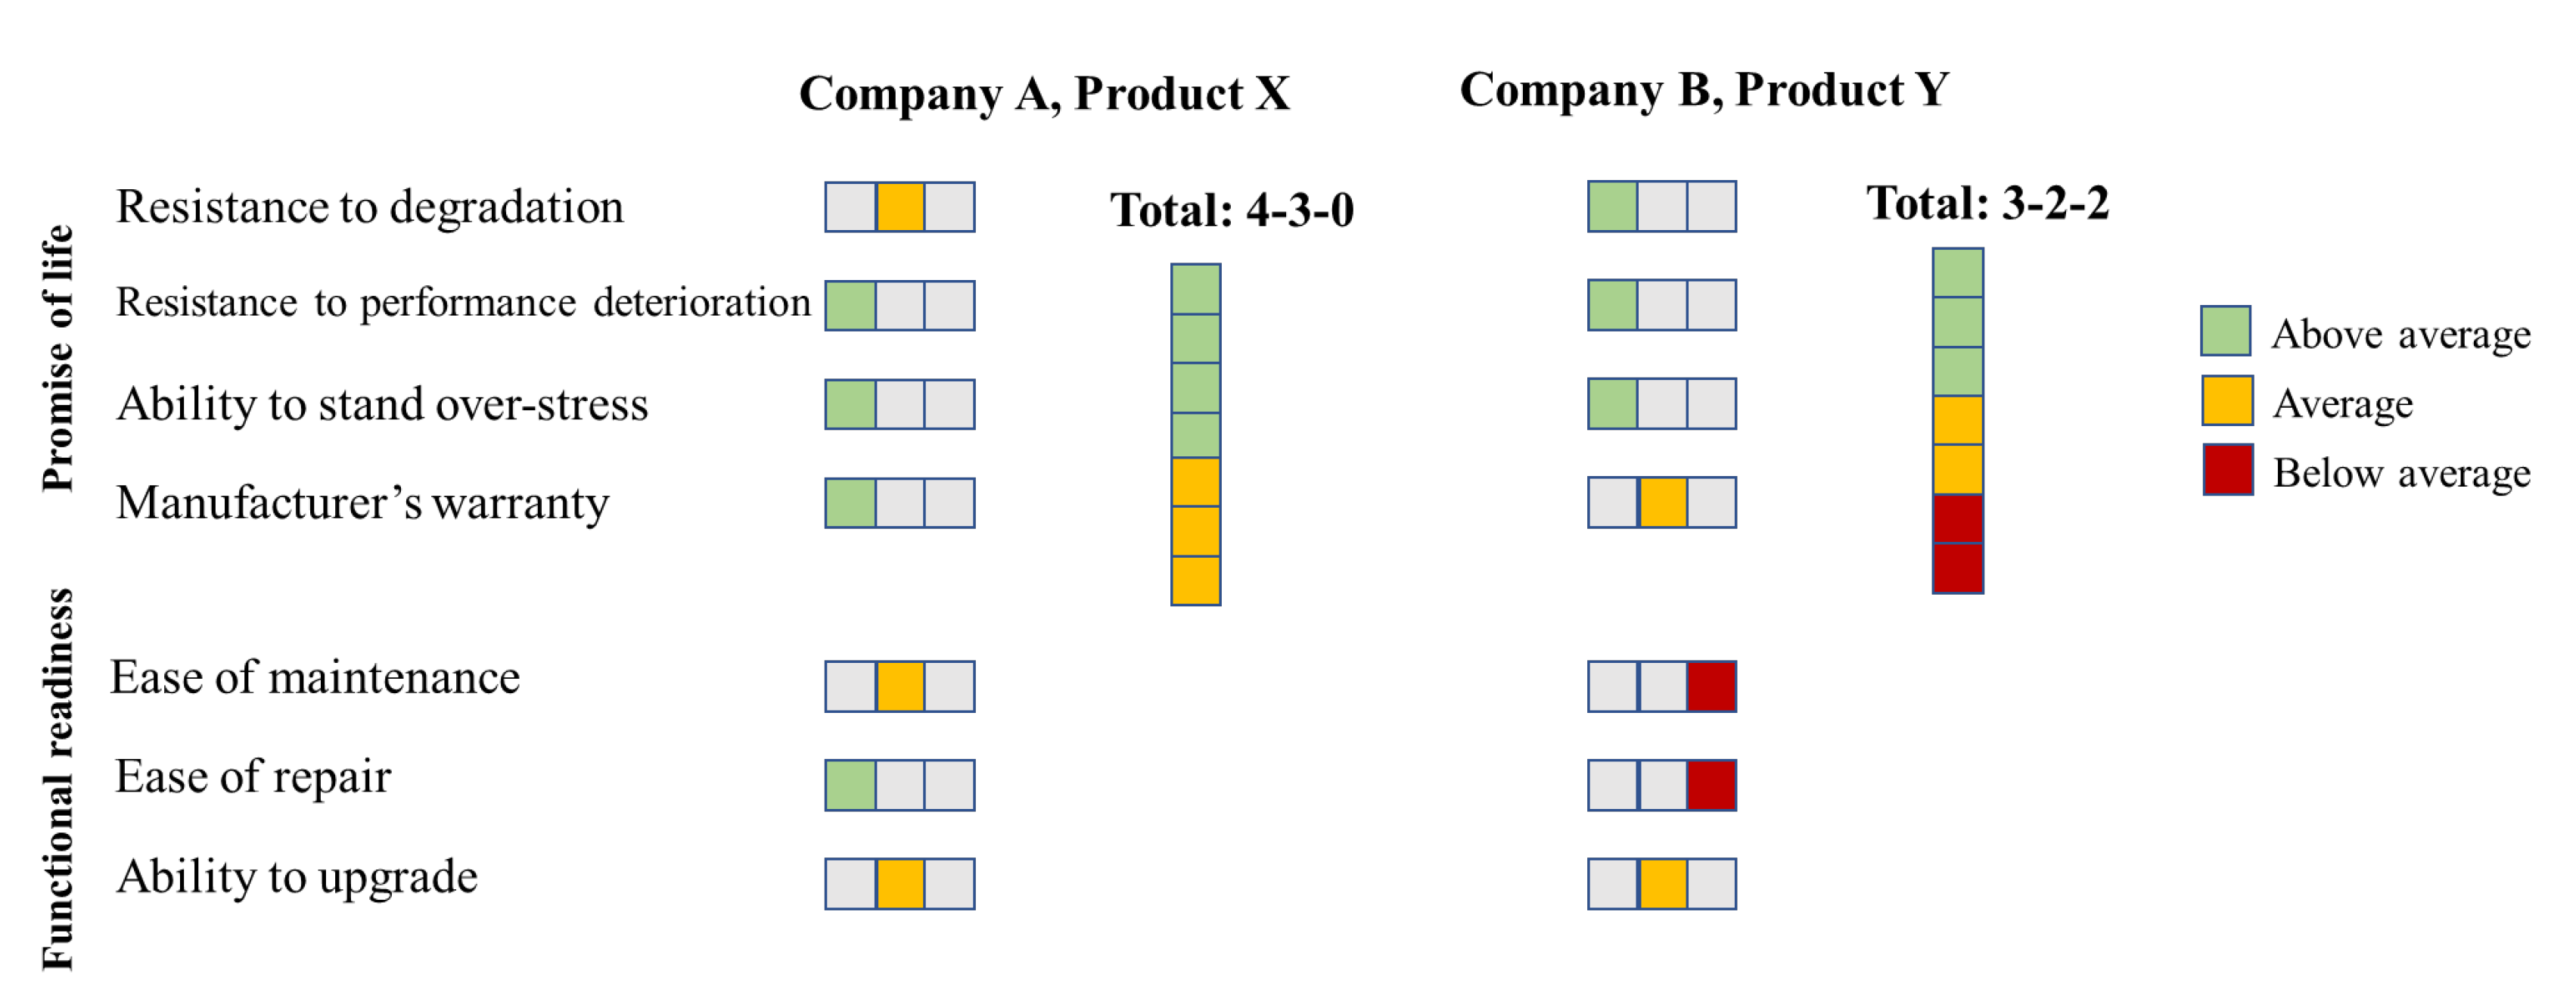
5. Smartphone Durability Indexing: An Application of the Proposed Framework

This section describes the application of the proposed framework by using the product attributes and sub-attributes to assess the durability of a hypothetical smartphone. Smartphones are significant contributors to e-waste in the way that such devices alone contribute to 10% of global e-waste [63]. This example demonstrates the implementation of the proposed framework. A smartphone is a handheld electronic device popular for various on-the-go functions and is routinely used worldwide. Smartphones are vulnerable to multiple failure mechanisms such as water and contamination ingress and mechanical shock. Consideration of these failure mechanisms is critical when designing and evaluating their durability. Due to smartphones’ frequent use during physical activities, they are highly prone to drops and subsequent mechanical shocks. These incidents lead to damage and potential failure. Therefore, it is important to assess the durability of the smartphone by considering this failure mechanism in the field. For the promise of life attribute, this requires evaluating resistance to degradation, resistance to performance deterioration, ability to stand over-stress, and the manufacturer’s warranty. Evaluating the functional readiness attribute requires assessing the ease of maintenance, the ease of repair, and the ability to upgrade. The sub-attributes are indexed and then aggregated using the weights to calculate a single index for the product’s durability. Alternatively, the multi-measure durability index provides a more transparent and straightforward communication on product durability by expressing the sub-attributes’ values on an ordinal scale.

5.1. Promise of Life

Smartphones can encounter various operating conditions and experience different failure mechanisms throughout life. For example, they may be exposed to humid environments leading to corrosion or be subjected to thermal cycling conditions resulting in fatigue. However, mechanical shock can be considered the main failure mechanism for smartphones since the accidental drop of the device during daily activities is a commonly observed user behavior. Multiple drops cause a gradual progress of degradation (e.g., propagation of a crack on the device casing). This accumulation of damage can ultimately lead to device failure (e.g., broken casing and damage to other parts). However, the progress of degradation during drops does not always decrease device performance. For example, a cracked smartphone may still perform its intended functions properly. Conversely, degradation can significantly impact performance. For example, a tiny crack in the casing may cause excessive noise in the output voice of the phone, depending on the product design. Therefore, degradation and performance should be considered independent of each other in evaluating the durability. Furthermore, extreme stresses beyond the smartphone’s strength limit, such as a drop from a high elevation or drop during strenuous activities, can cause immediate failure in a single shot. Hence, in addition to resistance to degradation and performance deterioration, the ability to stand overstress should also be considered separately in indexing the durability of smartphones.
In this section, relative and absolute indices for the sub-attributes related to the promise of life are obtained. As mentioned, these sub-attributes can be relatively indexed by comparing the product life distribution with a reference life distribution associated with other smartphones on the market. The probability of exceeding the reference life distribution by the target product life distribution [57] assigns a relative index for each sub-attribute. Additionally, an absolute index can be calculated using incomplete Beta distribution [58] based on pass-or-fail tests of the smartphone.
Due to the limitations of available data and information needed for indexing the sub-attributes, certain assumptions were made during the indexing procedure. The required data for relative and absolute indexing of the sub-attributes under the promise of life and the way they should be collected, as well as related assumptions for this example, are summarized in Table 5 and Table 6.

5.1.1. Resistance to Degradation

It is assumed that the life distribution of the product could be represented by a two-parameter Weibull distribution with the shape parameter of 2 and scale parameter of 92 drops. Additionally, it is assumed that a normal distribution with a mean of 100 drops and a standard deviation of 30 drops can represent the lifespan of similar products in the same category from different manufacturers on the market. The relative index of 0.34 was obtained based on the probability of exceeding the assumed reference life distribution. Additionally, assuming 2 failures out of 50 smartphones after a set of cycle-terminated drop tests, an index of 0.88 was obtained based on the reliability lower bound calculated for the confidence level of 95% using incomplete Beta distribution.

5.1.2. Resistance to Performance Deterioration

Resistance to performance deterioration can also be indexed relatively or absolutely, similar to the degradation, with the difference that the target product life distribution and reference life distribution are obtained based on the decrease in the performance (e.g., reduction in quality or volume of smartphone output). Assuming the smartphone’s life distribution associated with performance follows an exponential distribution ( f x = λ e λ x ) with λ = 5 × 10 3 while the life distribution of a sufficient sample of similar products from different manufacturers could be represented by a normal distribution with a mean of 90 drops and a standard deviation of 5 drops, the relative performance index would be 0.63. In addition, using incomplete Beta distribution, an absolute index of 0.85 was obtained by the assumption that 3 out of 50 sample smartphones fail after a specific predetermined cycle-terminated drop test.

5.1.3. Ability to Stand Over-Stress

Product life distribution and its associated reference life distributions should be considered based on stress intensity (i.e., drop height) for a relative index for the ability to stand overstress. Assuming that a normal distribution with a mean of 4 m and a standard deviation of 1 m represents the destruct height for the smartphone and a normal distribution with a mean of 3 m and a standard deviation of 2 m for reference, representing destruct heights of similar products on the market, the relative index would be 0.67. Also, regarding the absolute indexing, assuming 1 failure out of 100, an index of 0.95 was obtained.

5.1.4. Manufacturer’s Warranty

Assuming a 12-month warranty period for the target product and a normal distribution with a mean of 15 months and a standard deviation of 3 months representing the available warranties for similar products on the market, a relative score of 0.22 was obtained for the warranty. For determining the absolute warranty index, a reference table similar to Table 7 should be defined by experts. For the smartphone, a 12-month warranty means an absolute index of 0.5, according to the table.

5.2. Functional Readiness

Manufacturers have been sharing the repairability index for a wide range of smartphones sold in France with the public [12]. However, detailed scoring information has yet to be provided. Despite this, the repairability index still offers insight into whether a product is repairable or needs to be replaced in the event of a part failure. The proposed method for functional readiness indexing adopts the FRI framework and extends it to evaluate not only repairability but also maintainability and upgradability. This section presents indexing the sub-attributes under the functional readiness attribute.
Most of the required information for indexing the sub-attributes is known by the manufacturers themselves (e.g., duration of software updates) or needs experimental investigations on real products (e.g., opening real products and counting the number of steps for disassembling different parts). Table 8 provides the required data for indexing the sub-attributes under functional readiness and how to collect data for an objective assessment.

5.2.1. Ease of Repair

Most of the provided repairability indices by the manufacturers for the smartphones sold in France typically range from 4.5 to 9. These indices reflect significant differences in the repairability of various models and brands. A smartphone with an index of 4.5 will likely be more replaceable than repairable. Replaceable products can be defined as products whose repair is challenging, and consumers are not mainly willing to repair them as the price of a new product may be close to the repair cost. An index of 9 indicates a high likelihood of successfully repairing a malfunctioning smartphone. In a study [64], several devices were meticulously evaluated and compared against the manufacturers’ provided repairability indices. The findings revealed certain inconsistencies in the reported indices. However, for the purpose of our hypothetical smartphone example, we assumed a repairability index of 5.8 out of 10 (calculated for the Apple iPhone 7), which can be further explored in detail in [64].

5.2.2. Ease of Maintenance

Unlike repair, which is performed after failure occurrence, preventive maintenance is performed before failures to avoid them. That is why repair has been considered as corrective maintenance, as it aims to correct the issue after it takes place. Four criteria of documentation, parts availability, complexity, and cost were introduced before for measuring maintainability. Like many other consumer electronics, smartphones do not need considerable maintenance.
The only maintenance activities applicable to smartphones include regular cleaning of dust and contaminants and drying of moisture and droplets, specifically at the ports and openings. Cleaning and drying are usually straightforward processes without the need for specific expertise, tools, and environment. Additionally, there is no cost for such maintenance activities typically, as there are readily available online instructions that offer DIY guidance free of charge [65]. Also, parts availability does not apply to them. Therefore, assuming that there is no exceptional difficulty or challenge in any of the criteria for maintenance of the smartphone, it is reasonable to consider that smartphones are highly maintainable and receive the full index (i.e., index of 1) for maintainability.

5.2.3. Ability to Upgrade

The ability to upgrade sub-attribute has two primary criteria: software and hardware. Assessing the ability to upgrade is product-specific, and experts in the field should evaluate potential upgrades across various product categories. Nevertheless, a general criterion for quantifying software upgradability can be the duration of commitment to provide software updates, encompassing both application and security aspects. For converting software update commitments of the manufacturer into an index, there is a need for a reference table like Table 9. This table should be determined by experts in the field based on the consumer needs and manufacturers’ commitment to supporting software updates for products on the market. Assuming smartphone manufacturer offers five years of support for applications and ten years for security [66], considering Table 9 as an example for the reference table, the product obtains scores of 10 and 25 out of 25 for application and security aspects, respectively. Moreover, although hardware upgrades for smartphones are infrequent, the potential to expand memory and add a secondary SIM card can still serve as examples of hardware upgradability. Binary indices can be used for quantifying hardware upgradability of smartphones. Assuming there is potential for increasing memory capacity and adding a secondary SIM, Table 10 represents the resulting upgradability index.

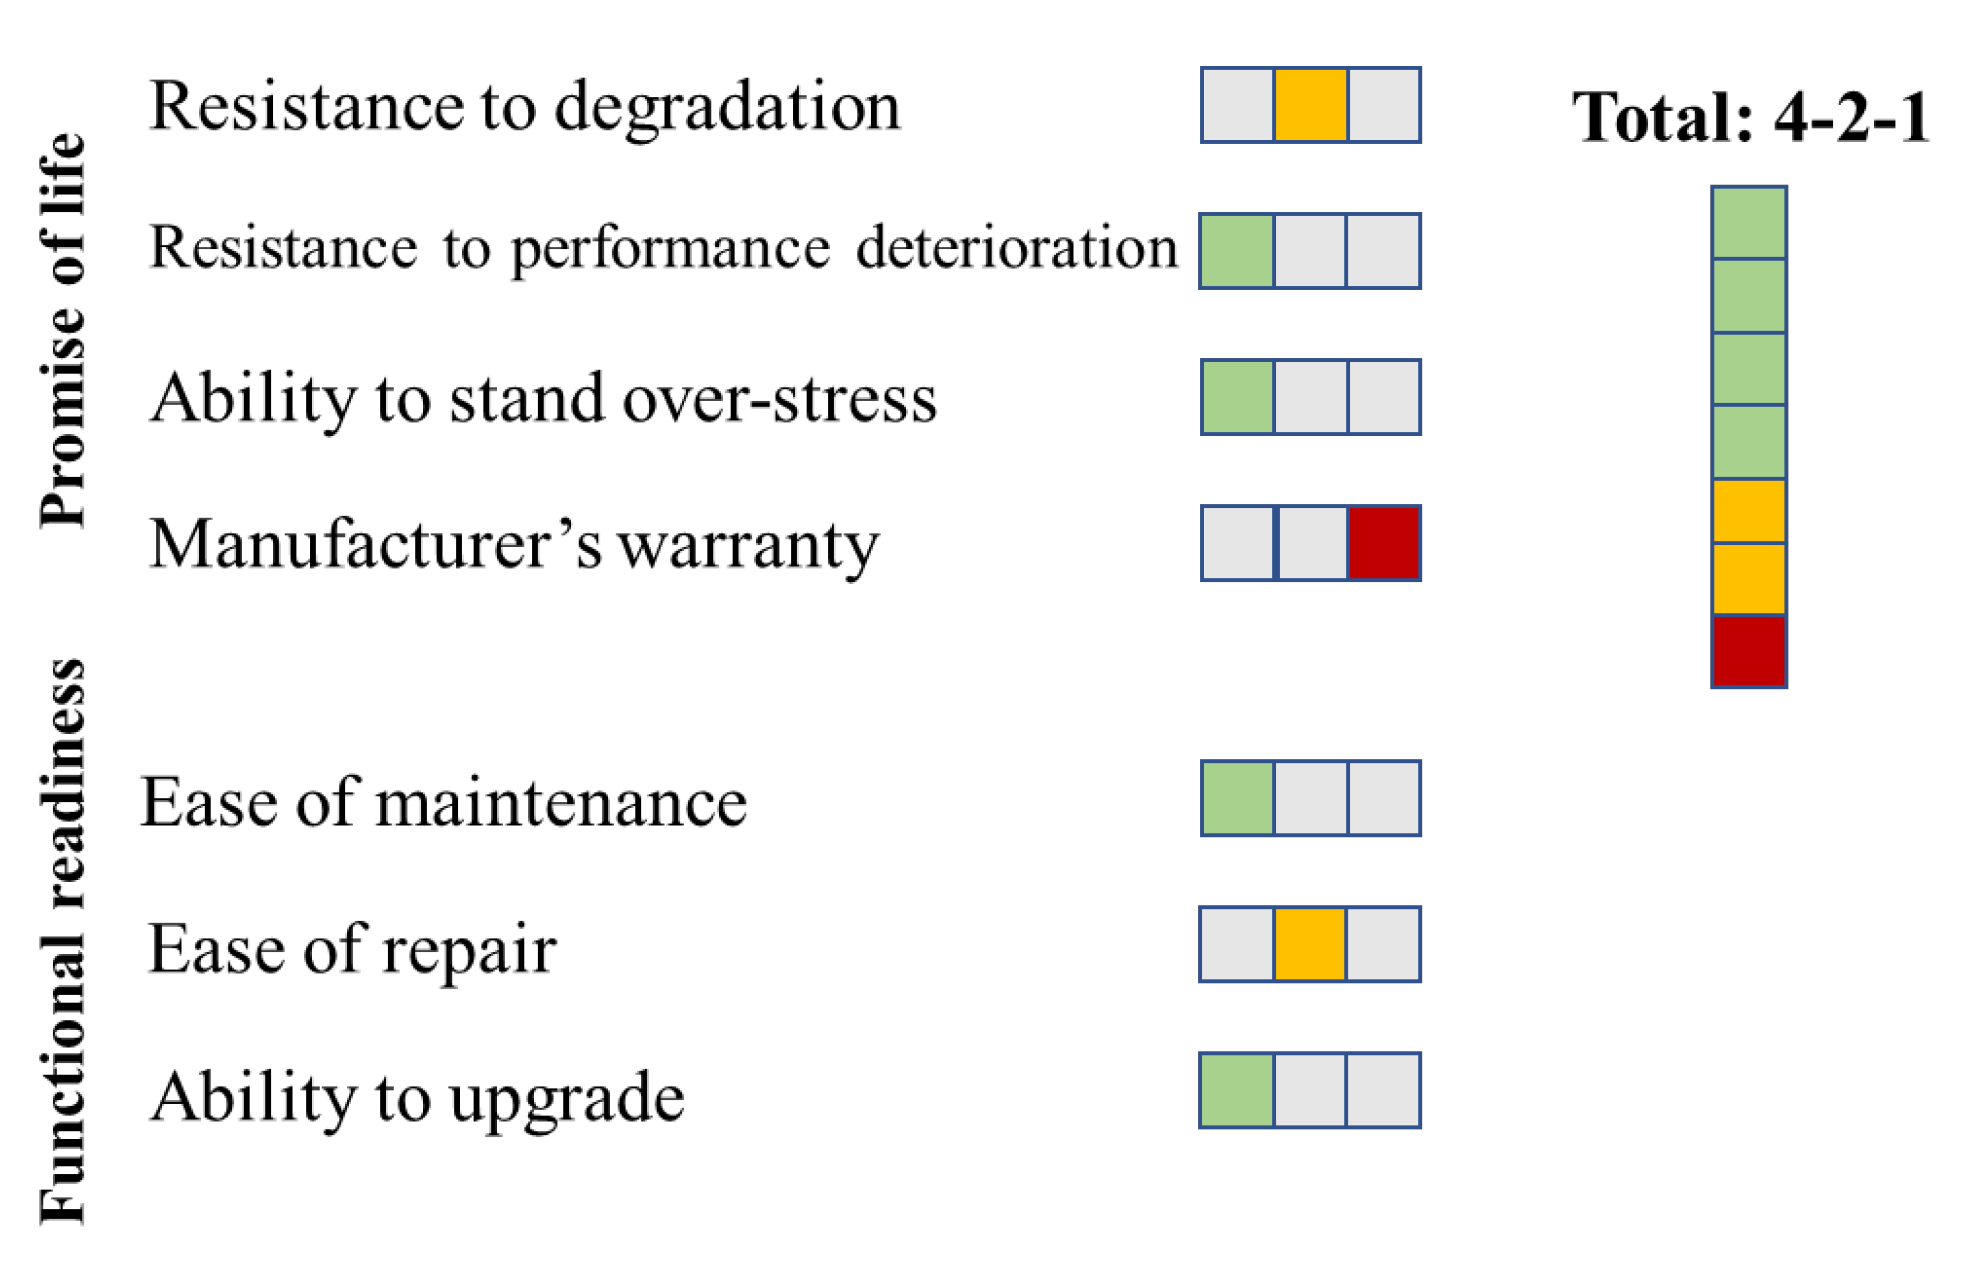
5.3. Combining Sub-Attributes and Attributes Indices

Table 11 summarizes the obtained indices for the sub-attributes in the previous sections. In the remainder of this study, relative indices have been considered for the sub-attributes under the promise of life. This section presents the results of combining sub-attributes indices for calculating a durability index for the smartphone. For this purpose, two methods of single and multi-measure indices were considered.

5.3.1. Single Durability Index

The weighted sum of the sub-attribute indices at the lower level and then attribute indices at the higher level result in a single durability index. AHP was used to determine the weight of each sub-attribute. The pair-wise comparisons should generally be made by a group of experts in the field, and there can be a significant number of discussions regarding the relative impact of sub-attributes on durability. For this example, just for demonstration and based on a general understanding of the smartphones, the comparisons between sub-attributes were performed, and the results are shown in Figure 6. Using AHP, the relationships for calculating the durability index were obtained, as presented in Equation (1). Based on the calculated indices for the sub-attributes in the previous sections (Table 11), indices of 0.37 and 0.70 were obtained for the promise of life and functional readiness, respectively. Finally, assuming that the promise of life has two times more effect on the smartphones’ durability than the functional readiness, 0.47 is the calculated single-indexed durability for the considered smartphone.
Durability = 0.66 × Promise of life + 0.33 × Functional readiness
Promise of life = 0.36 × Resistance to degradation + 0.1 × Resistance to performance drop + 0.15 × Ability to stand overstress + 0.38 × Manufacturer’ s warranty
Functional readiness = 0.63 × Ease of repair + 0.19 × Ease of maintenance + 0.17 × Ability to upgrade

5.3.2. Multi-Measure Durability Index

The sub-attribute indices can be transformed into an ordinal scale associated with distinct colors using a reference table such as Table 12 (In other settings, the mapping may be different for each sub-attribute, but here we use only one). Due to the fact that three of the values are above average, two are average, and two are below average, the combination 3-2-2 concisely represents the durability of the smartphone, as shown in Figure 7.

6. Conclusions

The growing production of e-waste and use of limited resources, which cause serious negative impacts on health and the environment, have led to efforts to adopt a circular economy. As a result, many governments have begun promoting or adopting rules for manufacturing more durable products as a key pillar of the circular economy to minimize e-waste and resource extraction. An effective way to achieve this is by measuring and indexing the durability of EEE, which serves two purposes: to inform consumers about products’ lifespans and to incentivize manufacturers to design and manufacture more durable products. However, there is currently no existing method for indexing durability that can be applied for this purpose.
The framework introduced in this paper proposed a new indexing approach for the durability of EEE in the circular economy context. For this purpose, the promise of life and functional readiness have been recognized as two essential product attributes directly affecting product durability. This study identified relevant sub-attributes of these two attributes. It outlines some possible methods to quantify the indices of the attributes and sub-attributes as well as the overall durability index.
The proposed framework provides a basis to practically assign a durability index by the handheld electronic product manufacturers, the standard development organizations, policy development, and government agencies. Such an index transforms how consumers gauge product lifetime and manufacturers communicate it to consumers effectively. Manufacturers can use it as a guide to design more robust and longer-lasting products, while standard development organizations can support the development of standards and guidelines. The framework can also support government agencies to incentivize the adoption of durability standards as part of sustainability initiatives.
Finally, aside from durability, the circular economy includes other aspects like reusability and remanufacturability that impact the quantity of e-waste generated and the resources consumed. However, these aspects are not part of the proposed framework. Furthermore, the proposed framework, particularly the “promise of life” attribute, requires data on the reliability and performance of the products available on the market. For the benefit of the whole industry, such data need to be made available and shared through a consortium of manufacturers.

Author Contributions

Conceptualization, M.M. and J.W.H.; methodology, M.M., J.W.H. and H.H.N.A.; software, H.H.N.A.; formal analysis, H.H.N.A.; investigation, H.H.N.A.; resources, M.M.; data curation, H.H.N.A.; writing—original draft preparation, H.H.N.A.; writing—review and editing, M.M. and J.W.H.; visualization, H.H.N.A.; supervision, M.M.; project administration, M.M.; funding acquisition, M.M. All authors have read and agreed to the published version of the manuscript.

Funding

This research was funded by Amazon’s Lab 126 through a collaborative research grant on Advancing Reliability Engineering Research and Education.

Institutional Review Board Statement

Not applicable.

Informed Consent Statement

Not applicable.

Acknowledgments

The authors thank Aaron Krive and Maxim Nikiforov of Amazon’s Lab126 for their significant input throughout all aspects of our study and for their help in editing and providing critical comments on the manuscript.

Conflicts of Interest

The authors declare no conflict of interest.

References

  1. Forti, V.; Balde, C.P.; Kuehr, R.; Bel, G.; Monitor, T.G.E.-W. 2020: Quantities, Flows and the Circular Economy Potential; United Nations University (UNU)/United Nations Institute for Training and Research (UNITAR): Bonn, Germany; International Telecommunication Union (ITU): Geneva, Switzerland; International Solid Waste Association (ISWA): Rotterdam, The Netherlands, 2020. [Google Scholar]
  2. Möslinger, M.; Almásy, K.; Jamard, M.; De Maupeou, H. Towards an Effective Right to Repair for Electronics; Publications Office of the European Union: Luxembourg, 2022. [Google Scholar]
  3. Grant, K.; Goldizen, F.C.; Sly, P.D.; Brune, M.-N.; Neira, M.; Berg, M.V.D.; Norman, R.E. Health consequences of exposure to e-waste: A systematic review. Lancet Glob. Health 2013, 1, e350–e361. [Google Scholar] [CrossRef] [PubMed]
  4. Noel-Brune, M.; Goldizen, F.C.; Neira, M.; Berg, M.V.D.; Lewis, N.; King, M.; Suk, W.A.; Carpenter, D.O.; Arnold, R.G.; Sly, P.D. Health effects of exposure to e-waste. Lancet Glob. Health 2013, 1, e70. [Google Scholar] [CrossRef] [PubMed]
  5. Robinson, B.H. E-waste: An assessment of global production and environmental impacts. Sci. Total. Environ. 2009, 408, 183–191. [Google Scholar] [CrossRef] [PubMed]
  6. Akram, R.; Fahad, S.; Hashmi, M.Z.; Wahid, A.; Adnan, M.; Mubeen, M.; Khan, N. Trends of electronic waste pollution and its impact on the global environment and ecosystem. Environ. Sci. Pollut. Res. 2019, 26, 16923–16938. [Google Scholar] [CrossRef] [PubMed]
  7. Kaya, M. Recovery of metals and nonmetals from electronic waste by physical and chemical recycling processes. Waste Manag. 2016, 57, 64–90. [Google Scholar] [CrossRef] [PubMed]
  8. Li, W.; Achal, V. Environmental and health impacts due to e-waste disposal in China–A review. Sci. Total. Environ. 2020, 737, 139745. [Google Scholar] [CrossRef] [PubMed]
  9. Cooper, T. Inadequate life? Evidence of consumer attitudes to product obsolescence. J. Consum. Policy 2004, 27, 421–449. [Google Scholar] [CrossRef]
  10. Mugge, R. Product design and consumer behaviour in a circular economy. Sustainability 2018, 10, 3704. [Google Scholar] [CrossRef]
  11. Shevchenko, T.; Saidani, M.; Ranjbari, M.; Kronenberg, J.; Danko, Y.; Laitala, K. Consumer behavior in the circular economy: Developing a product-centric framework. J. Clean. Prod. 2023, 384, 135568. [Google Scholar] [CrossRef]
  12. Ministry of Ecological Transition and Territorial Cohesion, Ministry of Energy Transition of France Repairability Index. 1 December 2022. Available online: https://www.ecologie.gouv.fr/indice-reparabilite#scroll-nav__5 (accessed on 14 April 2023).
  13. Sariatli, F. Linear economy versus circular economy: A comparative and analyzer study for optimization of economy for sustainability. Visegr. J. Bioecon. Sustain. Dev. 2017, 6, 31–34. [Google Scholar] [CrossRef]
  14. Geissdoerfer, M.; Pieroni, M.P.; Pigosso, D.C.; Soufani, K. Circular business models: A review. J. Clean. Prod. 2020, 277, 123741. [Google Scholar] [CrossRef]
  15. IEEE1680.1-2018; IEEE Standard for Environmental and Social Responsibility Assessment of Computers and Displays. IEEE: New York, NY, USA, 2018. Available online: https://ieeexplore.ieee.org/document/8320570 (accessed on 25 February 2023).
  16. Chen, Y. On the competition between two modes of product recovery: Remanufacturing and refurbishing. Prod. Oper. Manag. 2019, 28, 2983–3001. [Google Scholar] [CrossRef]
  17. Cui, J.; Roven, H.J.; Waste, E. Waste: A Handbook for Management; Academic Press: Cambridge, MA, USA, 2011; pp. 281–296. [Google Scholar]
  18. Geissdoerfer, M.; Savaget, P.; Bocken, N.M.; Hultink, E.J. The Circular Economy–A new sustainability paradigm? J. Clean. Prod. 2017, 143, 757–768. [Google Scholar] [CrossRef]
  19. Vidal-Ayuso, F.; Akhmedova, A.; Jaca, C. The circular economy and consumer behaviour: Literature review and research directions. J. Clean. Prod. 2023, 418, 137824. [Google Scholar] [CrossRef]
  20. Islam, M.T.; Huda, N.; Baumber, A.; Shumon, R.; Zaman, A.; Ali, F.; Hossain, R.; Sahajwalla, V. A global review of consumer behavior towards e-waste and implications for the circular economy. J. Clean. Prod. 2021, 316, 128297. [Google Scholar] [CrossRef]
  21. Watson, D.; Gylling, A.C.; Tojo, N.; Throne-Holst, H.; Bauer, B.; Milios, L. Circular Business Models in the Mobile Phone Industry; Nordic Council of Ministers: Copenhagen, Denmark, 2017.
  22. Cooper, T. Slower consumption reflections on product life spans and the “throwaway society”. J. Ind. Ecol. 2005, 9, 51–67. [Google Scholar] [CrossRef]
  23. Merriam-Webster Online Dictionary; Durable. Available online: https://www.merriam-webster.com/dictionary/durability#h1 (accessed on 24 February 2023).
  24. Soukhanov, H. Websters II New Riverside University Dictionary; Houghton-Mifflin Company: Boston, MA, USA, 1984. [Google Scholar]
  25. Cooper, T. Beyond Recycling: The Longer Life Option; New Economics Foundation: London, UK, 1994. [Google Scholar]
  26. ISO 19867-1:2018; Clean Cookstoves and Clean Cooking Solutions—Harmonized Laboratory Test Protocols—Part 1: Standard Test Sequence for Emissions and Performance, Safety and Durability. ISO: Geneva, Switzerland, 2018. Available online: https://www.iso.org/standard/66519.html (accessed on 27 February 2023).
  27. ISO 28842:2013; Guidelines for Simplified Design of Reinforced Concrete Bridges. ISO: Geneva, Switzerland, 2013. Available online: https://www.iso.org/standard/56096.html (accessed on 27 February 2023).
  28. Department of Defense. MIL-HDBK-470A Designing and Developing Maintainable Products and Systems. 4 August 1997. Available online: https://www.acqnotes.com/Attachments/MIL-HDBK-470A.pdf (accessed on 27 February 2023).
  29. Department of Defense. MIL-STD-721C Definitions of Terms for Reliability and Maintainability. 1981. Available online: http://everyspec.com/MIL-STD/MIL-STD-0700-0799/MIL-STD-721C_1040/ (accessed on 27 February 2023).
  30. EN 45552:2020; General Method for the Assessment of the Durability of Energy-Related Products. European Committee for Standardization: Luxembourg, 2020. Available online: https://standards.iteh.ai/catalog/standards/cen/ed936aa8-4368-4a13-bae1-93ec80357a95/en-45552-2020 (accessed on 2 March 2023).
  31. ISO 11994:1997; Cranes—Availability—Vocabulary. ISO: Geneva, Switzerland, 1997. Available online: https://www.iso.org/standard/20622.html (accessed on 24 February 2023).
  32. ISO 14708-5:2020; Implants for Surgery—Active Implantable Medical Devices—Part 5: Circulatory Support Devices. ISO: Geneva, Switzerland, 2020. Available online: https://www.iso.org/standard/69898.html (accessed on 24 February 2023).
  33. ISO 11108:1996; Information and Documentation—Archival Paper—Requirements for Permanence and Durability. ISO: Geneva, Switzerland, 1996. Available online: https://www.iso.org/standard/1708.html (accessed on 27 February 2023).
  34. French Agency for Environment and Energy Management (ADEME). Preparatory Study for the Introduction of a Durability Index. July 2021. Available online: https://librairie.ademe.fr/dechets-economie-circulaire/4853-preparatory-study-for-the-introduction-of-a-durability-index.html (accessed on 20 February 2023).
  35. Cordella, M.; Alfieri, F.; Clemm, C.; Berwald, A. Durability of smartphones: A technical analysis of reliability and repairability aspects. J. Clean. Prod. 2020, 286, 125388. [Google Scholar] [CrossRef] [PubMed]
  36. European Commission. Circular Economy: New Rules to Make Phones and Tablets More Durable, Energy Efficient and Easier to Repair, Enabling Sustainable Choices by Consumers. 16 June 2023. Available online: https://ec.europa.eu/commission/presscorner/detail/en/ip_23_3315 (accessed on 14 July 2023).
  37. Khan, M.A.; Mittal, S.; West, S.; Wuest, T. Review on upgradability-A product lifetime extension strategy in the context of product service systems. J. Clean. Prod. 2018, 204, 1154–1168. [Google Scholar] [CrossRef]
  38. Cordella, M.; Alfieri, F.; Sanfelix, J. Guidance for the Assessment of Material Efficiency: Application to Smartphones; Joint Research Center: Seville, Spain, 2020. [Google Scholar]
  39. Stamminger, R.; Tecchio, P.; Ardente, F.; Mathieux, F.; Niestrath, P. Towards a durability test for washing-machines. Resour. Conserv. Recycl. 2018, 131, 206–215. [Google Scholar] [CrossRef]
  40. Defense, D.O. MIL-HDBK-338A Electronic Reliability Design Handbook. 1988. Available online: https://www.navsea.navy.mil/Portals/103/Documents/NSWC_Crane/SD-18/Test%20Methods/MILHDBK338B.pdf (accessed on 27 February 2023).
  41. Defense, D.O. MIL-HDBK-217F Reliability Prediction of Electronic Equipment. 1990. Available online: http://everyspec.com/MIL-HDBK/MIL-HDBK-0200-0299/MIL-HDBK-217F_14591/ (accessed on 27 February 2023).
  42. 1413.1-1998; IEEE Standard for Reliability Qualification of Integrated Circuits. IEEE: New York, NY, USA, 1998.
  43. IEC 60068; Environmental Testing. International Electrotechnical Commission: Geneva, Switzerland, 2017.
  44. JESD22-B102E; Accelerated Stress Testing, Bias Life Test, and Burn-In of Integrated Circuits. Joint Electron Device Engineering Council: Arlington County, VA, USA, 2018.
  45. Davila-Frias, A.; Yadav, O.P.; Marinov, V. A review of methods for the reliability testing of flexible hybrid electronics. IEEE Trans. Compon. Packag. Manuf. Technol. 2020, 10, 1902–1912. [Google Scholar] [CrossRef]
  46. Song, Y.; Wang, B. Survey on reliability of power electronic systems. IEEE Trans. Power Electron. 2012, 28, 591–604. [Google Scholar] [CrossRef]
  47. Richter, J.L.; Svensson-Hoglund, S.; Dalhammar, C.; Russell, J.D.; Thidell, Å. Taking stock for repair and refurbishing: A review of harvesting of spare parts from electrical and electronic products. J. Ind. Ecol. 2023, 27, 868–881. [Google Scholar] [CrossRef]
  48. Fazio, F.D.; Bakker, C.; Flipsen, B.; Balkenende, R. The Disassembly Map: A new method to enhance design for product repairability. J. Clean. Prod. 2021, 320, 128552. [Google Scholar] [CrossRef]
  49. EN 45554:2020; General Methods for the Assessment of the Ability to Repair, Reuse and Upgrade Energy-Related Products. European Committee for Standardization: Luxembourg, 2020. Available online: https://standards.iteh.ai/catalog/standards/clc/ed9b48c0-a4a9-421a-a14f-4ff341199918/en-45554-2020 (accessed on 5 March 2023).
  50. Cordella, M.; Alfieri, F.; Sanfelix, J. Analysis and Development of a Scoring System for Repair and Upgrade of Products; Joint Research Center: Seville, Spain, 2019. [Google Scholar]
  51. Bracquené, E.; Brusselaers, J.; Dams, Y.; Peeters, J.; Schepper, K.D.; Duflou, J.; Dewulf, W. Repairability Criteria for Energy Related; BeNeLux: Brussels, Belgium, 2018. [Google Scholar]
  52. ONR 192102:2006; Durability Mark for Electric and Electronic Appliances Designed for Easy Repair (White and Brown Goods) (Austrian Standard). Austrian Standardization Institute: Vienna, Austria, 2006. Available online: https://webstore.ansi.org/standards/on/onr1921022006 (accessed on 5 March 2023).
  53. Flipsen, B.; Huisken, M.; Opsomer, T.; Depypere, M. Smartphone reparability scoring: Assessing the self-repair potential of mobile ICT devices. In PLATE.; European Union: Brussels, Belgium, 2019. [Google Scholar]
  54. Dangal, S.; Faludi, J.; Balkenende, R. Design Aspects in Repairability Scoring Systems: Comparing Their Objectivity and Completeness. Sustainability 2022, 14, 8634. [Google Scholar] [CrossRef]
  55. Bracquene, E.; Peeters, J.; Alfieri, F.; Sanfelix, J.; Duflou, J.; Dewulf, W.; Cordella, M. Analysis of evaluation systems for product repairability: A case study for washing machines. J. Clean. Prod. 2021, 281, 125122. [Google Scholar] [CrossRef]
  56. Modarres, M.; Kaminskiy, M.P.; Krivtsov, V. Reliability Engineering and Risk Analysis: A Practical Guide; CRC Press: Boca Raton, FL, USA, 2009. [Google Scholar]
  57. Wei, Z.; Hamilton, J.; Ling, J.; Pan, J. Reliability Analysis Based on Stress–Strength Interference Model. Wiley Encyclopedia of Electrical and Electronics Engineering; Wiley: Hoboken, NJ, USA, 1999; pp. 1–4. [Google Scholar]
  58. Crowder, M.J.; Kimber, A.C. Statistical modeling of reliability using the incomplete beta distribution. Technometrics 1999, 41, 147–157. [Google Scholar]
  59. Harmer, L.; Cooper, T.; Fisher, T.; Salvia, G.; Barr, C. Design, Dirt and Disposal: Influences on the maintenance of vacuum cleaners. J. Clean. Prod. 2019, 228, 1176–1186. [Google Scholar] [CrossRef]
  60. Ishizaka, A.; Labib, A. Review of the main developments in the analytic hierarchy process. Expert Syst. Appl. 2011, 38, 14336–14345. [Google Scholar]
  61. Parnell, G.S.; Trainor, T.E. Using the swing weight matrix to weight multiple objectives. INCOSE Int. Symp. 2009, 19, 283–298. [Google Scholar] [CrossRef]
  62. Németh, B.; Molnár, A.; Bozóki, S.; Wijaya, K.; Inotai, A.; Campbell, J.D.; Kaló, Z. Comparison of weighting methods used in multicriteria decision analysis frameworks in healthcare with focus on low-and middle-income countries. J. Comp. Eff. Res. 2019, 8, 195–204. [Google Scholar] [CrossRef]
  63. Steer-Stephenson, C. Mobile Phones and the Building e-Waste Mountain. 3 August 2022. Available online: https://mobile-magazine.com/articles/mobile-phones-and-the-rising-e-waste-mountain (accessed on 25 September 2023).
  64. Halte à l’Obsolescence Programmée. The French Repairability Index: A First Assessment—One Year after Its Implementation. 2022. Available online: https://www.halteobsolescence.org/wp-content/uploads/2022/02/Rapport-indice-de-reparabilite.pdf (accessed on 10 March 2023).
  65. Garbett, S.L. 11 Cleaning Tricks to Make Your Phone Look Like New. 2 May 2022. Available online: https://www.makeuseof.com/cleaning-tricks-to-make-your-phone-look-like-new/ (accessed on 9 September 2023).
  66. Haslam, K. How Long Does Apple Support iPhones? Macworld, 14 June 2023. Available online: https://www.macworld.com/article/675021/how-long-does-apple-support-iphones.html#:~:text=Apple%20will%20support%20iPhones%20(and,it%20sold%20that%20particular%20model (accessed on 8 September 2023).
Figure 1. An illustration of a circular economy concept.
Sustainability 15 14386 g001
Figure 2. Relationship between reliability, repair, and durability [30,34].
Sustainability 15 14386 g002
Figure 3. Attributes of the proposed framework for durability measurement.
Sustainability 15 14386 g003
Figure 4. Aggregation of attribute/sub-attribute indices.
Sustainability 15 14386 g004
Figure 5. Examples of color-coded ordinal measures for communicating product durability.
Sustainability 15 14386 g005
Figure 6. Pair-wise comparison of durability sub-elements under (a) promise of life, and (b) functional readiness; numbers represent pair-wise comparison of sub-attributes significance.
Sustainability 15 14386 g006
Figure 7. Multi-measure durability index for smartphones (colors based on Table 12).
Sustainability 15 14386 g007
Table 2. Criteria of the French repairability index [12].
CriteriaSub-CriteriaScore of
Sub-Criteria
Weight of Sub-CriteriaScore of CriteriaTotal Score
Documentation
  • Duration of availability of technical documents
/102/20/100
Disassembling, access, tools, fasteners
  • Ease of disassembling parts (list 2 *)
  • Tools needed (list 2)
  • Characteristics of fasteners (list 1 ** and list 2)
/101/20
/100.5
/100.5
Availability of spare parts
  • Duration of availability (list 2)
  • Duration of availability (list 1)
  • Spare parts delivery time (list 2)
  • Spare parts delivery time (list 1)
/101/20
/100.5
/100.3
/100.2
Price of spare parts
  • Ratio of the price of spare parts (list 2) to the price of the product
/102/20
Specific criterion-/102/20
Index/10
* List 2: parts with high failure rate, ** List 1: functionally important parts.
Table 3. Criteria for indexing the ease of maintenance.
CriteriaSub-CriteriaScore of
Sub-Criteria
Weight of
Sub-Criteria
Score of CriteriaTotal Score
Documentation
  • Self-maintenance instruction
  • Professionals’ contact information
/10x/25/100
/10x
Parts availability
  • Duration of availability
  • Delivery time
/10x/25
/10x
Complexity
  • Necessary tools
  • Necessary expertise
  • Necessary environment
/10x/25
/10x
/10x
Cost
  • Ratio of maintenance cost to the price of product
/10x/25
Index/1
Table 4. Criteria for indexing the ability to upgrade.
CriteriaSub-CriteriaScore of
Sub-Criteria
Weight of
Sub-Criteria
Score of CriteriaTotal Score
Software upgradabilitySecurity/251/50/100
Applications/251
Hardware upgradability-/501/50
Index/1
Table 5. Required data for relative indexing of the sub-attributes under the promise of life.
Sub-AttributeData Needed for Relative IndexingHow to Collect DataConsidered Data for the Example
Resistance to degradationTarget product life distribution and reference life distribution considering degradationAfter defining the failure based on degradation intensity (e.g., the specific crack size on casing), failure-terminated drop tests should be performed on a set of target smartphones and a sufficient sample of available smartphones on the market to collect cycles to failure.
  • Considered smartphone life distribution: assumed Weibull (β = 2, α = 92)
  • Reference life distribution: assumed Normal (μ = 100, σ = 30)
Resistance to performance deteriorationTarget product life distribution and reference life distribution considering performance deteriorationSame as collecting data for degradation, with the difference that failure should be defined based on performance (e.g., a specific amount of noise in the smartphone’s output voice).
  • Considered smartphone life distribution: assumed exponential (λ = 0.005)
  • Reference life distribution: assumed Normal (μ = 90, σ = 5)
Ability to stand over-stressTarget product life distribution and reference life distribution considering robustness (probability of failure versus height rather than time)Same as collecting data for degradation, with the difference that instead of collecting cycles to failures, drop heights of failures should be collected to obtain the probability of failure versus height.
  • Considered smartphone life distribution: assumed Normal (μ = 4, σ = 1)
  • Reference life distribution: assumed Normal (μ = 3, σ = 2)
Manufacturer’s warranty
  • Target product warranty period
  • Distribution of warranty periods for similar products on the market
Warranty periods for a sufficient sample of smartphones from different manufacturers should be collected.
  • Considered smartphone warranty period: assumed 12 months
  • Distribution of warranty periods for similar products on the market: assumed Normal (μ = 15, σ = 3)
Table 6. Required data for absolute indexing of the sub-attributes under the promise of life.
Sub-AttributeData Needed for Absolute IndexingHow to Collect DataConsidered Data for the Example
Resistance to degradationResults of pass-or-fail tests considering degradation of the target productAfter defining the failure based on degradation intensity (e.g., the specific crack size casing), cycle-terminated drop tests should be performed on a set of smartphones to collect the number of failed samples.Assumed 2 failures out of 50 smartphones
Resistance to performance deteriorationResults of pass-or-fail tests considering performance of the target productSame as collecting data for degradation, with the difference that failure should be defined based on performance (e.g., a specific amount of noise in smartphone output voice).Assumed 3 failures out of 50 smartphones
Ability to stand over-stressResults of pass-or-fail tests considering robustness of the target productAfter determining the destruct limit of the smartphone, over-stress drop tests should be performed to collect the number of failed samples.Assumed 1 failure out of 100 smartphones
Manufacturer’s warrantyReference table for mapping warranty period to an indexExperts’ opinions and customer expectations can be collected through surveys to prepare a reference table.Assumed 12-month warranty for the target product and also a reference table for conversion to an index
Table 7. Reference table for absolute indexing of warranty.
Warranty PeriodAbsolute Index
361
300.8
240.6
180.4
120.2
<120
Table 8. Required data for indexing of the sub-attributes under the functional readiness.
Sub-AttributeData Needed for IndexingHow to Collect DataConsidered Data
for the Example
Ease of repair
  • Duration of availability of repair documents
  • Ease of disassembling important parts: number of steps, required tools, type of fasteners
  • Duration of availability of spare parts
  • Delivery time of spare parts
  • Price of spare parts
  • Most of the information is known only by the manufacturers, so if manufacturers do not share them, they are not accessible.
  • Information about ease of disassembling can be obtained by experimental investigation of the smartphone.
Different devices were previously indexed with more details by investigators to validate the provided scores by the manufacturers [64].
Ease of maintenance
  • Duration of availability of maintenance documents
  • Duration of availability of required parts
  • Delivery time of parts needed
  • Maintenance complexity: required tools, required expertise, required environment
  • Maintenance cost
Like repairability, the only way to acquire the necessary information for indexing maintainability is by obtaining it from the manufacturers.Cleaning and drying are the only maintenance activities for smartphones.
Ability to upgrade
  • Duration of availability of software updates: security, application
  • Possibility of hardware upgrades
  • For software upgrades, the only way to acquire the necessary information is to obtain it from the manufacturers.
  • For hardware upgrades, product specifications determine the potential for hardware upgrades
  • Assumed a reference table for converting software update commitments of the manufacturer to an index
  • Considered increasing memory capacity and adding a second SIM as potential hardware upgrade with binary indices.
Table 9. Reference table for indexing the ability to upgrade.
Commitment Period (Year)Absolute Index
> 10 1
10 > x > 8 0.8
8 > x > 6 0.6
6 > x > 4 0.4
4 > x > 2 0.2
< 2 0
Table 10. Criteria for indexing the ability to upgrade for the smartphone.
CriteriaSub-CriteriaScore of
Sub-Criteria
Weight of
Sub-Criteria
Score of CriteriaTotal Score
Software upgradabilitySecurity25/25135/5085/100
Applications10/251
Hardware upgradabilityIncreasing memory capacity25/25150/50
Second SIM25/251
Index0.85/1
Table 11. Summary of durability sub-attribute indices for smartphone.
AttributeSub-AttributeIndex
Promise of lifeResistance to degradation0.34
Resistance to performance deterioration0.63
Ability to stand over-stress0.67
Manufacturer’s warranty0.22
Functional readinessEase of repair0.58
Ease of maintenance1
Ability to upgrade0.85
Table 12. Example of a reference table for transforming indices to an ordinal scale.
Index RangeOrdinal Scale Value
x 0.6 Above average
0.6 > x 0.3 Average
0.3 > x Below average
Disclaimer/Publisher’s Note: The statements, opinions and data contained in all publications are solely those of the individual author(s) and contributor(s) and not of MDPI and/or the editor(s). MDPI and/or the editor(s) disclaim responsibility for any injury to people or property resulting from any ideas, methods, instructions or products referred to in the content.

