Article

Demonstration of an Integrated Methodology for the Sustainable Valorisation of Bakery Former Food Products as a Pig Feed Ingredient: A Circular Bioeconomy Paradigm

by
Apostolos Malamakis
1,
Sotiris I. Patsios
1,
Lefteris Melas
1,
Anna Dedousi
2,
Konstantinos N. Kontogiannopoulos
3,
Konstantinos Vamvakas
4,
Nikos Tsotsolas
5,
Eleni Koutsouraki
5,
Evangelia N. Sossidou
2 and
George F. Banias
1,*
1
Institute for Bio-Economy and Agri-Technology (IBO), Centre for Research and Technology-Hellas (CERTH), Thermi, 57001 Thessaloniki, Greece
2
Veterinary Research Institute, Ellinikos Georgikos Organismos-DIMITRA, 11145 Athens, Greece
3
ECO PRO ENGINEERING P.C.C., 54624 Thessaloniki, Greece
4
Pig Farm Chalkidiki S.A., 63200 Simantra, Greece
5
Green Projects S.A., Chalandri, 15238 Athens, Greece
*
Author to whom correspondence should be addressed.
Sustainability 2023, 15(19), 14385; https://doi.org/10.3390/su151914385
Submission received: 27 July 2023 / Revised: 15 September 2023 / Accepted: 28 September 2023 / Published: 29 September 2023
(This article belongs to the Section Sustainable Materials)

Abstract

:
This study aims to demonstrate an integrated methodology for the valorisation of bakery former food products (FFP) as an ingredient of pig feed diets. The methodology involves: conducting a needs analysis and a full path traceability scheme based on Global Standards 1 (GS1) Organisation (Brussels, Belgium) standards, designing digital tools to support the implementation of the traceability scheme, and assessing the valorisation of FFP and, more specifically, of bakery by-products in bakery meal (BM) production, and its implementation in pig feed diet. BM production comprises various bakery by-products, which were collected, unpacked, grinded, and thermally treated. Physicochemical and microbiological analyses were conducted on BM samples, mainly focusing on nutrient composition, and the presence of aflatoxins, mycotoxins, and pathogenic microorganisms. The BM was then fed to finishing pigs (at an inclusion rate of 20% w/w), in parallel to a control group fed with a conventional pig feed diet. The animals in both dietary groups were evaluated for growth performance, and meat samples were analysed for specific quality parameters and sensory characteristics. The results show that the addition of 20% w/w BM does not significantly affect the growth performance or the meat quality of the pigs. Moreover, a sensory evaluation revealed minor differences in the sensory characteristics of the meat samples, denoting that the BM addition does not seem to dwindle the final meat product.

1. Introduction

The pursuit of resource-saving methods across all sectors of the agri-food industry is driven by the competitive conditions resulting from the globalisation of the economy. This emphasis on resource conservation is accompanied by a concurrent focus on ensuring food safety. Moreover, the primary factor contributing to uncertainty in the medium to long-term planning of pig farming operations is the volatility of cereal prices [1]. The prices of cereals, which serve as primary ingredients in animal feed, exhibit notable volatility, with periods of exceptionally high prices observed during their procurement [2]. Additionally, it should be noted that the acquisition of animal feed accounts for 60% of the expenses incurred in the process of meat production, a figure that may escalate to 80% during periods characterised by high animal feed prices [3]. Pork is the most common form of meat consumed globally, making up over 40% of all meat consumed worldwide [4]. Pork consumption is about 34 kg per person per year in Europe [5]. Pig production, which accounts for roughly 33% of global production [6], is therefore a livestock industry of major economic importance in the EU [7].
An effective strategy to mitigate feed expenses in pig farming involves the integration of by-products into the pigs’ diets as a substitute for a portion of the conventional grains and soybeans [8]. Annually, approx. 59 million tonnes of food are discarded in the European Union, encompassing all stages of the production and supply chain [9]. In Greece, a yearly average of 80 kg of food by-products are generated per individual [10]. The majority of these food items are produced during the consumption stage, accounting for 53% of the total, with the food processing/production stage following at 19% of the total. It is noteworthy that a significant proportion of these food items are deemed safe for human consumption and/or domestic animals. It has been estimated that the economic impact of not utilising these food items is roughly equivalent to EUR 143 billion annually [11].
The incorporation of food by-products in pig diet has been a long-standing traditional practice [12,13]. However, if implemented without proper regulation, it can be associated with the dissemination of significant diseases such as the African Swine Fever Virus (ASFV), a highly transmissible and severe disease that has presently disseminated to over 55 nations across three distinct continents [14]. The utilisation of inappropriate food by-products, which are tainted with ASFV, in pig diets represents a significant avenue for the transmission of the disease. This is caused by the virus’ ability to survive for up to a year in carcasses and meat cuts kept at refrigeration temperatures (4 °C), which allows the virus to spread over large areas through infected meat and facilitates its spread [15]. The aforementioned reasons make it evident that the unregulated utilisation of food by-products (especially of animal origin) in pig diet poses a significant health hazard.
Among the alternative sources of animal feed, bakery by-products stand out as a favourable choice due to their high palatability and significant energy content. Furthermore, they lack antinutritional substances, such as fibre, tannins, glucosinolates, and heat-labile trypsin inhibitors, and they are also continuously available in the market [16,17]. Dried Bakery Meal (BM) refers to a composite substance comprising bread, biscuits, cakes, crackers, dough, chips, pasta, snacks, nuts, cereals, flour, baked goods, and associated food by-products. These components are obtained by isolating them from non-consumable products, followed by a process of blending, grinding, and dehydration [18,19]. Former food products (FFPs) are economic feed ingredients consisting of processed and ready-to-eat foods that are no longer fit for human consumption due to manufacturing, production or packaging defects [19]. FFPs are covered by feed legislation and marketed as safe feed material; therefore, they cannot be degraded to waste status [20]. The use of FFPs in animal feed brings the unintentional loss of high-quality food back into the supply chain in line with the principles of the circular economy. In the European Union, some FFPs are already being reprocessed for use in animal feed, but their use in animal feed is still limited (3.5 million tonnes/year) [21] compared to the total food waste (88 million tonnes/year) [22].
BM exhibits comparable levels of protein and amino acids to maize, with crude protein content of 10.8%, lysine content of 0.27%, and tryptophan content of 0.10% [17]. However, it possesses a greater fat content of 11%. Furthermore, wheat flour, being the primary component in all baked goods, contributes significantly to the starch content of the aforementioned products. The nutritional assessment of six distinct combinations of bakery by-products designed for porcine consumption demonstrated that their nutritional profile is equivalent to that of cereal crops [21]. The limited data published in the literature indicate that BMs contain 8 to 15% crude protein, 5 to 10% ether extract, between 2.35 and 10% ash, and approximately 40 to 52.4% starch [21,23,24,25]. As the starch in BM has already been thermally processed (cooked), it is very easily digestible and, therefore, is of high nutritional value, making BM ideal for feeding growing pigs [17]. BM also appears to have a relatively high concentration of sucrose, glucose, maltose, and fructose, and it has been reported that these sugars together make up more than 15% of the dry matter [24]. In general, BM contains approx. 2981 kcal/kg of net energy, which compares very favourably to maize with 2672 kcal/kg of net energy [18]. It can also be assumed that 1000 kg of BM is equivalent to 850 kg of maize, 90 kg of soybean (44 per cent), and 60 kg of fat/oil [18]. The chemical makeup of BM is reflective of the composition of the diverse array of foods it encompasses. The notable variety in its composition arises from the production of distinct batches of BM, which are based on varying combinations of food elements [26]. However, in general, the chemical composition of BM is closer to that of wheat than to that of maize, reflecting the preferential use of wheat flour and whole wheat in food production [27]. Of particular interest are the results of the study by Liu et al. (2018) [27], who analysed 46 different sources of BM from different regions of the USA in terms of their chemical composition and nutritional value. According to the latter, the differences in the chemical composition of BM from 46 different regions of the USA are relatively small and are unlikely to have a major impact on their nutritional value. Previous reports have demonstrated that dietary BM can safely replace up to 50% of maize (when the main ingredients of the diet are maize and soya) in the diet of growing pigs and sows without any adverse effect on their health, yield, and carcass quality [28,29,30,31,32,33,34], while the integration of bakery by-products into animal feeds has also drawn attention in broiler and cow systems, demonstrating promising results [35,36,37].
From an environmental perspective, the generation of food waste imposes a substantial burden. Based on a Food and Agriculture Organisation (FAO) report [38], it has been documented that the disposal of food waste resulted to the emission of 3.7 gigatonnes of carbon dioxide equivalent per year in 2011. In accordance with available data, the production of meat contributes to approximately 14.5% of the overall carbon dioxide emissions caused by human activities. Furthermore, there has been a consistent upward trajectory in both the production and consumption of meat, with a notable 40% increase observed since the year 2000 [38]. Furthermore, the production of raw materials for rations and human food consumption generates both environmental and social impacts through land use competition. Based on research conducted by the FAO, it has been determined that approximately 80% of cultivated land is allocated for the purpose of producing animal feed [39]. The use of alternative feed, consisting of FFPs, in beef production resulted in a significant reduction in Green House Gas emission, land use, and water consumption reduction, while a broader spectrum of food waste used as an ingredient in pig feed resulted in higher environmental and economic sustainability in Canada [40]. The latest reporting exhibited a 5% overall environmental improvement in a Greek pig farm through integrating bakery meal in conventional feedstock by replacing a percentage of cereals and soya beans [41]. In addition to its utilisation as feed in livestock production, alternative methodologies for FFP management encompass various strategies such as composting, anaerobic digestion for biogas generation, incineration, and nutrient recovery in agriculture [32,42,43,44,45]. Nevertheless, it is worth noting that the insufficiency of resources and infrastructure frequently leads to the unfortunate disposal of FFPs in landfills, disregarding their considerable potential as a sustainable feed ingredient [17,29,34,40,46]. The valorisation of FFPs and their integration in pig diets present a promising and viable strategy for effectively mitigating the environmental impacts associated with pig livestock systems. Additionally, this approach offers a potential solution to address pressing food security concerns and tackle the challenges associated with sustainable waste management towards the adoption of the circular bioeconomy principles.
The expeditious advancement of intelligent traceability applications and inventive supply chain control applications can also play a pivotal role in ensuring the hygienic and secure integration of FFPs into the pig diet. In order to satisfy the needs for an accurate tracing of FFPs, a comprehensive traceability procedure, which encompasses four fundamental stages, namely Identification, Recording, Evaluation, and Sharing, has been adapted and applied in this case. The employment of worldwide GS1 standards throughout all stages of production until disposal is considered to be imperative for the effective integration of data from diverse traceability systems. It is advisable to utilise the subsequent five categories of GS1 identifiers: (i) Global Location Number (GLN), which is a distinctive global identifier assigned to a spatial point such as a production point, warehouse, or retail point; (ii) Global Product Classification (GPC), which is a unique numerical identifier used to classify products; (iii) Global Trade Item Number (GTIN), which intensifies uniquely a product; (iv) Serialised Global Trade Item Number (EPC), which acts as a unique global lot reference number; and (v) Serial Shipping Container Code (SSCC), which is a globally unique reference number assigned to pallets for the purpose of identification and tracking. Furthermore, the implementation of Electronic Product Information Services (EPCIS) will be utilised, as it is the established norm for the exchange of data pertaining to Critical Monitoring Events in the tangible realm.
Along these lines, the aim of this study is to demonstrate an integrated methodology for the valorisation of bakery FFPs in pig feed diet, taking into consideration the main challenges that arise from the implementation of these practices, namely: the identification and mapping of the sources of bakery FFP production within a specific range around the pig farm; the assessment of the effects of BM inclusion in pig feed diets on the performance of pig growth and on meat quality; and the traceability (through smart applications) of bakery FFP collection and of BM inclusion in pig feed diet to ensure the conformation to hygiene and food security standards. Therefore, a demonstration trial was implemented comprising the mapping of bakery FFP sources, their collection and treatment to produce BM in a commercial food by-products management plant, the implementation of specific designed traceability applications, the complete physicochemical and microbiological characterisation of the produced BM, a demonstration feeding trial in a commercial pig farm, and, finally, the analysis of both the quality and the sensory characteristics of the produced pig meat.

2. Methodology

This section provides a comprehensive overview of the approach taken to investigate the utilisation of bakery FFPs in ΒΜ production, and the evaluation of the effects of BM inclusion on pig meat quality and its sensory characteristics. Moreover, a needs analysis was carried out for the development of an integrated full path traceability scheme of bakery FFP, which is based on the standards of the GS1 organisation, and the necessary digital tools to support the implementation of this scheme. The aim of this monitoring process is to assess the applicability of bakery FFP utilisation for BM production processes. Based on these needs, the integrated traceability scheme and the corresponding tools are designed and developed.

2.1. Bakery Meal Production

BM was produced in different batches, based on the availability of the bakery FFPs. The by-products that comprised the raw material for BM production were breads, cookies, pasta, cereals, chocolates, pastry, croissants, etc., which were still edible but not intended for human consumption. Potential sources of FFPs were identified, mapped, and their nutritional characteristics, according to their producers, recorded. Potentially interesting geographical zones were marked and seasonality production characteristics were taken into account. The portion of each by-product in the production batch varied depending on the availability of the by-products; chocolates did not exceed 10% w/w in all production batches. The FFPs were collected and gathered at a BM processing plant in northern Greece, unpacked, ground using a blade shredder (AC-1, TG-Machines Ltd., Ostrowiec, Poland), and thermally treated in a steam-heated rotating batch cooker (BC-5, TG-Machines Ltd., Ostrowiec, Poland). The thermal treatment comprised at least 20 min thermal treatment at temperature = 133 °C and pressure = 3 bar to fulfil the minimum requirements of Commission Regulation (EC) No 142/2011 [47]. During the thermal treatment, the BM weight was reduced by approx. 60% w/w due to the evaporation of water. The BM, which had the appearance of a brown crumble/coarse powder, was put into 20 kg bags/sacks and stored in a dry and cool place in ambient conditions. Samples from each batch of the BM production were collected for physicochemical and microbiological analysis.

2.2. Bakery Meal Characterisation

The physicochemical analysis of the basic nutrients in the produced BM was conducted in accordance with European Commission (EC) Regulation No 152/2009 [48] The parameters examined included dry matter, crude protein, ash, crude fats, and crude fibre. The content of carbohydrates and gross energy were determined through calculations based on the proximate analysis. The enzymatic method employed for the examination of sucrose, D-fructose, and D-glucose in plant and food products was the Megazyme K-SUFRG 04/18 assay kit. This kit was used to measure the sugars content. The starch content was determined using an enzymatic method employing Megazyme K-TSA-100A assay kit. The concentrations of mono-, poly-unsaturated, and saturated fatty acids were also determined according to the EC Regulation No 152/20091 [48]. The extracted fatty acids, via Soxhlet extraction method (Soxtherm SOX412-MACRO, Gerhardt GmbH & Co. KG, Königswinter, Germany), were analysed using GC-FID (GC-2010 Plus, Shimadzu Co., Kyoto, Japan) employing Supelco SP2560 column, after alkaline transesterification with a methanol–potassium hydroxide solution, according to a previously described analytical protocol [49]. The Peroxide Value (PV) of lipids was determined according to the EU 2568/91 [50] method, based on the titration of the free iodine from the oxidation of a potassium iodide solution. The concentration of Aflatoxins B1, B2, G1 and G2, and mycotoxins Deoxynivalenol (DON) and Zearalenone (ZON) were analysed using LC-MS/MS according to available protocols [51,52]. The BM was also microbiologically characterised for the following parameters: Enterobacteriaceae, according to ISO 21528-2:20174 [53], Salmonella spp., according to ISO 6579-1:20175 [54], Campylobacter spp., according to ISO 10272-2:2017 [55], and ASFV, employing a real-time PCR method. The identification of ASFV was conducted using the commercially available real-time PCR assay, known as ID Gene African Swine fever Duplex (manufactured by IDVET, France). The kit contains an endogenous positive control, which serves the purpose of validating the appropriate amplification of DNA. Furthermore, the validity of the procedure was established by detecting African Swine Fever Virus (ASFV) in the BM through the introduction of the ASFV positive control, which is also provided in the kit, into the unrefined sample. The findings are succinctly presented in Table 1.

2.3. Animals, Diets and Experiment Design

The experimental study was conducted at a commercial farm located in Nea Triglia, Chalkidiki, Greece. The study involved the selection of 80 male castrated pigs of the Duroc breed, aged 80 days, and with an average body weight of 32.125 kg. The piglets were placed into four consecutive pens in a random manner, with each pen containing 10 piglets. Every pen was equipped with a plastic perforated floor and was furnished with a feeder and nipple drinkers. The stocking density within each enclosure adhered to the stipulations outlined in the European Union Directive [56]. All pens were located within the same facility in order to ensure consistent environmental conditions across all groups. The pigs were provided with unrestricted access to both feed and water. After one week of adaptation period, pigs were divided in 2 dietary groups: standard finishing diet with no BM added (CON) and standard finishing diet with 20% w/w BM added (BM20), with 20 piglets/group, 4 replicate pens/group and 10 piglets/replicate pen. A two-phase feeding program was used in each dietary treatment, consisting of a finishing 1 diet fed from 80 to 123 days of age, and a finishing 2 diet fed from 123 to 180 days of age. In total, 4 ratios were formulated, 1 per feeding period per dietary treatment (Table 2). In BM diets, conventional ingredients were replaced by BM (mainly maize meal, corn, wheat pollard, and soya) to formulate all rations on an isonitrogenous and isocaloric basis. The duration of the experiment was 100 days.
Pigs were weighed 3 times at a group level at 80, 120, and 178 days old. The BW, body weight gain (BWG), and feed consumption (FC) per pig were measured to calculate the feed conversion ratio (FCR) of each period—Period 1: 80–120 days of age, Period 2: 120–178 days of age, and whole experimental period: 80–178 days of age. At the end of the experiment (day 180), all pigs were slaughtered at a local abattoir and 16 pigs (8 pigs per group) were randomly selected for meat quality analysis. Accordingly, carcasses were also selected for sensor evaluation testing (SET). After slaughter, the carcasses were chilled at 4 °C and, after 24 h, the selected carcasses were cut. The selected meat samples were collected from the longissimus thoracis muscle of the pig carcasses both for the meat quality analysis and for SET.

2.4. Meat Analysis and Health Lipid Indices

The assessment of food products’ quality is contingent upon various factors, including their physical characteristics, chemical makeup, presence of contaminants (both microbiological and toxic substances), and sensory attributes [57]. Global consumers have a persistent need for the reliable and uninterrupted provision of high-quality food products that align with the perceived value corresponding to their cost. Objective tests are employed for the purpose of assessing a specific attribute of a food product, rather than evaluating its overall quality [58].
The meat samples were characterised concerning their colorimetric characteristics, the protein and fat content, the FA profile, and the health quality of meat lipids. The colorimetric analysis was performed with a colour-measuring device (colorimeter) CR-400 Chroma-Meter (Konica Minolta Inc., Tokyo, Japan). The colorimeter provides colour data in terms of colour space values, such as CIE Lab*, CIE LCh*, or RGB, depending on the instrument and settings used. CIE Lab* is a widely used colour space that represents colours based on lightness (L*) and two colour-opponent dimensions (a* for green–red and b* for blue–yellow). Before starting any colour measurement, the colorimeter was properly calibrated according to the manufacturer’s instructions. In each meat sample, three shots were taken at different points and the average was obtained. Areas with a lot of intramuscular fat or connective tissue were avoided during the procedure. The measurements were performed at days 0, 5, and 7 after the meat sample collection, and are reported as time points T0, T1, and T2, respectively. The pH value and the protein content of the meat’s samples were estimated employing a pH meter C3061 (Consort BVBA, Turnhout, Belgium) and the Kjeldahl method. A KjeldahlTherm KB-8 digestion array (Gerhardt GmbH & Co. KG, Königswinter, Germany) and the Vapodest 40s (Gerhardt GmbH & Co. KG, Königswinter, Germany) distillation apparatus were used to determine the total nitrogen and calculate the proteins of the sample. The percentage of protein content was calculated by multiplying the ammonium result with the conversion factor of 6.25. The fatty acid composition and fat content of the meat samples were determined according to a method employing Soxhlet extraction (Soxtec 2050, Foss, Tecator, Denmark) of lipids, followed by lipids transesterification, employing boron trifluoride and methanol [59]. The produced Fatty Acid Methyl Esters (FAME) were analyzed using a HP 5890 GC-FID (Hewlett–Packard, California, United States) according to a reported method [60]. The health quality of meat lipids was evaluated by determining the proportions of specific FAs and their respective groups: Atherogenic Index (AI), Thrombogenic Index (TI), and the ratio between hypocholesterolemic (h)/hypercholesterolemic (H) fatty acids (h/H). The following equations were used to calculate these indexes:
Atherogenic Index [61]
AI = (4 × C14:0 + C16:0 + C18:0)/(ΣMUFA + ΣPUFA-n-6 + ΣPUFA-n-3)
Thrombogenic Index [62]
TI = (C14:0 + C16:0 + C18:0)/(0.5 × ΣMUFA + 0.5 × ΣPUFA-n-6 + 3 × ΣPUFA-n-3 + ΣPUFA-n-3/ΣPUFA-n-6)
Ratio between hypocholesterolemic and hypercholesterolemic fatty acids [63]
h/H = C18:1n9c + C18:2n6c + C18:3n3c + C18:3n6c + C20:2n6 + C20:3n6 + C20:4n6 + C22:6n3/C14:0 + C16:0
where:
  • Σ = Summatory;
  • MUFA = monounsaturated FAs;
  • PUFA = polyunsaturated FAs.
The lipid oxidative analysis method is predicated upon the chemical reaction between thiobarbituric acid (TBA) and malondialdehyde (MDA), forming a pink-coloured compound that can be determined spectrophotometrically at 535 nm, according to Zeb and Ullah [64]. Results are expressed in mg MDA/g. The measurements were performed at days 0, 5, and 7 after the meat sample collection, and are reported as time points T0, T1, and T2, respectively.

2.5. Sensory Evaluation Testing

Sensory methods are employed to assess the response to stimuli that arise from the utilisation of a particular product and are frequently employed to ascertain the level of consumer acceptance of a food product, thereby playing a role in the development of quality systems [57]. As a result, it is regarded as a technical tool that aids in ensuring quality assurance throughout the food production process. In addition to this, it is beneficial in acquiring feedback to inform decision-making and facilitate the appropriate modifications of a specific food product [65]. In the context of this study, Sensory Evaluation Testing (SET) was employed to compare the meat from pigs fed with BM20 diet with the meat from the pigs fed with the conventional diet.

2.5.1. Participants

All participants willingly engaged in the study and provided their informed consent by signing a consent form prior to the commencement of the study. The entirety of the gathered data were rendered irreversibly anonymous, thereby ensuring that the identification of individual persons based on the collected data sets was unattainable. One group of 23 consumers (16 male and 7 female), aged between 25 and 63 years old, was formulated to evaluate the pig meat. The total number of consumers are aligned with other similar studies [59,66]. All participants unequivocally affirmed the following: (i) their sense of smell and taste were not impaired, either by any underlying medical condition or illness, during the conduct of the Sensory Evaluation Test (SET); (ii) they maintained a habitual consumption of pork meat; and (iii) they did not exhibit any allergic reactions to pig meat or any other food items employed in the course of the SET. All participants were informed about the aims and scope of the SET, and were provided with a short training course about the SET procedure, the completion of the evaluation sheet, and the interpretation of the 5-point hedonic scale that was used in the SET.

2.5.2. Meat Samples and Preparation

All meat samples, after collection, were individually packed in sealable food bags and frozen at −18 °C temperature until the day of the SET. Meat samples were defrosted overnight in a commercial refrigerator at 4 °C and cooked unseasoned in a convection oven at approx. 150 °C. Cooking lasted approx. 30 min until the internal temperature of the meat samples reached 80 °C; the temperature was measured with an electronic hand-held thermometer (CP-411, ELMETRON Sp. j., Zabrze, Poland). After cooking, the meat was cut to rather uniform meat samples (approx. 2 cm cubes), containing no bones; the meat samples were placed on a white ceramic food plate, and were immediately served to the participants after reaching approx. 60 °C temperature.

2.5.3. SET Procedure

SET took place at the premises of a commercial restaurant in Nea Triglia, Chalkidiki, northern Greece. The designated tasting area was exclusively allocated for the Sensory Evaluation Test (SET), wherein each participant was individually and simultaneously presented with a ceramic food plate containing six distinct meat samples, three from pigs fed with the conventional ratios (CON meat samples), and three from pigs fed with ratios comprising 20% w/w BM (BM20 meat samples). The positioning of the meat samples on the food plate was standardised across all participants, ensuring that they were unaware of the specific identity of the meat samples, i.e., the experimental treatment to which they corresponded. The participants were granted the autonomy to exercise randomisation in selecting the sequence for evaluating the meat samples. Following the comprehensive evaluation of each specimen, the participants successfully neutralised their taste by consuming a morsel of unsalted and unsweetened wheat toast, accompanied by a small quantity of natural mineral water. All participants were given a standardised evaluation form, which they diligently completed by manually assigning scores using a 5-point hedonic scale. The scale ranged from 1, representing extreme dislike, to 5, indicating extreme liking. The aforementioned attributes were assessed for every meat specimen, encompassing colour, aroma, taste, tenderness, juiciness, and the overall impression.

2.6. Statistical Analysis

The statistical analysis of the data was performed using Jeffreys’s Amazing Statistics Program JASP (JASP v 0.16.3) software. Student t-test was used to compare the average values of the parameters (growth performance, meat protein and fat content, fatty acid composition, health lipid indices, and sensory characteristics of pig meat) evaluated among the two different feeding scenarios; any difference with p-value ≤ 0.05 was considered statistically significant. A repeated measures ANOVA was used to compare the average values of the colorimeter characteristics and lipid oxidative analysis of the pigs’ meat between the control group and a diet supplemented with BM20. A post hoc analysis was conducted employing Tukey’s test. The application of multiple regression analysis was employed to assess the associations between the various sensory attributes examined and the overall acceptance of pig meat. The findings are presented in the form of standardised regression coefficients.

3. Results and Discussion

3.1. Mapping Production Points and Recording Characteristics and Quantities of Food By-Products

To ascertain the potential sources of bakery FFPs, the authors undertook a comprehensive search of business registration websites situated in administrative districts in close proximity to the pig farm. The search specifically targeted products that satisfy the predetermined eligibility criteria. The pig farm is situated in Nea Triglia, Greece, in close proximity to the road infrastructure connecting Thessaloniki and Chalkidiki. The transportation infrastructure encompasses both urban and suburban areas, which undergo a significant increase in population during the summer season. Moreover, in close proximity to the pig farm, there exist several noteworthy industrial zones. The sources being examined have been classified into three distinct zones, taking into account their proximity and connectivity to the pig farm (see Figure 1). The potential sources are classified into distinct groups and are typically located within a radius of 15, 75, and 300 km with respect to the pig farm. These groups comprise 90, 300, and 900 businesses, respectively. The first zone consists of the urban and suburban areas surrounding Nea Triglia in Chalkidiki, along with the industrial sector of Lakoma. The second zone encompasses the sources situated in the central district of Thessaloniki, along with the industrial and artisanal areas of Thermi and Vasilika. The third zone comprises the industrial and artisanal regions of Sindos, Kilkis, and Katerini, as well as the surrounding urban and suburban areas.
In order to record the values presented in Table 3, the quality attribute values of twenty packaged commercial products were registered for each category. Additionally, the mean and standard deviation of these values were calculated for each respective category.

3.2. Experimental Evaluation of Alternative Diets with BM in the Quality of the Carcass

The supplementation of BM in the diet of finishing pigs did not significantly affect the BW, the Average Daily Weight Gain (ADG), and the FCR of the pigs, both for the whole experimental period and for the partial examined periods (p > 0.05) (Table 4). In the last day of the experiment, the highest BW was recorded in the control group. From 123 to 178 of age, a better FCR was observed in the pigs fed with BM20. Also, in the whole experimental period, better FCR was estimated for the same group, but FCR did not differ significantly among the groups (p > 0.05).
As presented in Table 5, in the colorimeter analysis of the meat, the L* and b* values did not differ among the dietary groups and different times of analysis (p > 0.05). However, a* colour index was found to be significantly higher (p < 0.05) in the CON group. Also, a* value differed significantly (p < 0.05) among the different times of analysis. Moreover, a lipid oxidation analysis of the meat showed no significant differences between the dietary treatments (p > 0.05) (Table 6). Among the different periods of the analysis, significant differences were found in both groups between T0 and T2 (p < 0.05).
The results of the fat content showed that no significant differences were observed between the dietary groups (p > 0.05) (Table 7). Similarly, no significant differences were found in the pH values of the pig meat between the dietary groups (p > 0.05). Protein content was recorded as being significantly higher (p < 0.05) in the control group in comparison to the BM20 group.
The fatty acid (FA) composition analysis of the pigs’ meat did not differ between the dietary groups (p > 0.05), regarding MUFAs, PUFAs, SFAs, PUFA/SFA, n-3 PUFAs, and n-6 PUFA/n-3 PUFA ratios (Table 8). In addition, n-6 PUFAs were significantly (p < 0.05) higher (2.096 ± 0.585) in the control group. The results of health indicators, AI, TI, and h/H ratio, did not differ between the dietary groups but were observed to be higher in the BM20 group. According to the results of individual FAs, no differences were found between the dietary groups. More specifically, the most abundant FA among MUFAs in the meat of the dietary groups was palmitoleic acid (C16:1). Palmitic acid (C16:0) was the most abundant FA of the SFAs in the meat of both groups. Also, among PUFAs, the most abundant FA in the meat of all treatments was Cis-11,14-Eicosadienoic acid (C20:2) acid. Moreover, no significant differences were found in the FA profiles between the two dietary treatments (p > 0.05).

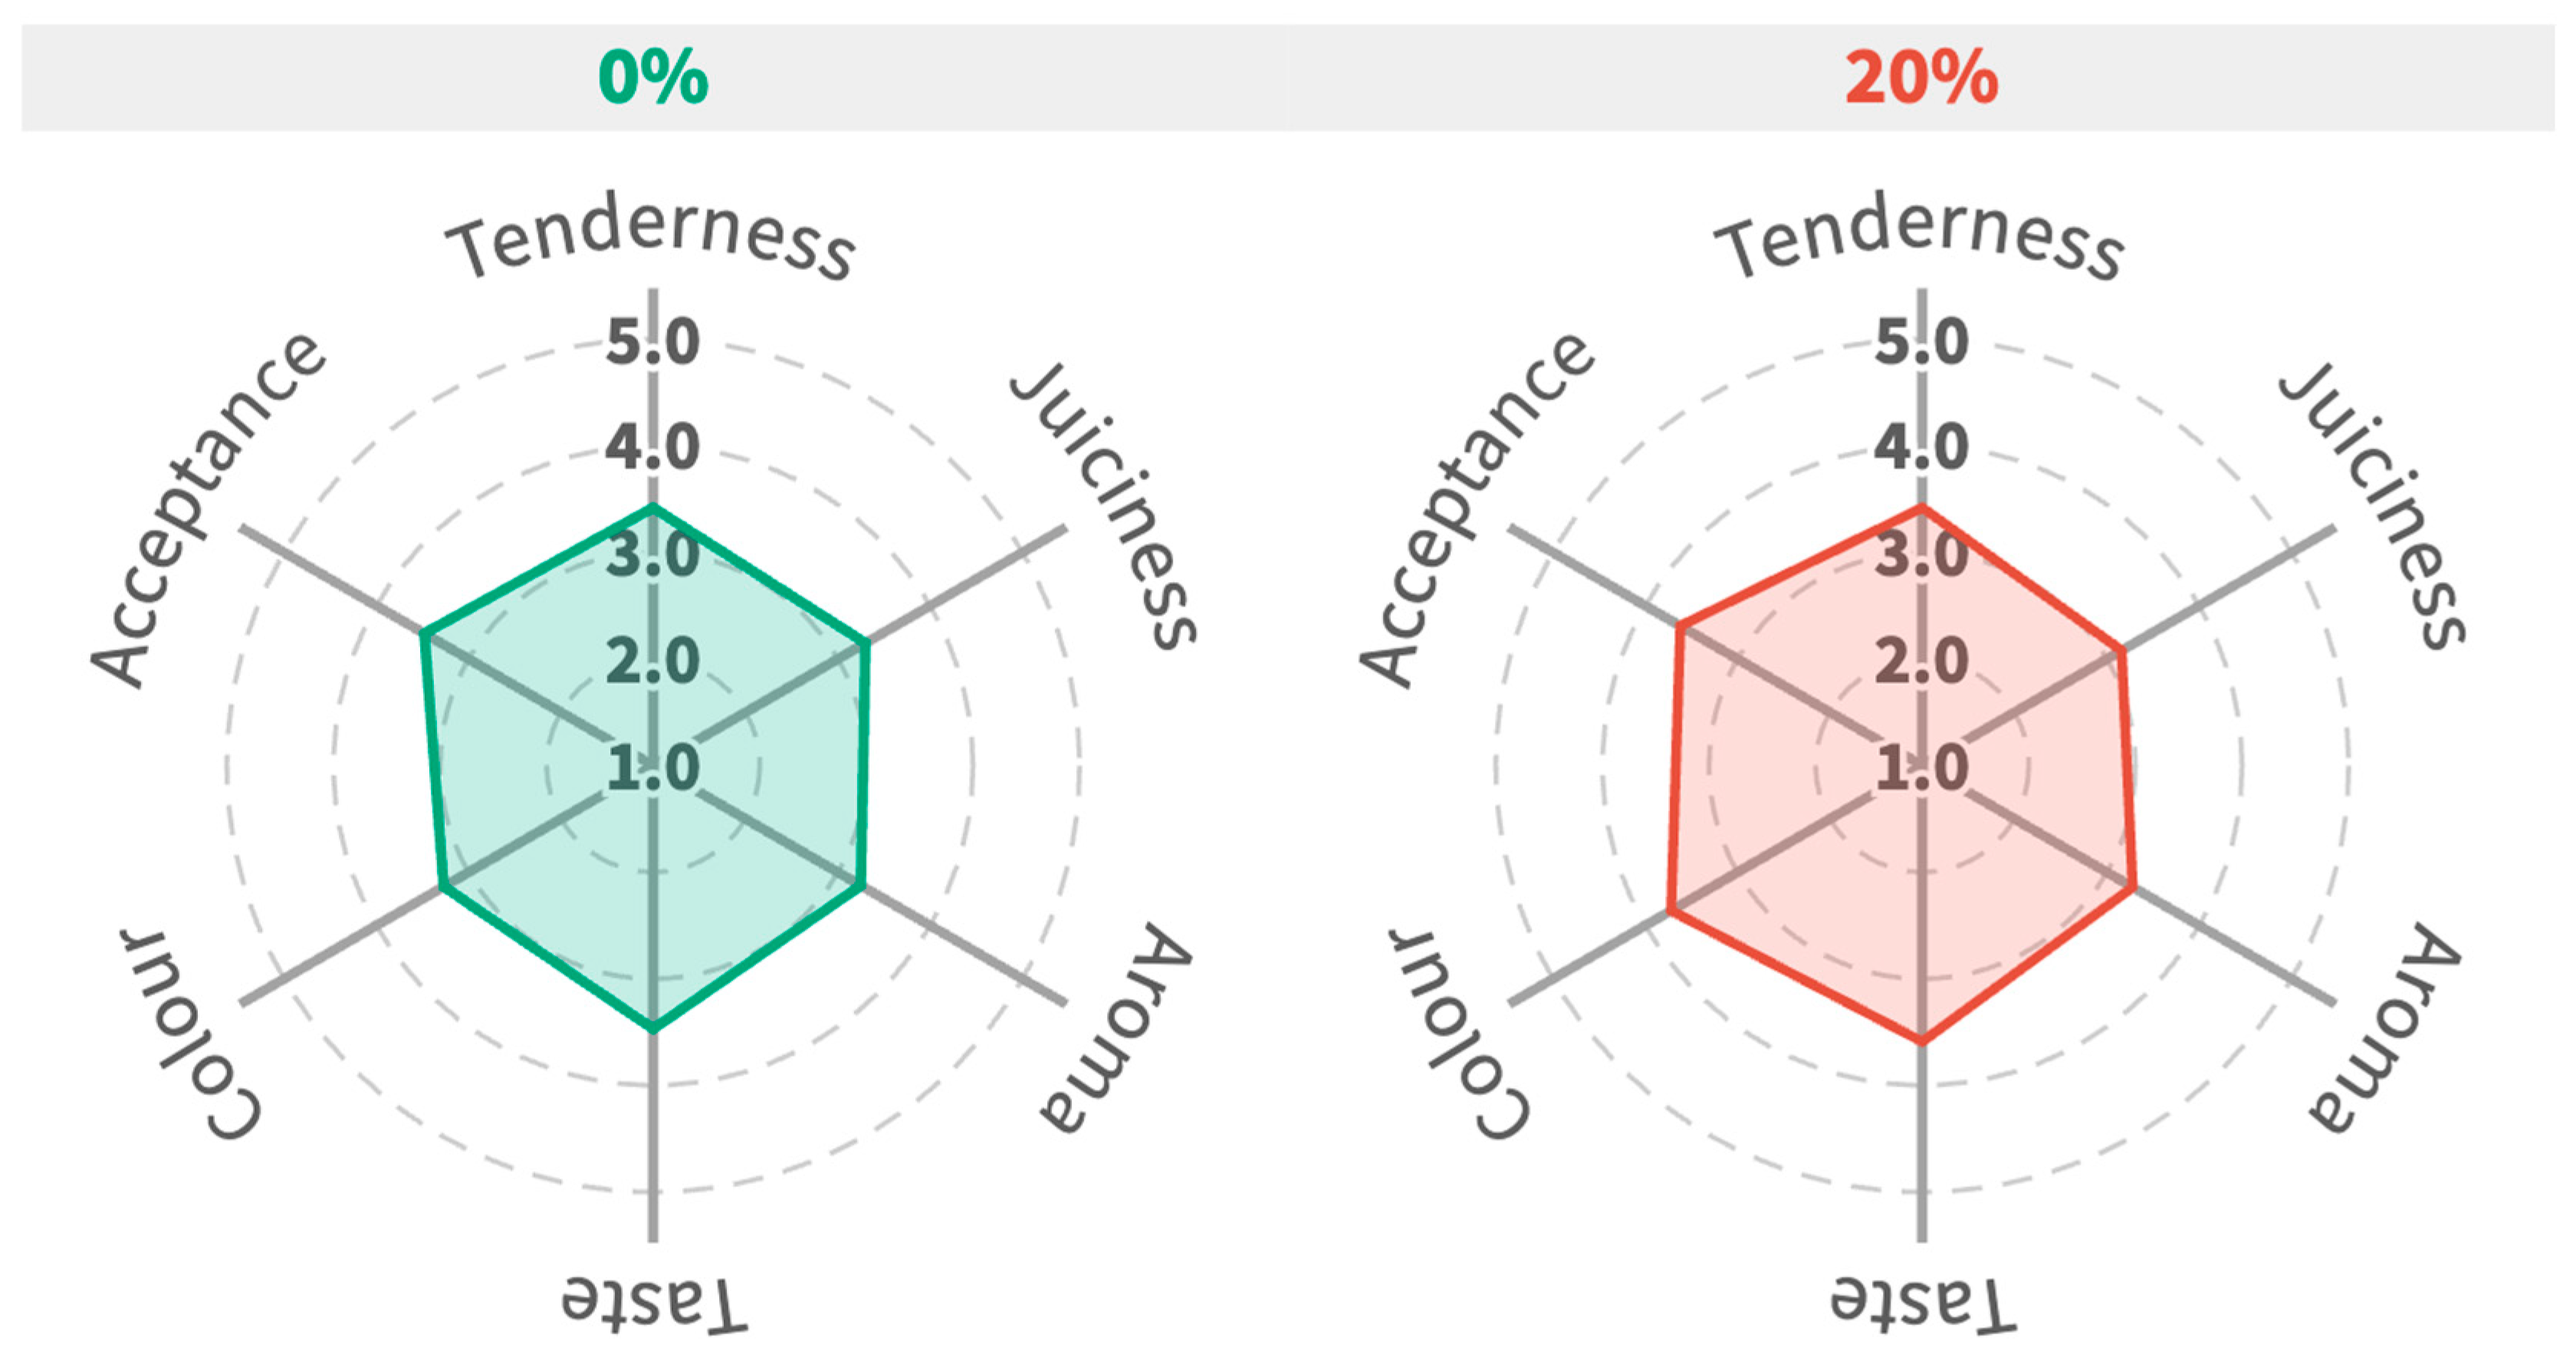
3.3. Findings of the Sensory Evaluation Test

The BM20 meat samples showed some differences regarding their sensory characteristics, as scored by the taste panel on a scale of 1 to 5 (Figure 2 and Table 9). In terms of their overall acceptance, the BM20 meat scored slightly higher (i.e., 3.48 ± 0.10) than the CON group (i.e., 3.62 ± 0.10). A data analysis revealed only one statistically significant difference (p < 0.05) between the two feeding scenarios, i.e., the meat’s colour. The BM20 meat scored significantly higher (3.72 ± 0.11) compared to CON samples (3.27 ± 0.10), revealing the preference of the taste panel for the BM20 meat samples. Differences between other sensory characteristics, i.e., juiciness, aroma, and taste, existed, but these were not statistically significant (p > 0.05). Regarding juiciness, CON samples scored higher (3.30 ± 0.11), meaning that the meat was juicer than the BM20 samples. On the contrary, BM20 meat was found to have a better aroma and taste compared to the CON meat. Finally, there was no differentiation regarding the tenderness between the two groups; they both scored 3.42. These observations show that the addition of BM20 in the feeding ratios of pigs positively affects the overall acceptance of their meat, enhancing their aroma, taste, and colour.

Regression Analysis

A multiple regression analysis was conducted to examine the associations between the overall acceptance of pig meat and the other sensory parameters that were analysed. According to the findings presented in Table 10, it is evident that, in addition to softness, the remaining sensory attributes have a statistically significant influence on the overall approval of pork flesh. According to the tasting panel, the primary factor influencing the general acceptance of pork flesh was its juiciness, followed by its taste. In addition, the sensory attributes of scent and colour were found to exert a substantial influence on the total consumer acceptability of pork, but softness emerged as the least influential element.

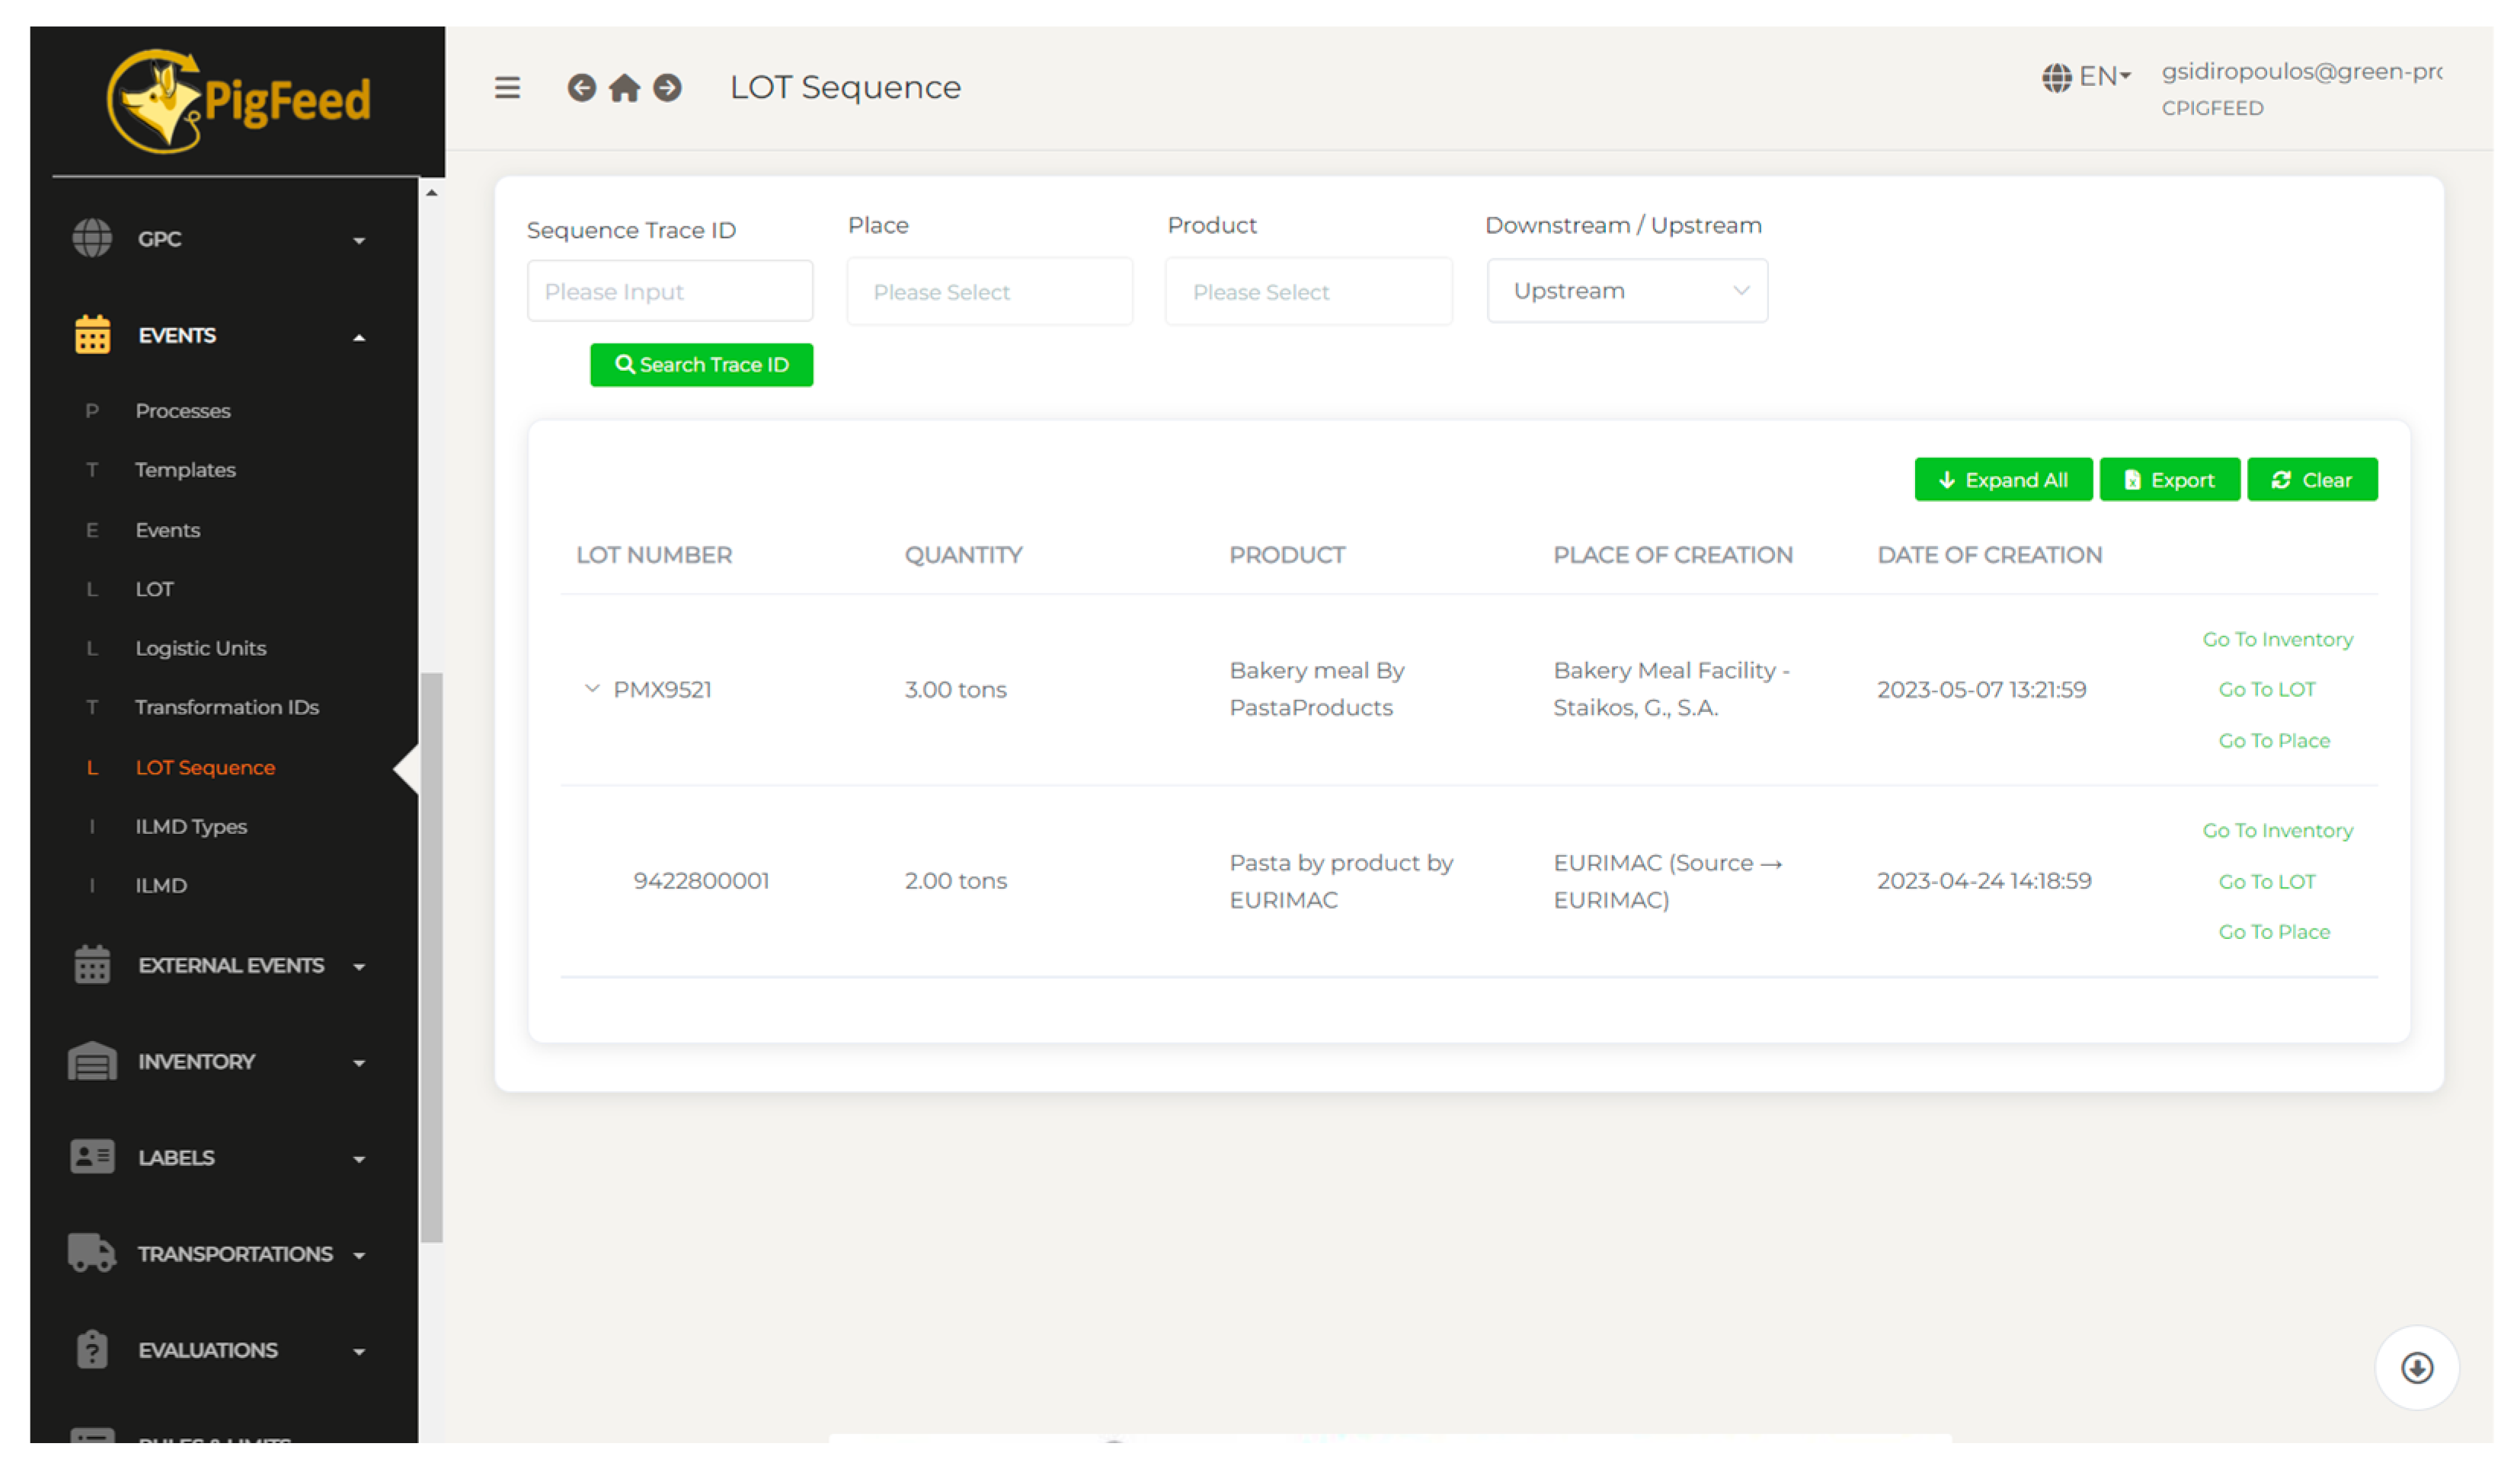
3.4. Development of Smart Applications and Tools for the Traceability, Marketing, and Supply of Food By-Products

3.4.1. Traceability System

Agri-food supply chain management is referred tp, in the research of Luo et al. (2018), as “the management of the relationship(s) among the raw material supply for agricultural production, processing, and product logistics and distribution” [67]. It is a complex task, which becomes more complicated because of the involvement of by-products in the food chain that are used for the production of, e.g., animal feed. It is also an interrelated system based on the “production adjustment and consumption-driven” [68]. The concept of circularity has been highlighted as an important issue in research on agri-food systems [69]. In addition, the improvement in supply chain efficiency in the process and the performance of waste management is dependent on the implementation of a circular economy, which is highlighted as the most important theme [70]. Therefore, there is a need for monitoring the inputs and outputs in the food production process that are related to by-products in the production process. In order to effectively recall a harmful food product, the information about the product location must be available “in time” and preferably “online”. Let us consider that the use, as inputs, of products that have arisen as by-products in some other production process adds further risks to the supply chain, it is understood that the need to fully trace all the inputs that may cause food safety issues is imperative.
For the development of an effective, transparent, and fully documented traceability system, there is a need for the adoption of standards and solutions that will allow the exchange of information related to products and events that occur at the various stages of production, processing, distribution, consumption, or/and disposal of products. Previous research investigated the standardisation of IoT data and platforms and highlighted GS1 EPCIS as one of the major standards [71]. In this project, the use of the Electronic Product Code Information System (EPCIS) Standard is chosen. The EPCIS is a standard defined by GS1, a non-profit international organisation which provides specifications for the representation of product traceability information [72]. At this point, it is important to note that, for the use case of the IoF2020 regarding the tracing and tracking of pigs, the EPCIS event model was developed for meat transparency and traceability [71]. The GS1 global organisation has defined standards for such information exchange, providing the Electronic Product Code (EPC) standard as well as the EPCglobal Architecture Framework [73].
The GS1 Electronic Product Code Information System is a GS1 International Organisation standard that allows trading partners to share information about the physical movements and status of “items” as they travel through the entire supply chain, from business to business to the final consumer. The EPCIS standard is chosen by companies that focus on the tracking and tracing of products [71]. “Objects”, in the context of EPCIS, usually refer either to physical objects that are identified (e.g., logistics units), or at the level of locations (e.g., warehouses, production units, etc.), tracked at different times, and which are treated in physical management steps of an overall business process involving one or more organisations. The goal of the EPCIS standard is to enable disparate and separate applications and processes (as this often happens from enterprise to enterprise) to generate and share events both internally within enterprises (intra-departmental), as well as with their partners, with a standardised, mutually acceptable manner and method.
Event data are created through business processes, captured through the EPCIS Capture Interface, and are available for query through the EPCIS Query Interfaces [74]. This exchange of event data is intended to allow users to gain a common view of physical or digital objects within the relevant business context.
The EPCIS standard, and, specifically, version 1.2, defines four different types of events. Together, these facts make it possible to report the following:
  • One or more products or group of products are created, observed or destroyed (Object Event);
  • One or more products are aggregated, or separated from, a larger unit, such as a box or pallet (Aggregation Event);
  • One or more products are composed and transformed for the production of one or more products (Transformation Event);
  • One or more products are related to or disconnected from a business transaction (Transaction Event).
Each event has a field that represents four possible dimensions of an EPCIS event [75]:
  • What (the subject of the event, either a specific object (EPC) or a class of object (EPC class) and a quantity);
  • When (the time at which the event occurred);
  • Where (the location where the event took place);
  • Why (the business context of the event).
The GS1 Global Traceability Standard adds a fifth dimension, “Who,” in order to identify the parties involved [76].
For each event, several fields are defined depending on the type of event, which contain information about which EPC product codes are observed (the epcList field), the location or even the specific point where the event takes place or the identity of a “parent” in a concentration process (the parentID field referring to, e.g., a palette).
The GS1 EPCIS standard is commonly employed in conjunction with the GS1 Core Business Vocabulary Language (CBV) standard. The CBV offers precise and comprehensive explanations of data values that are suitable for populating the data structures outlined in the Electronic Product Code Information Services (EPCIS) standard. The utilisation of the standardised lexicon offered by the CBV standard is of utmost importance for achieving interoperability and facilitating the provision and retrieval of data. This is accomplished by mitigating disparities in the manner in which enterprises articulate comparable concepts. The partners unanimously engage in comprehensive deliberations regarding the definition and significance of the constituent elements of the CBV standard, thereby ensuring their adherence to the established norms [72]. As an example, the EPCIS standard can define the field “business step,” whose possible values (e.g., shipping, receiving) can be defined in the Standard Vocabulary. It is worth noting that the GS1 EPCIS standard was also officially recognised in 2015 as a Standard by the ISO organisation (ISO/IEC 19987:2015) [77]. Data elements and structures are complied with GS1 EPCIS and CBV standards in order to enhance the data interactivity between the participants in the supply chain [78].
A traceability solution was adopted for the development of the integrated by-product full-path traceability scheme, which uses the field TransformationEvent of EPCIS in order to create, in our case, a logical connection between the input and output of the produced BM. The output identity is stored in the outputEPCList field with the corresponding quantities in the inputEPCList field, while the input identities are stored in the inputQuantityList field with the corresponding quantities in the outputQuantityList field. The rationale behind using outputEPCList for the process result is that only one event should be generated for each final product. The alternative solution is the creation of an input–output relationship per production event by using the grouping of related events and the transformationID field.
Finally, an important element that is used to characterize the BM as a product derived from the use of bakery FFPs is the IMLD field in which the specific property (attribute) “BySub-products” is assigned and takes specific values from a list depending on the used product. The information on employing bakery by-products and their quantity in pig feed diet is now following the final meat product to the final consumer.

3.4.2. Digital Tools Supporting Traceability

In order to effectively support the implementation of the traceability scheme, three digital tools were designed and developed. These three applications act as sources of input and retrieval of traceability information throughout the supply chain and are centrally connected to Green Projects’ KalaΘosΤΜ platform [79]. KalaΘosΤΜ supports the management of products, places, and supply chain actors, aiming for the implementation of full-path tracing from farm to shelf. The KalaΘosΤM Main Platform, along with its complementary Modules, offers real-time information through various digital mediums such as web, smartphones, and tablets. These Modules have the capability to function autonomously or in tandem with other information systems. The Service-Oriented Architecture (SOA) methodology has been employed, with a particular focus on the implementation of JSON (JavaScript Object Notation). The overarching open architecture approach employed in KalaΘosΤΜ facilitates modularity and enables seamless integration with external systems, thereby ensuring comprehensive operability. The KalaΘosΤΜ infrastructure also encompasses a comprehensive network of sensors deployed across farms, equipment, trucks, aggregation, processing, and logistics facilities. These sensors are intricately connected to a network of LoRa gateway stations, enabling seamless data transmission and communication [79]. For this research, a set of sensors was used for monitoring the transportation conditions of by-products and bakery meal from one unit to another.
The three digital tools that have been developed within the main platform are the following:
(i)
B2B App: Tool for supporting the disposal of FFPs by announcing the availability of quantities of FFPs with full information regarding their composition and state. The tool supports the implementation of relevant commercial transactions as well as the planning and real-time monitoring of cargo shipments (Figure 3).
Several functions are supported by the B2B App in conjunction with the KalaΘosΤΜ platform such as: the creation of an offer and demand requests, the negotiation between seller and buyer, the creation of a contract, and the monitoring of its implementation.
The basic services supported by the app are as follows:
  • Submission by sellers (producers, groups of producers, traders, etc.) for FFPs with specific characteristics (focusing on the potential uses of products) (Figure 3);
  • Request for quotation for products by buyers;
  • Negotiation process for price determination and other elements of commercial agreement;
  • Quality control procedures based on relevant protocols;
  • Monitoring the contract execution process, including the payment completion stage.
(ii)
Traceability App: A tool that covers the traceability needs with a focus on internal traceability at the level of FFP production units using GS1 global standards. It has an open architecture with interfaces with the production points for batching and labelling based on sorting and weighing (Figure 4).
The Traceability App supports the recording of product/by-product events throughout the supply chain. Stakeholders can see the events they created, as well as the events of downstream and upstream products. The events for covering the needs of this project are recorded in the following phases:
  • During the receipt of FFPs (Incoming LOT event);
  • During the transport to processing (Shipping event, Receiving Event);
  • During the processing and production of the BM (Transformation event);
  • During storage (Storing event, Unstoring event);
  • During transport to the rearing unit (Shipping event);
  • During the receiving and storing of products (Receiving event);
  • During the production of the ration (Transformation events).
(iii)
Label Creation App: A tool for selecting the information for label creation. It has full interface with Traceability App.
The Label Creation App supports the correct and complete display of information, which will appear on the physical product and by-product labels, providing more details about ingredients and production processes, linking the information provided to the realised events (events) along the supply chain (Figure 5). Buyers can access this information through the printed labels at unit sales level and/or at pallet level.
The three steps that support the process of producing a product/by-product label, based on EU legislation and the needs of each organisation and/or buyer, are the following:
  • Labels template creation at organisation level per product and per processing stage;
  • Information receiving, to be printed on the label, from Traceability App;
  • Label creation, checking, and printing.
During the demonstration trial, the three aforementioned tools were used to support the implementation of a traceability scenario covering all relevant steps of the supply chain. The process is initiated with the submission of a request for quotation for FFPs through the B2B app. An offer for pasta FFP was made available by an industry in northern Greece based on the quotation and, after a negotiation phase, a sales contract (order) was agreed. Then, the FFPs were collected and gathered at a BM processing plant, unpacked, ground, and thermally treated. The produced BM was shipped to the pig farm in Nea Triglia, Chalkidiki to be included in the feeding diet of the pigs. All the events that occurred at the supply chain, from the initial shipping, and the production phase up to the inclusion of the BM into the pigs’ diet, were recorded using the Traceability App. Furthermore, for transporting FFPs and BM from one unit to the other, a set of LoRa and GSM sensors was used for monitoring the transportation conditions, namely temperature and humidity. This information is available in the KalaΘosTM platform for each shipping event. Finally, a set of labels were produced through the Label Creation App, when a product (new LOT number) was entering the supply chain, either as an incoming product or as a produced (output) product. The recording of all supply chain events makes available to the users the information regarding the lot-by-lot traceability.

4. Conclusions

In this study, an integrated methodology for the sustainable valorisation of bakery FFPs as a pig feed ingredient was demonstrated through a pilot trial of the whole value chain, e.g., bakery FFP collection, the production of BM and its analytical characterisation, the tracking of both bakery FFP collection and BM use through smart applications, the inclusion of BM in real pig feed diets, feeding trials, and meat analysis and sensory characterisation. The produced BM was physiochemically and microbiologically safe for addition in pig feed diet and its inclusion, at a rate of 20% w/w, in finishing pig feed diet, did not affect the growth performance or the FCR. The produced meat did not differ significantly from meat samples of pigs fed with the conventional diet concerning the colour, the lipid oxidative analysis, and the lipids’ health indices. Moreover, the sensory evaluation of the produced meat was positive with 3.62/5.00 Overall Acceptance, which does not differ significantly from the Overall Acceptance (3.48/5.00) of the meat samples from the control group. Overall, the use of bakery FFPs as a pig feed ingredient—when properly employed—seems to be a successful circular bioeconomy paradigm of FFP valorisation, resulting in a reduction in the need for conventional feed ingredients with no detrimental effect on pig farming performance and the quality of the resulting meat products.
To achieve the safe integration of FFPs in the animal feed supply chain, a comprehensive strategy is essential concerning FFP collection and redistribution from the human food supply chain. Standards like barcoding and blockchain may ensure the secure and precise monitoring and categorisation of FFPs suitable for animal feed. Close partnerships between food producers, bakers, and animal feed manufacturers will enable efficient by-product collection. The legal and safe use of FFPs also requires strict food safety regulations and a clear legislative framework. To raise awareness of the benefits and safety of using FFPs in animal feed, producers, farmers, and feed manufacturers must be trained. Research and innovation, especially locally, encourages flexible and creative waste management solutions. The monitoring and evaluation of waste collection initiatives to optimise resource allocation and minimise environmental impact, creating a more efficient and eco-friendly framework for diverting FFPs to animal feed, reducing food waste, and improving resource use, shall be an integral part of the strategy towards sustainability.

Author Contributions

Conceptualisation, A.M., G.F.B., S.I.P., E.N.S. and N.T.; methodology, S.I.P., G.F.B., A.M., E.N.S. and E.K.; software, E.K. and N.T.; validation, L.M., S.I.P. and E.N.S.; formal analysis, A.M., A.D., G.F.B., E.N.S. and K.N.K.; investigation, A.D., S.I.P., E.N.S., E.K. and K.V.; resources, K.V., E.N.S. and E.K.; data curation, A.M., L.M., A.D. and K.N.K.; writing—original draft preparation, A.M., S.I.P., A.D., K.N.K., E.N.S., L.M. and N.T.; writing—review and editing, L.M., S.I.P. and G.F.B.; visualisation, K.N.K., A.M. and N.T.; supervision, G.F.B., E.N.S. and N.T.; project administration, N.T. and G.F.B.; funding acquisition, S.I.P., G.F.B., N.T. and E.N.S. All authors have read and agreed to the published version of the manuscript.

Funding

This study was co-financed by the European Regional Development Fund of the European Union and Greek national funds through the Operational Program Competitiveness, Entrepreneurship and Innovation, under the call RESEARCH—CREATE—INNOVATE (project code: T2EDK-04537).

Institutional Review Board Statement

The study was conducted according to the guidelines of the Declaration of Helsinki, and approved by the Research Ethical Committee of the Hellenic Agricultural Organisation-Demeter (Protocol Number 14948/6-03-2023).

Informed Consent Statement

All participants participated voluntarily and signed an informed consent form before the Sensory Evaluation Testing (SET). All collected data were irreversibly anonymous, e.g., the individual persons could not be identifiable from the collected data sets.

Data Availability Statement

The data presented in this study are available on request from the corresponding author. The data are not publicly available due to privacy restrictions set by the funding agency of the research presented.

Acknowledgments

The authors would like to thank KAFSIS S.A. (https://www.kafsis.com/) for their support and expert knowledge on the production of the bakery meal used in this study.

Conflicts of Interest

The authors declare no conflict of interest.

References

  1. Malak-Rawlikowska, A.; Gębska, M.; Hoste, R.; Leeb, C.; Montanari, C.; Wallace, M.; de Roest, K. Developing a Methodology for Aggregated Assessment of the Economic Sustainability of Pig Farms. Energies 2021, 14, 1760. [Google Scholar] [CrossRef]
  2. Kwas, M.; Paccagnini, A.; Rubaszek, M. Common factors and the dynamics of cereal prices. A forecasting perspective. J. Commod. Mark. 2022, 28, 100240. [Google Scholar] [CrossRef]
  3. Mavromichalis, I.; Kerr, B.J.; Parr, T.M.; Albin, D.M.; Gabert, V.M.; Baker, D.H. Valine requirement of nursery pigs. J. Anim. Sci. 2001, 79, 1223. [Google Scholar] [CrossRef] [PubMed]
  4. Gunnarsson, S.; Arvidsson Segerkvist, K.; Wallgren, T.; Hansson, H.; Sonesson, U. A Systematic Mapping of Research on Sustainability Dimensions at Farm-level in Pig Production. Sustainability 2020, 12, 4352. [Google Scholar] [CrossRef]
  5. Ndue, K.; Pál, G. Life Cycle Assessment Perspective for Sectoral Adaptation to Climate Change: Environmental Impact Assessment of Pig Production. Land 2022, 11, 827. [Google Scholar] [CrossRef]
  6. FAO. FAO Publications Catalogue 2022; FAO: Rome, Italy, 2022; ISBN 978-92-5-136969-2. [Google Scholar]
  7. Ruckli, A.K.; Hörtenhuber, S.J.; Ferrari, P.; Guy, J.; Helmerichs, J.; Hoste, R.; Hubbard, C.; Kasperczyk, N.; Leeb, C.; Malak-Rawlikowska, A.; et al. Integrative Sustainability Analysis of European Pig Farms: Development of a Multi-Criteria Assessment Tool. Sustainability 2022, 14, 5988. [Google Scholar] [CrossRef]
  8. U.S. Pork Center of Excellence. National Swine Nutrition Guide—U.S. Pork Center of Excellence. Available online: https://www.usporkcenter.org/product/national-swine-nutrition-guide/ (accessed on 21 June 2023).
  9. Food Waste. Available online: https://food.ec.europa.eu/safety/food-waste_en (accessed on 21 June 2023).
  10. Preparatory Study on Food Waste Across EU 27—European Environment Agency. Available online: https://www.eea.europa.eu/data-and-maps/data/external/preparatory-study-on-food-waste (accessed on 21 June 2023).
  11. Arbinolo, R. EU Wastes More Food Than It Imports, Says New Report. Available online: https://eeb.org/eu-wastes-more-food-than-it-imports-says-new-report/ (accessed on 24 July 2023).
  12. De Boer, F. Food waste disposal in Dutch livestock husbandry. Livest. Prod. Sci. 1980, 7, 39–48. [Google Scholar] [CrossRef]
  13. Westendorf, M.L.; Dong, Z.C.; Schoknecht, P.A. Recycled cafeteria food waste as a feed for swine: Nutrient content digestibility, growth, and meat quality. J. Anim. Sci. 1998, 76, 2976. [Google Scholar] [CrossRef]
  14. Barasona, J.A.; Gallardo, C.; Cadenas-Fernández, E.; Jurado, C.; Rivera, B.; Rodríguez-Bertos, A.; Arias, M.; Sánchez-Vizcaíno, J.M. First Oral Vaccination of Eurasian Wild Boar against African Swine Fever Virus Genotype II. Front. Vet. Sci. 2019, 6, 137. [Google Scholar] [CrossRef]
  15. Chenais, E.; Depner, K.; Guberti, V.; Dietze, K.; Viltrop, A.; Ståhl, K. Epidemiological considerations on African swine fever in Europe 2014–2018. Porc. Health Manag. 2019, 5, 6. [Google Scholar] [CrossRef]
  16. Ramu, P. Performance and Nutrient Digestibility in Sheep Fed Diets Containing Varying Levels of Biscuit Waste; Narsimha Rao Telangana Veterinary University: Hyderabad, India, 2018. [Google Scholar]
  17. Tiwari, M.R.; Dhakal, H.R. Bakery Waste is an Alternative of Maize to Reduce the Cost of Pork Production. Int. J. Res. Agric. For. 2020, 7, 1–9. [Google Scholar] [CrossRef]
  18. Mavromichalis, I. Formulating Poultry and Pig Diets with Bakery Meal. Available online: https://www.wattagnet.com/home/article/15508699/formulating-poultry-and-pig-diets-with-bakery-meal (accessed on 22 July 2023).
  19. Ottoboni, M.; Tretola, M.; Luciano, A.; Giuberti, G.; Gallo, A.; Pinotti, L. Carbohydrate digestion and predicted glycemic index of bakery/confectionary ex-food intended for pig nutrition. Ital. J. Anim. Sci. 2019, 18, 838–849. [Google Scholar] [CrossRef]
  20. European Commission. Commission Notice of 16 April 2018 Laying Down Guidelines for the Feed Use of Food No Longer Intended for Human Consumption; European Commission: Brussels, Belgium, 2018. [Google Scholar]
  21. Giromini, C.; Ottoboni, M.; Tretola, M.; Marchis, D.; Gottardo, D.; Caprarulo, V.; Baldi, A.; Pinotti, L. Nutritional evaluation of former food products (ex-food) intended for pig nutrition. Food Addit. Contam. Part A 2017, 34, 1436–1445. [Google Scholar] [CrossRef] [PubMed]
  22. Stenmarck, A.; Jensen, C.; Quested, T.; Moates, G. Estimates of European Food Waste Levels; FUSIONS: Stockholm, Sweden, 2016. [Google Scholar]
  23. Banik, S.; Sahoo, N.R.; Naskar, S.; Pourouchottamane, R.; Mohan, N.H.; Tamuli, M.K. Annual Report All India Coordinated Research Project and Mega Seed Project on Pig; Indian Council of Agricultural Research: New Delhi, India, 2011. [Google Scholar]
  24. Rojas, O.J.; Liu, Y.; Stein, H.H. Phosphorus digestibility and concentration of digestible and metabolizable energy in corn, corn coproducts, and bakery meal fed to growing pigs1. J. Anim. Sci. 2013, 91, 5326–5335. [Google Scholar] [CrossRef]
  25. Casas, G.A.; Almeida, J.A.S.; Stein, H.H. Amino acid digestibility in rice co-products fed to growing pigs. Anim. Feed Sci. Technol. 2015, 207, 150–158. [Google Scholar] [CrossRef]
  26. Slominski, B.A.; Boros, D.; Campbell, L.D.; Guenter, W.; Jones, O. Wheat by-products in poultry nutrition. Part I. Chemical and nutritive composition of wheat screenings, bakery by-products and wheat mill run. Can. J. Anim. Sci. 2004, 84, 421–428. [Google Scholar] [CrossRef]
  27. Liu, Y.; Jha, R.; Stein, H.H.; Adedokun, S.A.; Adeola, O.; Azain, M.J.; Baidoo, S.K.; Carter, S.D.; Crenshaw, T.D.; Dilger, R.; et al. Nutritional composition, gross energy concentration, and in vitro digestibility of dry matter in 46 sources of bakery meals. J. Anim. Sci. 2018, 96, 4685–4692. [Google Scholar] [CrossRef]
  28. Superchi, P.; Barbera, E.; Beretti, V.; Gatti, L.; Sabbioni, A. Bakery wastes in sows lactating diets. Ann. Fac. Med. Vet. Parma 2008, XXVIII, 201–210. [Google Scholar]
  29. Kumar, A.; Roy, B.; Lakhani, G.P.; Jain, A. Evaluation of dried bread waste as feedstuff for growing crossbred pigs. Vet. World 2014, 7, 698–701. [Google Scholar] [CrossRef]
  30. Manu, F.; Okai, D.; Boateng, M.; Frimpong, Y. Nutrient composition, pest and microbial status and effects of discarded biscuits on the growth performance, carcass characteristics and economic profiles of growing-finishing pigs. Afr. J. Food Agric. Nutr. Dev. 2015, 15, 10241–10254. [Google Scholar] [CrossRef]
  31. Barman, K.; Tamuli, M.K.; Sarma, D.K.; Banik, S.; Mohan, N.H.; Thomas, R.; Gokuldas, P.P.; Pegu, S.R.; Kaushik, P. Effect of Replacing Maize with Bakery Waste on the Performance of Growing Crossbred Pigs. Anim. Nutr. Feed Technol. 2016, 16, 165. [Google Scholar] [CrossRef]
  32. Kumar, A.; Roy, B.; Sirohi, R.; Singh, Y.; Singh, D.N. Effect of Bread Waste Feeding on Growth Performance and Carcass Traits of Crossbred Pigs. J. Anim. Res. 2016, 6, 297. [Google Scholar] [CrossRef]
  33. Ojediran, T.K. Growth response, cost benefit, carcass characteristics and organoleptic properties of pigs fed biscuit dough as a replacement for maize. Acta Fytotech. Zootech. 2019, 22, 58–63. [Google Scholar] [CrossRef]
  34. Tiwari, M.R.; Dhakal, H.R.; Sah Sudi, M. Growth comparison of piglets fed with different level of bakery waste in basal diet. J. Agric. For. Univ. 2020, 4, 261–267. [Google Scholar] [CrossRef]
  35. AL Sagan, A.A.; Al-Abdulkader, A.M.; Al-Dakhil, A.I.; Khalil, S.; Al-Khuraish, M.M. Technical and economic potentials of the unconventional extruded dried Arabic bread wastes in broilers diets. Saudi J. Biol. Sci. 2021, 28, 262–271. [Google Scholar] [CrossRef]
  36. Ramteke, B.; Gadegaonkar, G.; Prabhale, B.; Sirsat, S. Effect of Replacement of Maize with Dry Bakery Waste with or without Lysophospholipid in Broiler Diet. Int. J. Livest. Res. 2019, 9, 204–208. [Google Scholar] [CrossRef]
  37. Kaltenegger, A.; Humer, E.; Stauder, A.; Zebeli, Q. Feeding of bakery by-products in the replacement of grains enhanced milk performance, modulated blood metabolic profile, and lowered the risk of rumen acidosis in dairy cows. J. Dairy Sci. 2020, 103, 10122–10135. [Google Scholar] [CrossRef]
  38. Food and Agriculture Organization of the United Nations. Food Wastage Footprint: Impacts on Natural Resources. Summary Report; Food and Agriculture Organization of the United Nations (FAO): Rome, Italy, 2013; ISBN 978-92-5-107752-8. [Google Scholar]
  39. Albala, K. International Assessment of Agricultural Knowledge, Science and Technology for Development Study. In The SAGE Encyclopedia of Food Issues; SAGE Publications, Inc.: Thousand Oaks, CA, USA, 2015. [Google Scholar] [CrossRef]
  40. Ominski, K.; McAllister, T.; Stanford, K.; Mengistu, G.; Kebebe, E.G.; Omonijo, F.; Cordeiro, M.; Legesse, G.; Wittenberg, K. Utilization of by-products and food waste in livestock production systems: A Canadian perspective. Anim. Front. 2021, 11, 55–63. [Google Scholar] [CrossRef]
  41. Melas, L.; Batsioula, M.; Malamakis, A.; Patsios, S.I.; Geroliolios, D.; Alexandropoulos, E.; Skoutida, S.; Karkanias, C.; Dedousi, A.; Kritsa, M.-Z.; et al. Circular Bioeconomy Practices in the Greek Pig Sector: The Environmental Performance of Bakery Meal as Pig Feed Ingredient. Sustainability 2023, 15, 11688. [Google Scholar] [CrossRef]
  42. Shurson, G.C. “What a Waste”—Can We Improve Sustainability of Food Animal Production Systems by Recycling Food Waste Streams into Animal Feed in an Era of Health, Climate, and Economic Crises? Sustainability 2020, 12, 7071. [Google Scholar] [CrossRef]
  43. Govindaraju, M.; Sathasivam, K.V.; Marimuthu, K. Waste to Wealth: Value Recovery from Bakery Wastes. Sustainability 2021, 13, 2835. [Google Scholar] [CrossRef]
  44. Narisetty, V.; Cox, R.; Willoughby, N.; Aktas, E.; Tiwari, B.; Matharu, A.S.; Salonitis, K.; Kumar, V. Recycling bread waste into chemical building blocks using a circular biorefining approach. Sustain. Energy Fuels 2021, 5, 4842–4849. [Google Scholar] [CrossRef] [PubMed]
  45. Ungureanu-Comanita, E.-D.; Olteanu, S.; Cosbuc, E.L.; Smaranda, C.; Gavrilescu, M. Environmental Pressures Generated by Bakery Waste for Sustainable Management. In Proceedings of the 2021 International Conference on e-Health and Bioengineering (EHB), Iasi, Romania, 18–19 November 2021; pp. 1–4. [Google Scholar]
  46. Luciano, A.; Tretola, M.; Ottoboni, M.; Baldi, A.; Cattaneo, D.; Pinotti, L. Potentials and Challenges of Former Food Products (Food Leftover) as Alternative Feed Ingredients. Animals 2020, 10, 125. [Google Scholar] [CrossRef]
  47. The European Comission Commission Regulation (EU) No 142/2011 of 25 February 2011 implementing Regulation (EC) No 1069/2009 of the European Parliament and of the Council laying down health rules as regards animal by-products and derived products not intended for human consumpti. Off. J. Eur. Union 2011, L 54, 1–254.
  48. Commission Regulation (EC) No 152/2009 of 27 January 2009 Laying down the Methods of Sampling and Analysis for the Official Control of Feed (Text with EEA Relevance). Available online: https://eur-lex.europa.eu/legal-content/EN/ALL/?uri=CELEX:32009R0152 (accessed on 21 June 2023).
  49. Dedousi, A.; Kritsa, M.-Z.; Đukić Stojčić, M.; Sfetsas, T.; Sentas, A.; Sossidou, E. Production Performance, Egg Quality Characteristics, Fatty Acid Profile and Health Lipid Indices of Produced Eggs, Blood Biochemical Parameters and Welfare Indicators of Laying Hens Fed Dried Olive Pulp. Sustainability 2022, 14, 3157. [Google Scholar] [CrossRef]
  50. European Commission. Consolidated Text: Commission Regulation (EEC) No 2568/91 of 11 July 1991 on the Characteristics of Olive Oil and Olive-Residue Oil and on the Relevant Methods of Analysis; European Commission: Brussels, Belgium, 1991. [Google Scholar]
  51. Vendl, O.; Berthiller, F.; Crews, C.; Krska, R. Simultaneous determination of deoxynivalenol, zearalenone, and their major masked metabolites in cereal-based food by LC–MS–MS. Anal. Bioanal. Chem. 2009, 395, 1347–1354. [Google Scholar] [CrossRef]
  52. Ouakhssase, A.; Chahid, A.; Choubbane, H.; Aitmazirt, A.; Addi, E.A. Optimization and validation of a liquid chromatography/tandem mass spectrometry (LC-MS/MS) method for the determination of aflatoxins in maize. Heliyon 2019, 5, e01565. [Google Scholar] [CrossRef] [PubMed]
  53. ISO 21528-2:2017; Microbiology of the Food Chain—Horizontal Method for the Detection and Enumeration of Enterobacteriaceae—Part 2: Colony-Count Technique. International Organization for Standardization: Geneva, Switzerland, 2017.
  54. ISO 6579-1:2017; Microbiology of the Food Chain—Horizontal Method for the Detection, Enumeration and Serotyping of Salmonella—Part 1: Detection of Salmonella spp. International Organization for Standardization: Geneva, Switzerland, 2017.
  55. ISO 10272-2:2017(en); Microbiology of the Food Chain—Horizontal Method for Detection and Enumeration of Campylobacter spp.—Part 2: Colony-Count Technique. International Organization for Standardization: Geneva, Switzerland, 2017.
  56. EU Council Directive 2008/120/EC of 18 December 2008 Laying Down Minimum Standards for the Protection of Pigs; European Commission: Brussels, Belgium, 2008.
  57. Mihafu, F.D.; Issa, J.Y.; Kamiyango, M.W. Implication of Sensory Evaluation and Quality Assessment in Food Product Development: A Review. Curr. Res. Nutr. Food Sci. J. 2020, 8, 690–702. [Google Scholar] [CrossRef]
  58. Adam, S.S.M. Sensory and Instrumental Methods of Meat Evaluation: A Review. Int. J. Food Sci. Agric. 2021, 5, 627–638. [Google Scholar] [CrossRef]
  59. Dedousi, A.; Patsios, S.I.; Kritsa, M.-Z.; Kontogiannopoulos, K.N.; Ioannidou, M.; Zdragas, A.; Sossidou, E.N. Growth Performance, Meat Quality, Welfare and Behavior Indicators of Broilers Fed Diets Supplemented with Yarrowia lipolytica Yeast. Sustainability 2023, 15, 1924. [Google Scholar] [CrossRef]
  60. Ioannidou, M.D.; Maggira, M.; Samouris, G. Physicochemical Characteristics, Fatty Acids Profile and Lipid Oxidation during Ripening of Graviera Cheese Produced with Raw and Pasteurized Milk. Foods 2022, 11, 2138. [Google Scholar] [CrossRef] [PubMed]
  61. Omri, B.; Chalghoumi, R.; Izzo, L.; Ritieni, A.; Lucarini, M.; Durazzo, A.; Abdouli, H.; Santini, A. Effect of Dietary Incorporation of Linseed Alone or Together with Tomato-Red Pepper Mix on Laying Hens’ Egg Yolk Fatty Acids Profile and Health Lipid Indexes. Nutrients 2019, 11, 813. [Google Scholar] [CrossRef] [PubMed]
  62. Ulbricht, T.L.V.; Southgate, D.A.T. Coronary heart disease: Seven dietary factors. Lancet 1991, 338, 985–992. [Google Scholar] [CrossRef] [PubMed]
  63. Ko, E.-Y.; Saini, R.K.; Keum, Y.-S.; An, B.-K. Age of Laying Hens Significantly Influences the Content of Nutritionally Vital Lipophilic Compounds in Eggs. Foods 2020, 10, 22. [Google Scholar] [CrossRef]
  64. Zeb, A.; Ullah, F. A Simple Spectrophotometric Method for the Determination of Thiobarbituric Acid Reactive Substances in Fried Fast Foods. J. Anal. Methods Chem. 2016, 2016, 9412767. [Google Scholar] [CrossRef]
  65. Ruiz-Capillas, C.; Herrero, A.M.; Pintado, T.; Delgado-Pando, G. Sensory Analysis and Consumer Research in New Meat Products Development. Foods 2021, 10, 429. [Google Scholar] [CrossRef]
  66. Prasad, P.N.G.; Bose, B.; Chopra, N.; Dwarkanath, P.; Sarma, P.M.; Raj, J.M. P06-042-23 Sensory Evaluation and Acceptability Test of the Daily Consumed Food Snacks Prepared with Dried Mushroom Powder Enhanced with Vitamin-D2. Curr. Dev. Nutr. 2023, 7, 100878. [Google Scholar] [CrossRef]
  67. Luo, J.; Ji, C.; Qiu, C.; Jia, F. Agri-Food Supply Chain Management: Bibliometric and Content Analyses. Sustainability 2018, 10, 1573. [Google Scholar] [CrossRef]
  68. Yadav, S.; Luthra, S.; Garg, D. Internet of things (IoT) based coordination system in Agri-food supply chain: Development of an efficient framework using DEMATEL-ISM. Oper. Manag. Res. 2020, 15, 1–27. [Google Scholar] [CrossRef]
  69. van Wassenaer, L.; Verdouw, C.; Kassahun, A.; van Hilten, M.; van der Meij, K.; Tekinerdogan, B. Tokenizing circularity in agri-food systems: A conceptual framework and exploratory study. J. Clean. Prod. 2023, 413, 137527. [Google Scholar] [CrossRef]
  70. Nattassha, R.; Handayati, Y.; Simatupang, T.M.; Siallagan, M. Understanding circular economy implementation in the agri-food supply chain: The case of an Indonesian organic fertiliser producer. Agric. Food Secur. 2020, 9, 10. [Google Scholar] [CrossRef]
  71. Tolcha, Y.; Kassahun, A.; Montanaro, T.; Conzon, D.; Schwering, G.; Maselyne, J.; Kim, D. Towards Interoperability of Entity-Based and Event-Based IoT Platforms: The Case of NGSI and EPCIS Standards. IEEE Access 2021, 9, 49868–49880. [Google Scholar] [CrossRef]
  72. Bruno, G.; Viola, V. A Collaborative Architecture for Supply Chain Transparency Based on EPCIS Standard and MongoDB. In Collaboration in a Hyperconnected World; Springer International Publishing: Berlin/Heidelberg, Germany, 2016; pp. 599–607. [Google Scholar]
  73. Traub, K.; Armenio, F.; Barthel, H.; Dietrich, P.; Duker, J.; Floerkemeier, C.; Garrett, J.; Harrison, M.; Hogan, B.; Mitsugi, J.; et al. The GS1 EPCglobal Architecture Framework; GS1: Brussels, Belgium, 2015. [Google Scholar]
  74. Thakur, M.; Sørensen, C.-F.; Bjørnson, F.O.; Forås, E.; Hurburgh, C.R. Managing food traceability information using EPCIS framework. J. Food Eng. 2011, 103, 417–433. [Google Scholar] [CrossRef]
  75. Moysiadis, T.; Spanaki, K.; Kassahun, A.; Kläser, S.; Becker, N.; Alexiou, G.; Zotos, N.; Karali, I. AgriFood supply chain traceability: Data sharing in a~farm-to-fork case. Benchmarking Int. J. 2022. [Google Scholar] [CrossRef]
  76. Keogh, J.G.; Rejeb, A.; Khan, N.; Dean, K.; Hand, K.J. Optimizing global food supply chains: The case for blockchain and GSI standards. In Building the Future of Food Safety Technology; Elsevier: Amsterdam, The Netherlands, 2020; pp. 171–204. [Google Scholar]
  77. ISO/IEC 19987:2015; Information Technology—EPC Information Services—Specification. International Organization for Standardization: Geneva, Switzerland, 2015.
  78. Li, L.; Qu, H.; Wang, H.; Wang, J.; Wang, B.; Wang, W.; Xu, J.; Wang, Z. A Blockchain-Based Product Traceability System with Off-Chain EPCIS and IoT Device Authentication. Sensors 2022, 22, 8680. [Google Scholar] [CrossRef] [PubMed]
  79. Tsotsolas, N.; Komisopoulos, F.; Papadopoulos, P.; Koutsouraki, E. An Integrated LoRa-Based IoT Platform Serving Smart Farming and Agro-Logistics; IGI Global: Hershey, PA, USA, 2022; pp. 132–158. [Google Scholar]
Figure 1. Mapping of possible by-product sources. The three zones of interest are depicted in each map section. The QR code is an open data source of the mapped sources.
Sustainability 15 14385 g001
Figure 2. Sensory characteristics of pig meat. Characteristics were judged by a panel on a scale from 1 to 5.
Sustainability 15 14385 g002
Figure 3. A screenshot of the B2B App.
Sustainability 15 14385 g003
Figure 4. Traceability App.
Sustainability 15 14385 g004
Figure 5. A screenshot of the Label Creation App.
Sustainability 15 14385 g005
Table 1. Nutrients analysis, amino acids composition profile, aflatoxins and mycotoxins concentration, and microbiological characterisation of the BM used in this study. Data are presented as mean values ± SD; the data comprise two production batches and four samples in total.
ParameterBakery Meal
Moisture and Volatiles (g/100 g)8.57 ± 2.37
Ash (g/100 g)2.93 ± 1.71
Fat (g/100 g)13.75 ± 5.69
Proteins (g/100 g)16.09 ± 2.04
Crude fibers % (g/100 g)0.36 ± 0.08
Carbohydrates (g/100 g)58.41 ± 7.28
Sugars (g/100 g)5.87 ± 2.45
Starch (g/100 g)37.30 ± 5.66
Energy (kcal/100 g)421.7 ± 30.3
Fatty Acid (FA) Composition
Monounsaturated FA—MUFA (% w/w)38.5 ± 17.5
Polyunsaturated FA—PUFA (% w/w)14.5 ± 0.7
Saturated FA—SFA (% w/w)46.5 ± 23.3
Iodine Value (meq O2/kg)4.9–6.5
Amino acids (g/kg)
Alanine9.1 ± 4.0
Arginine5.1 ± 2.7
Aspartic acid17.7 ± 3.5
Glutaminic acid33.1 ± 5.9
Glycine15.3 ± 12.4
Histidine1.5 ± 0.7
Isoleucine5.9 ± 0.6
Leucine10.9 ± 2.4
Lysine3.1 ± 0.7
Methiononine1.6 ± 1.8
Phenyalanine8.8 ± 0.6
Proline15.3 ± 5.1
Serine9.4 ± 7.3
Threonine4.9 ± 2.8
Tryptophane0.5 ± 0.4
Tyrosine3.2 ± 1.8
Valine7.9 ± 1.2
Afalatoxins and Mycotoxins (μg/kg)
Afalatoxin B1<0.5 *
Afalatoxin B2<0.5 *
Afalatoxin G1<0.5 *
Afalatoxin G1<0.5 *
SUM of aflatoxins<2.0 *
ZON<2.0 *
DON<40 *–120
Microbiological characterisation (cfu/g)
Enterobacteriaceae<9.0 *
Campylobacter spp.ND
Salmonella spp.ND
ASFVND
* This value is the detection limit of the assay. ND: not detected.
Table 2. Formulation and nutrient composition of the diets containing bakery meal (BM20) compared with the control diet (CON).
Finishing 1 (80–123 Days)Finishing 2 (123–180 Days)
ItemsCON BM20CONBM20
Ingredient (%w/w)
Maize meal27.0025.0032.0027.00
Corn15.0013.0012.0013.00
Wheat pollard15.0010.0014.008.00
Bakery meal0.0020.000.0020.00
Wheat9.009.0010.007.00
Soya 4715.008.0014.107.10
Premix 12.002.002.002.00
Soybean oil1.201.00--
Mycotoxin Binders0.100.100.300.30
Marble powder0.800.800.800.80
Barley14.9011.1014.0014.00
Vegetable fat--0.800.80
Total100.00100.00100.00100.00
Chemical composition
Dry matter (%w/w)88.4090.1087.4090.20
Crude protein (%w/w)14.8113.4814.4913.45
Crude fibre (%w/w)4.123.594.223.57
Ether extract (%w/w)5.099.444.058.51
Crude ash (%w/w)3.273.373.253.33
Gross energy (Mj/kg)15.6616.3715.6716.53
Metabolisable energy (Mj/kg)12.5413.2712.5213.48
1 Premix contains (per kg of product): Vitamin A, 260,000 IU; vitamin D3, 80,000 IU; vitamin E, 2400 mg; vitamin K3, 120 mg; vitamin B1, 80 mg; vitamin B2, 280 mg; pantothenic acid, 400 mg; vitamin B6, 100 mg; vitamin B12, 1200 mg; niacin, 1200 mg; folate, 40.02 mg; biotin, 1.98 mg; choline chloride, 35,000 mg; iron, 4800 mg; copper, 600 mg; manganese, 2000 mg; zinc, 3200 mg; iodine, 40 mg; selenium, 8 mg; butylated hydroxytoluene, 12 mg; propyl gallate, 1 mg; citric acid, 3 mg.
Table 3. The FFP categories employed in the formulation of the BM, along with their respective mean values and standard deviations pertaining to their quality attributes.
ParameterBread IndustryBiscuit IndustryFlour MillsMarketsBakeries
Moisture (% w/w)32.7 ± 9.611.5 ± 2.56.5 ± 2.615.6 ± 4.917.8 ± 5.5
Energy (kcal/100 g)326.6 ± 56.1446.8 ± 40.5411.7 ± 40.3412.4 ± 44.2412.6 ± 45.2
Protein (% w/w)7.7 ± 2.46.0 ± 3.98.5 ± 3.27.8 ± 2.47.6 ± 2.2
Fat (% w/w)13.7 ± 9.021.3 ± 7.111.1 ± 7.517.6 ± 7.119.3 ± 7.0
Saturated fat (% w/w)5.2 ± 4.011.1 ± 4.24.4 ± 4.08.6 ± 3.99.7 ± 3.9
Carbohydrates (% w/w)43.3 ± 14.356.7 ± 8.667.1 ± 9.655.0 ± 10.152.0 ± 10.2
Sugars (% w/w)2.9 ± 2.521.1 ± 11.417.6 ± 12.717.1 ± 10.116.9 ± 9.4
Fibres (% w/w)2.2 ± 1.03.6 ± 2.36.7 ± 3.14.0 ± 2.33.4 ± 2.1
Salt (% w/w)1.1 ± 0.70.7 ± 0.30.8 ± 0.40.8 ± 0.40.8 ± 0.5
Table 4. Growth performance of the pigs fed the control and the BM20 diet. Data are presented as mean ± SE.
Dietary Treatments
CONBM20
Body weight (kg)
80 age32.25 ± 0.6332.00 ± 0.71
123 age64.10 ± 1.0860.18 ± 1.25
178 age108.76 ± 1.85106.84 ± 2.13
Feed consumption
Period 1 (80–123 age)108.30 ± 0.06 a96.98 ± 0.01 b
Period 2 (123–178 age)222.60 ± 0.03222.53 ± 0.01
Total period (80–178 age)220.60 ± 27.40213.00 ± 27.47
Average daily weight gain (kg/d)
Period 1 (80–123 age)0.94 ± 0.020.83 ± 0.02
Period 2 (123–178 age)0.83 ± 0.050.86 ± 0.03
Total period (80–178 age)0.87 ± 0.020.85 ± 0.02
FCR
Period 1 (80–123 age)3.41 ± 0.073.45 ± 0.10
Period 2 (123–178 age)5.03 ± 0.254.78 ± 0.15
Total period (80–178 age)4.33 ± 0.104.28 ± 0.11
a,b No significant differences were detected between groups (p > 0.05).
Table 5. The colorimetric characteristics, lightness L*, red index a*, and yellow index b* of pigs fed the control and the diet containing BM20. Data are presented as mean ± SE.
ParameterGroupT0T1T2Group Meanp
GroupTimeGroup × Time
L*CON59.333 ± 3.50361.183 ± 3.50362.556 ± 3.50361.024 ± 2.0220.6540.1980.643
BM2055.479 ± 3.50358.732 ± 3.50364.997 ± 3.50359.736 ± 2.022
Time mean57.406 ± 2.47759.958 ± 2.47763.776 ± 2.477
a*CON44.467 ± 3.61538.123 ± 3.61530.677 ± 3.61537.756 ± 2.087 a0.0280.0030.968
BM2036.732 ± 3.61532.107 ± 3.61524.378 ± 3.61531.072 ± 2.087 b
Time mean40.599 ± 2.556 A35.115 ± 2.556 AB27.527 ± 2.556 B
b*CON29.538 ± 3.19627.180 ± 3.19624.439 ± 3.19627.052 ± 1.8450.2130.6440.802
BM2024.367 ± 3.19623.450 ± 3.19623.451 ± 3.19623.756 ± 1.845
Time mean26.952 ± 2.26025.315 ± 2.26023.945 ± 2.260
A,B means within rows differ significantly (p < 0.05). a,b means values within columns differ significantly (p < 0.05).
Table 6. Lipid oxidative analysis of the pigs’ meat between the control group and diet supplemented with BM20. Data are presented as mean ± SE.
ParameterGroupT0T1T2Group Meanp
GroupTimeGroup × Time
MDACON0.135 ± 0.003 A0.140 ± 0.003 A0.159 ± 0.003 B0.145 ± 0.0010.957<0.0010.666
BM200.137 ± 0.003 A0.140 ± 0.003 A0.157 ± 0.003 B0.145 ± 0.001
Time mean0.136 ± 0.002 A0.140 ± 0.002 A0.158 ± 0.002 B
A,B means within rows differ significantly (p < 0.05).
Table 7. Protein and fat content in the meat of the pigs between the control group and diet supplemented with 20% of BM. Data are presented as mean ± SE.
Dietary Treatments
CONBM20
Fat (%)16.55 ± 2.7610.92 ± 3.00
Proteins (%)17.00 ± 0.41 a11.48 ± 2.72 b
pH5.71 ± 0.055.76 ± 0.02
a,b Means within a row that differ significantly (p < 0.05).
Table 8. The effect of BM supplementation on the pig meat FA composition and health lipid indices. Data are presented as mean ± SE.
Dietary Treatments
CONBM20
MUFA7.327 ± 1.1137.540 ± 0.438
PUFA1.700 ± 0.2921.738 ± 0.122
SFA7.616 ± 1.3607.829 ± 0.447
PUFA/SFA0.227 ± 0.0120.222 ± 0.010
PUFA n62.096 ± 0.585 a1.506 ± 0.111 b
PUFA n30.152 ± 0.0250.171 ± 0.012
PUFA n6/PUFA n315.918 ± 5.9588.845 ± 0.385
AI0.860 ± 0.0600.917 ± 0.019
TI1.427 ± 0.0981.501 ± 0.033
h/H12.467 ± 2.31713.433 ± 0.768
Fatty acids
Butyric acid (C4:0)NDND
Caproic acid (C6:0)NDND
Caprylic acid (C8:0)NDND
Capric acid (C10:0)0.006 ± 0.0020.008 ± 0.002
Undecanoic acid (C11:0)NDND
Lauric acid (C12:0)0.004 ± 0.0030.014 ± 0.002
Tridecanoic acid (C13:0)NDND
Myristic acid (C14:0)0.228 ± 0.0420.239 ± 0.017
Myristoleic acid (C14:1)NDND
Pentadecanoic acid (C15:0)0.001 ± 0.0010.001 ± 0.001
Cis-10-Pentadecenoic acid (C15:1)NDND
Palmitoleic acid (C16:1)0.324 ± 0.0500.302 ± 0.027
Heptadecanoic acid (C17:0)0.050 ± 0.0100.050 ± 0.005
Cis-10-Heptadecenoic acid (C17:1)0.038 ± 0.0080.036 ± 0.004
Stearic acid (C18:0)2.772 ± 0.5132.882 ± 0.173
Palmitic acid (C16:0)4.510 ± 0.7904.600 ± 0.266
Elaidic acid (C18:1n9t)0.010 ± 0.0030.007 ± 0.002
Oleic acid (C18:1n9c)6.326 ± 1.3037.172 ± 0.413
Linolelaidic acid (C18:2n6t)0.607 ± 0.607ND
Linoleic acid (C18:2n6c)1.489 ± 0.2581.503 ± 0.110
Arachidic acid (C20:0)0.028 ± 0.0070.028 ± 0.004
γ-Linolenic acid (C18:3n6)NDND
Cis-11-Eicosenoic (C20:1)0.024 ± 0.0040.023 ± 0.002
Linolenic acid (C18:3n3)0.142 ± 0.0260.156 ± 0.010
Heneicosanoic acid (C21:0)NDND
Cis-11,14-Eicosadienoic acid (C20:2)0.057 ± 0.0100.054 ± 0.008
Behenic acid (C22:0)NDND
Cis-8,11,14-Eicosadienoic (C20:3n6)ND0.002 ± 0.001
Erucic acid (C22:1n9)0.010 ± 0.0040.016 ± 0.002
Cis-11,14,17-Eicosatrienoic acid (C20:3n3)NDND
Arachidonic acid (C20:4n6)NDND
Tricosanoic acid (C23:0)NDND
Cis-13,16-Docosadienoic acid (C22:2)NDND
Cis-5,8,11,14,17-Eicosapentaenoic acid (C20:5n3)NDND
Lignoceric acid (C24:0)NDND
Nervonic acid (C24:1)NDND
Cis-4,7,10,13,16,19-Docosahexaenoic acid <0,01(C22:6n3)NDND
a,b Means within a row with different superscripts differ significantly (p < 0.05), ND: Not Detected, AI: Atherogenic Index, TI: Thrombogenic Index, h/H: hypocholesterolemic (h)/hypercholesterolemic (H) fatty acids.
Table 9. Data for the statistical means and variability for the pig meat evaluation.
Sensory Characteristics
TendernessJuicinessAromaTasteColourOverall Acceptance
CON3.42 ± 0.013.30 ± 0.113.25 ± 0.123.47 ± 0.103.27 ± 0.10 a3.48 ± 0.10
BM203.42 ± 0.123.11 ± 0.113.28 ± 0.103.59 ± 0.113.72 ± 0.11 b3.62 ± 0.10
a,b Means within a column that differ significantly (p < 0.05). All values are expressed as mean ± S.D.
Table 10. Results of linear regression for relationships with pig meat overall acceptance.
b 1p 2
R2 = 0.528
Tenderness0.0340.604
Juiciness0.300<0.001
Aroma0.231<0.001
Taste0.267<0.001
Colour0.213<0.001
1 Standardised partial coefficient of linear regression; 2 p-value based on linear regression analysis.
Disclaimer/Publisher’s Note: The statements, opinions and data contained in all publications are solely those of the individual author(s) and contributor(s) and not of MDPI and/or the editor(s). MDPI and/or the editor(s) disclaim responsibility for any injury to people or property resulting from any ideas, methods, instructions or products referred to in the content.

