
Life Cycle Assessment of Winter Wheat Production Using Precision and Conventional Seeding Technologies

 ,
,  ,
,  ,
,  ,
, 
 and
and
Abstract
:1. Introduction
2. Materials and Methods
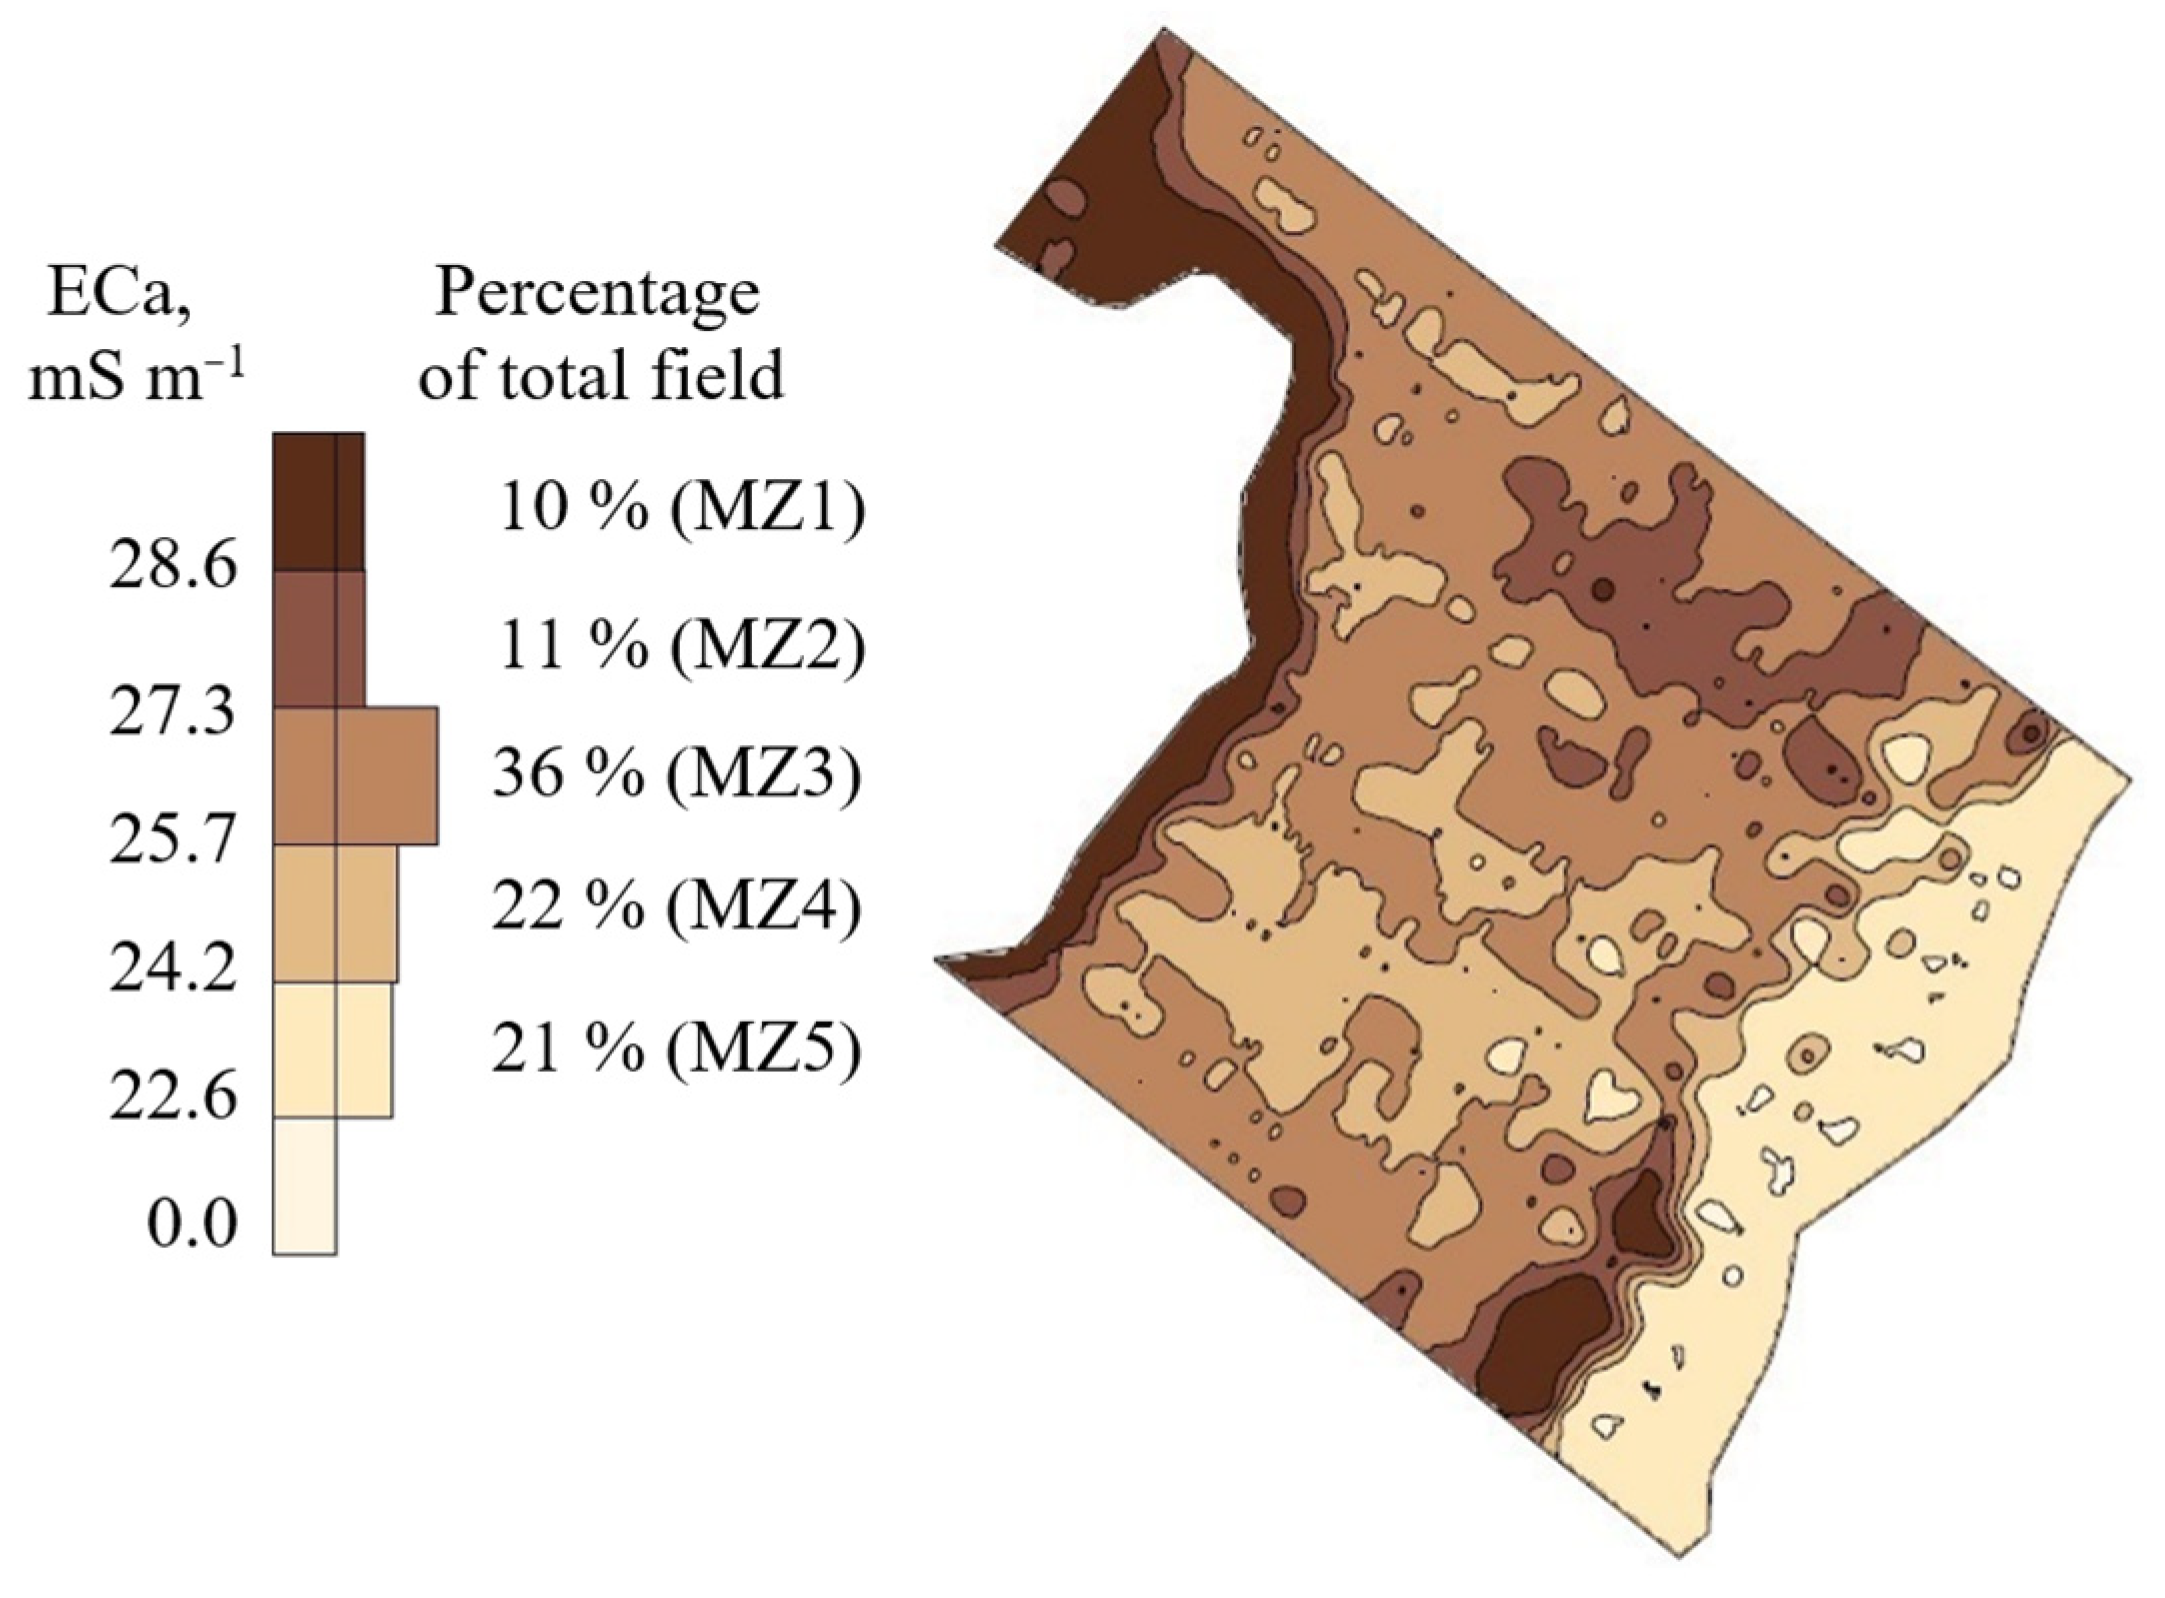
2.1. Experimental Research Site and Design
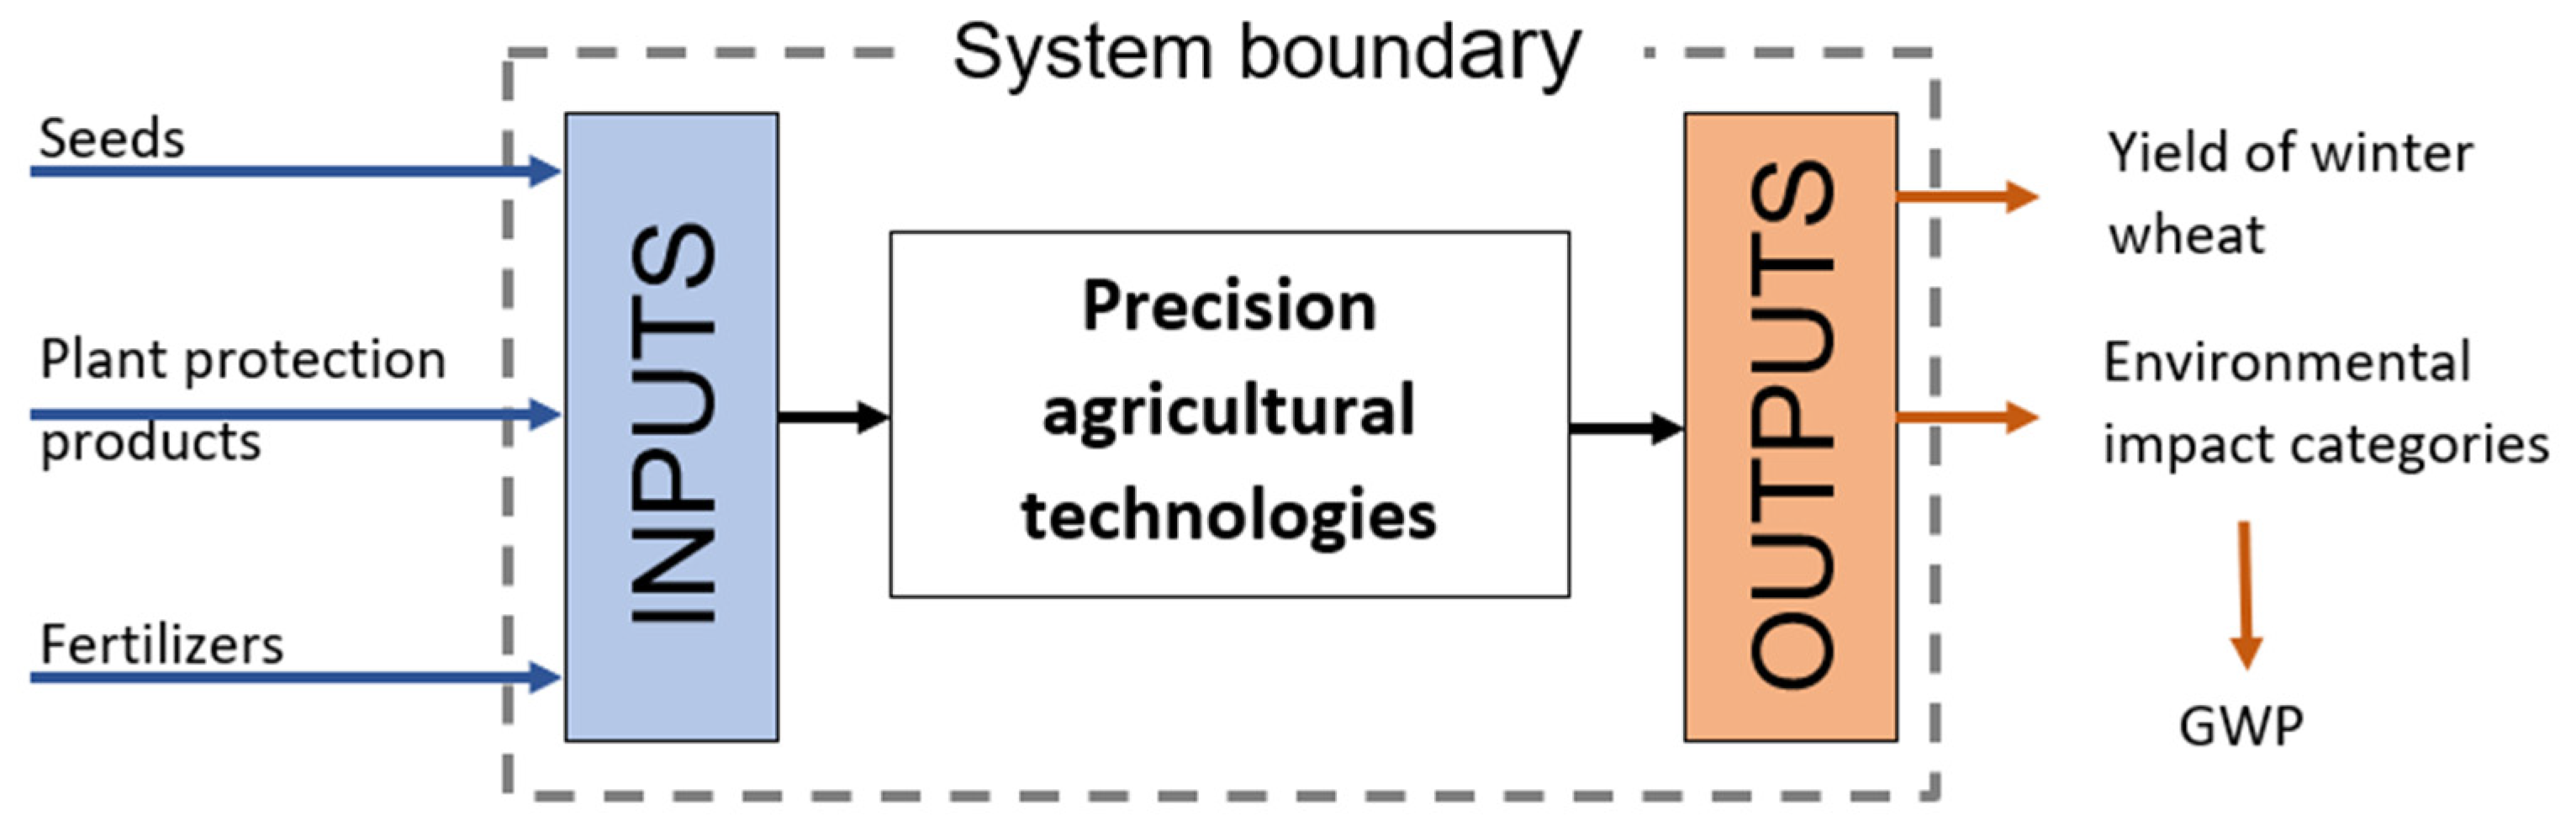
2.2. Life Cycle Assessment
2.3. Statistical Analysis
3. Results
3.1. Grain Yield
3.2. The Effect of Winter Wheat Production on Impact Categories
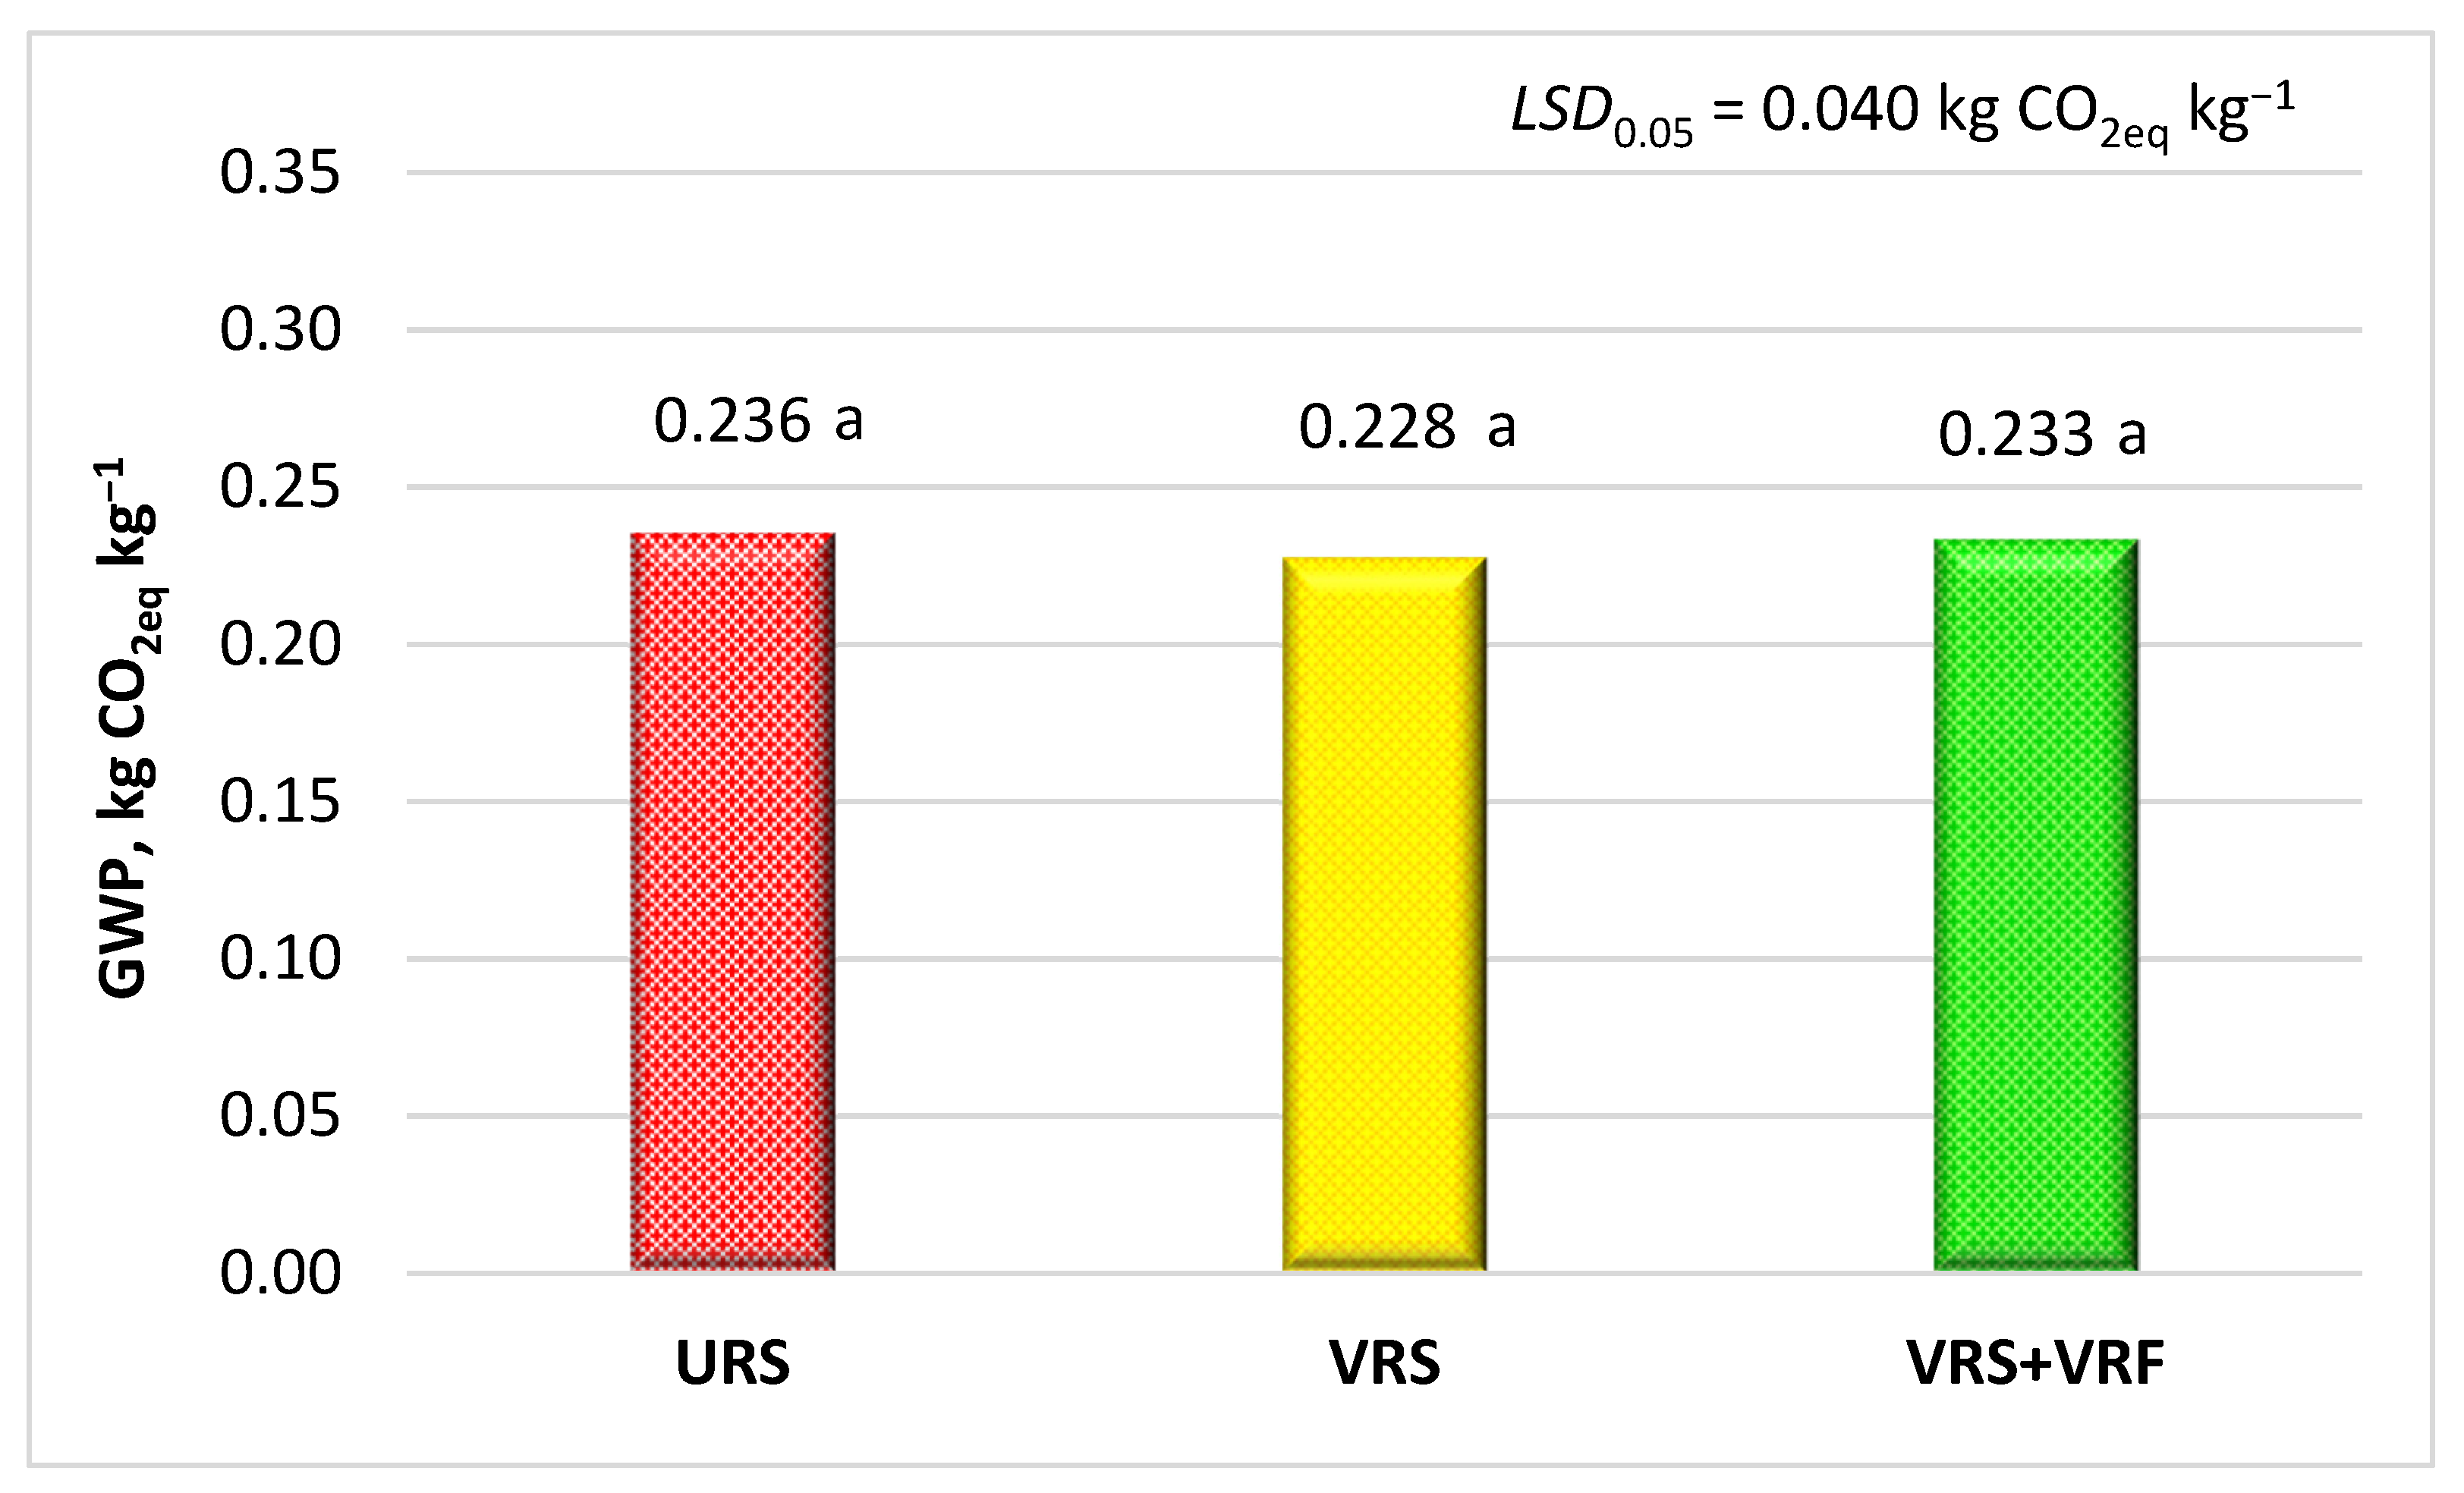
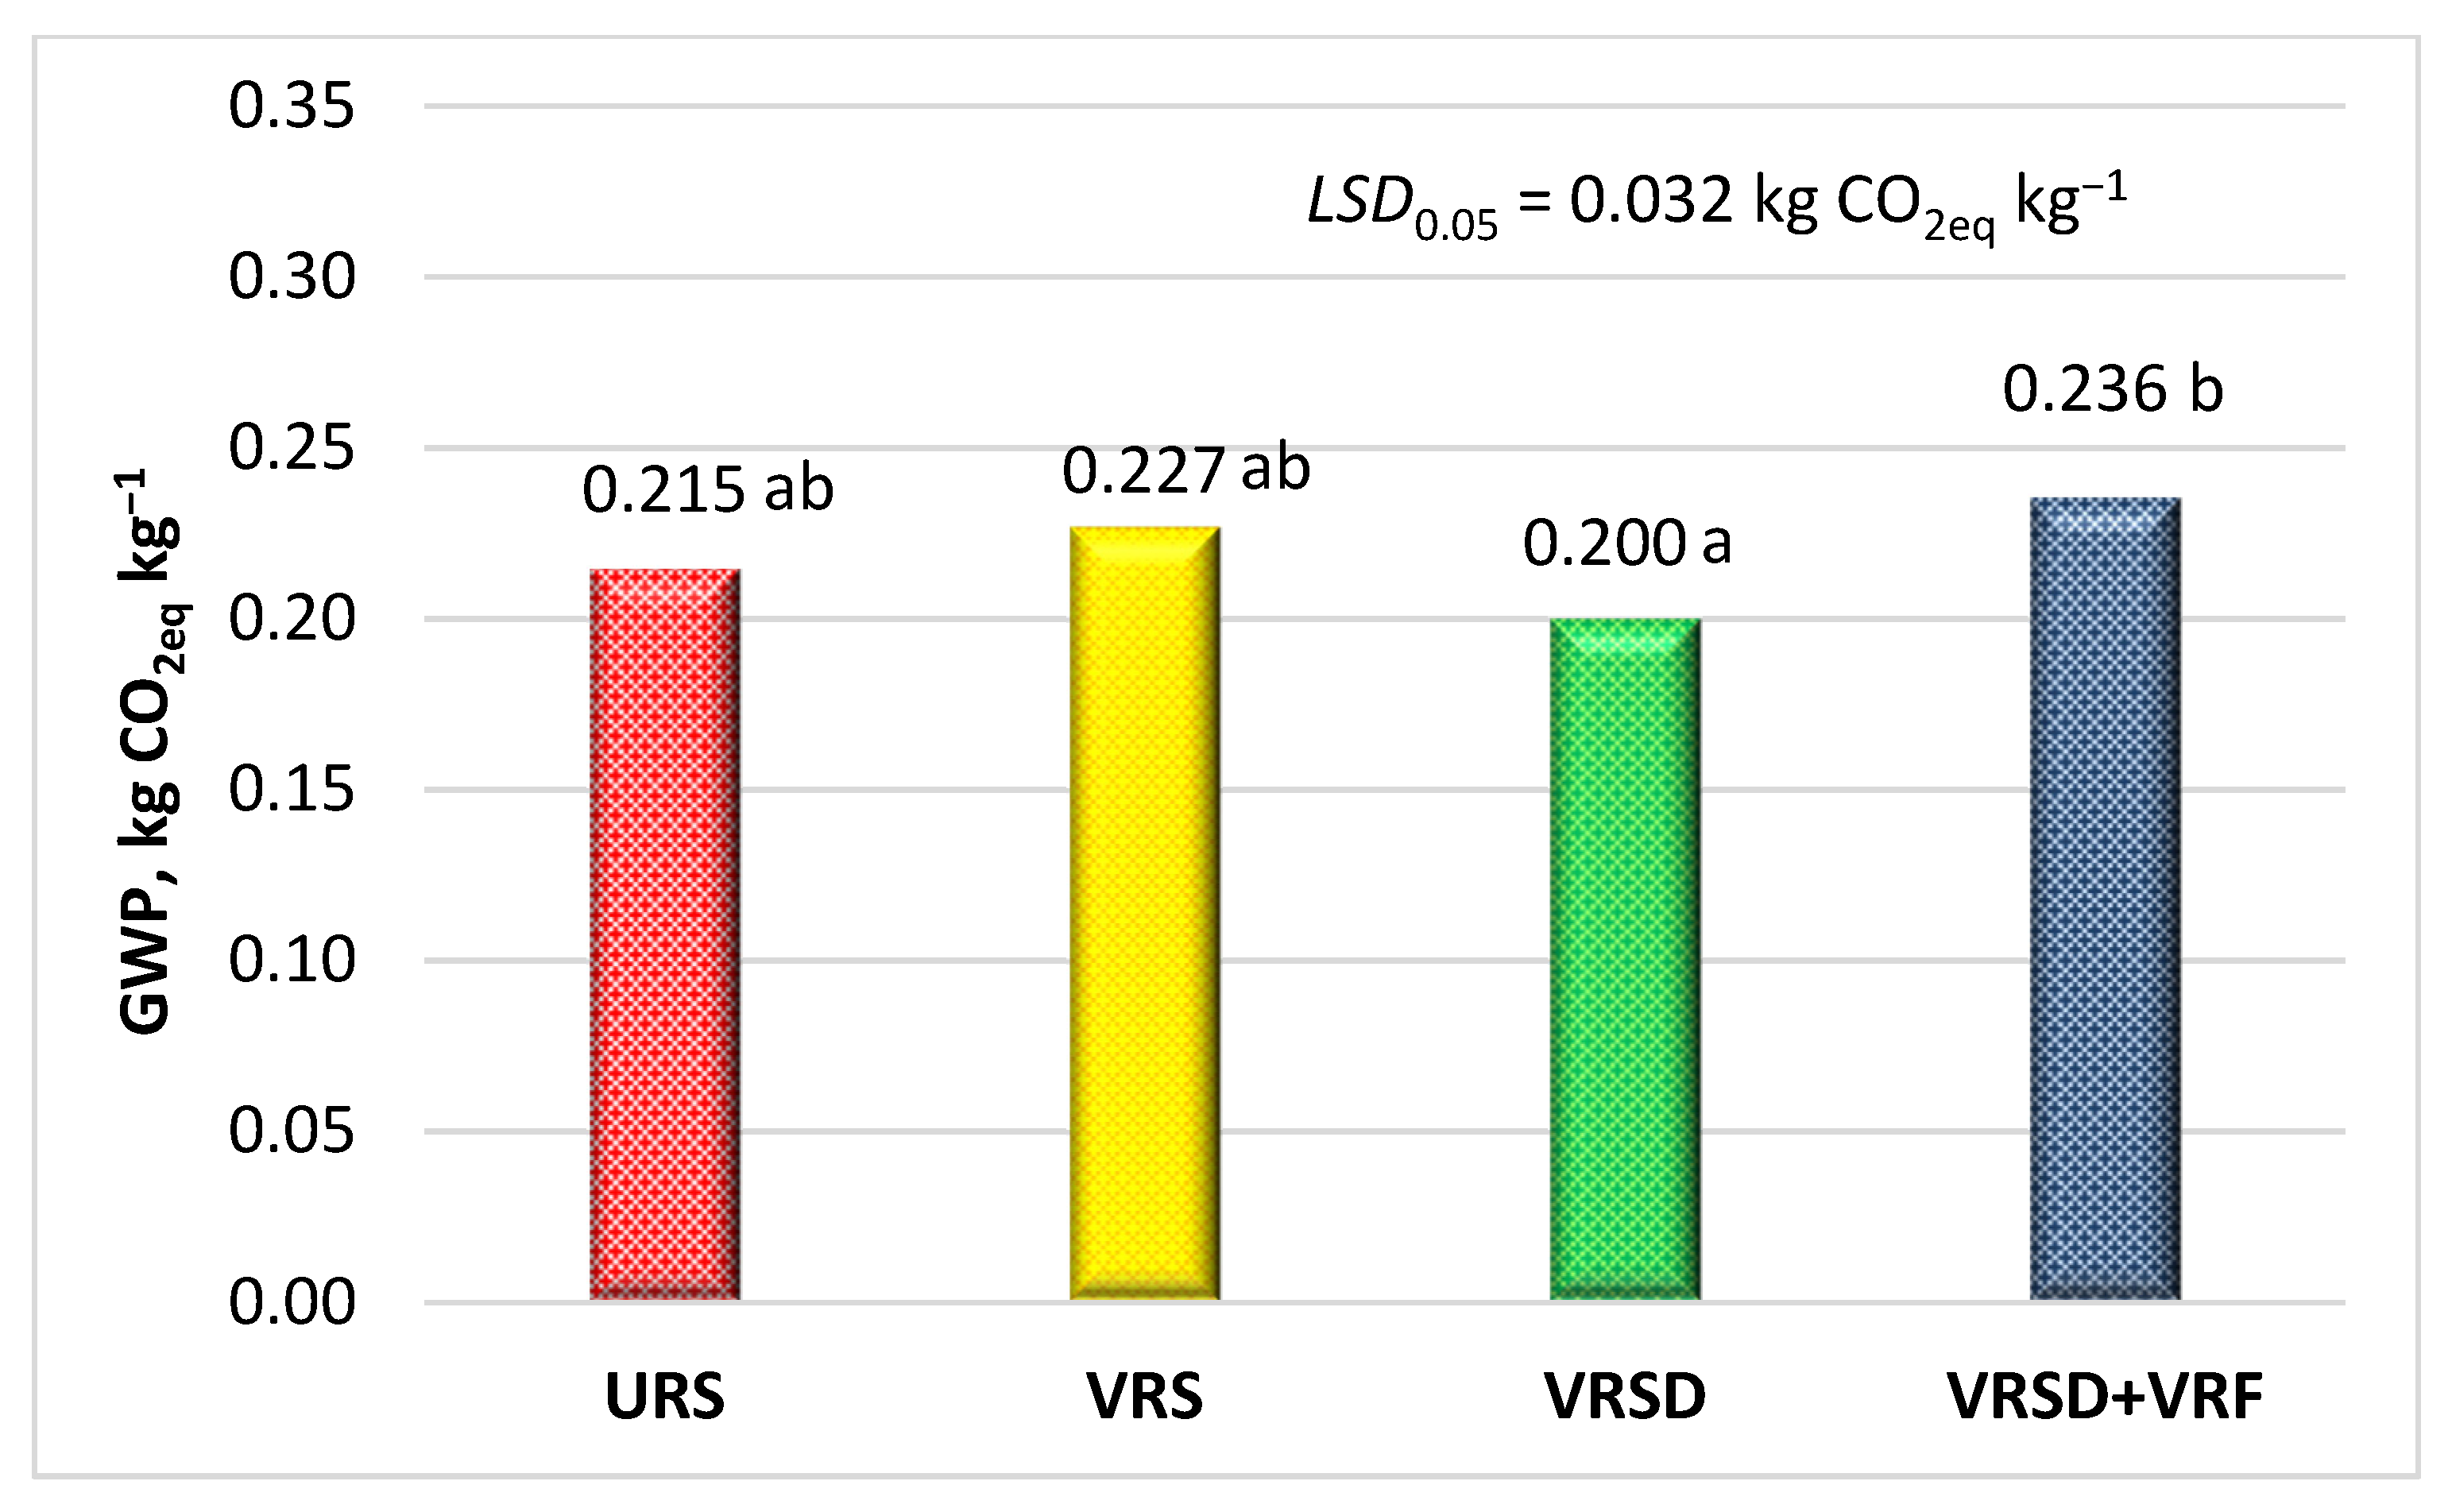
3.3. The Impact of Winter Wheat Production on GWP
4. Discussion
4.1. Grain Yield
4.2. The Effect of Winter Wheat Production on Impact Categories
4.3. The Impact of Winter Wheat Production on GWP
5. Conclusions
Author Contributions
Funding
Institutional Review Board Statement
Informed Consent Statement
Data Availability Statement
Conflicts of Interest
References
- Nabavi-Pelesaraei, A.; Hosseinzadeh-Bandbafha, H.; Qasemi-Kordkheili, P.; Kouchaki-Penchah, H.; Riahi-Dorcheh, F. Applying optimization techniques to improve of energy efficiency and GHG (greenhouse gas) emissions of wheat production. Energy 2016, 103, 672–678. [Google Scholar] [CrossRef]
- Pishgar-Komleh, S.H.; Zylowski, T.; Rozakis, S.; Kozyra, J. Efficiency under different methods for incorporating undesirable outputs in an LCA+ DEA framework: A case study of winter wheat production in Poland. J. Environ. Manag. 2020, 260, 110138. [Google Scholar] [CrossRef] [PubMed]
- Saldukaitė-Sribikė, L.; Šarauskis, E.; Buragienė, S.; Adamavičienė, A.; Velička, R.; Kriaučiūnienė, Z.; Savickas, D. Effect of Tillage and sowing technologies nexus on winter wheat production in terms of yield, energy, and environment impact. Agronomy 2022, 12, 2713. [Google Scholar] [CrossRef]
- Saleem, S.R.; Levison, J.; Haroon, Z. Environment: Role of precision agriculture technologies. In Precision Agriculture: Evolution, Insights and Emerging Trends; Zaman, Q., Ed.; Academic Press: Cambridge, MA, USA, 2023; pp. 211–229. [Google Scholar]
- Fabiani, S.; Vanino, S.; Napoli, R.; Zajíček, A.; Duffková, R.; Evangelou, E.; Nino, P. Assessment of the economic and environmental sustainability of Variable Rate Technology (VRT) application in different wheat intensive European agricultural areas. A Water energy food nexus approach. Environ. Sci. Policy 2020, 114, 366–376. [Google Scholar] [CrossRef]
- Munnaf, M.A.; Haesaert, G.; Van Meirvenne, M.; Mouazen, A.M. Site-specific seeding using multi-sensor and data fusion techniques: A review. Adv. Agron. 2020, 161, 241–323. [Google Scholar]
- Šarauskis, E.; Kazlauskas, M.; Naujokienė, V.; Bručienė, I.; Steponavičius, D.; Romaneckas, K.; Jasinskas, A. Variable rate seeding in precision agriculture: Recent advances and future perspectives. Agriculture 2022, 12, 305. [Google Scholar] [CrossRef]
- Nawar, S.; Corstanje, R.; Halcro, G.; Mulla, D.; Mouazen, A.M. Delineation of soil management zones for variable-rate fertilization: A review. Adv. Agron. 2017, 143, 175–245. [Google Scholar]
- Medel-Jiménez, F.; Piringer, G.; Gronauer, A.; Barta, N.; Neugschwandtner, R.W.; Krexner, T.; Kral, I. Modelling soil emissions and precision agriculture in fertilization life cycle assessment-A case study of wheat production in Austria. J. Clean. Prod. 2022, 380, 134841. [Google Scholar] [CrossRef]
- Zecevic, V.; Boskovic, J.; Knezevic, D.; Micanovic, D. Effect of seeding rate on grain quality of winter wheat. Chil. J. Agric. Res. 2014, 74, 23–28. [Google Scholar] [CrossRef]
- Munnaf, M.A.; Haesaert, G.; Mouazen, A.M. Site-specific seeding for maize production using management zone maps delineated with multi-sensors data fusion scheme. Soil Tillage Res. 2022, 220, 105377. [Google Scholar] [CrossRef]
- Munnaf, M.A.; Haesaert, G.; Mouazen, A.M. Map-based site-specific seeding of seed potato production by fusion of proximal and remote sensing data. Soil Tillage Res. 2021, 206, 104801. [Google Scholar] [CrossRef]
- da Silva, E.E.; Baio, F.H.R.; Teodoro, L.P.R.; Campos, C.N.S.; Plaster, O.B.; Teodoro, P.E. Variable-rate seeding in soybean according to soil attributes related to grain yield. Precis. Agric. 2022, 23, 35–51. [Google Scholar] [CrossRef]
- Roy, P.; Nei, D.; Orikasa, T.; Xu, Q.; Okadome, H.; Nakamura, N.; Shiina, T. A review of life cycle assessment (LCA) on some food products. J. Food Eng. 2009, 90, 1–10. [Google Scholar] [CrossRef]
- Skowrońska, M.; Filipek, T. Life cycle assessment of fertilizers: A review. Int. Agrophysics 2014, 28, 101–110. [Google Scholar] [CrossRef]
- Finnveden, G.; Hauschild, M.Z.; Ekvall, T.; Guinée, J.; Heijungs, R.; Hellweg, S.; Koehler, A.; Pennington, D.; Suh, S. Recent developments in life cycle assessment. J. Environ. Manag. 2009, 91, 1–21. [Google Scholar] [CrossRef]
- Arvanitoyannis, I.S. ISO 14040: Life cycle assessment (LCA)—Principles and guidelines. In Waste Management for the Food Industries; Academic Press: Cambridge, MA, USA, 2008; pp. 97–132. [Google Scholar]
- Finkbeiner, M.; Inaba, A.; Tan, R.; Christiansen, K.; Klüppel, H.J. The new international standards for life cycle assessment: ISO 14040 and ISO 14044. Int. J. Life Cycle Assess. 2006, 11, 80–85. [Google Scholar] [CrossRef]
- Wernet, G.; Bauer, C.; Steubing, B.; Reinhard, J.; Moreno-Ruiz, E.; Weidema, B. The Ecoinvent Database Version 3 (Part I): Overview and Methodology. Int. J. Life Cycle Assess. 2016, 21, 1218–1230. [Google Scholar] [CrossRef]
- Costa, C., Jr.; Wironen, M.; Racette, K.; Wollenberg, E.K. Global Warming Potential (GWP): Understanding the Implications for Mitigating Methane Emissions in Agriculture. CCAFS Info Note. Wageningen, The Netherlands: CGIAR Research Program on Climate Change, Agriculture and Food Security (CCAFS). 2021. Available online: https://hdl.handle.net/10568/114632 (accessed on 4 September 2023).
- Griffin, S.; Hollis, J. Using profile soil electrical conductivity survey data to predict wheat establishment rates in the United Kingdom. In Precision Agriculture’13; Stafford, J., Ed.; Wageningen Academic Publishers: Wageningen, The Netherlands, 2013; pp. 491–497. [Google Scholar]
- Bhatta, M.; Eskridge, K.M.; Rose, D.J.; Santra, D.K.; Baenziger, P.S.; Regassa, T. Seeding rate, genotype, and topdressed nitrogen effects on yield and agronomic characteristics of winter wheat. Crop Sci. 2017, 57, 951–963. [Google Scholar] [CrossRef]
- Iqbal, J.; Hayat, K.; Hussain, S.; Ali, A.; Bakhsh, M.A.A.H.A. Effect of seeding rates and nitrogen levels on yield and yield components of wheat (Triticum aestivum L.). Pak. J. Nutr. 2012, 11, 531–536. [Google Scholar] [CrossRef]
- Wang, Z.; Khan, S.; Sun, M.; Ren, A.; Lin, W.; Ding, P.; Noor, H.; Feng, Y.; Wang, Q.; Gao, Z. Optimizing the wheat seeding rate for wide-space sowing to improve yield and water and nitrogen utilization. Int. J. Plant Prod. 2021, 15, 553–562. [Google Scholar] [CrossRef]
- Taki, M.; Soheili-Fard, F.; Rohani, A.; Chen, G.; Yildizhan, H. Life cycle assessment to compare the environmental impacts of different wheat production systems. J. Clean. Prod. 2018, 197, 195–207. [Google Scholar] [CrossRef]
- Van Oers, L.; Guinée, J. The abiotic depletion potential: Background, updates, and future. Resources 2016, 5, 16. [Google Scholar] [CrossRef]
- Li, X.; Mupondwa, E.; Panigrahi, S.; Tabil, L.; Adapa, P. Life cycle assessment of densified wheat straw pellets in the Canadian Prairies. Int. J. Life Cycle Assess. 2012, 17, 420–431. [Google Scholar] [CrossRef]
- Charles, R.; Jolliet, O.; Gaillard, G.; Pellet, D. Environmental analysis of intensity level in wheat crop production using life cycle assessment. Agric. Ecosyst. Environ. 2006, 113, 216–225. [Google Scholar] [CrossRef]
- Ghasemi-Mobtaker, H.; Kaab, A.; Rafiee, S. Application of life cycle analysis to assess environmental sustainability of wheat cultivation in the west of Iran. Energy 2020, 193, 116768. [Google Scholar] [CrossRef]
- Holka, M.; Bieńkowski, J. Assessment of environmental burdens of winter wheat production in different agrotechnical systems. Agronomy 2020, 10, 1303. [Google Scholar] [CrossRef]
- Naujokienė, V.; Šarauskis, E.; Bleizgys, R.; Sasnauskienė, J. Soil biotreatment effectiveness for reducing global warming potential from main polluting tillage operations in life cycle assessment phase. Sci. Total Environ. 2019, 671, 805–817. [Google Scholar] [CrossRef]
- Houshyar, E.; Grundmann, P. Environmental impacts of energy use in wheat tillage systems: A comparative life cycle assessment (LCA) study in Iran. Energy 2017, 122, 11–24. [Google Scholar] [CrossRef]

| Items | URS | VRS | VRS + VRF |
|---|---|---|---|
| Inputs | |||
| Winter wheat seed, kg ha−1 | 180.0 | 185.0 | 182.7 |
| Phosphorus pentoxide (P2O5), kg ha−1 | 91.0 | 91.0 | 90.6 |
| Potassium oxide (K2O), kg ha−1 | 54.0 | 54.0 | 49.7 |
| Nitrogen (N), kg ha−1 | 180.0 | 180.0 | 188.6 |
| Growth regulator, L ha−1 | 1.10 | 1.10 | 1.08 |
| Fungicide, L ha−1 | 1.75 | 1.75 | 1.72 |
| Items | URS | VRS | VRSD | VRSD + VRF |
|---|---|---|---|---|
| Inputs | ||||
| Winter wheat seed, kg ha−1 | 162.0 | 166.9 | 162.2 | 168.6 |
| Phosphorus pentoxide (P2O5), kg ha−1 | 91.0 | 91.0 | 91.0 | 89.7 |
| Potassium oxide (K2O), kg ha−1 | 54.0 | 54.0 | 54.0 | 51.6 |
| Nitrogen (N), kg ha−1 | 180.0 | 180.0 | 180.0 | 189.8 |
| Growth regulator, L ha−1 | 1.40 | 1.40 | 1.40 | 1.35 |
| Fungicide, L ha−1 | 1.55 | 1.55 | 1.55 | 1.51 |
| Impact Category | Abbreviation | Unit |
|---|---|---|
| Marine aquatic ecotoxicity | MAE | kg 1,4-DBeq |
| Abiotic depletion (fossil fuels) | ADf | MJ |
| Global warming potential | GWP | kg CO2eq |
| Freshwater aquatic ecotoxicity | FWAe | kg 1,4-DBeq |
| Human toxicity | HT | kg 1,4-DBeq |
| Terrestrial ecotoxicity | TE | kg 1,4-DBeq |
| Eutrophication | ET | kg eq |
| Acidification | ACD | kg SO2eq |
| Photochemical oxidation | PO | kg C2H4eq |
| Abiotic depletion | ADn | kg Sbeq |
| Ozone layer depletion | ODP | kg CFC-11eq |
| Year of the Experiment | Precision Agriculture Technologies | Winter Wheat Grain Yield, kg ha−1 |
|---|---|---|
| First year (2020–2021) | URS | 7482.3 a |
| VRS | 7782.2 a | |
| VRS + VRF | 7773.8 a | |
| LSD0.05 | 1028.2 | |
| Second year (2021–2022) | URS | 8178.6 ab |
| VRS | 7785.1 ab | |
| VRSD | 8744.1 a | |
| VRSD + VRF | 7593.8 b | |
| LSD0.05 | 1085.1 |
| Impact Category | Abbreviation | Unit | URS | VRS | VRS + VRF |
|---|---|---|---|---|---|
| Abiotic depletion | ADn | kg Sbeq | 3.741 × 10⁻⁶ | 3.616 × 10⁻⁶ | 3.700 × 10⁻⁶ |
| Abiotic depletion (fossil fuels) | ADf | MJ | 2.686 | 2.595 | 2.671 |
| Ozone layer depletion | ODP | kg CFC-11eq | 1.244 × 10⁻⁸ | 1.204 × 10⁻⁸ | 1.233 × 10⁻⁸ |
| Human toxicity | HT | kg 1,4-DBeq | 0.176 | 0.170 | 0.174 |
| Freshwater aquatic ecotoxicity | FWAe | kg 1,4-DBeq | 0.176 | 0.170 | 0.171 |
| Marine aquatic ecotoxicity | MAE | kg 1,4-DBeq | 231.865 | 224.065 | 229.733 |
| Terrestrial ecotoxicity | TE | kg 1,4-DBeq | 1.484 × 10⁻³ | 1.451 × 10⁻³ | 1.444 × 10⁻³ |
| Photochemical oxidation | PO | kg C2H4eq | 3.512 × 10⁻⁵ | 3.396 × 10⁻⁵ | 3.485 × 10⁻⁵ |
| Acidification | ACD | kg SO2eq | 1.140 × 10⁻³ | 1.105 × 10⁻³ | 1.129 × 10⁻³ |
| Eutrophication | ET | eq | 4.812 × 10⁻⁴ | 4.684 × 10⁻⁴ | 4.755 × 10⁻⁴ |
| Impact Category | Abbreviation | Unit | URS | VRS | VRSD | VRSD + VRF |
|---|---|---|---|---|---|---|
| Abiotic depletion | ADn | kg Sbeq | 3.404 × 10⁻⁶ | 3.596 × 10⁻⁶ | 3.172 × 10⁻⁶ | 3.725 × 10⁻⁶ |
| Abiotic depletion (fossil fuels) | ADf | MJ | 2.455 | 2.592 | 2.288 | 2.705 |
| Ozone layer depletion | ODP | kg CFC-11eq | 1.138 × 10⁻⁸ | 1.203 × 10⁻⁸ | 1.060 × 10⁻⁸ | 1.249 × 10⁻⁸ |
| Human toxicity | HT | kg 1,4-DBeq | 0.159 | 0.168 | 0.148 | 0.174 |
| Freshwater aquatic ecotoxicity | FWAe | kg 1,4-DBeq | 0.154 | 0.163 | 0.143 | 0.167 |
| Marine aquatic ecotoxicity | MAE | kg 1,4-DBeq | 210.943 | 222.816 | 196.570 | 231.318 |
| Terrestrial ecotoxicity | TE | kg 1,4-DBeq | 1.245 × 10⁻³ | 1.334 × 10⁻³ | 1.161 × 10⁻³ | 1.358 × 10⁻³ |
| Photochemical oxidation | PO | kg C2H4eq | 3.208 × 10⁻⁵ | 3.390 × 10⁻⁵ | 2.989 × 10⁻⁵ | 3.526 × 10⁻⁵ |
| Acidification | ACD | kg SO2eq | 1.030 × 10⁻³ | 1.092 × 10⁻³ | 0.960 × 10⁻³ | 1.131 × 10⁻³ |
| Eutrophication | ET | eq | 4.266 × 10⁻⁴ | 4.542 × 10⁻⁴ | 3.976 × 10⁻⁴ | 4.700 × 10⁻⁴ |
Disclaimer/Publisher’s Note: The statements, opinions and data contained in all publications are solely those of the individual author(s) and contributor(s) and not of MDPI and/or the editor(s). MDPI and/or the editor(s) disclaim responsibility for any injury to people or property resulting from any ideas, methods, instructions or products referred to in the content. |
© 2023 by the authors. Licensee MDPI, Basel, Switzerland. This article is an open access article distributed under the terms and conditions of the Creative Commons Attribution (CC BY) license (https://creativecommons.org/licenses/by/4.0/).
Share and Cite
Kazlauskas, M.; Bručienė, I.; Savickas, D.; Naujokienė, V.; Buragienė, S.; Steponavičius, D.; Romaneckas, K.; Šarauskis, E. Life Cycle Assessment of Winter Wheat Production Using Precision and Conventional Seeding Technologies. Sustainability 2023, 15, 14376. https://doi.org/10.3390/su151914376
Kazlauskas M, Bručienė I, Savickas D, Naujokienė V, Buragienė S, Steponavičius D, Romaneckas K, Šarauskis E. Life Cycle Assessment of Winter Wheat Production Using Precision and Conventional Seeding Technologies. Sustainability. 2023; 15(19):14376. https://doi.org/10.3390/su151914376
Chicago/Turabian StyleKazlauskas, Marius, Indrė Bručienė, Dainius Savickas, Vilma Naujokienė, Sidona Buragienė, Dainius Steponavičius, Kęstutis Romaneckas, and Egidijus Šarauskis. 2023. "Life Cycle Assessment of Winter Wheat Production Using Precision and Conventional Seeding Technologies" Sustainability 15, no. 19: 14376. https://doi.org/10.3390/su151914376
APA StyleKazlauskas, M., Bručienė, I., Savickas, D., Naujokienė, V., Buragienė, S., Steponavičius, D., Romaneckas, K., & Šarauskis, E. (2023). Life Cycle Assessment of Winter Wheat Production Using Precision and Conventional Seeding Technologies. Sustainability, 15(19), 14376. https://doi.org/10.3390/su151914376