Article

Techno-Economic Feasibility Study for Organic and Plastic Waste Pyrolysis Pilot Plant in Malaysia

1
NexantECA (MY) Sdn Bhd, Mid Valley City, Kuala Lumpur 59200, Malaysia
2
Institute of Sustainable Energy (ISE), Universiti Tenaga Nasional, Jalan Ikram-UNITEN, Kajang 43000, Selangor, Malaysia
*
Author to whom correspondence should be addressed.
Sustainability 2023, 15(19), 14280; https://doi.org/10.3390/su151914280
Submission received: 4 July 2023 / Revised: 18 August 2023 / Accepted: 21 August 2023 / Published: 27 September 2023

Abstract

:
Organic and plastic waste (OPW) is diverted from landfills in order to lower carbon emissions. Nevertheless, modern pyrolysis techniques are frequently utilized in laboratories (using feedstocks that weigh less than 1 kg), which employ costly pure nitrogen gas (N2). This study developed a fast pyrolysis system to produce pyrolysis oil or liquid (PyOL) from OPW using flue gas as the pyrolysis agent. The added benefits included the efficient value-added chemical extractions and the non-thermal plasma reactor upgraded PyOL. OPW was also pyrolyzed at a pilot scale using flue gas fast pyrolysis in this study. In addition to lowering operational expenses associated with pure N2, flue gas reduced the lifecycle carbon emissions to create PyOL. The results indicated that considerable material agglomeration occurred during the OPW pyrolysis with an organic-to-plastic-waste (O/P) ratio of 30/70. Furthermore, the liquid yields were 5.2% and 5.5% when O/P was 100/0 (305 °C) and 99.5/0.5 (354 °C), respectively. The liquid yields also increased when polymers (polypropylene) were added, enhancing the aromatics. Two cases were employed to study their techno-economic feasibility: PyOL-based production and chemical-extraction plants. The mitigated CO2 from the redirected OPW and flue gas produced the highest revenue in terms of carbon credits. Moreover, the carbon price (from RM 100 to 150 per ton of CO2) was the most important factor impacting the economic viability in both cases. Plant capacities higher than 10,000 kg/h were economically viable for the PyOL-based plants, whereas capacities greater than 1000 kg/h were financially feasible for chemical-extraction plants. Overall, the study found that the pyrolysis of OPW in flue gas is a viable waste-to-energy technology. The low liquid yield is offset by the carbon credits that can be earned, making the process economically feasible.

1. Introduction

The rapid urbanization and development of Malaysia have led to the production of 42 million tons of municipal solid waste (MSW) annually. Landfills receive about 74% of MSW, which contains 40 to 60% of food waste [1]. Approximately 1.8 million tons of plastic wastes are generated each year, where large plastic waste amounts are treated or converted using processes that harm the environment. In 2019, Malaysian factories processed plastic waste without the necessary permits or environmental controls. These plastic wastes were sometimes left unutilized as factories were closed [2].
Although Malaysian economic growth is improving, MSW mismanagement is worsening and 35% of Malaysians in rural areas are still living in poverty [3]. Those who fall under urban poor category could be even higher, depending on the poverty estimation methodology [4,5]. Malaysia generates an estimated 30,000 tons of MSW daily, which could increase to 43,000 tons by 2025. Most of Malaysia’s MSW in landfills is a major environmental concern, as greenhouse gas (methane) is 25 times more potent than carbon dioxide. Both organic and plastic wastes (OPW) are included in MSW, composed of carbon-based materials utilized as feedstock to create petroleum products (liquid or pyrolysis oil).
Pyrolysis converts feedstock to liquid oil at a temperature of 300 to 600 °C in an oxygen-deficient (or low-oxygen) environment [6,7]. This process has the potential to substitute and minimizes the amount of crude oil derived from fossil sources while recovering and reducing OPW and diverting it from landfills. Pyrolysis oil consists of a complex mixture of chemical compounds, including oxygen-containing organic compounds derived from OPW. Meanwhile, biomass-based pyrolysis oil comprises cellulose, hemicellulose, and lignin components, which produce organic acids, alcohols, aldehydes, esters, phenols, ketones, and dehydrated carbohydrates [8]. Formic acid, furfural, phenol, and guaiacol are among the important chemicals that are recovered from the produced pyrolysis oil or liquid (PyOL), and their shelf prices are approximately RM 70 to 96, 56 to 303, 125 to 437 RM/L [8,9,10,11,12,13,14]. Table 1 lists the application of each chemical extracted from pyrolysis oil and its function.
Generally, the produced PyOL from agricultural wastes or lignocellulosic-based materials is not directly utilized as fuels due to several factors, including high oxygen and low energy contents [15,16]. A study by Sommani et al. reported the liquid fuel synthesis by cracking using vegetable oil (UVO/WCO) mixed with polypropylene (PP) waste, whose activated carbon was applied as a catalyst to increase the quality of the PyOL [17]. The tests were conducted in a batch reactor with a constant hydrogen pressure of 0.1 MPa. Thus, liquid fuels, such as naphthalene and gas oils, were successfully synthesized with activated carbon in the study. A UVO:PP waste ratio of 30:70 obtained the highest total liquid hydrocarbon yield of 80 wt% with selected conditions. These conditions included an activated carbon to raw material ratio of 2.5 wt%, a reaction temperature of 430 °C, and a reaction time of 30 min [17]. These conventional acid–alkali catalytic reactions also required a lengthy reaction period and numerous separation procedures [18]. Hence, the PyOL quality was improved using a novel plasma reactor to replace the traditional approach [15]. Atoms and molecules were also ionized in non-thermal plasma (NTP), producing radicals and excited species and altering the chemical bonds in the exposed matter [19,20].
This study aimed to develop a waste-to-energy fast pyrolysis system for converting OPW into PyOL, which was further applied as biofuels or value-added chemicals. Following previous studies, most pyrolysis laboratory tests were conducted using pure nitrogen (N2) or N2 mixed with a little oxygen (O2), feedstocks weighing less than 1 kg, and low heating rates of 20 °C min−1 [21,22,23]. Nevertheless, these small-scale laboratory tests did not indicate the scalability and economic viability of the pyrolysis process. Therefore, oxidative pyrolysis was performed in this study using a combination of air and flue gas for an oxygen-deficient environment. The PyOL properties were also enhanced in this study using an NTP reactor. Finally, a techno-economic feasibility (TEF) analysis was conducted to ascertain the economic viability of a commercial OPW pyrolysis plant for various processing capacities.

2. Methodology

This study aimed to evaluate the TEF (PyOL-based organic and plastic wastes) of a pilot plant in Malaysia. As oxidative pyrolysis used less energy to reach the pyrolysis temperature, using oxidative pyrolysis rather than pure N2 pyrolysis produced significant flue gas savings. Conversely, the drawback of this method was lower liquid yield. Meanwhile, the pilot-scale pyrolysis system provided the information for this study has several limitations [24]. These limitations included underestimating the raw material or energy costs and overestimating the product or service demands, which caused inaccurate profitability estimates. Changing policy and market conditions also impacted the assumptions made.

2.1. Oxidative Pyrolysis of OPW

Instead of using pure N2 for pyrolysis, oxidative pyrolysis was applied, where non-oxidative thermal degradation and heterogeneous oxidation occurred simultaneously [24]. This process was performed using air with flue gas for OPW pyrolysis. Exothermic reactions require oxygen from the air, generating heat for the endothermic pyrolysis reactions. Unlike laboratory studies, the heat for the pyrolysis process is caused by electrical heaters that are not economically viable.
Flue gas has a temperature of between 150 and 200 °C, which is generated by power plants or combustion processes. This gas is an untapped heat source for oxidative pyrolysis, which lowers operational costs and pure N2 consumption [25,26]. A local supplier set the price of N2 at USD 36 per kg (December 2021) or RM 6 per m3 (January 2022) [27]. Approximately 79% of flue gas is N2, 14% is CO2, and 7% is O2. Compared to N2-based pyrolysis, oxidative pyrolysis is anticipated to produce a higher gas output [28]. For example, the waste-to-energy system utilizing pyrolysis of food waste assisted with CO2 has increased CO generation. When CO2 is used during the pyrolysis of plastics, the formation of polyaromatic hydrocarbons (PAH) and acidic chemicals are reduced compared to N2-based pyrolysis [29,30]. This outcome is due to CO2 hindering the aromatization and cyclization reactions while accelerating the thermal cracking of volatiles during pyrolysis. In addition, CO2-assisted pyrolysis improves thermal efficiency, increases the breakdown and rearrangement of volatile products, and inhibits the reactivity of volatile organic compounds with gas [31,32].

2.2. Lifecycle Assessment (LCA) of the Pyrolysis System and Mitigated CO2

The CO2 emission factors for a linear economy were collected from several studies where MSW was in a landfill, while chemicals were manufactured using fossil fuels (conventional routes). Furthermore, the CO2 emissions per kg were compared to a circular economy-based scenario in which landfill-based MSW produced PyOL (extracted chemicals). For every 2500 tons of MSW, 3117 tons of CO2 emissions were recorded daily based on the Bukit Beringin Landfill estimates in 2015 [33]. This observation amounted to 1.25 kg of CO2 per kg of MSW. The “Our World in Data” database contained carbon emission data related to food production [34]. Consequently, shrimp, fish food, chicken meat, and beef produced 27, 14, 10, and 100 kg of CO2 per kg of MSW, respectively. The CO2 emission also reported high-value chemical production, ranging between 4 and 5 kg of CO2 per kg of MSW using conventional and methane-based methods [35].

2.3. TEF Study for a Commercial Pyrolysis Plant

A TEF study assessed the potential of establishing a commercial pyrolysis plant that generated value-added chemicals. This study was evaluated by sending survey forms to potential pyrolysis oil off-takers, involving BASF, PETRONAS Research Sdn. Bhd., Alam Flora, Jengka Advanced Renewable Energy Plant (JAREP), and other chemical companies (see Figure 1). Three of the five comments concerned capital, collection, and operating costs.
Academics from Curtin University and Manchester University, United Kingdom, conducting TEF studies on industry-based pyrolysis were consulted in this study. Figure 2 portrays the overall process of performing the TEF studies. Capital expense data were sourced from Fivga et al.’s study, which estimated the costs of waste plastic pyrolysis, material balances, energy needs, and utilities using process simulation software (Aspen HYSYS v8.6) [36].
Figure 3 illustrates the formic acid, furfural, and phenol extraction methods [10,32,37]. Although the capital expenditures for extracting these compounds were unknown, the average capacity and recent investment values in crude oil-to-chemicals (COTC) plants were utilized instead [38]. The average capital cost was estimated to be RM 2722 per ton of PyOL based on the investment lists and capacities of COTC plants (see Figure 4).
The TEF analysis was performed for pyrolysis plants handling MSW values of 20, 100, 1000, and 10,000 kg/h in response to Fivga et al.’s study [36]. According to a Malaysian Performance Management and Delivery Unit study, the waste collection cost was approximately RM 150 per ton daily [39]. The waste collection cost was lowered to meet each collector’s minimum wage (RM 1500 monthly). Therefore, these costs were reduced from RM 300 ton/day to RM 275, 150, and 100 ton/day for plant capacities of 20, 100, 1000, and 10,000 kg/h, respectively.
The pyrolysis plant data using flue gas as a pyrolysis agent and OPW as feedstock were not readily available. Thus, additional feasibility data were estimated using techno-economic analysis of pyrolysis plants employing woody biomass, rice husks, or plastics as feedstock. These data were obtained from institutions like the National Renewable Energy Laboratory (NREL) [40,41]. The pyrolysis fuel production cost for various plant capacities was then evaluated according to Fivga et al.’s study [36]. Meanwhile, studies by Wright [40], Jahirul [42] and Islam [43] provided the operating breakdown costs for labor, operation, and maintenance (OM) of the proposed pyrolysis plants with an annual operational time of 7008 h/yr. The OM cost involved clearing pipe blockages, repairing conveyors, compressors, and air distribution plates, maintaining pyrolysis agent systems, fixing pipe leaks, and a one-time payment for overhauling major equipment (heating system and large material handling equipment).
The total operational costs increased with plant capacity due to rising energy costs and the demand for consumables, such as liquid petroleum gas (LPG), to heat the reactor. In contrast, the operational costs per kg of OPW decreased when the labor costs did not increase linearly with plant capacity. The operating cost was hypothetically lower than plants that employed pure N2 as the pyrolysis agent. Although the proposed pyrolysis plant utilized flue gas for fluidization and pyrolysis processes, additional pumps and pipe insulations were necessary to raise the pressure while maintaining the temperature.
For plants with capacities of 1000 and 10,000 kg/h, using flue gas at an average temperature of 150 °C for heating the reactor to 350 °C decreased LPG consumption by between RM 40,009 and 400,098 annually. Interestingly, this flue gas-based process also prevented and reduced the CO2 released into the atmosphere. Depending on the implementation of a domestic carbon trading mechanism and the carbon price (RM 35 to 150 per ton of CO2), the flue gas fast pyrolysis system provided additional revenue if other carbon-emitting companies purchased carbon credits from the carbon offset of the pyrolysis system [44].
The expected capital, OM expenditures, and revenue for two case studies were considered in the TEF analysis. The first case study demonstrated the PyOL as the sole product, which the PyOL costing approximately RM 0.60 per kg based on a local PyOL manufacturing company survey. Likewise, the pyrolysis technology used in this study yielded a 5% PyOL. A higher yield was also possible (20 to 30%) with low condensation temperatures (10 to −10 °C). Nonetheless, the low condensation temperature was assumed to be unavailable in the commercial plant owing to the high capital investment needed, producing lower PyOL due to the limitation of energy consumption. The second case study reported the chemical extractions of formic acid, furfural, and phenol from PyOLs through processes presented in several studies [10,32,37]. These studies provided the estimated chemical yields with the estimated minimum value prices (obtained from the Chemical Book and Sigma-Aldrich or Merck websites) [45,46]. Hence, the values reported are presented as follows:
  • Yield of furfural: 1.0%, at RM 303/kg
  • Yield of formic acid: 8.4%, at RM 96/kg
  • Yield of phenol: 4.1%, at RM 437/kg
The specific unit pricing (expressed in RM/L) increased with order volume. Thus, the specific unit price for phenol, furfural, and formic acid was averaged over quantities ranging from 1 to 25 kg (or 1 to 25 L). The profitability per year (PF) was calculated as the total annual income minus the total yearly operating, maintenance, and utility costs (PF). Similarly, the actual cash flow per year (CFn) for Year n was calculated by multiplying PF with a present value factor (PVn) and a discount factor r of 8%. Therefore, the actual PF declines over time is as follows:
CFn = PF × PVn
Since the construction and commissioning were supposed to take two years and the capital investment (CI) was set at Year n (where n = 0, 1, 2, …), Years 1 and 2 demonstrated no cash flow. From Years 3 to 8, the PV value decreased from 0.7938 (PV3) to 0.5403 (PV8). Subsequently, the net present value (NPV) and internal rate of return (IRR) for each scenario are calculated as follows:
N P V = n = o 8 C F n ( 1 + I R R ) n
The N P V is set to null to determine the IRR.

3. LCA of Carbon Emissions for Pyrolysis and Chemical Production Plant

From the lifecycle assessment (LCA), the maximum possible total CO2 emissions from the production of food, chemicals, and MSW from landfills is 19.25 kg CO2 per kg of material, as shown in Figure 5. By utilizing MSW from landfills, the amount of CO2 that is reduced is equivalent to the amount emitted per kg of MSW (−1.25 kg CO2/kg MSW). The pyrolysis reactor emits 12% CO2, with a gas yield of 72% and total flow rate of 22 kg/h (20 kg/h of MSW + 2 kg/h of pyrolysis agent), and the carbon emission from the fluidized bed is estimated at 2.06 kg/h of CO2 or 0.10 kg CO2/kg MSW. These data are based on experimental results from the pilot-scale trials.
When 0.012 kg of CO2/kg MSW was divided by 0.048 kg of chemical/kg MSW, 2.5 kg of CO2/kg chemical was estimated as the chemical-extracted PyOL emission. By contrast, the LCA did not include the CO2 quantity of CO2 emitted per kg chemical. This outcome was observed due to the CO2 utilization in the pyrolysis process for the industry. If the LCA was based on the weight of the substances, the chemical reduction generated via fossil fuels would significantly reduce CO2 emissions. Thus, the decline was as much as −4 kg of CO2/kg chemical (mean value). On average, 0.04 kg of chemicals were predicted to be produced from each kg of pyrolysis oil. Therefore, the CO2 amount mitigated by chemicals from PyO was insignificant at −0.01 kg of CO2/kg MSW.
According to estimates, the total mitigated CO2 was −1.00 kg of CO2/kg MSW, which resulted in lifecycle emissions of 13.79 kg of CO2 per kg of material (a reduction of 5.46 kg CO2 per kg of material). For the extraction of formic acid, furfural, and phenol, grid emission factors estimated the carbon emissions from the COTC plant or chemical-extraction procedures [10,32,37]. Using a flue gas fast pyrolysis system could offset indirect CO2 emissions from the chemical-extraction process (from the supply chain), thus lowering the carbon footprint. Nevertheless, only point emissions were considered in this study.
The MSW removal from landfills generated the highest saved CO2 amount (see Figure 6). This value was even larger if indirect emissions related to changes in land use and landfill leachates were considered. Figure 5 and Figure 6 present the gross estimations reported in the literature and the comparisons of numerous methods and models, respectively. Thus, an accurate and comprehensive assessment of the LCA was demonstrated, which was vital for further evaluation [47,48].

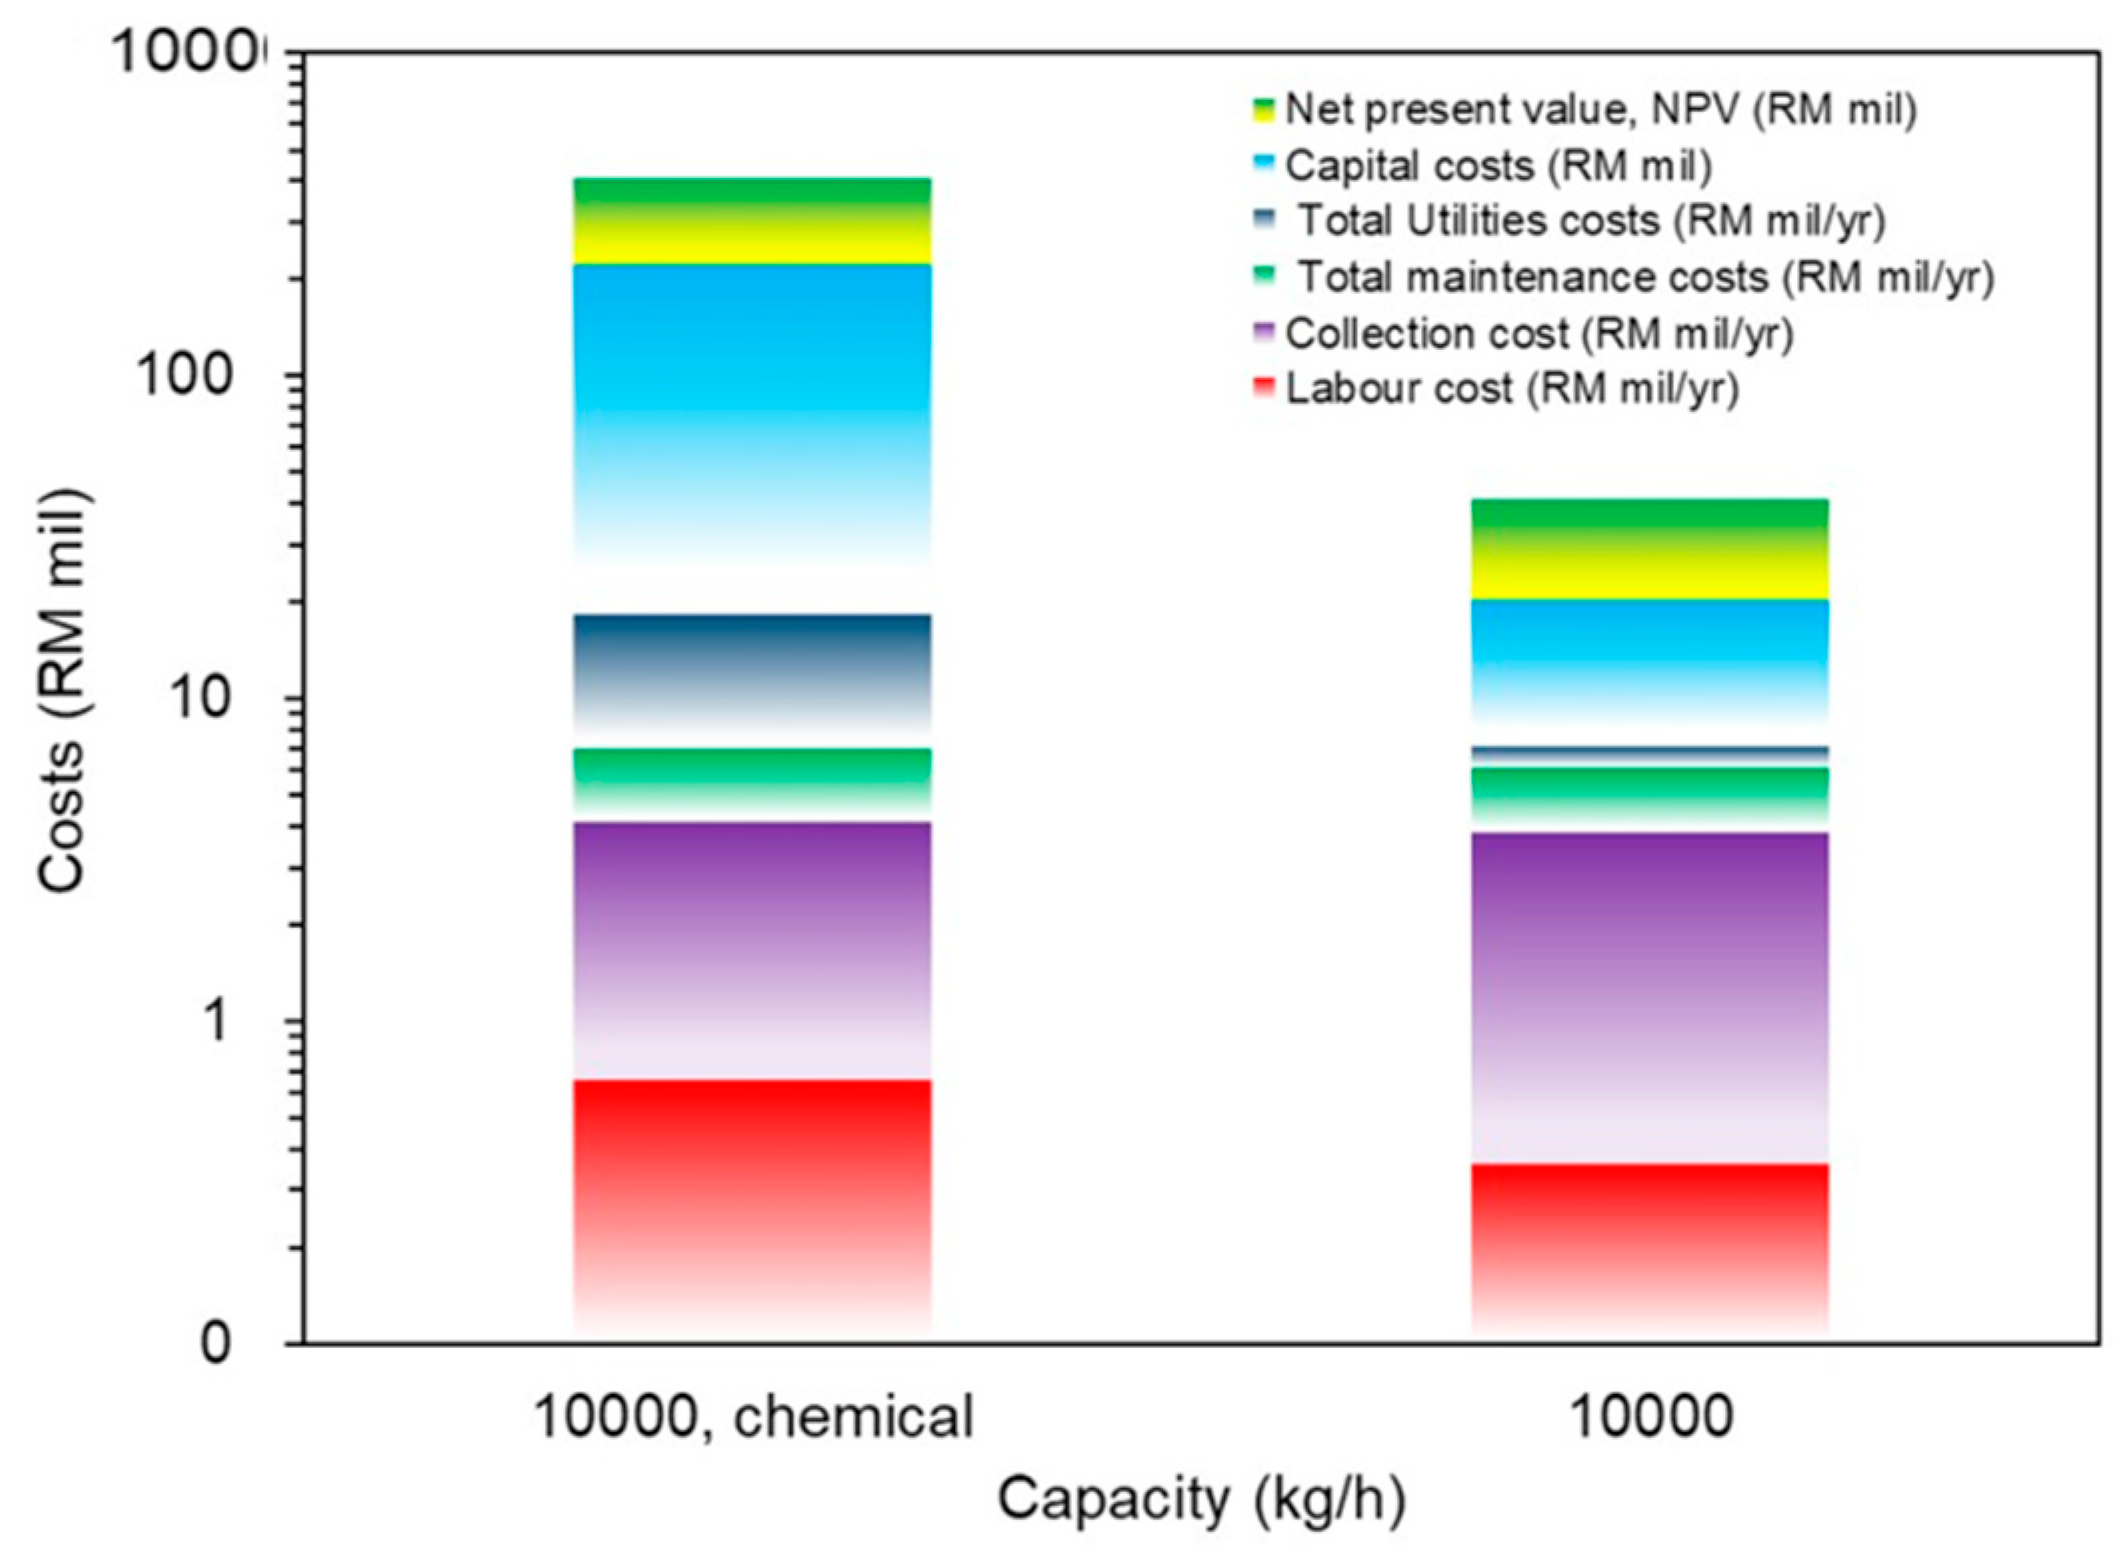
4. TEF Study of Commercial Pyrolysis Oil/Liquid and Chemical-Extraction Plant

Table 2 tabulates the labor cost breakdown for the first PyOL production case study, while Table 3 provides a breakdown of costs for waste collection, operation, maintenance, and utilities. Table 4 lists the PyOL revenue and the averted carbon. Based on data from a local company employing a rotary kiln to produce PyOL at a rate of 15 tons per day, the PyOL cost was RM 0.60 per kg.
Table 5 displays the estimated capital costs for various plant capacities for the second chemical manufacturing case study from PyOL. These values were based on the investment amount for COTC plants published by the IHS market, in which the plant capital expense was RM 2722 per ton [50]. The chemical operational cost, power consumption, yield, and price are also provided in Table 6.
Depending on the carbon price and the tipping fee, the first case study (PyOL production) indicated positive cash flows for the 10,000 kg/h plant (see Figure 7). The IRR was 41% when the carbon price was RM 150 per ton of CO2, which was reduced to 0% at RM 50 per ton of CO2. Subsequently, the IRR was 4% when the carbon price was RM 50 per ton of CO2, with the daily tipping fee of RM 120 per ton MSW. Intriguingly, the IRR was still 4% when there were no carbon prices alongside a daily tipping fee of RM 120 RM per ton MSW. The cash flow was negative for the remaining plant capacities.
Figure 8 shows that for the second case study (chemical extraction from PyOL), there are positive cash flows for the 1000 and 10,000 kg/h plants for carbon prices of RM 35 to 150 per ton CO2. The internal rate of return is 1 to 7% for the 1000 kg/h system, and 21 to 26% for the 10,000 kg/h plant, for carbon prices of RM 35 to 150 per ton CO2.
For the second case study (chemical extraction from PyOL) as shown in Figure 9, the carbon prices ranged from RM 35 to 150 per ton of CO2, and positive cash flows were recorded for the 1000 and 10,000 kg/h plants. Similarly, the IRR were from 1 to 7% and 21 to 26% for the 1000 kg/h and 10,000 kg/h plants, respectively.
Compared to the PyOL-based production plant, the revenue from the chemicals outweighed all other costs of the chemical-extraction plant (excluding the capital costs). Conversely, these figures were indicative and were subject to change based on the supply-and-demand dynamics. The TEF template in this study could be applied to future similar investigations. The assumptions and models employed in this study revealed that Malaysia was increasingly using pyrolysis plants as a more sustainable approach to managing waste-to-energy system while producing electricity. Therefore, pyrolysis facilities were viewed as a key technology in reducing the waste quantity sent to landfills by 30% in 2025.

5. Conclusions

In conclusion, this paper has shown that it is economically feasible to use a waste-to-energy system to produce PyOL from OPW using flue gas as the pyrolysis agent. The flue gas fast pyrolysis system of OPW in a fluidized bed shows that the liquid yield is between 5.2 and 5.5% under the operating conditions of 100/0 (305 °C) and 99.5/0.5 (354 °C), respectively. This low liquid yield shows that it is still economically viable based on the carbon credits obtained by mitigating the carbon emissions from OPW in the landfills and the carbon in the flue gas. There are positive cash flows for the 1000 and 10,000 kg/h plants for carbon prices of RM 35 to 150 per ton CO2. Meanwhile, the internal rate of return is 1 to 7% for the 1000 kg/h system and 21 to 26% for the 10,000 kg/h plant. This paper has shown that the economic viability of the fast pyrolysis system in developing countries depends on a number of factors, including the cost of the pyrolysis plant, the cost of the feedstock, and the revenue from the sale of pyrolysis products. The development of pyrolysis plants in Malaysia can help to reduce the amount of OPW that ends up in landfills or the environment. It can also create employment opportunities and generate revenue for local communities. This paper has presented key factors that affect the development of pyrolysis plants by analyzing the detailed techno-economic feasibility and serve as a model for other developing countries to address the challenges of waste management and climate change.

Author Contributions

Conceptualization, methodology, investigation, resources, data curation, formal analysis, visualization, project administration, funding acquisition, writing—original draft preparation, M.L.; writing—review and editing, E.S.T. All authors have read and agreed to the published version of the manuscript.

Funding

This work was supported by Tenaga Nasional Berhad under grant number TNBR/SF367/2020 and AAIBE Chair of Renewable Energy at UNITEN with project code 202001KETTHA.

Institutional Review Board Statement

Not applicable.

Informed Consent Statement

Not applicable.

Data Availability Statement

Not applicable.

Acknowledgments

The authors would like to acknowledge the direct and/or indirect assistance and efforts of all related personnel.

Conflicts of Interest

The authors declare no conflict of interest. The funders had no role in the design of the study; in the collection, analyses, or interpretation of data; in the writing of the manuscript; or in the decision to publish the results.

References

  1. Bong, C.P.-C.; Goh, R.K.Y.; Lim, J.-S.; Ho, W.S.; Lee, C.-T.; Hashim, H.; Abu Mansor, N.N.; Ho, C.S.; Ramli, A.R.; Takeshi, F. Towards low carbon society in Iskandar Malaysia: Implementation and feasibility of community organic waste composting. J. Environ. Manag. 2017, 203, 679–687. [Google Scholar] [CrossRef]
  2. Lim, I. Court Fines Two Selangor Factories RM120,000 for Illegal Plastic Recycling. Malay Mail, 17 May 2019. [Google Scholar]
  3. Yansaneh, O.Y.; Zein, S.H. Recent Advances on Waste Plastic Thermal Pyrolysis: A Critical Overview. Processes 2022, 10, 332. [Google Scholar] [CrossRef]
  4. Titone, V.; Gulino, E.F.; La Mantia, F.P. Recycling of Heterogeneous Mixed Waste Polymers through Reactive Mixing. Polymers 2023, 15, 1367. [Google Scholar] [CrossRef] [PubMed]
  5. Simler, K. An Idea Whose Time Has Come—Raising Malaysia’s Poverty Line. The Star, 1 September 2019. [Google Scholar]
  6. Sophonrat, N.; Sandström, L.; Zaini, I.N.; Yang, W. Stepwise pyrolysis of mixed plastics and paper for separation of oxygenated and hydrocarbon condensates. Appl. Energy 2018, 229, 314–325. [Google Scholar] [CrossRef]
  7. Qureshi, K.M.; Lup, A.N.K.; Khan, S.; Abnisa, F.; Daud, W.M.A.W. A technical review on semi-continuous and continuous pyrolysis process of biomass to bio-oil. J. Anal. Appl. Pyrolysis 2018, 131, 52–75. [Google Scholar] [CrossRef]
  8. Ghorbannezhad, P.; Kool, F.; Rudi, H.; Ceylan, S. Sustainable production of value-added products from fast pyrolysis of palm shell residue in tandem micro-reactor and pilot plant. Renew. Energy 2019, 145, 663–670. [Google Scholar] [CrossRef]
  9. Brueckner, T.M.; Pickup, P.G.; Hawboldt, K. Improvement of bark pyrolysis oil and value added chemical recovery by pervaporation. Fuel Process. Technol. 2019, 199, 106292. [Google Scholar] [CrossRef]
  10. Oh, S.-J.; Choi, G.-G.; Kim, J.-S. Fast pyrolysis of corn stover using ZnCl2: Effect of washing treatment on the furfural yield and solvent extraction of furfural. Energy 2015, 88, 697–702. [Google Scholar] [CrossRef]
  11. Aldrich, S. Catalog of Products. 2020. Available online: https://www.sigmaaldrich.com/catalog/product/aldrich/ (accessed on 17 January 2023).
  12. Alibaba. Price of Furfural. 2020. Available online: https://www.alibaba.com/showroom/furfural-price.html (accessed on 2 January 2023).
  13. Echemi. Product Information Phenol. 2020. Available online: https://www.echemi.com/productsInformation/pid_Seven3078-phenol.html (accessed on 20 January 2023).
  14. BASF. BASF Raises Prices for Formic Acid in Europe and in the Americas. 2016. Available online: https://www.basf.com/global/en/media/news-releases/2016/05/p-16-221.html (accessed on 4 February 2023).
  15. Hosseinzadeh, M.B.; Rezazadeh, S.; Rahimpour, H.R.; Taghvaei, H.; Rahimpour, M.R. Upgrading of lignin-derived bio-oil in non-catalytic plasma reactor: Effects of operating parameters on 4-methylanisole conversion. Chem. Eng. Res. Des. 2015, 104, 296–305. [Google Scholar] [CrossRef]
  16. Xiu, S.; Shahbazi, A. Bio-oil production and upgrading research: A review. Renew. Sustain. Energy Rev. 2012, 16, 4406–4414. [Google Scholar] [CrossRef]
  17. Sommani, P.; Mankong, N.; Vitidsant, T.; Lothongkum, A.W. Cracking of used vegetabele oil mixed with polypropylene waste in the presence of activated carbon. ASEAN Eng. J. Part B 2013, 4, 16–24. [Google Scholar]
  18. Buchori, L.; Istadi, I.; Purwanto, P.; Kurniawan, A.; Maulana, T.I. Preliminary Testing of Hybrid Catalytic-Plasma Reactor for Biodiesel Production Using Modified-Carbon Catalyst. Bull. Chem. React. Eng. Catal. 2016, 11, 59–65. [Google Scholar] [CrossRef]
  19. Lim, M.; Zulkifli, A.Z.S. Investigation of biomass surface modification using non-thermal plasma treatment. Plasma Sci. Technol. 2018, 20, 115502. [Google Scholar] [CrossRef]
  20. Lim, M.T.; Zulkifli, A.Z.S.; Jayapalan, K.K.; Chin, O. Development of a dimensionless parameter for characterization of dielectric barrier discharge devices with respect to geometrical features. Plasma Sci. Technol. 2017, 19, 095402. [Google Scholar] [CrossRef]
  21. Al-Asadi, M.; Miskolczi, N.; Eller, Z. Pyrolysis-gasification of wastes plastics for syngas production using metal modified zeolite catalysts under different ratio of nitrogen/oxygen. J. Clean. Prod. 2020, 271, 122186. [Google Scholar] [CrossRef]
  22. Grycová, B.; Koutník, I.; Pryszcz, A. Pyrolysis process for the treatment of food waste. Bioresour. Technol. 2016, 218, 1203–1207. [Google Scholar] [CrossRef]
  23. Tang, Y.; Huang, Q.; Sun, K.; Chi, Y.; Yan, J. Co-pyrolysis characteristics and kinetic analysis of organic food waste and plastic. Bioresour. Technol. 2018, 249, 16–23. [Google Scholar] [CrossRef]
  24. Ding, Y.; Huang, B.; Wu, C.; He, Q.; Lu, K. Kinetic model and parameters study of lignocellulosic biomass oxidative pyrolysis. Energy 2019, 181, 11–17. [Google Scholar] [CrossRef]
  25. Kim, K.H.; Bai, X.; Rover, M.; Brown, R.C. The effect of low-concentration oxygen in sweep gas during pyrolysis of red oak using a fluidized bed reactor. Fuel 2014, 124, 49–56. [Google Scholar] [CrossRef]
  26. Ferreira, R.A.d.R.; da Silva Meireles, C.; Assunção, R.M.N.; Barrozo, M.A.S.; Soares, R.R. Optimization of the oxidative fast pyrolysis process of sugarcane straw by TGA and DSC analyses. Biomass Bioenergy 2020, 134, 105456. [Google Scholar] [CrossRef]
  27. Pharmacompass. API Price Trend Dashboard–Nitrogen. 8 December 2021. Available online: https://www.pharmacompass.com/price/nitrogen (accessed on 8 December 2021).
  28. Chen, D. 16—Examples of thermochemical and biological treatment technologies for sustainable waste management in China. In Substitute Natural Gas from Waste; Materazzi, M., Foscolo, P.U., Eds.; Academic Press: Cambridge, MA, USA, 2019; pp. 425–454. [Google Scholar]
  29. Oh, J.-I.; Lee, J.; Lee, T.; Ok, Y.S.; Lee, S.-R.; Kwon, E.E. Strategic CO2 utilization for shifting carbon distribution from pyrolytic oil to syngas in pyrolysis of food waste. J. CO2 Util. 2017, 20, 150–155. [Google Scholar] [CrossRef]
  30. Kwon, E.E.; Kim, S.; Lee, J. Pyrolysis of waste feedstocks in CO2 for effective energy recovery and waste treatment. J. CO2 Util. 2019, 31, 173–180. [Google Scholar] [CrossRef]
  31. Chen, Z.; Wu, D.; Chen, L.; Ji, M.; Zhang, J.; Du, Y.; Wu, Z. The fast co-pyrolysis study of PVC and biomass for disposing of solid wastes and resource utilization in N2 and CO2. Process Saf. Environ. Prot. 2021, 150, 489–496. [Google Scholar] [CrossRef]
  32. Fu, D.; Farag, S.; Chaouki, J.; Jessop, P.G. Extraction of phenols from lignin microwave-pyrolysis oil using a switchable hydrophilicity solvent. Bioresour. Technol. 2014, 154, 101–108. [Google Scholar] [CrossRef] [PubMed]
  33. Tan, S.T.; Ho, W.S.; Hashim, H.; Lee, C.T.; Taib, M.R.; Ho, C.S. Energy, economic and environmental (3E) analysis of waste-to-energy (WTE) strategies for municipal solid waste (MSW) management in Malaysia. Energy Convers. Manag. 2015, 102, 111–120. [Google Scholar] [CrossRef]
  34. Ritchie, H.; Our World in Data. The Carbon Footprint of Foods: Are Differences Explained by the Impacts of Methane? 2020. Available online: https://ourworldindata.org/carbon-footprint-food-methane (accessed on 10 November 2021).
  35. Ren, T.; Patel, M.K. Basic petrochemicals from natural gas, coal and biomass: Energy use and CO2 emissions. Resour. Conserv. Recycl. 2009, 53, 513–528. [Google Scholar] [CrossRef]
  36. Fivga, A.; Dimitriou, I. Pyrolysis of plastic waste for production of heavy fuel substitute: A techno-economic assessment. Energy 2018, 149, 865–874. [Google Scholar] [CrossRef]
  37. Luo, D.; Yin, W.; Han, D.; He, H.; Xia, S. Glycolic acid and formic acid production from pyrolysis oil water-soluble fraction by catalytic oxidation. Chem. Eng. Sci. 2021, 239, 116644. [Google Scholar] [CrossRef]
  38. IHS Markit. Crude Oil-to-Chemicals (COTC): A Look Inside Our Technology & Economic Analyses from the 2019–2014 Process and Economics Program (PEP); IHS Markit: London, UK, 2019. [Google Scholar]
  39. Performance Management and Delivery Unit Malaysia (PEMANDU), Solid Waste Management Lab 2015. Final Report. 2015; Ministry of Local Government Development, Malaysia. Available online: https://jpspn.kpkt.gov.my/wp-content/uploads/2022/07/slaid_dapatan_makmal.pdf (accessed on 29 December 2022).
  40. Wright, M.M.; Daugaard, D.E.; Satrio, J.A.; Brown, R.C. Techno-economic analysis of biomass fast pyrolysis to transportation fuels. Fuel 2010, 89, S2–S10. [Google Scholar] [CrossRef]
  41. Jaroenkhasemmeesuk, C.; Tippayawong, N. Technical and Economic Analysis of A Biomass Pyrolysis Plant. Energy Procedia 2015, 79, 950–955. [Google Scholar] [CrossRef]
  42. Jahirul, M.I.; Rasul, M.G.; Chowdhury, A.A.; Ashwath, N. Biofuels Production through Biomass Pyrolysis—A Technological Review. Energies 2012, 5, 4952–5001. [Google Scholar] [CrossRef]
  43. Islam, M.; Ani, F. Techno-economics of rice husk pyrolysis, conversion with catalytic treatment to produce liquid fuel. Bioresour. Technol. 2000, 73, 67–75. [Google Scholar] [CrossRef]
  44. The Edge Markets. Domestic Carbon Trading to Be Implemented in Phases from End of Next Year. 2021. Available online: https://www.theedgemarkets.com/article/domestic-carbon-trading-be-implemented-phases-end-next-year-%E2%80%94-minister (accessed on 12 January 2022).
  45. Chemical Book. Product Prices from CAS Database List. 2021. Available online: https://www.chemicalbook.com/SupplierPriceList_EN.aspx?cbn=CB4854063&page=3#price (accessed on 25 August 2021).
  46. Merck and Sigma-Aldrich. Product Prices for Formic acid, Furfural, and Phenol. 2021. Available online: https://www.sigmaaldrich.com/MY/en/search/phenol?focus=products&page=1&perPage=30&sort=relevance&term=phenol&type=product (accessed on 25 August 2021).
  47. Thomas, V.M. The National Academis of Sciences, Engineering and Medicine: Current Methods for Life Cycle Analyses of Low-Carbon Transportation Fuels in the United States. 2021. Available online: https://www.nationalacademies.org/our-work/current-methods-for-life-cycle-analyses-of-low-carbon-transportation-fuels-in-the-united-states (accessed on 10 November 2021).
  48. Xikai, M.; Wang, L.; Li, J.; Quan, X.; Wu, T. Comparison of regression models for estimation of carbon emissions during building’s lifecycle using designing factors: A case study of residential buildings in Tianjin, China. Energy Build. 2019, 204, 109519. [Google Scholar] [CrossRef]
  49. Lim, M.Z.; Tan, E.S.; Chai, Y.H.; Chin, B.L.F.; Juwono, F.H.; Hisham, D.H.B.; Anuar, M.A.M. Pilot-scale flue gas pyrolysis system for organic and plastic wastes with improved liquid properties in a non-thermal plasma reactor. J. Anal. Appl. Pyrolysis 2023, 173, 106062. [Google Scholar] [CrossRef]
  50. Malaysian Investment Development Authority (MIDA). Crude Oil to Chemicals (COTC) Technology: A New Paradigm Shift. Available online: https://www.mida.gov.my/crude-oil-to-chemicals-cotc-technology-a-new-paradigm-shift/ (accessed on 20 July 2023).
Figure 1. Potential off-takers of technology.
Sustainability 15 14280 g001
Figure 2. Methodology for techno-economic feasibility studies [36].
Sustainability 15 14280 g002
Figure 3. Extraction methods for formic acid, phenol, and furfural.
Sustainability 15 14280 g003
Figure 4. List of crude oil-to-chemicals (COTC) plant investment and capacities [39].
Sustainability 15 14280 g004
Figure 5. Estimated lifecycle CO2 emissions for (a) a linear economy where municipal solid waste is dumped in landfill —[33] *—[34] +—[35], (b) a circular economy where organic waste is pyrolyzed to produce chemicals [29].
Sustainability 15 14280 g005aSustainability 15 14280 g005b
Figure 6. The avoided CO2 amount using flue gas and MSW for the pyrolysis plant alongside the CO2 emissions estimated using the grid emission factor [33].
Sustainability 15 14280 g006
Figure 7. (a) Discounted cash flows per year for different plant capacities, carbon price, and tipping fee for pyrolysis liquid only. (b) Internal rate of return and different carbon price and tipping fee for pyrolysis liquid only.
Sustainability 15 14280 g007
Figure 8. (a) Discounted cash flows per year for different plant capacities, carbon price, and tipping fee for chemical extraction from pyrolysis liquid. (b) Internal rate of return and different carbon prices for chemical extraction from pyrolysis liquid.
Sustainability 15 14280 g008
Figure 9. Breakdown of costs for 10,000 kg/h chemical-extraction plant and PyOL-based plant.
Sustainability 15 14280 g009
Table 1. Extractable chemicals from pyrolysis oil and their function.
ExtractablesFunctionBulk/Cost (USD/ton)Estimated Shelf Cost (RM/Liter) [4]
Formic acid
  • Preservative and antibacterial agent in livestock feed.
  • To process organic latex (sap) into raw rubber.
44 [1]70–96
Furfural
  • Solvent for the extraction of aromatics.
  • As a transportation fuel, jet fuel, gasoline additive, soil enhancer, and organic fertilizer.
900–2000 [2]56–303
Phenol
  • Additive for products to promote hardening, used in paints and varnishes, plastics, etc.
  • Type of pesticide used to destroy or inhibit the growth of disease-causing mechanisms.
840 [3]125–437
Table 2. Summary of the labor cost breakdown for a commercial OPW co-pyrolysis plant.
Organic and Plastic Waste Capacity (kg/h)20100100010,000
Capital costs (RM mil)2.282.527.2013.20
Management, production (RM/yr)100,000.00100,000.00100,000.00100,000.00
Number of engineers---1
Mean salary of engineers (RM/month)---8333.33
Engineers, production (RM/yr)---173,286.21
Engineers, maintenance (RM/yr)---173,286.21
Number of operators and technicians2468
Mean salary operators and technicians (RM/month)4166.674166.674166.672083.33
Operators and technicians, production (RM/yr)50,000.0050,000.0050,000.0050,000.00
Operators and technicians, maintenance (RM/yr)50,000.0050,000.0050,000.0050,000.00
Number of executives1112
Mean salary of executives (RM/month)2500.002500.002500.002500.00
Executive (RM/yr)30,000.0030,000.0044,362.73103,971.73
Total Labor Costs62,000.00620,000.001,073,202.442,009,031.75
Table 3. Summary of the waste collection, operational, maintenance, and utility costs concerning plant capacity. Breakdown of labor, collection, OM costs (pyrolysis liquid only).
Organic and Plastic Waste Capacity (kg/h)20100100010,000
Waste collection costs (RM/ton/day)300275150100
Amount of waste (tons/day)0.241.2012.00120.00
Number of collectors (staff)1.005.0025.00180.00
Mean cost of collectors (RM/month)1752.001606.001752.001622.22
Total Collection Costs (RM/yr)21,024.0096,360.00525,600.003,504,000.00
Clear blockage (RM/yr)5000.007500.0020,000.0040,000.00
Repair conveyer (RM/yr)50,000.0075,000.00200,000.00400,000.00
Maintenance of pyrolyzing agent systems (RM/yr)25,000.0037,500.00100,000.00200,000.00
Repair compressor (RM/yr)25,000.0037,500.00100,000.00200,000.00
Repair fluidized bed and auxiliary equipment (RM/yr)25,000.0037,500.00100,000.00200,000.00
Repair leakages (RM/yr)20,000.0030,000.0080,000.00160,000.00
Major equipment overhaul (RM/yr)100,000.00150,000.00400,000.00800,000.00
Total Maintenance Costs (RM/yr)250,000.00375,000.001,000,000.002,000,000.00
Organic and Plastic Waste Capacity (kg/h)20100100010,000
Power consumption (RM/yr)72,829.27109,243.91291,317.09582,634.18
For heating up reactor (RM/yr)1391.656958.2369,582.30695,822.96
Total Utilities Costs (RM/yr)74,220.92116,202.14360,899.391,278,457.14
Table 4. Summary of the revenue from pyrolysis and carbon credit. Breakdown of revenue from pyrolysis liquid and carbon credit.
Organic and Plastic Waste Capacity (kg/h)20100100010,000
Carbon price (RM/ton CO2)50 to 150 (proposed by Penang Institute in 2019)
CO2 mitigated from landfill (kg CO2/kg MSW)1.25 [33]
CO2 mitigated from landfill (ton CO2/yr)140701700870,080
Flue gas flow rate (kg/h)10505005000
Average CO2 content in flue gas (%)12 (based on power plant values)
CO2 mitigated from flue gas (ton CO2/yr)8424204205
Power consumption, including OPW prep. (kW)213142 *83
Grid emission factor (kg CO2/kWh)0.57 [33]
Grid emission per year (ton CO2/yr)83125166332
Net CO2 mitigated (ton CO2/yr)101794901491,473
Yield of pyrolysis oil (%)5 (based on exp. in this project published in [49])
Selling price of pyrolysis oil (RM/kg)0.60 [based on information from local company, 2022]
Tipping fees for pyrolysis plant (RM/ton/day)0 to 250 [39]
* similar to local company, 1250 kg/h pyrolysis plant.
Table 5. Summary of the estimated capital costs for the chemical-extraction plant. With value-added chemicals extracted from pyrolysis oil.
Capacity (kg/h)20100100010,000
Capital cost (RM million) *2.664.4326.28203.97
* Based on min. shelf price, obtained from Sigma-Aldrich (Petaling Jaya, Malaysia) and Chemical Book.
Table 6. Summary of the yield, power consumption, emission factors, and price of chemicals. With value-added chemicals extracted from pyrolysis oil.
Capacity (kg/h)20100100010,000
Total operating costs annually (RM/yr)993,7321,504,5375,238,35317,847,238
Power consumption, including OPW prep. and chemical extraction (kW)4162166332
Net CO2 mitigated (ton CO2/yr)18669851690,476
Yield, liquid (kg/kg waste)0.05 (based on exp. in this study)
Yield, formic acid (kg/kg waste)0.084 [37]
Yield, furfural (kg/kg waste)0.010 [29]
Yield, phenol (kg/kg waste)0.041 [32]
Price of formic acid (RM/kg)96 *
Price of furfural (RM/kg)303 *
Price of phenol (RM/kg)437 *
* Based on min. shelf price, obtained from Sigma-Aldrich and Chemical Book.
Disclaimer/Publisher’s Note: The statements, opinions and data contained in all publications are solely those of the individual author(s) and contributor(s) and not of MDPI and/or the editor(s). MDPI and/or the editor(s) disclaim responsibility for any injury to people or property resulting from any ideas, methods, instructions or products referred to in the content.

