Article

Increasing Trends of Heat Waves and Tropical Nights in Coastal Regions (The Case Study of Lithuania Seaside Cities)

by
Inga Dailidienė
1,*,
Inesa Servaitė
1,
Remigijus Dailidė
1,
Erika Vasiliauskienė
1,
Lolita Rapolienė
2,
Ramūnas Povilanskas
2 and
Donatas Valiukas
3
1
Marine Research Institute, Klaipeda University, H. Manto Str. 84, LT-92294 Klaipeda, Lithuania
2
Faculty of Health Sciences, Klaipeda University, H. Manto Str. 84, LT-92294 Klaipeda, Lithuania
3
Lithuanian Hydrometeorological Service, Oršos Str. 8, LT-09300 Vilnius, Lithuania
*
Author to whom correspondence should be addressed.
Sustainability 2023, 15(19), 14281; https://doi.org/10.3390/su151914281
Submission received: 11 July 2023 / Revised: 25 August 2023 / Accepted: 19 September 2023 / Published: 27 September 2023
(This article belongs to the Special Issue Innovative Technologies and Strategies in Disaster Management)

Abstract

:
Climate change is leading to an annual increase in extreme conditions. Public health is closely related to weather conditions; hence, climate change becomes a major factor concerning every-day human health conditions. The most common extreme natural phenomenon that affects people’s health is the summer heat wave. During the 21st century, as the air temperature continues to rise, the sea surface temperature (SST) rises along with it, especially along the seacoasts. More massive water bodies, such as seas or larger lagoons, that warm up during the day do not allow the ambient air to cool down quickly, causing the air temperature to often be warmer at night in the coastal area than in the continental part of the continent. Currently, not only an increase in the number of days with heat waves is observed, but also an increase in the number of tropical nights in the coastal zone of the Southeastern Baltic Sea. In this work, heat waves are analyzed in the seaside resorts of Lithuania, where the effects of the Baltic Sea and the Curonian Lagoon are most dominant.

1. Introduction

A heatwave is a prolonged period of excessively hot weather that may be accompanied by high humidity, especially in marine climate areas. Heat waves and tropical heat nights are indeed extreme weather events whose occurrence is becoming ever more likely on the Baltic Sea coast due to climate change.
Heat waves are one of the most dangerous anomalies of climate change, which may intensify if humanity continues to irresponsibly pollute and change natural systems and does not reduce pollution, the use of fossil fuels, and greenhouse gas emissions. Information about heat waves and their changing trends is necessary to better mitigate the effects of climate change by applying key knowledge and sustainable management principles. Air temperature and its anomalies directly affect ecosystems, people’s economic activities, agriculture, urbanization planning, adaptation of buildings, and the growth of energy resources.
Heat waves are one of the biggest challenges of our time and are associated with extreme events and threats to various ecosystems and human health. The 2018 International Panel on Climate Change (IPCC) Special Report warns that allowing the planet to warm beyond 1.5 °C will result in climate change impacts, including drought and heat waves that are deleterious for humanity and biodiversity [1]. As the climate warms, the number of natural disasters and weather anomalies is increasing around the world, and the damage they cause is ever more disastrous. The 6th Assessment of The Intergovernmental Panel on Climate Change projects increasing thermal-associated morbidity and mortality under anthropogenically induced warming of air temperature and heat waves [2].
The number of heat waves (HWs) and their intensity have increased worldwide during the last decades, as well as on the European continent [3], including the Baltic Sea region [4]. Climate change projections suggest that in the Northern Hemisphere and European summers, heat waves will become more frequent and severe during this century [5,6,7]. The most severe impacts arise from multi-day heat waves associated with warm night-time temperatures and high relative humidity [8].
The Baltic Sea is a semi-enclosed intra-continental shallow sea with a specific environmental uniqueness due to its special geographical, climatological, and oceanographic characteristics (Figure 1). The southern and western parts of the Baltic Sea belong to the central European mild climate zone in the westerly circulation, and the northern part is located at the polar front with cold and dry east wind dominance. The climate of the Baltic Sea region has a large degree of variability due to the opposing effects of moist and relatively mild marine airflows from the North Atlantic Ocean and the Eurasian continental climate [9].
The Baltic Sea region is characterized by extremely variable weather conditions due to its position in the extratropics, lying between arctic and subtropical air masses [11]. It is strongly influenced by the atmospheric circulation in the North Atlantic European sector, which is steered by two pressure systems, namely the Icelandic Low and the Azores High, which define the North Atlantic Oscillation (NAO) [12]. Due to the meridional pressure gradient between these two systems, westerly winds generally prevail over the Baltic Sea area [11].
The Baltic Sea in Northern Europe is surrounded by nine economically developed countries: Denmark, Germany, Poland, Lithuania, Latvia, Estonia, Russia, Finland, and Sweden. The basin (drainage area) of the Baltic Sea is inhabited by around 85 million people [13]. During the summer, this region attracts a similar number of tourists and vacationers. Regional monitoring and assessment of the Baltic Sea environment are two of the core tasks of the intergovernmental Helsinki Commission (HELCOM). It is aiming to maintain good ecosystem health, including adaptation and management of climate change. Focusing on extreme events and the study of heat waves may also help countries develop better means of dealing with other longer-term impacts of global climate change. Extreme situations of natural origin are pronounced changes in climatic conditions that cause natural disasters. The Baltic countries are already facing intensifying and more frequent extreme weather conditions—heat waves, droughts, rains, and flooding—which cause loss of biodiversity and affect the economy, air quality, and health of people [14,15].
One of the major problems when analyzing HWs and their impacts on society is the definition of HWs, because, to date, there is no universally accepted definition of HWs [16]. In the case of heat waves, the overall definition remains very broad, describing a period of consecutive days where conditions are excessively hotter than normal [17]. Based on this definition, heat waves can be both summertime and annual events. In general, an HW is a prolonged period of consecutive days with extremely high air temperatures for a specific region, taking into account that average conditions in one region, e.g., the Mediterranean, would be regarded as extreme conditions in another region, like Northern Europe [16]. In order to make such comparisons possible across different countries, the use of individual threshold values is recommended to define HWs derived from site-specific data sets [16].
However, the effects of weather on the human body are very diverse. A stressful state for the human body is usually caused by a sudden change in weather conditions and large temperature gradients when the air temperature changes in a short time. These symptoms are typical of heat waves. As well, people are usually more vulnerable to heat stress at the beginning of the climatic summer than in the middle or end of the season [18]. Short-term acclimatization to seasonal temperature fluctuations occurs within a couple of weeks [19,20]. Thermal environmental conditions have a strong impact on human well-being, and extreme hot or cold weather, which is less typical for this area, can become a cause of health problems or even death [21]. For example, in Finland and Northern Europe, mortality is lowest when the daily mean temperature is in the range of 12–17 °C, while in Mediterranean countries, the same is true at 22–25 °C [20,22]. The frequency variation of tropical nights is studied in Beijing with a minimum air temperature >25 °C [23].
The thermal regime of the environment is one of the main factors directly affecting the human body. People’s sensitivity to the weather is not the same: weather-liable people react sensitively to weather changes, while meteo-stable people may not feel it at all [24]. According to the same source, an air temperature of 20 °C to 25 °C can be the comfort limit for most of the inhabitants of middle latitudes, including the Baltic region. Over the past century, more than 100 indices have been developed and used to assess bioclimatic conditions for human beings [25]. For example, according to the universal thermal climate index (UTCI) used in Europe, there is no heat stress for humans in the range between +9 °C and +26 °C, moderate heat stress ranges from +26 °C to +32 °C, and strong heat stress ranges from +32 °C to +38 °C [26]. The effective temperature index was established to provide a method of determining the relative effects of air temperature and humidity on comfort [25]. According to the same source information, the assessment scales adopted in central Europe have the following thresholds in use: <1 °C = very cold; 1–9 = cold; 9–17 = cool; 17–21 = fresh; 21–23 = comfortable; 23–27 = warm; >27 °C = hot.
Since the end of the 20th century, the frequency and intensity of extreme heat events have increased in most regions in line with global warming [27]. The IPCC Special Report on Extremes also shows that heat waves will be more frequent, longer, and more intense in the 21st century. Regional studies, the integration of early warning systems, and reinforced health systems will be needed in all regions. European countries are developing and implementing heat warning systems. However, warning systems differ due to non-uniform physical and geographical conditions as well as traditions of scientific development. For example, when we compare the indicators of two neighboring countries, we see differences. Comparing the systems of the neighboring Baltic states (Latvia and Lithuania), we see the criteria (Table 1) based on which the public and health organizations are warned about heat waves. The Latvian heat warning system consists of two categories [28]. The first level warns when daily maximum temperatures are between 27 °C and 32 °C for at least two consecutive days or longer, and the next warning level is issued if daily maximum temperatures exceed ≥33 °C (Table 1). In general, all systems play an important role in providing information on the risk and levels of heat waves.
In Lithuania, heat waves and indicators describing their levels are used by the Lithuanian hydrometeorological service as well as the scientists to assess the change in extremal meteorological conditions in the territory of Lithuania. In Lithuania, the term heatwave has not yet been officially established [30]. However, heat waves are usually described in Lithuania when the maximum air temperature is ≥+25 °C for 3 consecutive days [10,29,31]. Natural, catastrophic meteorological phenomena include natural heat when the maximum air temperature is equal to or higher than 30 °C for 3 consecutive days or more [10,30]. Indicators are also often used next to warning systems for the indication of heat stress. The Lithuanian hydrometeorological service uses an adapted Canadian Humidex index (Table 1), which evaluates air temperature and humidity. The largest average difference between the values of the Humidex index and the measured air temperature is recorded on the Baltic coast of the Western Lithuania Seaside. Due to higher air humidity index values in Klaipeda from July to August, they are on average 4 °C higher than the measured air temperature [24]. During heat waves, the sensed air temperature on the Baltic coast is higher than the measured temperature.
In this study, we examine heatwaves in Lithuania’s coastal cities along the Baltic Sea, where the maritime climate is most pronounced. This area typically has cool, damp summers, a hallmark of mid-latitude maritime climates. With global climate change, we’re seeing more irregular weather, including an increase in heat waves. Yet, there’s limited research on how these changes impact these coastal regions, known for their stable temperatures and frequent weather shifts. The likelihood of experiencing heat waves and extremely warm nights is rising along the Baltic Sea coast due to these climate changes. Heat waves and tropical heat nights are indeed extreme weather events whose occurrence is becoming ever more likely on the Baltic Sea coast due to climate change.
This study examines changes and trends in air temperature, heat waves, and tropical nights as one of the main indicators of climate change. The aim of this work is to study the trends and changes in the frequency and intensity of heat waves in the last 30 years (1993–2022) according to historical monitoring data in the Baltic Sea coastal areas. The results of this study present indicators of heat waves according to the climate indices, such as the duration of heat waves and tropical nights in days, the number of heat waves per year, and the length of the longest heatwave in days. Some of the heatwave indicators, such as the intensity of severe heat waves in days, were selected based on the national emergency management criteria.
This research is aimed at informing the public about the increasing number of cases of extreme events and raising awareness of the danger of heat waves to human health in the resorts and urbanized areas of the Southeastern Baltic Sea. The studies of the trends in climate parameter variations are relevant not only for the knowledge of climate change processes but also for the development of strategies of adaptation to the consequences of the said processes. Extreme weather and climate events, such as heat waves and tropical nights, can lead to socio-economic and natural disasters. Therefore, information about the variability of heat wave statistics is of increasing importance for risk management and prevention.

2. Materials and Methods

2.1. Study Site

The research area covers the southwestern coast of the Baltic Sea in the maritime climatic region of the territory of Lithuania (Figure 1). The analyses of climate variability are based on the monitoring data of the air temperature measured in Lithuania on the Baltic Seaside for the period from 1961 to 2020 and research of the heat waves and tropical nights for the last 30 years (1993–2022).
The climate zoning of Lithuania is transitional between mild maritime Western Europe and continental Eastern Europe climate [10]. The climate region of the Southeast (SE) Baltic Sea is close to the climate of Western Europe (Figure 1a,b). The coastal climate in the SE Baltic is formed by dominant western air masses coming from the Atlantic Ocean, including the Baltic Sea. The heat waves and tropical nights are basically related to the circulation of south, south-west, and south-east air masses. Hot weather is determined by the continental atmospheric circulation processes, and this is a common situation for the west and south periphery of blocking anticyclones [10]. The extremes of daily air temperature in various climatic regions of Lithuania are determined by geographical altitude, distance to the sea (sea air advection), and continentality of the climate [32]. Compared to the continental areas, the Baltic Seaside has smaller daily and annual air temperature amplitudes and diurnal contrasts.
In Lithuania, there are four main climatic regions, which are divided into sub-regions. According to the geographical zoning of Lithuania’s climate, the Baltic coast is classified as a maritime (seaside) climatic region (Figure 1d). The seaside district is divided into three sub-regions: (a) Curonian Spit (CS), (b) sea coast (SC), and (c) coastal lowlands (CL). In this study, heat waves and tropical nights are studied in the Curonian spit sub-region and the sea coast sub-region. Nida resort settlement belongs to the Curonian Spit subregion, and Klaipeda portcity and Palanga belong to the coastal subregion (Figure 1d).
Data from the meteorological stations of three settlements in Lithuania (Klaipeda, Palanga, and Nida) was used for the research. The meteorological stations have the corresponding numbers of the World Meteorological Organization (WMO): Klaipeda meteorological station, WMO No-26509; Nida meteorological station, WMO No-26603; Palanga aviation meteorological station, WMO No-26502 (Figure 1).
The seaside region of Lithuania has distinct maritime climate features. The maritime climate is characterized by a small (compared to the continental climate) annual and daily temperature amplitude, higher relative and absolute air humidity, cloudiness, and precipitation throughout the year [30]. The direct influence of the Baltic Sea is manifested by stronger winds, more frequent fogs, and smaller annual and daily temperature fluctuations compared to other continental climate regions [33]. The immediate influence of the Baltic Sea can be felt on a 20–30 km stretch of coastline [29]. Sea breeze fronts show the area of marine climate influence during the summer. The sea wind front in the territory of Western Lithuania travels an average of about 30–40 km from the coast of the Baltic Sea [34]. The climate of this region is characterized by moderately warm summers. Daily and annual temperature fluctuations are not large compared to other regions of Lithuania, where the continental climate prevails [33].
The climate of the Curonian Spit sub-region is very different from other areas of Lithuania. Because the resort settlement of the Curonian Spit is surrounded by the waters of the Baltic Sea to the west and by the shallow waters of the Curonian Lagoon to the east. The Curonian Lagoon is the largest lagoon in the Baltic Sea. Its total area is about 1584 km2, the maximum length of the lagoon from north to south is about 93.5 km, the maximum width is 46.5 km in the southern part of the lagoon [35], and the narrowest northern part connects the lagoon with the Baltic Sea through the Klaipeda Strait (Figure 1).

2.2. Data and Methods

The multi-year warming trend in the southeastern Baltic Sea region is evaluated over a longer period based on the average multi-year climatic air temperature norms of each month and year. The periods are selected according to the current recommendations of the World Meteorological Organization. The WMO (World Meteorological Organization) recommends defining climatological standards as averages of climatological data computed for successive 30-year periods. As climate change processes accelerate, the WMO recommended that the Standard Climate Norm (SCN) be calculated not every thirty years (as was the case previously: 1931–1990, 1961–1990), but in periods of every 10 years [36]. The climatic periods selected for the comparison of seasonal changes in the average air temperature of the Southeast Baltic Sea Seaside are 1961–1990, 1971–2000, 1981–2010, and 1991–2020.
The analysis of the heat waves (HWS) and tropical nights (TNs) variability is based on meteorological monitoring data for the period 1993–2022. Daily and hourly air temperature, humidity, and air pressure data were obtained from the Lithuanian Hydrometeorological Service under the Ministry of Environment. The heat waves and tropical nights were investigated in Lithuanian Klaipeda port-city and seaside resorts (Nida and Palanga) during the summer period from 1st of May to 31st of August.
A heatwave is a meteorological phenomenon that consists of abnormally hot weather conditions. Heat waves are classified as indicators of climate change because they indicate more frequent extreme deviations from the climatic norm. A heat wave is broadly defined as a period of statistically unusually hot weather persisting for a number of days and nights. There are quite a variety of methods for assessing heat waves, considering the specific geographical and climatic differences of the areas. Different countries have adopted their own standards. Perkins and Alexander [17], summarizing methods for defining heat waves in different countries, indicate that across all definitions, greater significance exists for trends in occurrence-based aspects, that is, the yearly sum of participating heat wave days and a yearly number of heat waves. The number of available heatwave days drives the length of heatwave events.
In this study, heat waves and tropical nights are analyzed by evaluating the following main characteristics of the warm period (from 1 May to 31 August): (a) frequency—the number of heat wave cases; (b) duration means the duration in days of each individual heat wave; (c) season duration—the period during which the heat waves were recorded, indicating the first and last date of the heat wave.
The number of heat waves during the warm season was indicated by the number of cases when the maximum air temperature was higher than Tmax ≥ +25 °C for more than 3 days. The number of tropical nights (TNs) during the season was estimated when the air minimal temperature at night was Tmin ≥ +20 °C. The number of days of extreme dangerous heat (EHWs) was determined by counting all days when the maximum air temperature was ≥+30 °C. The extreme severe heat wave (SHW) was defined when the maximum air temperature was equal to or higher than 30 °C for 3 consecutive days or more.
Several indicators reflecting exceptional thermal conditions were selected for air temperature heat wave research on the PR Baltic coast: (a) the number of days when the maximum daily air temperature exceeded ≥+25 °C for more than 3 days; (b) the number of heat wave events; (c) the number of days when the minimum air temperature was higher than ≥+20 °C (tropical nights); (d) the number of days when the maximum air temperature ≥+30 °C was observed for more than 2 days; (e) the number of days when the maximum air temperature was Tmax ≥ +30 °C for more than 3 days; (f) the number of extreme heat wave events. Statistical data lines were compiled from daily hourly data from Klaipeda and Nida meteorological stations from 1993 to 2013 every 3 h and from 1994 to 2022 every 1 h. The monitoring data from the Palanga meteorological aviation station was used every 3 h from 1993 to 2022. The daily maximum air temperature (Tmax) and minimum (Tmin) are selected from these hourly data. Nighttime is selected from 21:00 to 06:00, and daytime is from 06:00 to 21:00, respectively.
The line trend analysis has been applied to identify the long-term tendencies that are important in the analysis of the irregular fluctuations of high magnitudes that are characteristic of extreme climatological events. Linear regression was applied to study trends, and the quality of the regression was assessed by the determination coefficient (R2) and the Student’s t-test.
Line regression is the popular technique in climatology used for predictions [37]. The rise in global temperatures, sea surface temperature (SST), rising sea levels, and frequent natural disasters have made it difficult to understand and predict these global climate phenomena. The concept of statistically solving simple linear regression is an empirical approach, and it can solve the tasks by considering the historical data set of the climate value parameters. The relationship between the independent and dependent variables is explained using the linear expression:
y = w1x1 + b,
where y is the dependent variable (output value), x1 is the independent variable (input value), w1 is the weight for the independent variable (regression coefficient), and b is the bias [38].
The coefficient of determination (R2) measures how well data can be represented in the regression line. It can define the strength and direction of the relationship between the dependent and independent variables. The coefficient of determination R2 (r-squared) of a linear regression helps to determine the strength of the relationship, as the mathematical root of it helps to calculate the correlation coefficient. According to the regression equation, we can preliminarily see that the relationship between two variables is more significant when the coefficient of determination is >0.25. The regression coefficient shows what changes took place during the year. Therefore, this method is popular for calculating and evaluating forecasts of climate parameters.
The linear regression method in climatology is usually used to describe the prevailing trends of climate change indicators. Climate change is characterized by fluctuations. Line regression helps to reject the annual or seasonal fluctuations characteristic of the climate. In this paper, the statistical series of data consists of the number of heat waves, tropical nights, and changeable days per year. The change in these parameters depends on the air temperature change in the summer months (June, July, and August).
Adapted climatographic methods for assessing the geographical spread of heat waves and tropical nights on the Baltic Sea coast. In the analysis of the effect of the land surface temperature on the formation of tropical nights in the Baltic Sea Seaside Curonian Spit subregion, water surface temperature data was used. To evaluate how SST affects the formation of tropical nights, the method of day-night mean temperature differences is applied. The MODIS-Aqua_L3m_SST4 day-time sea surface (DSST) and night-time sea surface (NSST) data were used for comparison. Nighttime sea data: Aqua MODIS Global Mapped 4 µm Nighttime Sea Surface Temperature (SST4) data, version R2019.0. MODIS (or Moderate Resolution Imaging Spectroradiometer) were a key instrument aboard the Terra (EOS AM) and Aqua (EOS PM) satellites. The MODIS Aqua daytime land surface temperature data [39] was also used to estimate and map the daytime and nighttime land surface temperature differences. Land data: GLDAS Noah Land Surface Model L4 3 hourly 0.25 × 0.25 degree V2.1 (GLDAS_NOAH025_3H). More information can be found on the GLDAS Project site.

3. Results

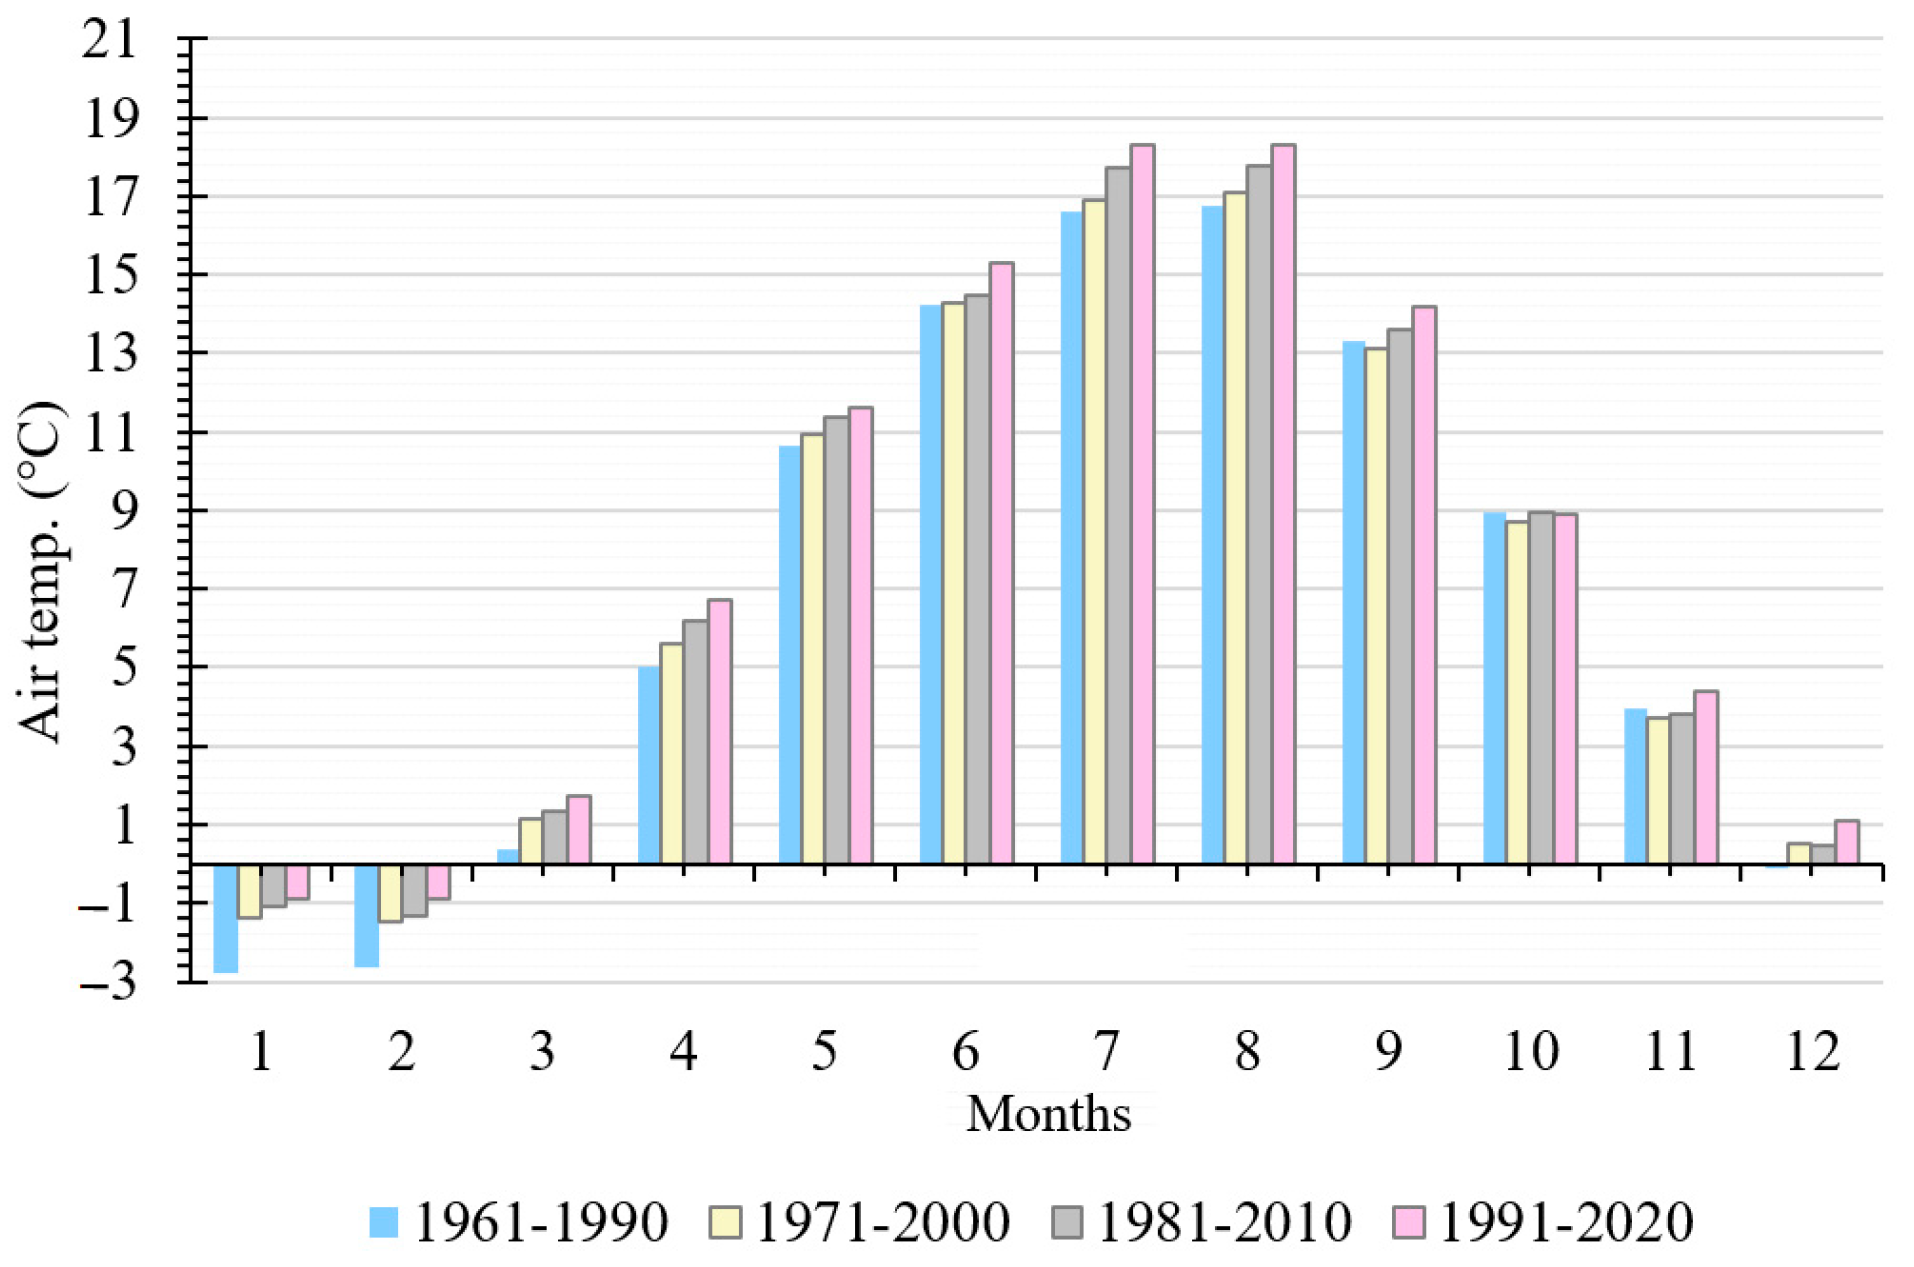
3.1. Long-Term Air Temperature Change in the Baltic Seaside Region
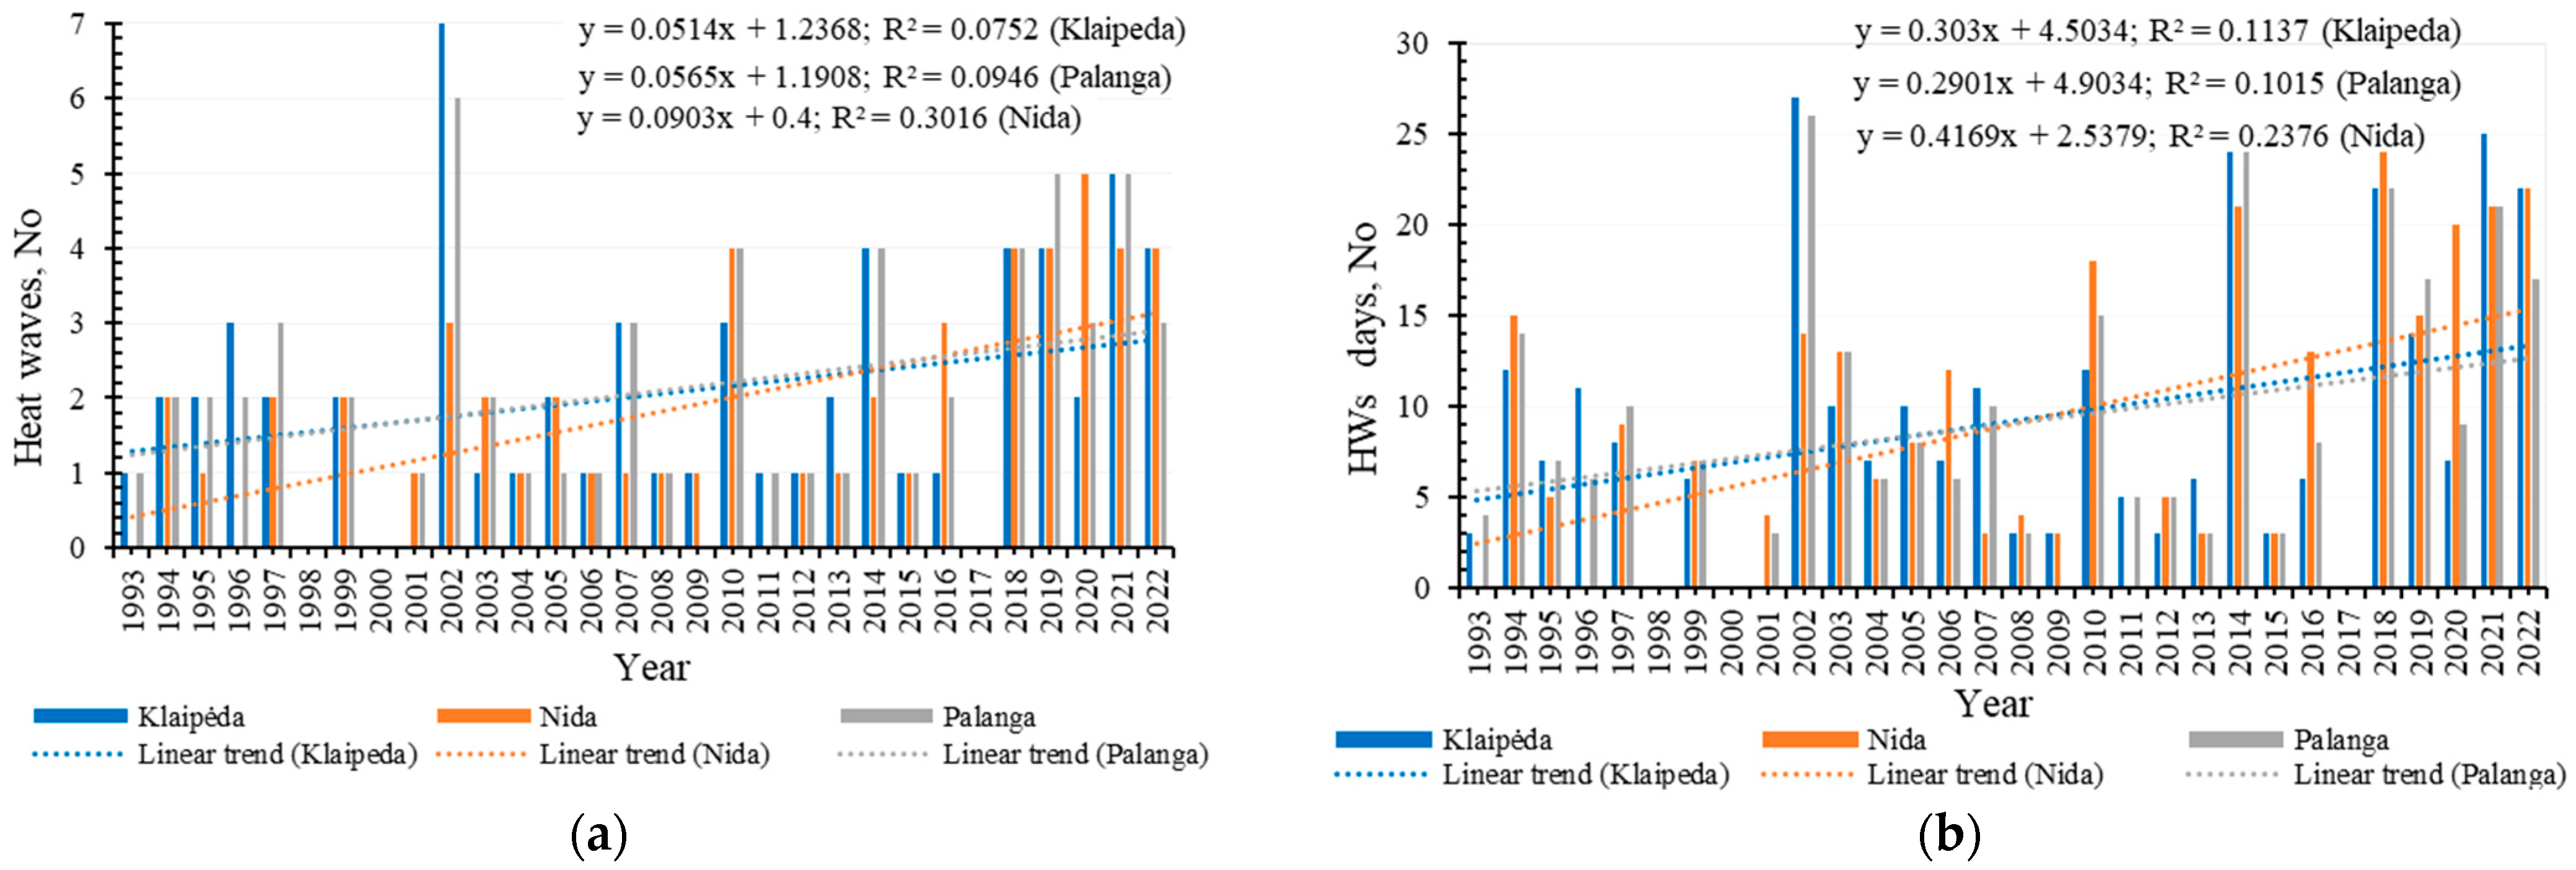
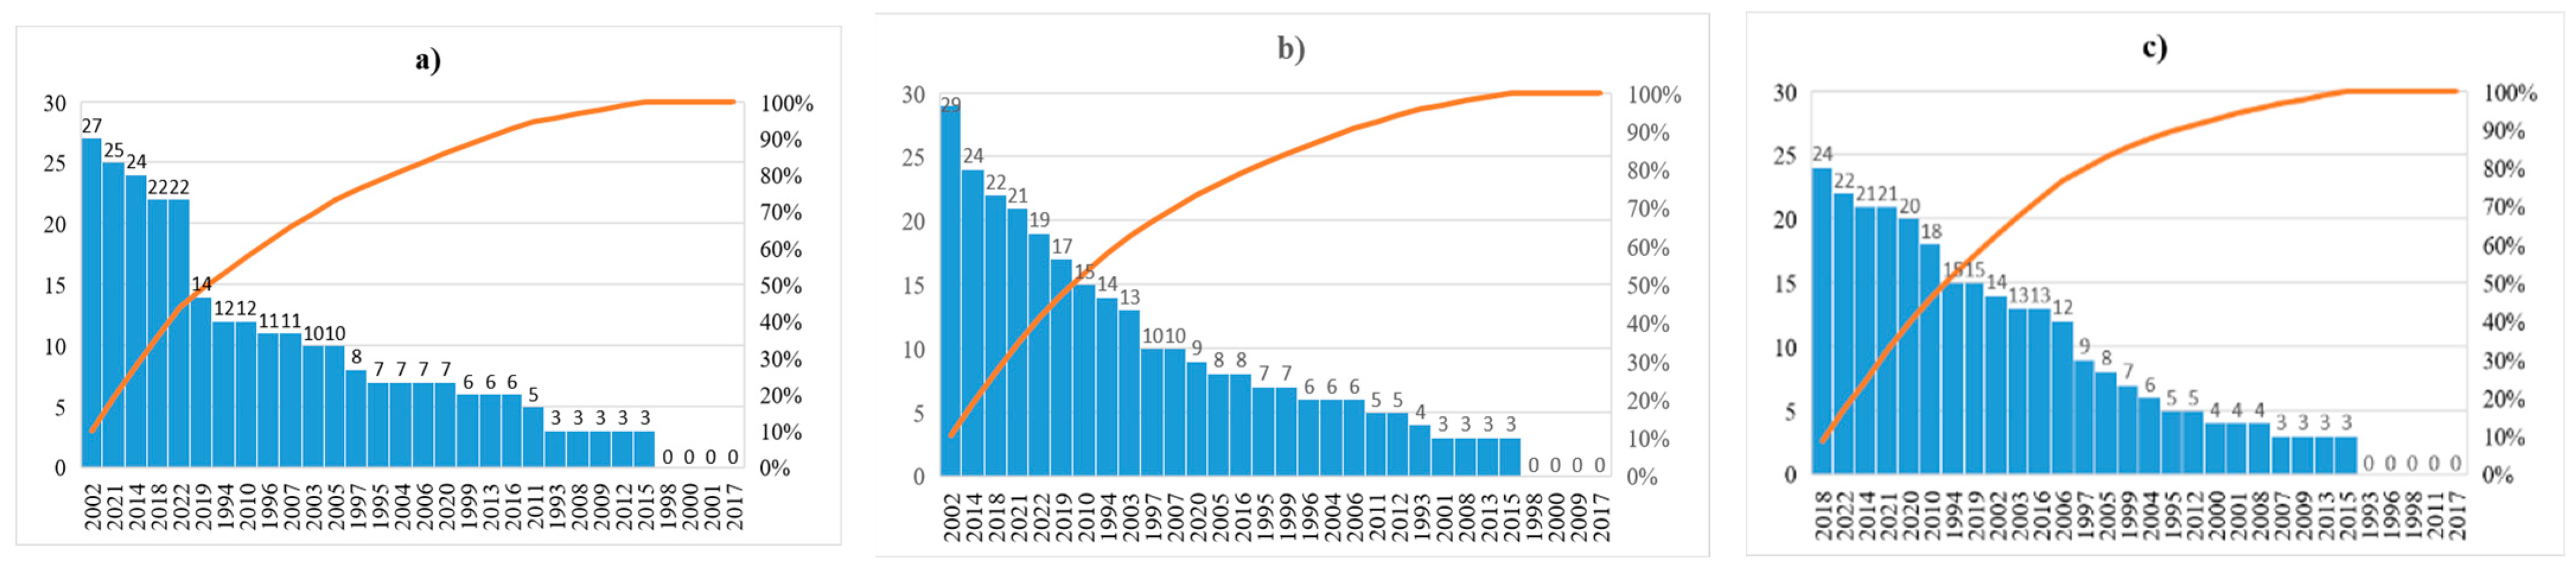
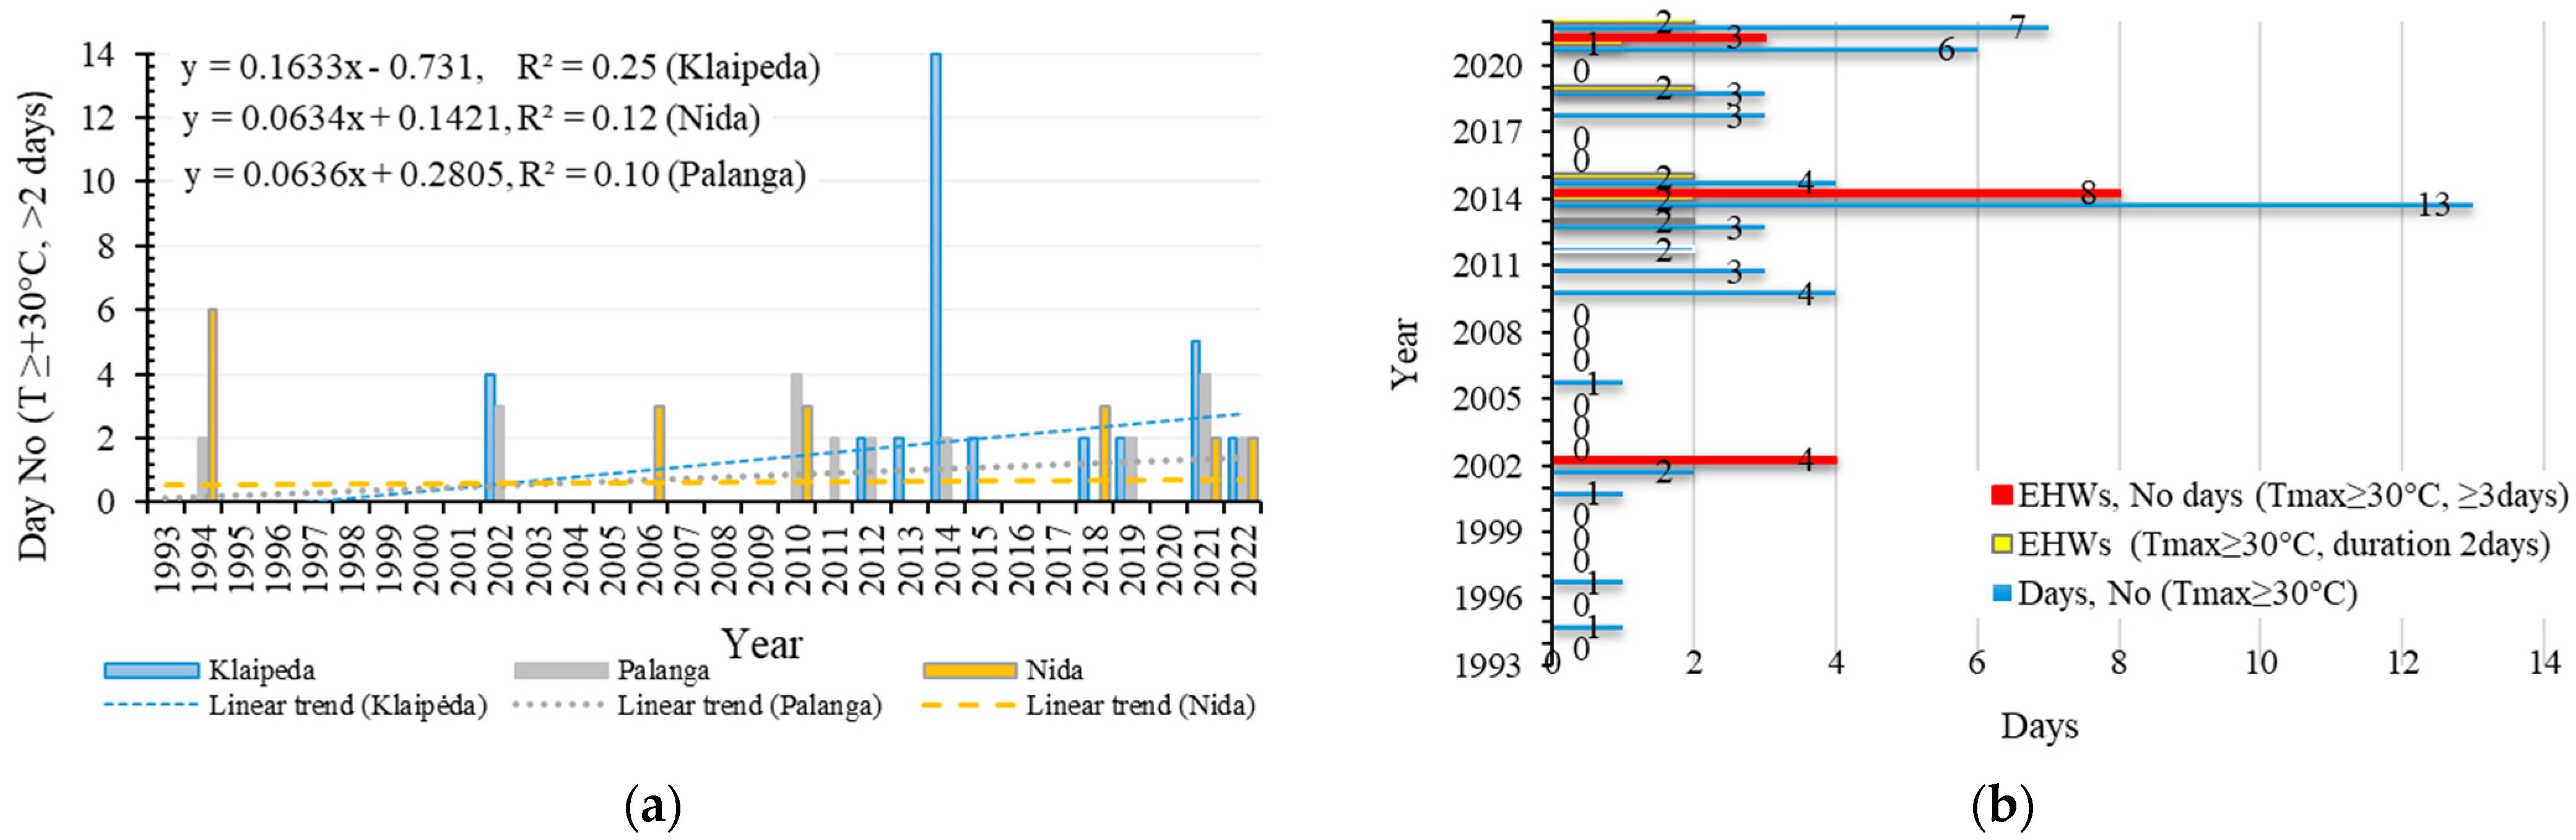
As the climate changes, the air temperature in the Southeast Baltic Sea region has been warming. The average annual air temperature on the Lithuania Seaside of the Baltic Sea increased by 1.2 °C from 1961 to 2020 (Table 2). A consistent increase in air temperature is observed when comparing the values of the climate standard. In each climatic period, the average annual standard climate norm rose by about 0.4 °C. Climatological Standard Normals (CLINO) are averages of climatological data computed for the following consecutive periods of 30 years [36]. Comparing the CLINO of the air temperature for each month, we can see (Table 2, Figure 2) that the air temperature warms up the most in winter, spring, and summer. Summers became significantly hotter (Table 2, Figure 2). The air temperature increased during the summer by an average of 1.5 °C (June—+1.1 °C, July—+1.7 °C, August—+1.6 °C) comparing the period 1991–2020 with 1961–1990 (Table 2). Rising air temperatures increase the probability of more frequent extreme events, including heat waves and tropical nights.
In the marine climate region, the average air temperature and its maximum values increased by about 0.5 °C (Figure 1) compared to the last three decades (1981–2010 and 1991–2020). Compared to the continental part of Lithuania, the maritime climate regions have a similar shift in air temperature. According to the data of the Lithuanian hydrometeorological service, in the previous climate period (1981–2010), the average temperature of the Lithuanian was 6.9 °C, and in the latest period (1991–2020), it reached 7.4 °C [40]. Summer days air temperature of more than ≥25 °C throughout Lithuania on average was observed for 21 days per year in the period 1961–1990, and in the last climatic period (1991–2020)—31 days per year [40]. As the climate changes and the air temperature warms, it is predicted that extreme situations will become more frequent in the future, as will the recurrence of short-term heat waves.

3.2. Heat Waves

The number, intensity, and duration of days of heat waves are increasing in the Southeastern Baltic Sea coast, and since 2018 until 2022, this extreme event of HWs has been recorded annually. Heat waves may have influenced the rise of the average and maximal values of air temperature during the summer in the southeastern part of the Baltic Sea. The Pearson correlation coefficient (r) between the average summer air temperature of the Klaipeda meteorological station and the number of days of a heat wave (when ≥25 °C) is 0.82, on tropical nights—0.47, on hot days (when ≥30°C)—0.63.
The Southeastern Baltic Sea coastal area is generally less exposed to severe heat spells; during the last decade, however, record-breaking heat waves have hit the region. The years with a record number of heat waves in the study period were 2002, 2010, 2014, 2018, 2021, and 2022 (Figure 3 and Figure 4). During the study period (from 1993 to 2022), the number of heatwave cases (Figure 3a) and the number of HW days (Figure 3b) when the air temperature was ≥25 °C increased in all cities analyzed. Data from the Nida meteorological station, which represents the climatic subregion of the Curonian Spit, show a larger and more significant trend of heatwaves and days (when T ≥ 25 °C) growing (Figure 3). In the Curonian Spit sub-region, the number of HWs is smaller, but their duration in days is longer during the extreme meteorological event.
The meteorological data of the Palanga and Klaipeda stations, which represent the climatic subregion of the sea coast, show a similar trend of growth in the number of heatwave cases and days. The maximum number of heat waves and the number of days when the air temperature rises ≥+25 °C and lasts longer than 3 days were observed in 2002 (Figure 4a,b).
The average duration of an HW is 9 days in the Lithuanian Baltic Seaside region. The median corresponds to HWs of 6–7 days duration during the warm period of the year from May to August. During the entire research period (1993–2022), there were an average of 2 observed heat waves per year, but in the last period of 2018–2022, the number of heat waves doubled. In the period 2018–2022, 3–5 heat waves were recorded per year in the Lithuanian Baltic Seaside region, and the total duration of HWs reached an average of 19 days during the warm period of the year.
Although there is an increasing trend of heat waves in all stations of the Seaside region, the recorded sub-regional differences. The record year and the number of hot days vary among subregions. For example, although the Sea Coast sub-region recorded the most heat wave days in the summer of 2002 (Figure 4a,b), in the Curonian Spit subregion, the record for heat wave days (HWs) was 2018 (Figure 4c).
In the Seaside (Maritime) climatic region area, the record number of days of heat waves (when Tmax ≥ 25 °C) was recorded last summer in 2022. The hot days for HWs in 2022 were 25% more than average (Figure 4). Based on the data of the Lithuanian Hydrometeorological Service [41], the average air temperature in August in Lithuania (20.4 °C) was the warmest since 1961 (the previous record was 20.0 °C in 2002). Similar results about extreme heat in 2022 were published by Copernicus data analysis results. Most of Europe experienced a larger number of ‘warm daytimes’ in 2022 than average, with up to 30% more observed in southwestern and western areas [42]. The average temperature over Europe in 2022 was the highest on record for both August by substantial margins of 0.8 °C over 2018 for August and 0.4 °C over 2021 for summer [42]. Globally, the average August 2022 temperature was 0.3 °C higher than the 1991–2020 average for the month, the joint third warmest August on record [42].
The beginning and end of a heatwave are important indicators when analyzing its distribution over time. The heatwave season covers the four warmest months of the year, from May to August (Figure 5). In the Lithuanian Baltic Seaside (Figure 5a), the earliest HWs were recorded on May 3 in the sea coast subregion, and the latest ones ended on August 28th. The Curonian Spit subregion (Figure 5b), surrounded by the Baltic Sea and the Curonian Lagoon, has the earliest heat waves recorded on May 27th and the latest on August 28th. Most heatwaves are recorded in the warmest months of July and August (Figure 5). According to trends, heat waves are beginning earlier over the years, and the extended end of the HWs season is being recorded constantly. The longest heatwave seasons were in 2002 and 2019.

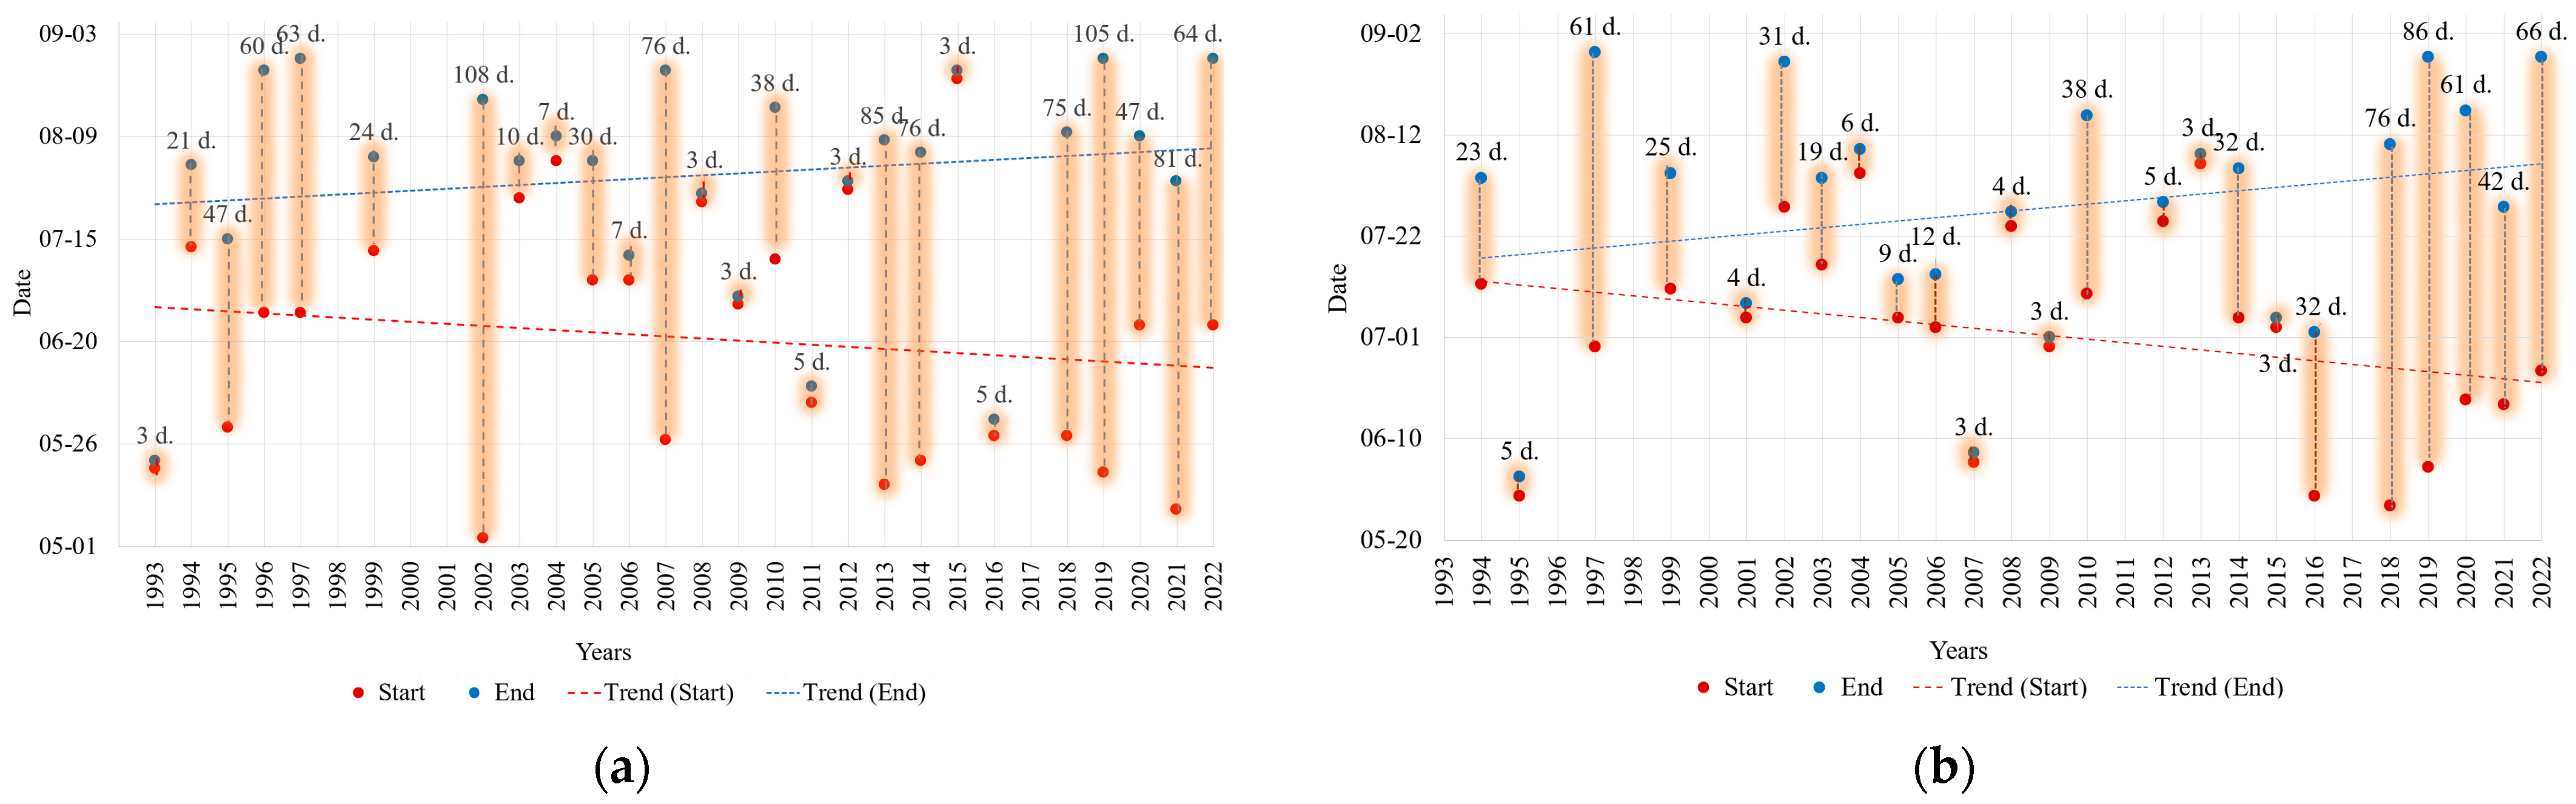
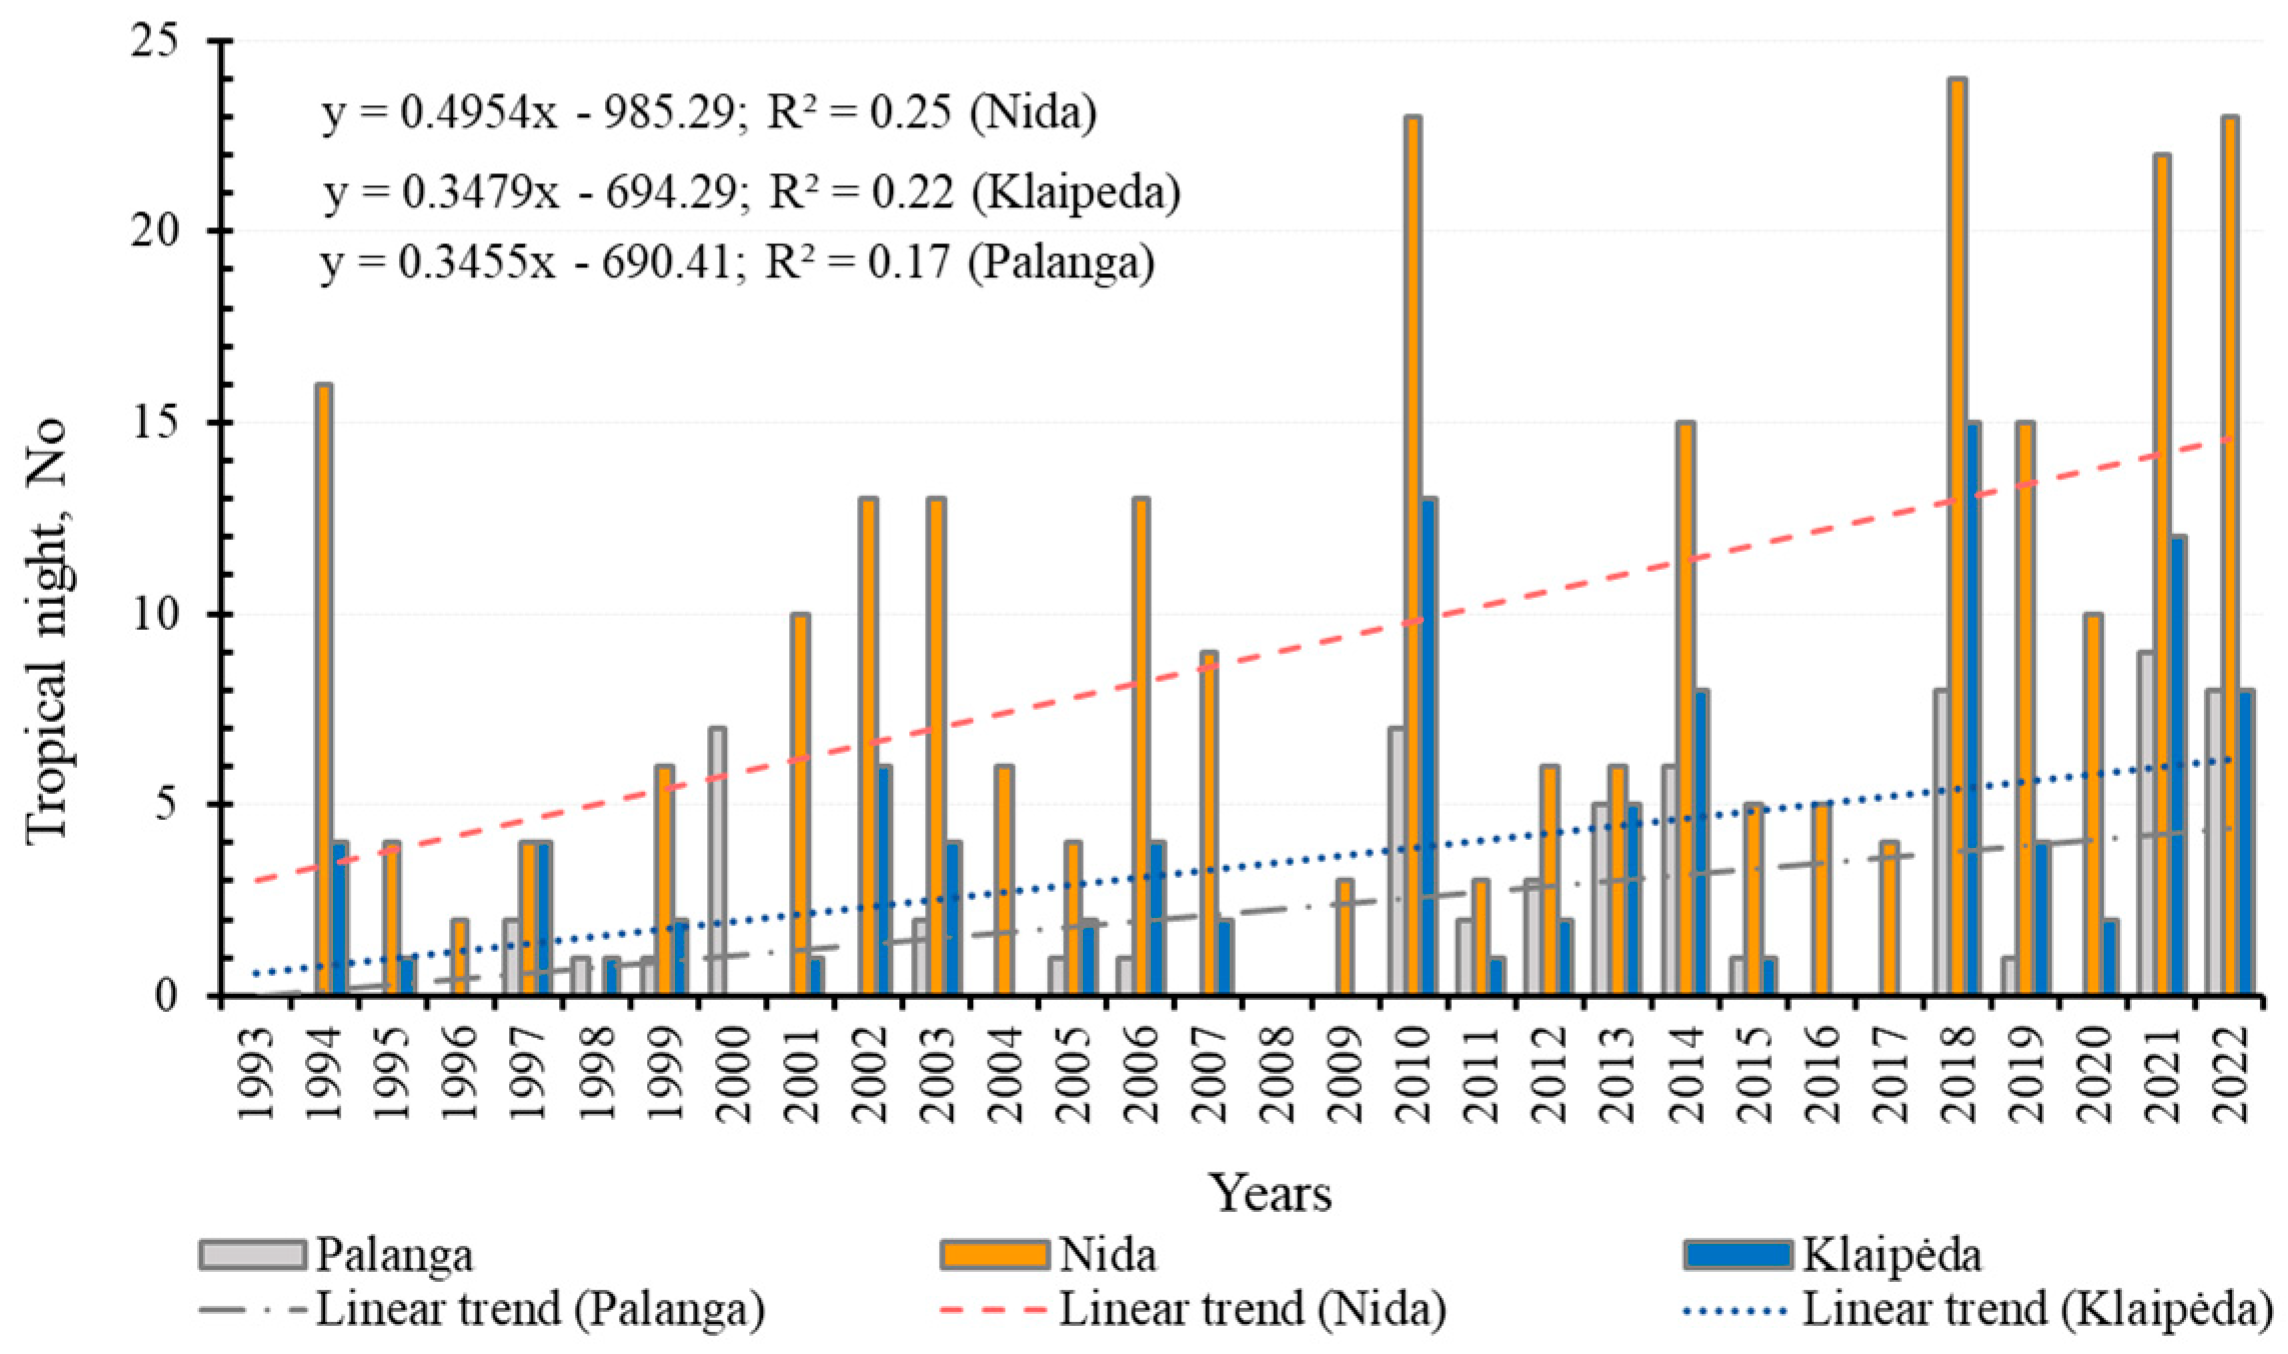
3.3. Tropical Nights

When the land and water surfaces are heated, tropical nights (Tmin ≥ 20 °C) are also often recorded during heat waves. Tropical nights are increasingly recorded on the coast of Lithuania when the minimum diurnal air temperature is ≥+20 °C even in the coldest hours of the night before dawn. During the study period (1993–2022), the number of tropical nights (TNs) increased in the SE part of the Baltic Sea (Figure 6).
In the Seaside climate region, the number of tropical nights grew the most in the Curonian Spit subregion. The number of TNs in the resort of Nida settlement in this sub-region is significantly higher compared to other cities of the Baltic Seaside (Figure 6). More than 20 tropical nights per year at Nida resort were observed in 2018, 2021, and 2022. At the same time, there were almost 2–3 times fewer tropical nights in Palanga and Klaipeda (Figure 6).
Microclimatic factors could have had the greatest influence on such differences. The Curonian Spit subregion is surrounded by the sea and the lagoon. The Nemunas is one of the largest rivers in the Baltic Sea and flows into the central part of the Curonian Lagoon. The Nemunas River flows through the southwestern part of Lithuania, where it is somewhat warmer compared to the rest of the country. The results of the study show that the sea waters, lagoon waters, and inflowing warm waters of the Nemunas River surrounding this settlement do not allow the night air temperature to cool down more. This results in a greater number of tropical nights in the resort area of the Curonian Spit. There is also a greater influence of the coastal lowlands in the sea coast subregion on the formation of tropical nights. The influence of the sea dominated in this marine climate subregion would be a bit deeper elsewhere in Lithuania if the Žemaičiai Highlands did not start.
The period (10–18 June 2019) during the formation of heat waves and the hottest tropical nights was analyzed in more detail (Figure 7). Due to the dominance of heat waves, the heated Baltic Sea and the Curonian Lagoon have a “warming” effect on the Curonian Spit resort. In order to ascertain how the surface temperature of the sea and the lagoon (SST) affects the formation of tropical nights, the calculation of the difference of the day (DSST) and night (NSST) average water surface temperature (DSST-NSST = ±TΔ) was applied. The 4 km grid MODIS-Aqua L3m daytime water surface (DSST) and nighttime water surface (NSST) data [39] were used for comparison. Larger differences in NSST and DSST are formed in the shallow Curonian lagoons (Figure 7a). When forecasting tropical nights in the future, it is also necessary to evaluate the heat input of the Nemunas River waters. Because the biggest differences are evident in the central part of the lagoon, where the Nemunas River flows (Figure 7). The discharge of the Nemunas River is about ~22 km3 per year [43], and it is one of the largest rivers in the Baltic Sea Basin. The surface waters surrounding the Curonian Spit play the role of an “air heater”, higher humidity prevails, so the number of tropical nights is higher than in other subregions of the Seaside region. During heat waves, the differences between day and night surface temperatures are the smallest on the coasts of the Baltic Sea and the Curonian Lagoon (Figure 7b). During heat waves, such conditions form tropical nights.
During a tropical night, the air humidity increases, and the sensible air temperature is felt by a person. Sensory temperature is often referred to as the temperature felt by the human body. The actual air temperature is shown by the heat index, whose size depends on the air temperature and relative humidity. In Lithuania, the Humidex index created by the Canadian Atmospheric Center [44] is usually applied, as it is the most appropriate for the geographical latitude and physical geographical conditions. When the nightly minimum air temperature is ≥+20 °C and the relative humidity is higher than 60%, the sensory temperature is about 3–4 °C higher than the actual measured one. The hottest tropical night was recorded in the city of Nida on 13 June 2019, when the minimum night air temperature at night was 24.6 °C (Figure 8a) and the relative humidity reached 78% (Figure 8b). According to the HUMIDEX index table adopted in Lithuania [33,45], the sensory temperature at that time was about 32 °C, which is over 7 °C higher than the measured one. At such a temperature, there is a noticeable effect on human health and discomfort. Tropical nights are usually formed in the case of a longer-lasting heat wave. Long-lasting simultaneous heat waves and tropical nights can be dangerous to human health. Recently, during heat waves, the maximum air temperature often rose above +30 °C, reaching the second extreme heat danger level.

3.4. Dangerous Heat and Severe Heat Waves

The number of days with extreme air temperatures and dangerous heat (Tmax ≥ +30 °C) is increasing on the Baltic coast (Figure 8a and Figure 9a). Extremely dangerous heat (EHW) days do not occur every year, but in the last decade, a more frequent recurrence has been observed for several years in a row (Figure 9a). It should be noted that only in the 21st century are cases of dangerous heat more often observed when the air temperature T ≥ +30 °C is observed for more than 2 days in a row (Figure 9b). Extremely severe heat waves (SHWs), when the air temperature Tmax ≥ +30 °C prevailed for more than 3 days in a row, were recorded in Klaipeda in 2002, 2014, and 2021 (Figure 9b).
In the port-city of Klaipeda in 2014, dangerous heat waves of severe heat were observed two times, when Tmax ≥ +30 °C was ≥3 days in a row. In the same year 2014, a single dangerous severe heat wave (SHW) was recorded that lasted even 5 days in a row (from 26 July 2014 to 30 July 2014). This is the only case that has existed since 1961. According to the previous research results, such stiff heat when 5 days in a row ≥+30 °C in 1961–1995 period was not in the Klaipeda [29].
In the Lithuanian Baltic Seaside region, during the period 1993–2022, the most days of extreme heat waves, when the air temperature Tmax ≥ +30 °C lasted for ≥3 days, were in the urbanized port city of Klaipeda (18 days). SHW days were fewer in resort areas with a less urbanized landscape (7 days in Palanga and 15 days in Nida). There were 5 extreme heat waves in the Sea Coast subregion in Klaipeda, 2 in Palanga, and in the Curonian Spit subregion in Nida-6 extreme heat waves.

4. Discussion

The implications of the present study can be framed within two scopes: (in) climatological trend identification and (ii) integration of the meteorological phenomena of heat waves and tropical night to extreme event management.
The number, intensity, and duration of heat waves are increasing in the Southeastern Baltic Sea. The years with a record number of heat waves in the study period were 2002, 2010, 2014, 2018, 2021, and 2022. From 2018 to 2022, this extreme event of HWs was recorded yearly. Similar cases of increasing heat waves are recorded in a number of countries across the world, including the European continent. The Baltic Sea area is generally less exposed to severe heat spells compared with regions such as the southern parts of Europe [4]. During the last decade, however, record-breaking heat waves have hit the region, namely those in 2010, 2014, and 2018 [3,46,47]. Our results provide insight on the issue of heat waves and whether, and how, changes in trends in mean and day maximum air temperature statistics can be related to changes in extreme statistics with people feeling more stressed. In summer, there are increasing days with moderate heat stress (ranging from +26 °C to +32 °C), according to the universal thermal climate index (UTCI). In the future, heat waves are projected to occur more often and to become longer and more intense [4].
The inter-annual variability and trends in the magnitude, temporal and spatial extent, and frequency of heat waves in the Baltic Sea drainage basin are mainly driven by large-scale fluctuations in atmospheric circulation, anthropogenic climate change, and associated regional increases in mean temperature that exceed the global average warming [4,9,15,48,49]. We can also assume that a faster climate warming up in European seas, which started in the 21st century, can impact more often heat waves, including in the Baltic Sea area. The global sea surface temperature is more than 1 °C higher now than 140 years ago, and the sea surface temperature (SST) in European seas is increasing more rapidly than in the global oceans [50].
The increase in extreme heat waves is affected by climate change, increasing summer air temperatures, and the dynamics of air masses in the South-East Baltic Sea region, which determines the advection of warmer southern air masses. Periods when the maximum air temperature is higher than 25 °C for three consecutive days or more are a good indicator of a unified atmospheric process, as the anticyclonic pressure field, for example, in Lithuania’s case, accounts for more than 90% of the duration of hot periods [31]. The synoptic situation favoring a heat wave is characterized by the presence of a powerful warm anticyclone covering the entire troposphere, producing a blocking situation over a region [51]. Atmospheric blocking refers to persistent, quasi-stationary weather patterns characterized by a high-pressure (anticyclonic) anomaly that interrupts the westerly flow in the midlatitudes [4]. The climate of the Baltic Sea region is strongly related to the atmospheric large-scale circulation [11,52]. The studies on the Baltic Sea climate show different climate trends and changes, and it is assumed that these changes are induced by changes in atmospheric dynamics and wind directions [11,48,53]. However, large-scale flow characteristics are among the main drivers of the connection between local processes and global variability and change [4]. Thus, it is essential to investigate the changes in large-scale flow.
In recent decades, an increase in the number of tropical nights has been observed on the coast of the Southeast Baltic Sea. Most such nights were observed in the Curonian Spit, which is surrounded by the waters of the Baltic Sea and the Curonian Lagoon. The Nemunas River flows into the Curonian Lagoon, whose warm waters increase the temperature of the lagoon water during the summer heat wave periods. The results of the NSST and DSST comparison showed that the waters of the Nemunas River have a significant impact on the SST of the central part of the shallow lagoon and the Curonian Spit subregion. On sea coasts, higher air humidity increases the sensible air temperature. Therefore, the impact of heat waves and tropical nights on human health may be greater than in the continental land area.
The increase in the number of tropical nights on the Southeast Baltic coast may be related to the climatic warming of air and sea surface temperatures (SST). This is related to global climate change. For the three considered scenarios, the IPCC AR5 reported a likely increase in global mean air temperature for the period 2081–2100 relative to 1986–2005 in the likely range (5th to 95th percentile of CMIP5 models) that mean air temperature will change are 1.0  °C (RCP2.6), 1.8  °C (RCP4.5), and 3.7  °C (RCP8.5) [15] (BACC 2015). The Baltic Sea is one of the maritime areas with the highest recorded near-surface air temperature increases during the past century, and this increase is almost certain to continue [48]. During the past century, an approximate air temperature increase of 1 °C was observed over the Baltic Sea region [14,15,48]. The entire water column of the Baltic Sea has warmed over the period 1950 to 2020, and the trend is strongest at the surface layer, which has warmed by 0.3–0.4 °C per decade−1, noticeably stronger since the mid-1980s [52]. According to the assessments of the SST trends in the SE Baltic Sea and in the Curonian Lagoon, the SST has risen by 0.6 °C in the coastal zone in the last decades, and since the 1990s, it has averaged 0.04 °C per year [43,53,54]. The summer conditions in the SE Baltic Sea with sea surface temperature (SST) ≥ 20 °C generally last much longer since the end of the 20th century [55], and this is apparently associated with an increase in extreme events and the frequency of hot summers.
In the Baltic Sea, sea surface heat waves have also started to be recorded, which are related to warming summers and the duration of weather heat waves. Baltic Sea water heat waves (MHWs) are defined as periods of SST  ≥20 °C lasting at least 10 consecutive days [56]. Marine heat waves are extreme climatic events observed around the world, commonly defined as prolonged, discrete anomalously warm water events that are classified by their duration, intensity, rate of evolution, and spatial extent [57]. In recent decades, the Baltic Sea region has warmed faster than average global warming [58,59] or any other coastal sea [60], making it prone to marine heat waves [56]. The published scenario simulations confirm that air and seawater temperatures will continue to increase in the 21st century [56]. Such trends can affect the increase in the number of marine tropical nights when the maximal air temperature is higher than 20 °C during the night. In the future, more detailed studies analyzing the interactions between heat waves and marine heat waves are recommended.
The Baltic Sea region is an important destination for coastal and maritime tourism [61]. Ecosystem services distinguish coastal tourism as one of the most important services. The region’s tourism industry in the Baltic Sea employs approximately 640,000 people, based on 88 million visiting tourists, creating over 227 million registered overnight stays annually [62]. Due to the favorable maritime climate, it is believed that the demand for coastal tourism and resort services will increase in the future. In the Baltic Sea region, the coastal zone provides opportunities for a variety of tourist activities, which are concentrated in designated resort areas, spas, and also urban centers along the coastal line [62,63]. In the Southeastern Baltic Sea region, the mild coastal climate provides excellent conditions for the development of recreation and wellness activities. The resort areas of the Curonian Spit and Palanga have the largest number of visitors in the summer. With the prevailing extreme weather, it is expected that the maritime climate will be more favorable than the continental climate for people’s well-being and health. However, the increasing number of heat waves and tropical nights with higher air humidity on the Baltic coast may increase perceived heat and have an impact on human health.
A greater number of SHWs in Klaipeda coastal city can be amplified by the urban “heat island effect”. Klaipeda is a growing Lithuanian port city (~200,000 population). The coastal areas of Palanga and Nida are more suitable for resort business development, as there are fewer SHW days than in the port city of Klaipeda. In the future, more detailed research is needed and recommended on how heat waves affect urban landscapes and vegetation and what plants should form green spaces—”green urban islands”—that mitigate the dangerous effects of climate change. Urban vegetation is in fact known to be an effective strategy to reduce heat intensity [64].
Complex phenomena of HWs and SHWs can have a significant impact on coastal ecosystems, affect ecosystem services, increase summer energy costs used for cooling, and affect the bioclimatic stress of people. More interdisciplinary research should be carried out in the future to assess the impact of heat waves on human health.
Our results show that tropical nights occur most frequently in late July and early August, which is consistent with the relatively high air humidity associated with the highest sea surface temperature in the coastal water systems. In the case of heat waves and tropical nights (TNs), the higher humidity in the maritime climate zone can exacerbate the health effects of heat-related stress. A lower air temperature during the night corresponds to lower thermal stress, allowing for the recovery of the human organism, but nevertheless, long episodes of heat exposure cause a load on the human thermoregulatory system day and night [18]. A heat wave’s most severe health impacts are often associated with high temperatures at night, which is usually the daily minimum. The trend of increasing occurrences and durations of heat waves and tropical nights established in the work confirms the need to adapt the health care and emergency management plans of coastal cities.
The World Health Organization indicated that not enough is still known about the health risks posed by heat waves and long-term exposure to higher temperatures. The Global Health and Climate Change Survey 2021 report states that heat waves and prolonged periods of extreme heat can pose a particular threat to human health, leading to illness and loss of life. More detailed biometeorological studies are needed in the future to help determine how extreme heat waves affect human health. Extreme weather conditions occur in different ways due to regional physical, geographical, and climatic differences. Extreme heat also worsens health-determining environmental factors such as air, soil, and water [65]. In recent decades, heat waves (HWs) have received exceptional scientific attention due to their devastating effects on society and the environment [66]. The recent Intergovernmental Panel on Climate Change (IPCC) Sixth Assessment Report, which examines the physical scientific basis of climate change, concludes that “human-induced climate change is already influencing many weather patterns and climate extremes in all regions of the world”.
In order to define adequate adaptation and mitigation measures to reduce both the health risk and the negative economic impacts of heat waves, knowledge of the future frequency and intensity of such events is crucial [16]. Changes in the frequency and intensity of heat waves will have profound impacts on the natural environment and human society. For instance, the 2018 report in the Lancet entitled “Countdown on health and climate change: shaping the health of nations for centuries to come”, gives a very clear overview of the environmental changes already observed and their projected health impacts [67]. Over 70,000 excess deaths occurred in Europe during the summer of 2003 [68]. The same resource indicated that, according to new research, in the summer of 2022 in Europe alone, 60,000 additional people died due to extreme heat. The report of The European State of the Climate [42] reported that globally, the last 8 years have been the warmest on record, and 2022 was the fifth warmest year. These results call for a reevaluation and strengthening of existing heat surveillance platforms, prevention plans, and long-term adaptation strategies.
According to WMO data, new heat records will be announced in 2023: “Morocco set a new national temperature record of 50.4 °C in Agadir on 11 August, as temperatures crossed 50 °C for the first time. Turkey reported a new national temperature record of 49.5 °C on 15 August, beating the previous record of 49.1 °C set in July 2021. Many parts of the Middle East also saw temperatures above 50 °C”. WMO stresses the need to follow authoritative warnings from national meteorological and hydrological services to stay safe (https://public.wmo.int/en/media/news/extreme-weather-new-norm (accessed on 23 August 2023)).
Due to climate change, disasters are becoming more frequent and affecting more people; therefore, creating systems to predict, prevent, and efficiently respond to disasters is becoming an urgent priority. Research indicated the trends of heatwave frequency and duration in time and space that will help to develop and adapt effective management strategies to create disaster resilience.
Climate change adaptation on the local level is of increasing relevance because of the regional variation in the effects of global climate change [69]. Understandably, different countries have different warning systems for climate change and its health threats due to different physical, geographical, and climatic conditions. In most countries, only designated national agencies, such as weather services or public health agencies, have the national responsibility to issue official heat warnings. For example, in Lithuania, the emergency management system is established in accordance with the order of the Minister of Environment. The public is provided with information about climate change and the threats it poses to human health. The information is updated and published on the website of the Health Education and Disease Prevention Center (http://www.smlpc.lt/ (accessed on 22 August 2023)). Information about heat waves is also provided by the Center for Extreme Health Situations of the Ministry of Health (http://www.essc.sam.lt (accessed on 22 August 2023)) and the Lithuanian Hydrometeorological Service (http://www.meteo.lt (accessed on 23 August 2023)). In the event of an exceptional situation, the public is informed by means of mass media—radio, television, press, and the internet. However, so far, only severe heat waves (SHWs) have been included among the indicators. The problem is probably that heat waves are a very rare phenomenon in Lithuania. For example, many residential houses still do not have cooling systems. More research is needed in the future on how heat waves and their duration affect people’s performance and stress state. The number of heat wave cases and their duration are increasing. Therefore, it is necessary to prepare a recommendation based on research to include not only SHWs but also longer-lasting heat waves and tropical nights among the metrological phenomena that pose threats to human health.
Regional and local research by scientists is necessary for the management of extreme situations and the legal approval of criteria and indicators. Based on them, recommendations and information are being prepared for policymakers in the management of climate change-related threats.

5. Conclusions

According to trend research, it has been established that the number and duration of heat waves and tropical nights are increasing on the Southeast Baltic Sea coast.
Air temperature climatic rise is one of the most important climate variable indicators. The air temperature on the South-Eastern Baltic coast has increased by 1.2 °C during the recent climatic period (1991–2020) compared to the average climatic air temperature norm of the 1961–1990 period (6.8 °C). A rise in average air temperature is observed in all seasons. Extreme heat waves and their impact on various marine coastal ecosystems and their services should be analyzed in the future, in all seasons.
In the southeastern part of the Baltic Seaside coast (in the period 1993–2022) was identified the rising trend of the most dangerous heat days and severe heat waves (when the air temperature Tmax ≥ +30 °C lasted for ≥3 days). Tropical nights are increasingly recorded on the coast of the Baltic Seaside when the minimum night air temperature is ≥+20 °C.
Heat waves may occur more frequently in the future due to climate change in the Baltic Sea coastal areas, where people are less adapted to similar extreme weather conditions. There are no social, economic, recreational, ecosystem, or human life activities that would not be influenced by the air temperature, including extreme events like heatwaves and tropical nights. Assessing heat wave trends helps society apply preventive measures and prepare for potential losses to both human health and the economy.

Author Contributions

Conceptualization, I.D., I.S., R.D., E.V., L.R. and D.V.; methodology, I.D., I.S. and R.D.; software, I.S., R.D. and E.V.; investigation, I.D., I.S., R.D. and L.R.; writing and editing, I.D., R.D., I.S., E.V. and L.R.; visualization, I.D., I.S., R.D. and E.V.; supervision, I.D and R.P. All authors have read and agreed to the published version of the manuscript.

Funding

This research has received no external funding.

Institutional Review Board Statement

Not applicable.

Informed Consent Statement

Not applicable.

Data Availability Statement

The data presented in this study are available on request from the corresponding author.

Acknowledgments

The authors are grateful to the Lithuanian Hydrometeorological Service under the Ministry of Environment, which so kindly facilitated the meteorological observation data necessary for this study. The results of the study contribute to the assessment of part of the coastal climate resources during the Lithuanian Science Council (LMT) project LUGISES. “Effectiveness and safety of using Lithuania’s unique natural resources to improve the mental and physical health of the body related to stress”/S-REP-22-6. The work contributes to the Baltic Earth (Earth System Science for the Baltic Sea Region) activities.

Conflicts of Interest

The authors declare no conflict of interest.

References

  1. Allen, M.R.; Dube, O.P.; Solecki, W.; Aragón-Durand, F.; Cramer, W.; Humphreys, S.; Kainuma, M.; Kala, J.; Mahowald, N.; Mulugetta, Y.; et al. Framing and Context. In Global Warming of 1.5 °C; An IPCC Special Report on the Impacts of Global Warming of 1.5 °C Above Pre-Industrial Levels and Related Global Greenhouse Gas Emission Pathways, in the Context of Strengthening the Global Response to the Threat of Climate Change, Sustainable Development, and Efforts to Eradicate Poverty; Masson-Delmotte, V., Zhai, P., Pörtner, H.-O., Roberts, D., Skea, J., Shukla, P.R., Pirani, A., Moufouma-Okia, W., Péan, C., Pidcock, R., et al., Eds.; Cambridge University Press: Cambridge, UK; New York, NY, USA, 2018; pp. 49–92. [Google Scholar] [CrossRef]
  2. IPCC. Climate Change 2022. Impacts, Adaptation and Vulnerability. Summary for Policymakers, Technical Summary and Frequently Asked Questions. Working Group II Contribution to the Sixth Assessment Report of the Intergovernmental Panel on Climate Change. 2022. Available online: https://www.ipcc.ch/report/ar6/wg2/downloads/report/IPCC_AR6_WGII_SummaryVolume.pdf (accessed on 16 August 2023).
  3. Liu, X.; He, B.; Guo, L.; Huang, L.; Chen, D. Similarities and differences in the mechanisms causing the European summer heatwaves in 2003, 2010, and 2018. Earths Future 2020, 8, e2019EF001386. [Google Scholar] [CrossRef]
  4. Rutgersson, A.; Kjellström, E.; Haapala, J.; Stendel, M.; Danilovich, I.; Drews, M.; Jylhä, K.; Kujala, P.; Larsén, X.G.; Halsnæs, K.; et al. Natural hazards and extreme events in the Baltic Sea region. Earth Syst. Dyn. 2022, 13, 251–301. [Google Scholar] [CrossRef]
  5. Schär, C.; Vidale, P.L.; Lüthi, D.; Frei, C.; Häberli, C.; Mark, A.; Liniger, M.A.; Appenzeller, C. The role of increasing temperature variability in European summer heatwaves. Nature 2004, 427, 332–336. [Google Scholar] [CrossRef] [PubMed]
  6. Clark, R.T.; Brown, S.J.; Murphy, J.M. Modeling Northern Hemisphere summer heat extreme changes and their uncertainties using a physics ensemble of climate sensitivity experiments. J. Clim. 2006, 19, 4418–4435. [Google Scholar] [CrossRef]
  7. Chan, P.W.; Catto, J.L.; Collins, M. Heatwave–blocking relation change likely dominates over decrease in blocking frequency under global warming. NPJ Clim. Atmos. Sci. 2022, 5, 68. [Google Scholar] [CrossRef]
  8. Fischer, E.M.; Schär, C. Consistent geographical patterns of changes in high-impact European heatwaves. Nat. Geosci. 2010, 3, 398–403. [Google Scholar] [CrossRef]
  9. Meier, H.E.M.; Kniebusch, M.; Dieterich, C.; Gröger, M.; Zorita, E.; Elmgren, R.; Myrberg, K.; Ahola, M.P.; Bartosova, A.; Bonsdorff, E.; et al. Climate change in the Baltic Sea region: A summary. Earth Syst. Dyn. 2022, 13, 457–593. [Google Scholar] [CrossRef]
  10. Galvonaitė, A.; Valiukas, D.; Kilpys, J.; Kitrienė, Z.; Misiūnienė, M. Climate Atlas of Lithuania. Vilnius. Lithuanian Hydrometeorological Service under the Ministry of Environment. 2013; 175p. Available online: http://www.meteo.lt/documents/20181/102884/Klimato+Atlasas+smal.pdf/08c97c20-bd46-4e65-a069-3a0774e4b748 (accessed on 7 February 2023).
  11. Bierstedt, S.E.; Hünicke, B.; Zorita, E. Variability of wind direction statistics of mean and extreme wind events over the Baltic Sea region. Tellus A Dyn. Meteorol. Oceanogr. 2015, 67, 29073. [Google Scholar] [CrossRef]
  12. Hurrell, J. Decadal trends in the North Atlantic965Oscillation regional temperatures and precipitation. Science 1995, 269, 676–679. [Google Scholar] [CrossRef]
  13. HELCOM. State of the Baltic Sea–Second HELCOM Holistic Assessment 2011–2016; Baltic Sea Environment Proceedings No. 155; HELCOM: Helsinki, Finland, 2018; 155p, Available online: http://stateofthebalticsea.helcom.fi/wp-content/uploads/2018/07/HELCOM_State-of-the-Baltic-Sea_Second-HELCOM-holistic-assessment-2011-2016.pdf (accessed on 26 September 2023).
  14. BACC Author Team. Assessment of Climate Change for the Baltic Sea Basin. Regional Climate Studies; Springer: Berlin/Heidelberg, Germany, 2008; 473p. [Google Scholar] [CrossRef]
  15. BACC II Author Team. Second Assessment of Climate Change for the Baltic Sea Basin. Regional Climate Studies; Springer International Publishing: Berlin/Heidelberg, Germany, 2015; 515p, Available online: https://link.springer.com/book/10.1007/978-3-319-16006-1 (accessed on 19 March 2023).
  16. Junk, J.; Goergen, K.; Krein, A. Future Heat Waves in Different European Capitals Based on Climate Change Indicators. Int. J. Environ. Res. Public Health 2019, 16, 3959. [Google Scholar] [CrossRef]
  17. Perkins, S.E.; Alexander, L.V. On the Measurement of Heat Waves. J. Clim. 2013, 26, 4500–4517. [Google Scholar] [CrossRef]
  18. Shevchenko, O.; Snizhko, S.; Zapototskyi, S.; Matzarakis, A. Biometeorological Conditions during the August 2015 Mega-Heat Wave and the Summer 2010 Mega-Heat Wave in Ukraine. Atmosphere 2022, 13, 99. [Google Scholar] [CrossRef]
  19. Koppe, C.; Jendritzky, G. Inclusion of short-term adaptation to thermal stresses in a heat load warning procedure. Meteorol. Z. 2005, 14, 271–278. [Google Scholar] [CrossRef]
  20. Ruuhela, R.; Jylhä, K.; Lanki, T.; Tiittanen, P.; Matzarakis, A. Biometeorological Assessment of Mortality Related to Extreme Temperatures in Helsinki Region, Finland, 1972–2014. Int. J. Environ. Res. Public Health 2017, 14, 944. [Google Scholar] [CrossRef]
  21. Kirch, W.; Bertollini, R.; Menne, B. (Eds.) Extreme Weather Events and Public Health Responses; WHO, Regional Office for Europe: Geneva, Switzerland; Springer: Berlin/Heidelberg, Germany, 2005; 303p. [Google Scholar]
  22. Keatinge, W.R.; Donaldson, G.C.; Cordioli, E.; Martinelli, M.; Kunst, A.E.; Mackenbach, J.P.; Näyhä, S.; Vuori, I. Heat related mortality in warm and cold regions of Europe: Observational study. BMJ 2000, 321, 670–673. [Google Scholar] [CrossRef] [PubMed]
  23. Park, J.K.; Lu, R.Y.; Li, C.F.; Kim, E.B. Interannual variation of tropical night frequency in Beijing and associated large-scale circulation background. Adv. Atmos. Sci. 2012, 29, 295–306. [Google Scholar] [CrossRef]
  24. Liukaitytė, J. Quantitative Assessment of Biometeorological Conditions in Lithuania. Ph.D. Thesis, Physical Sciences, Geography, Vilnius, Lithuania, 2011; p. 168. (In Lithuanian). [Google Scholar]
  25. Błażejczyk, K.; Epstein, Y.; Jendritzky, G.; Staiger, H.; Tinz, B. Comparison of UTCI to selected thermal indices. Int. J. Biometeorol. 2012, 56, 515–535. [Google Scholar] [CrossRef]
  26. Roffe, S.J.; Walt, A.J.; Fitchett, J.M. Spatiotemporal characteristics of human thermal comfort across southern Africa: An analysis of the Universal Thermal Climate Index (UTCI) for 1971–2021. Int. J. Climatol. 2023, 43, 2930–2952. [Google Scholar] [CrossRef]
  27. IPCC. Sixth Assessment Report: Climate Change 2021. The Physical Sciences Basis. Summary for policymakers. Intergovernmental Panel on Climate Change. In Climate change 2021: The Physical Science Basis. Contribution of Working Group I to the Sixth Assessment Report of the Intergovernmental Panel on Climate Change; Masson-Delmotte, V., Zhai, P., Pirani, A., Connors, S.L., Péan, C., Berger, S., Eds.; Cambridge University Press: Cambridge, UK, 2021; Available online: https://www.ipcc.ch/report/ar6/wg1/downloads/report/IPCC_AR6_WGI_SPM_final.pdf (accessed on 24 January 2023).
  28. Pfeifer, K.; Oudin Åström, D.; Martinsone, Ž.; Kaļužnaja, D.; Oudin, A. Evaluating Mortality Response Associated with Two Different Nordic Heat Warning Systems in Riga, Latvia. Int. J. Environ. Res. Public Health 2020, 17, 7719. [Google Scholar] [CrossRef]
  29. Galvonaite, A.; Misiuniene, M.; Valiukas, D.; Buitkuviene, M.S. Climate of Lithuania; Institute of Geograpgy, Vilnius University: Vilnius, Lithuania, 2007; 207p, Lithuanian Hydrometeorological Service. (In Lithuanian) [Google Scholar]
  30. Bukantis, A. Lithuanian Climate. Heat Wave. Universal Lithuanian Encyclopedia. 2022. Available online: https://www.vle.lt/straipsnis/karscio-banga/ (accessed on 1 July 2023). (In Lithuanian).
  31. Bukantis, A.; Gulbinas, S.; Kazakevičius, K.; Kilkus, K.; Mikelinskienė, A.; Morkūnaitė, R.; Rimkus, E.; Samuila, M.; Stankūnavičius, G.; Valiuškevičius, G.; et al. Impact of Climate Change for Physical Geographical Processes in Lithuania; 2001; 280p. Available online: https://www.researchgate.net/profile/Gintaras-Valiuskevicius/publication/284662367_Impact_of_Climate_Change_for_Physical_Geographical_Processes_in_Lithuania/links/577b67ba08aece6c20fbf34a/Impact-of-Climate-Change-for-Physical-Geographical-Processes-in-Li (accessed on 21 August 2023). (In Lithuanian).
  32. Bukantis, A.; Valiuškevičienė, L. Change in extreme air temperature and precipitation indicators and the factors determining them in lithuania in the 20th century. Ann. Geogr. 2005, 38, 6–17. (In Lithuanian) [Google Scholar]
  33. Galvonaitė, A.; Valiukas, D.; Kitrienė, Z.; Kilpys, J. Climate of Lithuanian Resorts; Lithuanian hydrometeorological Service at the Ministry of Environment of the Republic of Lithuania: Vilnius, Lithuania, 2015; 104p. (In Lithuanian) [Google Scholar]
  34. Dailidė, R.; Dailidė, G.; Razbadauskaitė-Venskė, I.; Povilanskas, R.; Dailidienė, I. Sea-Breeze Front Research Based on Remote Sensing Methods in Coastal Baltic Sea Climate: Case of Lithuania. J. Mar. Sci. Eng. 2022, 10, 1779. [Google Scholar] [CrossRef]
  35. Žaromskis, R. Curonian Lagoon. Universal Lithuanian Encyclopedia. 2022. Available online: https://www.vle.lt/straipsnis/kursiu-marios/ (accessed on 10 July 2023). (In Lithuanian).
  36. WMO. Guidelines on the Calculation of Climate Normals. WMO-No. 1203. 2017; 18p. Available online: https://library.wmo.int/doc_num.php?explnum_id=4166 (accessed on 21 August 2023).
  37. Sreehari, E.; Ghantasala, G.S.P. Climate Changes Prediction Using Simple Linear Regression. J. Comput. Theor. Nano Sci. 2019, 16, 655–658. [Google Scholar] [CrossRef]
  38. Kim, S.J.; Bae, S.J.; Jang, M.W. Linear Regression Machine Learning Algorithms for Estimating Reference Evapotranspiration Using Limited Climate Data. Sustainability 2022, 14, 11674. [Google Scholar] [CrossRef]
  39. Wan, Z.; Hook, S.; Hulley, G. MYD11C3 MODIS/Aqua Land Surface Temperature/Emissivity Monthly L3 Global 0.05Deg CMG V006. 2015, Distributed by NASA EOSDIS Land Processes DAAC. 2015. Available online: https://lpdaac.usgs.gov/products/myd11c3v006/ (accessed on 18 February 2023).
  40. LHMS. Assessment of Climate Changes in Lithuania Comparing 1961–1990 and 1991–2020 Standard Climate Norms; Lithuanian Hydrometeorological Service (LHMS) under the Ministry of Environment Vilnius: Vilnius, Lithuania, 2021; 18p. (In Lithuanian) [Google Scholar]
  41. LHMS. August 2022 Overview. 2023. Available online: http://www.meteo.lt/lt/2022-rugpjutis (accessed on 25 May 2023).
  42. Copernicus. European State of the Climate 2022. Summer 2022 Europe’s Hottest on Record. 2022. Available online: https://climate.copernicus.eu/esotc/2022 (accessed on 25 August 2023).
  43. Jakimavičius, D.; Kriaučiūnienė, J.; Šarauskienė, D. Impact of climate change on the Curonian Lagoon water balance components, salinity and water temperature in the 21st century. Oceanologia 2018, 60, 378–389. [Google Scholar] [CrossRef]
  44. Masterton, J.; Richardson, F.A. Humidex, a Method of Quantifying Human Discomfort Due to Excessiveheat and Humidity; Environment Canada, Atmospheric Environment: Toronto, ON, Canada, 1979; 45p. [Google Scholar]
  45. Kažys, J. Biometeorology Practical Works; Educational Book: Vilnius, Lithuania, 2011; 72p. (In Lithuanian) [Google Scholar]
  46. Sinclair, V.A.; Mikkola, J.; Rantanen, M.; Räisänen, J. The summer 2018 heatwave in Finland. Weather 2019, 74, 403–409. [Google Scholar] [CrossRef]
  47. Wilcke, R.A.I.; Kjellström, E.; Lin, C.; Matei, D.; Moberg, A.; Tyrlis, E. The extremely warm summer of 2018 in Sweden—Set in a historical context. Earth Syst. Dyn. 2020, 11, 1107–1121. [Google Scholar] [CrossRef]
  48. Rutgersson, A.; Jaagus, J.; Schenk, F.; Stendel, M. Observed changes and variability of atmospheric parameters in the Baltic Sea region during the last 200 years. Clim. Res. 2014, 61, 177–190. [Google Scholar] [CrossRef]
  49. Jaagus, J.; Briede, A.; Rimkus, E.; Remm, K. Variability and trends in daily minimum and maximum temperatures and in the diurnal temperature range in Lithuania, Latvia and Estonia in 1951–2010. Theor. Appl. Climatol. 2014, 118, 57–68. [Google Scholar] [CrossRef]
  50. Coppini, G.; Pinardi, N.; Marullo, S.; Loewe, P. Sea Surface Temperature, Compiled for EEA by the Instituto Nazionale di Geofisica e Vulcanologia (INGV) Based on Datasets Made Available by the Hadley Center, HADISST1. 2007. Available online: http://hadobs.metoffice.com/hadisst/data/download.html (accessed on 23 February 2023).
  51. Ramis, C.; Amengual, A. Climate Change Effects on European Heat Waves and Human Health. Encycl. Antropocene 2018, 2, 209–216. [Google Scholar] [CrossRef]
  52. Stockmayer, V.; Lehmann, A. Variations of temperature, salinity and oxygen of the Baltic Sea for the period 1950 to 2020. Oceanologia 2023, 65, 466–483. [Google Scholar] [CrossRef]
  53. Dailidienė, I.; Davulienė, L.; Kelpšaitė, L.; Razinkovas, A. Analysis of the Climate Change in Lithuanian Coastal Areas of the Baltic Sea. J. Coast. Res. 2012, 28, 557–569. [Google Scholar] [CrossRef]
  54. Dailidiene, I.; Baudler, H.; Chubarenko, B.; Navarotskaya, S. Long term water level and surface temperature changes in the lagoons of the southern and eastern Baltic. J. Oceanol. 2011, 53, 293–308. [Google Scholar] [CrossRef]
  55. Rukšėnienė, V.; Dailidienė, I.; Kelpšaitė-Rimkienė, L.; Soomere, T. Sea surface temperature variations in the south-eastern Baltic Sea in 1960–2015. Baltica 2017, 30, 75–85. [Google Scholar] [CrossRef]
  56. Meier, H.E.M.; Dieterich, C.; Gröger, M.; Dutheil, C.; Börgel, F.; Safonova, K.; Christensen, O.B.; Kjellström, E. Oceanographic regional climate projections for the Baltic Sea until 2100. Earth Syst. Dyn. 2022, 13, 159–199. [Google Scholar] [CrossRef]
  57. Hobday, A.; Oliver, E.; Sen Gupta, A.; Benthuysen, J.; Burrows, M.; Donat, M.; Holbrook, N.; Moore, P.; Thomsen, M.; Wernberg, T.; et al. Categorizing and naming marine heatwaves. Oceanography 2018, 31, 27. [Google Scholar] [CrossRef]
  58. Rutgersson, A.; Jaagus, J.; Schenk, F.; Stendel, M.; Bärring, L.; Briede, A.; ClaremarInger, B.; Hanssen-Bauer, I.; Holopainen, J.; Moberg, A.; et al. Recent Change—Atmosphere. In Second Assessment of Climate Change for the Baltic Sea Basin; BACC II Author Team, Regional Climate Studies, Eds.; Springer International Publishing: Cham, Switzerland, 2015; pp. 69–97. [Google Scholar] [CrossRef]
  59. Kniebusch, M.; Markus Meier, H.E.; Neumann, T.; Börgel, F. Temperature Variability of the Baltic Sea Since 1850 and Attribution to Atmospheric Forcing Variables. J. Geophys. Res.-Ocean. 2019, 124, 4168–4187. [Google Scholar] [CrossRef]
  60. Belkin, I.M. Rapid warming of large marine ecosystems. Prog. Oceanogr. 2009, 81, 207–213. [Google Scholar] [CrossRef]
  61. Agarin, T.; Jetzkowitz, J.; Matzarakis, A. Climate change and tourism in the eastern Baltic Sea region. In Tourism and the Implications of Climate Change: Issues and Actions; Schott, C., Ed.; Emerald: Bingley, UK, 2010; pp. 261–281. [Google Scholar] [CrossRef]
  62. Jacobsen, P.B. (Ed.) State of the Tourism Industry in the Baltic Sea Region, 2018th ed.; BSTC Baltic Sea Tourism Center: Rostock, Germany, 2018; 48p, Available online: https://bstc.eu/fileadmin/bstc.eu/Downloads/Final_Report_Tourism_Industry_in_BSR_2018.pdf (accessed on 26 January 2023).
  63. Smith, M. Baltic Health Tourism: Uniqueness and Commonalities. Scand. J. Hosp. Tour. 2015, 15, 357–379. [Google Scholar] [CrossRef]
  64. Marando, F.; Heris, M.P.; Zulian, G.; Udías, A.; Mentaschi, L.; Chrysoulakis, N.; David Parastatidis, D.; Maes, J. Urban heat island mitigation by green infrastructure in European Functional Urban Areas. Sustain. Cities Soc. 2022, 7, 103564. [Google Scholar] [CrossRef]
  65. WHO. Health and Climate Change Global Survey Report; World Health Organization: Geneva, Switzerland, 2021. [Google Scholar]
  66. Founda, D.; Katavoutas, G.; Pierros, F.; Mihalopoulos, N. Centennial changes in heat waves characteristics in Athens (Greece) from multiple definitions based on climatic and bioclimatic indices. Glob. Planet. Change 2022, 212, 103807. [Google Scholar] [CrossRef]
  67. Watts, N.; Amann, M.; Arnell, N.; Ayeb-Karlsson, S.; Belesova, K.; Berry, H.; Bouley, T.; Boykoff, M.; Byass, P.; Cai, W.; et al. The 2018 report of the Lancet Countdown on health and climate change: Shaping the health of nations for centuries to come. Lancet 2018, 392, 2479–2514. Available online: https://pubmed.ncbi.nlm.nih.gov/30503045/ (accessed on 24 August 2023). [CrossRef] [PubMed]
  68. Ballester, J.; Quijal-Zamorano, M.; Méndez Turrubiates, R.F.; Pegenaute, F.; Herrmann, F.R.; Robine, J.M.; Basagaña, X.; Tonne, C.; Antó, J.M.; Achebak, H. Heat-related mortality in Europe during the summer of 2022. Nat. Med. 2023, 29, 1857–1866. [Google Scholar] [CrossRef] [PubMed]
  69. Hackenbruch, J.; Kunz-Plapp, T.; Müller, S.; Schipper, J.W. Tailoring Climate Parameters to Information Needs for Local Adaptation to Climate Change. Climate 2017, 5, 25. [Google Scholar] [CrossRef]
Figure 1. Study area. Trajectories of air masses (a,b) (adapted using the Lithuanian Atlas [10]. Location of the study Seaside (Maritime) climatic region area in the Southeastern part of the Baltic Sea (c,d). The Seaside climate region (d) district is divided into three sub-regions: Curonian Spit (CS), Sea Coast (SC), and Coastal Lowlands (CL). Klaipeda meteorological station, WMO No-26509; Nida meteorological station, WMO No-26603; Palanga aviation meteorological station, WMO No-26502. (d) The seaside region is distinguished based on the climate zoning map of Lithuania compiled by the Lithuanian Hydrometeorological Service under the Ministry of the Environment (http://www.meteo.lt/klimato-rajonavimas (accessed on 25 August 2023)). The table shows the average annual air temperature values of the subregions for the climatic periods: 1981–2010 and (1991–2020).
Sustainability 15 14281 g001
Figure 2. Comparison of Climatological Standard Normals (CLINO) of the air temperature in the climatic periods (1961–1990, 1971–2000, 1981–2010, 1991–2020) in the SE Baltic Sea Seaside (Klaipeda). The average air temperature tends to rise in all seasons. Most changes occurred in January, February, April, July, and August.
Sustainability 15 14281 g002
Figure 3. Change of heat waves in the period 1993–2022 on the coast of the Southeast Baltic Sea: (a) number of heatwave cases, (b) number of heatwave days. The highest growth in the number of HWs cases is observed in the Curonian Spit subregion (Nida).
Sustainability 15 14281 g003
Figure 4. Distribution and probability of HWs days when the air temperature rises ≥+25 °C in the period 1993–2022 on the Baltic Seaside of Lithuania: (a) Klaipeda, (b) Palanga, and (c) Nida.
Sustainability 15 14281 g004
Figure 5. Duration of the heatwave season (in days) in the period 1993–2022: (a) Sea coast subregion (Klaipeda); (b) Curonian Spit subregion (Nida). Percentage distribution of appearing heat waves in the resort city of Nida: 4% in May, 18% in June, 48% in July, and 30% in August. For comparison, in the port city of Klaipėda, heat waves are more evenly distributed: in May—11%, in June—18%, in July—38%, and in August—33%. The lower number of heat wave days in Nida in May is apparently due to the cooler coastal sea waters in spring.
Sustainability 15 14281 g005
Figure 6. The changes and trend of the number of tropical nights in the period 1993–2022 on the Baltic coast of Lithuania.
Sustainability 15 14281 g006
Figure 7. Sea surface temperature and land surface temperature differences during heatwave and tropical nights 10–18 June 2019. Figure on the left (a): the temperature difference between the day (DSST) and the night (NSST) of the water surface temperature of the Baltic Sea and the Curonian Lagoon. Figure on the right (b): The difference between the day and night average surface temperatures.
Sustainability 15 14281 g007
Figure 8. Tropical night recorded during the HWs (11 June/17 June 2019) in the settlement of Nida on the Curonian Spit subregion: (a) air temperature and atmospheric pressure (b) air temperature and relative humidity. 13 June 2019 weather changes (sudden change in meteorological parameters, recorded rain, thunder, falling air temperature).
Sustainability 15 14281 g008
Figure 9. Number of days with extreme maximum air temperature (Tmax ≥ +30 °C) in the Seaside region (1993–2022): (a) dangerous heat variations and trend (the number of days Tmax ≥ +30 °C) in Klaipeda, Palanga, and Nida; (b) number of EHWs (Tmax ≥ +30 °C more than ≥2 days) and SHWs (more than ≥3 days).
Sustainability 15 14281 g009
Table 1. Heat warning systems in Lithuania and Latvia.
Heat
Criterion
The Heatwaves Warning SystemsResource
LatviaTmax1st level: 27 °C < Tmax < = 32 °C, duration ≥ 2 days
2nd level: Tmax ≥ 33 °C, duration 1 days
[28]
LithuaniaTmax1st level: Tmax ≥ 25 °C, duration ≥ 3 days
(HWs-heat waves)
2nd level: Tmax ≥ 30 °C, duration 1, 2 days
(EHWs-Dangerous heat)
3rd level: Tmax ≥ 30 °C, duration ≥ 3 days
(SHWs- Severe heat waves)
[10,29]
LithuaniaHumidex index0 till 27 °C–heat does not cause discomfort
27–34 °C–mild discomfort
35–39 °C–strong discomfort
40–45 °C–health hazards
46–53 °C–very high risk to health
≥54 °C–deadly danger.
[24]
Table 2. The average air temperature standard climatic norms (CLINO) change in the Baltic Seaside region (Klaipeda metrological station, WMO No-26509). Xn—climatic periods (No).
SCN010203040506070809101112Year
1931–1960 (X1)−3.1−3.4−0.84.810.414.117.217.313.88.43.5−0.26.8
1961–1990 (X2)−2.8−2.60.45.010.714.216.616.713.39.03.9−0.17.0
1971–2000 (X3)−1.4−1.51.15.610.914.316.917.113.18.73.70.57.4
1981–2010 (X4)−1.1−1.41.36.211.414.517.717.813.69.03.80.57.8
1991–2020 (X5)−0.9−0.91.76.711.615.318.318.314.28.94.41.18.2
(X4–X5)+0.2+0.5+0.4+0.5+0.2+0.8+0.6+0.5+0.6−0.1+0.6+0.6+0.4
(X2–X5)+1.9+1.7+1.3+1.7+0.9+1.1+1.7+1.6+0.9−0.1+0.5+1.2+1.2
Disclaimer/Publisher’s Note: The statements, opinions and data contained in all publications are solely those of the individual author(s) and contributor(s) and not of MDPI and/or the editor(s). MDPI and/or the editor(s) disclaim responsibility for any injury to people or property resulting from any ideas, methods, instructions or products referred to in the content.

