


The Mechanism and Countermeasures of the Impact of State Subsidy Backslide on the Efficiency of Waste-to-Energy Enterprises—A Case Study in China

Abstract
:1. Introduction
2. Theoretical Bases
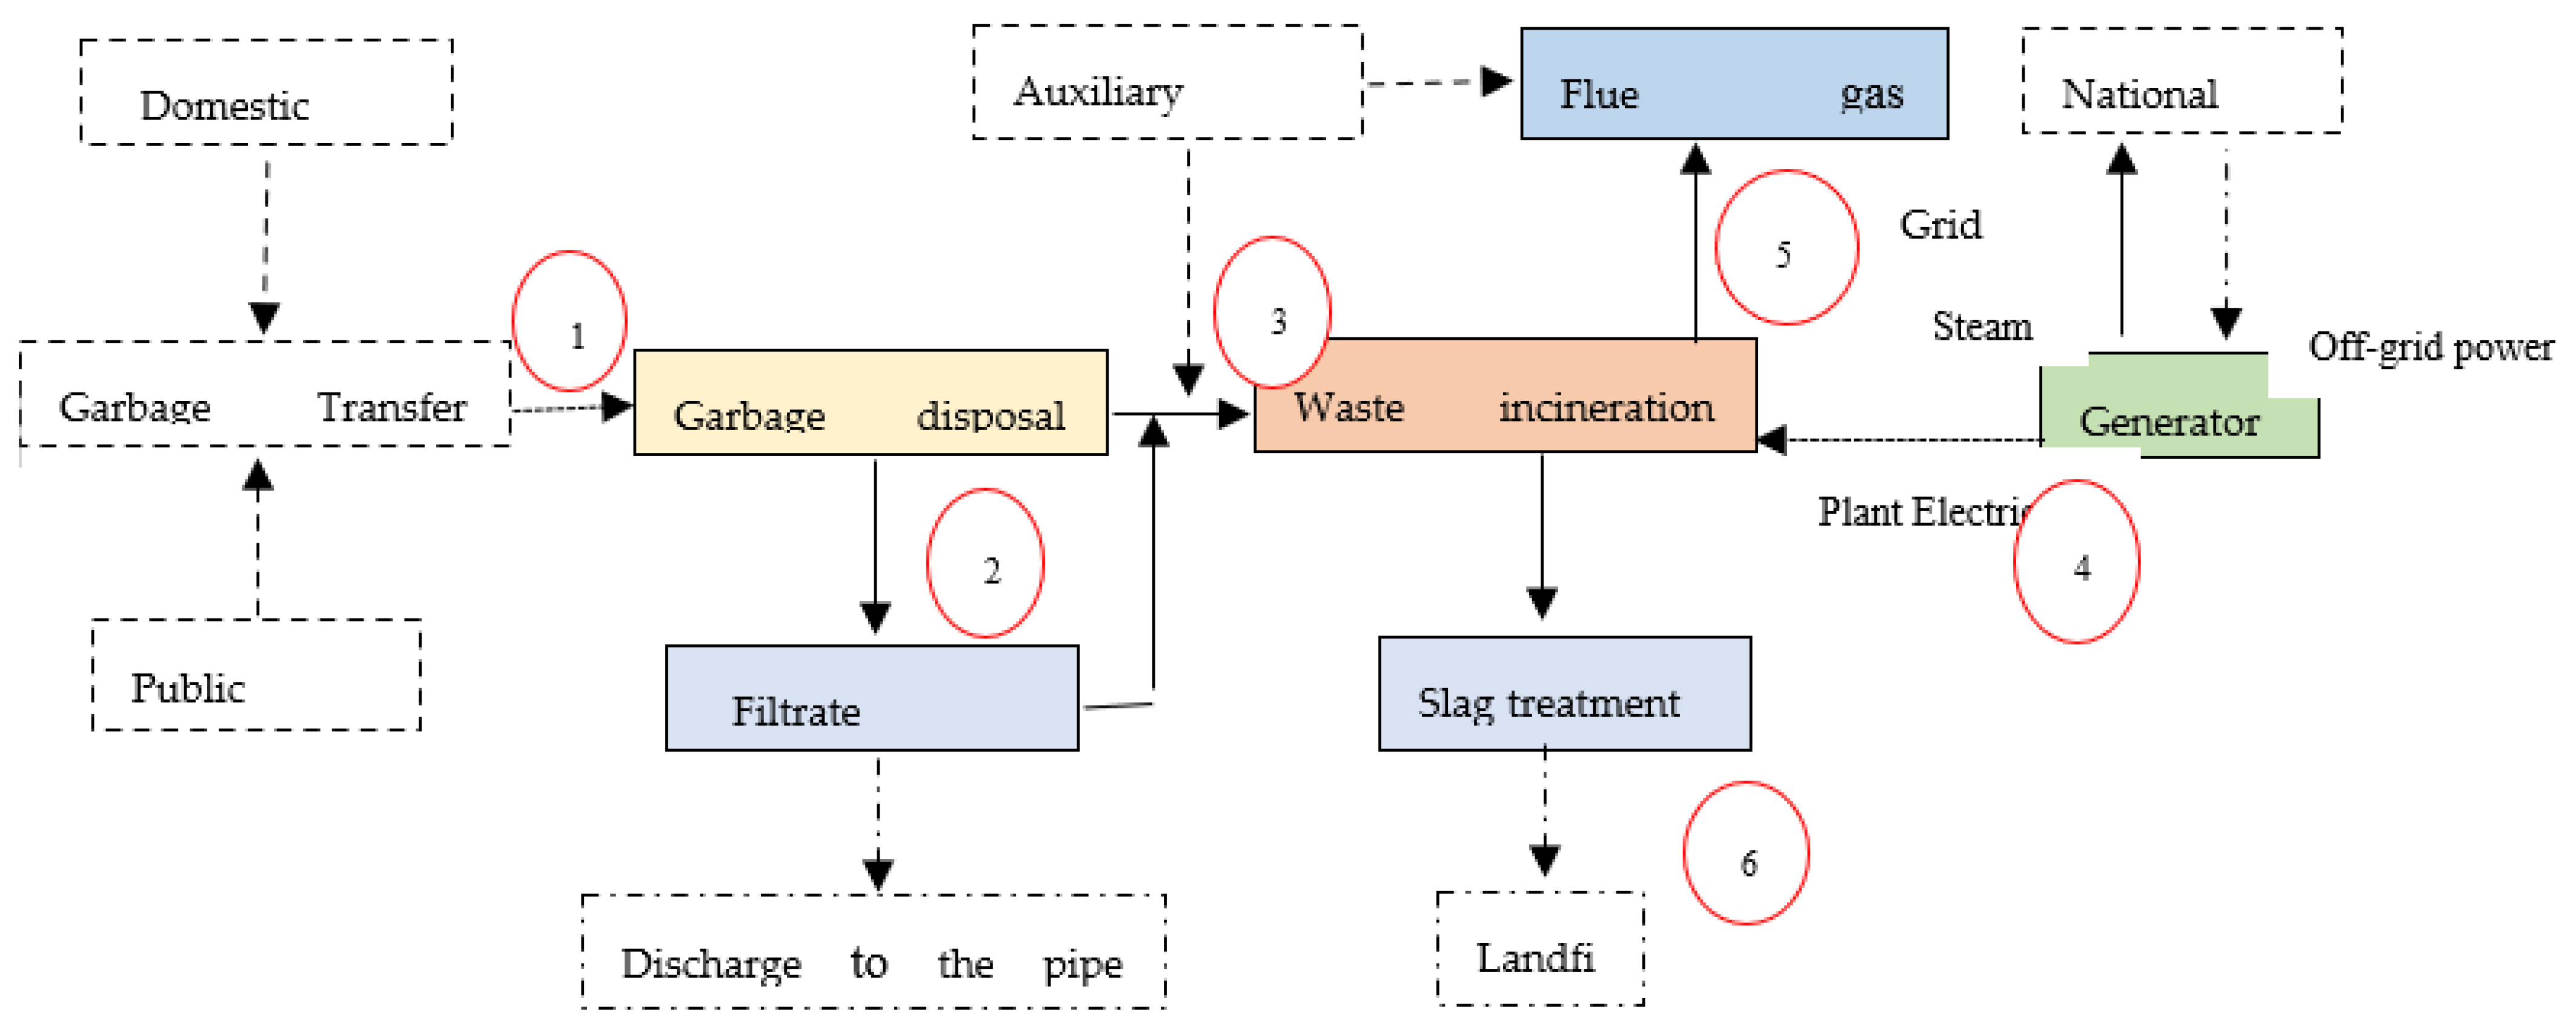
2.1. Waste Incineration Power Generation Process
2.2. Cost–Benefit Analysis
2.2.1. Sales Revenue
2.2.2. Total Cost
2.2.3. Sales Revenue
3. System Dynamics Modeling
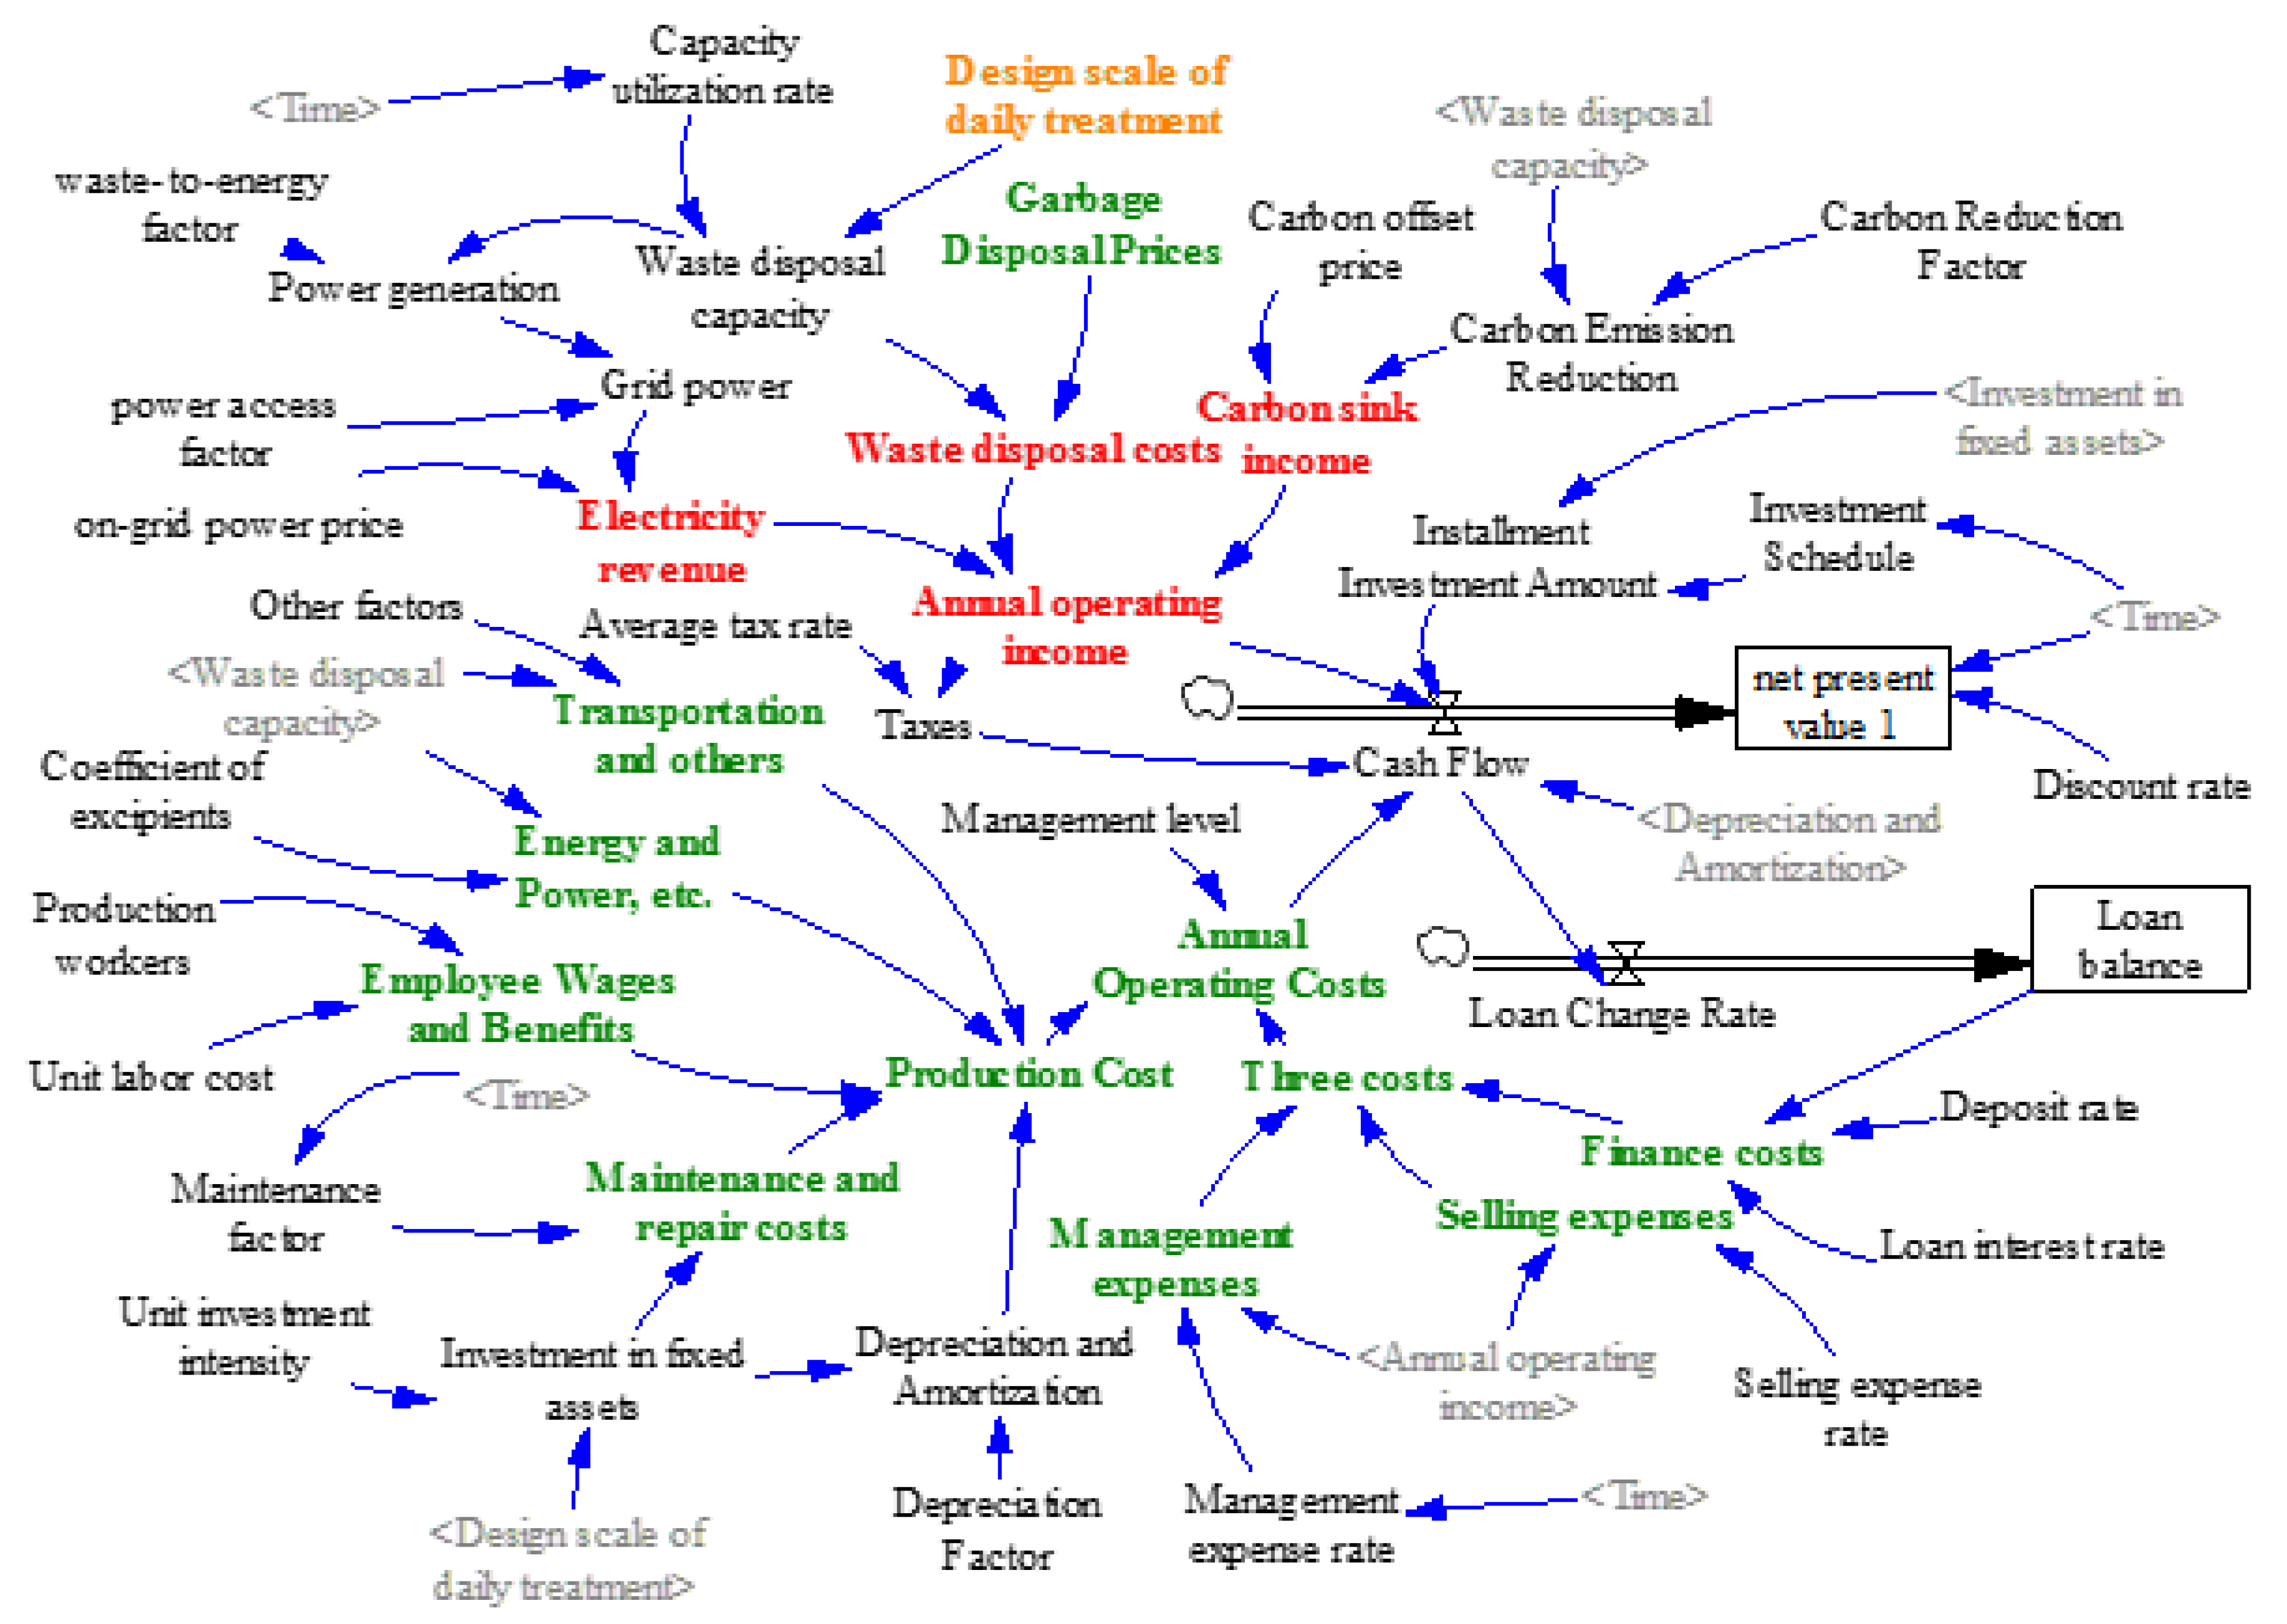
3.1. Cause-and-Effect Diagrams
3.2. Flow and Stock Analysis of System Models
3.3. Construction of Simulation Equations
4. Model Simulation and Analysis of Results
4.1. Scenario Assumption
4.2. Pricing Simulation
4.3. Analysis of the Impacts of National Subsidy Reduction on Waste Treatment Fees
4.4. Sensitivity Analysis of Other Factors on Waste Disposal Costs
4.5. Measurement of the Cost of Waste Treatment through Integrated Regulation
5. Concluding Remarks and Suggestions
5.1. Conclusions
5.2. Recommendations
Author Contributions
Funding
Institutional Review Board Statement
Informed Consent Statement
Data Availability Statement
Conflicts of Interest
References
- Petersen, O.H. Public-private Partnerships as Converging or Diverging Trends in Public Management? A Comparative Analysis of PPP policy and Regulation in Denmark and Ireland. Int. Public Manag. Rev. 2011, 12, 11–37. [Google Scholar]
- Liao, Z.; Jia, L.; Luo, J. On the Survey of Public-Private Partnerships—A Literature Review. Financ. Econ. 2018, 80–92. [Google Scholar]
- Yu, W.; Sector, F.S. China’s PPP projects:Status Quo and Problems. J. Shanghai Univ. (Soc. Sci. Ed.) 2017, 34, 94–105. [Google Scholar] [CrossRef]
- Zhang, Y.; Sun, Y.; Fu, Y.; Lu, D. Research on preparation of budget standard for quasipublic goods project—A case study of budget quota for collection, transportation and treatment of domestic waste in a city. Ref. Econ. Res. 2015, 48–56. [Google Scholar]
- Song, J.B.; Song, D.R.; Tan, C.M. A Decision-Making Model of Concession Period for Refuse-Incineration Power Generation BOT Projects. Chin. J. Manag. Sci. 2013, 21, 86–93. [Google Scholar]
- Song, J.; Song, D.; Fu, Y. System dynamics model for the benefit of waste-to-energy incineration BOT project. Manag. Rev. 2015, 27, 67–74. [Google Scholar]
- Zhikun, Z.; Guangtian, S. Study on method of estimating power generation during operation for a BOT project of refuse-incineration power generation. Heilongjiang Electr. Power 2008, 125–127. [Google Scholar] [CrossRef]
- Su-Dong, Y.E. Payment Mechanisms for BOT Project of Municipal Solid Waste Incineration Power Plants in China. J. Beijing Jiaotong Univ. (Soc. Sci. Ed.) 2014, 13, 25–30+74. [Google Scholar]
- Ke-Jing, F.; Zu-Hong, X.; Min, L.U.; Fang-Hua, G.; Ji-Qing, L. System Dynamics Model for Economic Analysis of Waste Incineration Power Plant Based on LCA. Adv. New Renew. Energy 2017, 5, 365–370. [Google Scholar]
- Wenxiong, H.; Wenlong, X.; Zhiyun, Q.; Song, Y.U. Price Component and Adjustment Mechanism of BOT Projects for Waste Incineration-power Generation. Environ. Sanit. Eng. 2011, 19, 1–4. [Google Scholar]
- Shi, S.; Ye, X.; Zhang, D.; Liu, L. The influence of capital structure on the value stability of PPP projects: A case study of waste incineration power generation projects. J. Financ. Account. 2020, 21–27. [Google Scholar] [CrossRef]
- Wu, F.; Wang, Z. Environmental income measurement based on material flow cost accounting: A case study of solid waste incineration power plant in HY City. Financ. Account. Mon. 2018, 91–97. [Google Scholar] [CrossRef]
- Chunling, S.; Fei, R.; Mengxiao, Z. System Dynamic Analysis on Revenue for PPP Projects: A Case of Gas Projects. Forum Sci. Technol. China 2016, 131–137. [Google Scholar] [CrossRef]
- Yu, Y.; Zhao, R.; Huang, Y.; Yang, L. An Evolutionary Game Theoretical Analysis to Conflicts among Stakeholders Involved in the Operation of Municipal Waste Incineration. Complexity 2020, 2020, 8825284. [Google Scholar] [CrossRef]
- Lam, H.L.; Ng, W.P.; Ng, R.T.; Ng, E.H.; Aziz, M.K.A.; Ng, D.K. Green strategy for sustainable waste-to-energy supply chain. Energy 2013, 57, 4–16. [Google Scholar] [CrossRef]
- Fu, X.; Zhou, Y.; Sun, H.; Wang, Y. Park-level agricultural energy internet: Concept, characteristic and applicationvalue. Trans. Chin. Soc. Agric. Eng. (Trans. CSAE) 2020, 36, 152–161, (In Chinese with English abstract). [Google Scholar]
- Sharma, S.; Basu, S.; Shetti, N.P.; Aminabhavi, T.M. Waste-to-energy nexus for circular economy and environmental protection: Recent trends in hydrogen energy. Sci. Total Environ. 2020, 713, 136633. [Google Scholar]


| Variable Type | Variable Name | Units | Equation and Parameters |
|---|---|---|---|
| State variable | Net Present Value(NPV) | million | INTEG (+ cash flow × EXP(−discount rate × Time)) |
| Loan balance | million | −10,000 + INTEG(−loan change rate) | |
| Rate variable | Cash flow | million | annual operating revenue-annual operating costs-installment investment-taxes-amount of amortized investment + depreciation and amortization |
| Loan variation rate | million | Cash flow | |
| Auxiliary variables | Total project investment | million | investment intensity × daily treatment design scale |
| Annual waste treatment capacity | 10,000 tons | capacity utilization rate × design scale of daily treatment × 365/10,000 | |
| Power generation | million KW | annual waste treatment capacity × waste generation coefficient | |
| On-grid power | million KW | on-grid coefficient × Power generation capacity | |
| Annual operating income | million | waste treatment fee income + electricity income + carbon sink income | |
| Electricity revenue | million | on-grid coefficient × power generation capacity × waste generation coefficient × on-grid tariff | |
| Garbage disposal fee | million | regional economic development level × waste disposal price × waste disposal volume | |
| Certified carbon emission reduction (CCER) | million | electricity generation × carbon emission reduction coefficient | |
| Carbon sink income | million | carbon emission reduction volume × carbon sink price | |
| Annual operating costs | million | production cost + three costs | |
| Production costs million | million | employee wages and benefits + maintenance and repair costs + energy and power, etc. | |
| Employee wages and benefits | million | unit labor cost × production workers garbage disposal volume × auxiliary material coefficient | |
| Energy and power, etc. | million | waste disposal volume × other factors garbage disposal volume × auxiliary material coefficient | |
| Transportation and others | million | waste disposal volume × other factors | |
| Maintenance and repair costs | million | fixed asset investment × maintenance factor | |
| Taxes | million | sales revenue × average tax rate | |
| Three expenses | million | management expenses + financial expenses + selling expenses | |
| Management expenses | million | administrative expense rate × sales revenue + depreciation and amortization | |
| Selling expenses | million | Selling expense ratio × sales revenue | |
| Depreciation and amortization | million | investment in fixed assets × depreciation factor | |
| Finance costs | million | IF THEN ELSE (loan balance < 0,—loan interest rate × loan balance,—deposit interest rate × loan balance) | |
| Amount of amortized investment | million | investment in fixed assets × investment schedule |
| Variable | Unit | Parameter | Description |
|---|---|---|---|
| Waste CO2 emission reduction | 0.35 | IPCC Guidelines 2006, Polaris Power Network (https://www.bjx.com.cn/, 12 May 2019) | |
| Unit waste-to-energy | 350 | Polaris Environmental Protection Network (https://huanbao.bjx.com.cn/special/?id=913209, 22 August 2019), Shengyuan Environmental Protection | |
| Investment intensity | million/t (USD) | 5.49 | Based on data published across China |
| Power generation grid access rate | % | 80 | Shengyuan Environmental Protection Co., Ltd., Green Dynamic Environmental Group Co., Ltd. Prospectus |
| Production employees | person | 50 | Guangda Environmental Energy (Yingtan) Co., Ltd. |
| Employee wages and benefits | million/person (USD) | 1.37 | Based on the average of each enterprise |
| Depreciation rate of fixed assets | % | 3.571 | Depreciated on an average straight-line basis over 28 years |
| Coefficient of auxiliary materials | USD/t | 2.74 | Shengyuan Environmental Protection Co., Ltd., Green Dynamic Environmental Group Co., Ltd. Prospectus |
| Other coefficients | USD/t | 2.06 | Shengyuan Environmental Protection Co., Ltd., Green Dynamic Environmental Group Co., Ltd. Prospectus |
| Financing rate | % | 6 | Average of financing of various waste-to-energy companies |
| Overhead rate | % | 3.5 | Ratio to sales revenue |
| Selling fee rate | % | 0 | Shengyuan Environmental Protection Co., Ltd. |
| Deposit rate | % | 3 | |
| Average tax rate | % | 3 | Shengyuan Environmental Protection Co., Ltd., Green Dynamic Environmental Group Co., Ltd. Financial Annual Report |
| Details | Unit | Nan’an Shengyuan | Jiangsu Shengyuan | ||
|---|---|---|---|---|---|
| Simulated Value | Actual Value | Simulated Value | Actual Value | ||
| Installed capacity of power generation | MW | 30 | 30 | 15 | 15 |
| Daily treatment capacity | ton | 1300 | 1300 | 1000 | 1000 |
| Investment amount | Million (USD) | 6239.10 | 5285.27 | 4799.31 | 4583.20 |
| Grid power | million/kw | 13,312 | 14,016 | 10,220 | 11,756 |
| Average grid power price | USD | 0.09 | 0.08 | 0.09 | 0.08 |
| Revenue from electricity sales | Million (USD) | 1186.53 | 1073.54 | 910.91 | 671.77 |
| Waste treatment capacity | 10,000 tons | 47.45 | 53.49 | 36.5 | 44.01 |
| Capacity utilization rate | % | 100% | 108% | 100% | |
| Waste treatment price | USD/ton | 7.95 | 8.91 | 7.95 | 7.40 |
| Waste treatment fee | Million (USD) | 377.36 | 477.19 | 290.30 | 267.94 |
| Annual operating income | Million (USD) | 1560.87 | 1550.72 | 1201.20 | 939.84 |
| Depreciation and amortization | Million (USD) | 222.69 | 186.62 | 171.27 | 168.25 |
| Labour costs | Million (USD) | 106.96 | 109.42 | 82.27 | 77.61 |
| Energy and power | Million (USD) | 162.63 | 170.58 | 125.06 | 109.01 |
| Transportation and others | Million (USD) | 65.13 | 59.65 | 50.05 | 85.43 |
| Maintenance and repair | Million (USD) | 124.78 | 126.02 | 95.99 | 101.20 |
| Cost of main business | Million (USD) | 682.19 | 652.43 | 524.77 | 542.05 |
| Benchmark | Pessimistic | Neutral | Optimistic | |
|---|---|---|---|---|
| Unit investment intensity (million/t) | 36 | 36 | 36 | 36 |
| Waste generation coefficient (kw/t) | 350 | 350 | 350 | 350 |
| Average grid power price (USD/kw) | 0.09 | 0.05 | 0.07 | 0.09 |
| Unit price of waste treatment (USD/t) | 7.95 | 17.55 | 13.71 | 9.87 |
| Impact of each 0.1-USD downward adjustment on waste treatment price | −3.84 | |||
| Original Assumptions and Changes | Investment Intensity | Capacity Utilization Rate | Waste Generation Factor | Carbon Sink Income | ||||
|---|---|---|---|---|---|---|---|---|
| Numerical Value (USD) | Waste Price (USD) | Numerical Value | Waste Price (USD) | Numerical Value (USD) | Waste Price (USD) | Numerical Value (USD) | Waste Price (USD) | |
| Improvement of 30% | 3.84 | 4.39 | 130% | 8.50 | 62.39 | 5.48 | 8.91 | 10.97 |
| Improvement of 20% | 4.39 | 6.86 | 120% | 9.60 | 57.59 | 7.68 | 8.22 | 11.24 |
| Improvement of 10% | 4.94 | 9.32 | 110% | 10.70 | 52.79 | 9.74 | 7.54 | 11.51 |
| Original assumptions | 5.48 | 11.80 | 100% | 11.72 | 47.99 | 11.72 | 6.85 | 11.79 |
| Deterioration of 10% | 6.03 | 14.26 | 90% | 12.89 | 43.19 | 13.85 | 6.17 | 12.06 |
| Deterioration of 20% | 6.58 | 16.73 | 80% | 13.99 | 38.39 | 15.91 | 5.48 | 12.34 |
| Deterioration of 30% | 7.13 | 19.20 | 70% | 15.08 | 33.60 | 17.96 | 4.80 | 12.62 |
| Elasticity | −2.74 | −1.10 | −2.06 | −0.27 | ||||
| Basic Scenario | Scenario 1 | Scenario 2 | Scenario 3 | Scenario 4 | |
|---|---|---|---|---|---|
| Average grid power price (USD/kw) | 0.08 | 0.07 | 0.07 | 0.05 | 0.05 |
| Unit investment intensity (million/t) | 40 | 34 | 34 | 32 | 36 |
| Waste-to-energy coefficient (kw/t) | 350 | 385 | 350 | 385 | 385 |
| Capacity utilization rate | 100% | 100% | 110% | 110% | 100% |
| CCER price | 0 | 0 | 0 | 0 | 100 |
| Unit price of waste treatment (USD/t) | 10.42 | 10.42 | 10.28 | 9.87 | 9.74 |
Disclaimer/Publisher’s Note: The statements, opinions and data contained in all publications are solely those of the individual author(s) and contributor(s) and not of MDPI and/or the editor(s). MDPI and/or the editor(s) disclaim responsibility for any injury to people or property resulting from any ideas, methods, instructions or products referred to in the content. |
© 2023 by the authors. Licensee MDPI, Basel, Switzerland. This article is an open access article distributed under the terms and conditions of the Creative Commons Attribution (CC BY) license (https://creativecommons.org/licenses/by/4.0/).
Share and Cite
Wang, H.-G.; Rao, H. The Mechanism and Countermeasures of the Impact of State Subsidy Backslide on the Efficiency of Waste-to-Energy Enterprises—A Case Study in China. Sustainability 2023, 15, 14190. https://doi.org/10.3390/su151914190
Wang H-G, Rao H. The Mechanism and Countermeasures of the Impact of State Subsidy Backslide on the Efficiency of Waste-to-Energy Enterprises—A Case Study in China. Sustainability. 2023; 15(19):14190. https://doi.org/10.3390/su151914190
Chicago/Turabian StyleWang, Huo-Gen, and Han Rao. 2023. "The Mechanism and Countermeasures of the Impact of State Subsidy Backslide on the Efficiency of Waste-to-Energy Enterprises—A Case Study in China" Sustainability 15, no. 19: 14190. https://doi.org/10.3390/su151914190
APA StyleWang, H.-G., & Rao, H. (2023). The Mechanism and Countermeasures of the Impact of State Subsidy Backslide on the Efficiency of Waste-to-Energy Enterprises—A Case Study in China. Sustainability, 15(19), 14190. https://doi.org/10.3390/su151914190