1. Introduction
Phosphorus, an essential element for life, is an irreplaceable natural resource worldwide and has an indispensable role in sustaining human life activities and social development [
1,
2]. As surface phosphate sources have become increasingly poor, phosphate mining has shifted to the deeper parts of the earth. Due to the increase in mining depth, the geological conditions tend to be complicated. Especially in karst areas, karst fractures and conduits develop, and mine-water breakout accidents are serious [
3,
4,
5]. According to statistics, from 2004–2020, the number of deaths in mining accidents in China reached 500–6000 in all years, among which water intrusion from the roof accounted for a relatively large number (China Statistical Yearbook 2020). Under long-term karst processes, karst aquifers are prone to developing karst fissures. When water flows through these fissures, karst features become more pronounced [
6]. The development of karst conduits and caves exhibits spatial non-uniformity. Currently, no researchers are able to predict the presence of fissures and conduits, but reasonable accuracy can be achieved through estimation [
7]. Therefore, achieving safe phosphate mining is challenging, and this is also a common issue faced by mining production in karst regions. Accurately and objectively predicting the water-richness characteristics of the karst aquifer in the roof of phosphate mines is an essential preparation for ensuring the safe extraction of deep phosphate deposits. The unit inflow (q) is used to measure regional water richness by mine-water prevention and control standards, and q is obtained by hydrogeological borehole pumping test (State Administration of Coal Mine Safety 2009). This approach is expensive, and there are problems, such as the small number of wells and uneven distribution. In the absence of sufficient data on the unit inflow of water, many researchers have used different methods to conduct research on water-richness zoning of karst aquifers, and have achieved significant results. These researchers have adopted two main methods to study aquifer characteristics. One is the borehole-based method, in which boreholes are drilled into subsurface rocks, and samples are analyzed in order to understand the nature and composition of the aquifer. The other method is to utilize physical detection techniques, such as high-density electrical resistance and transient electromagnetic methods, to infer the distribution and characteristics of aquifers by measuring the electrical resistance and electromagnetic properties of the subsurface.
Wu et al. [
8,
9] analyzed the basic geological information and proposed a water-richness index method. The index weights are defined through the introduction of an artificial neural network and analytic hierarchy process, and the multi-source information is processed by composite superposition to achieve water-richness zoning. The water-richness index method can objectively and adequately use various basic geological data of mines and can visually reflect the differences of the water-richness distribution of mines. Using the ideal solution similarity-finding sequence technique, gray relational analysis GRA, and fuzzy hierarchical method, Qiu et al. [
10] proposed a zonal prediction method for the water richness of the Ordovician roof and verified it with actual projects. Since the completion of the pumping test requires considerable amounts of labor and material resources, many mines lack the corresponding pumping test data. The proposed model can predict the water richness of many mines that lack more accurate pumping test data. In the process of using well data to analyze the water richness of aquifers, researchers usually use the hierarchical analysis method to determine the weights of indicators. This approach is relatively subjective and inevitably produces errors. Wang et al. [
11] determined the vertical distance of the aquifer using the underground network parallel electrical method, which was combined with the sediment control method to investigate the water-richness characteristics of the aquifer. The method is not always applicable as the depth of the aquifer increases. Not only is the detection depth shallow, but the blind area is also large. Its disadvantages are inevitable in the trend of mines tending to deep mining. Zhou et al. [
12] used the short-offset grounded transmission electron method (SOTEM) to detect the water-richness distribution of aquifers in North China-type coal fields. This method has greater success in detection depth than the conventional transient electromagnetic method, but it is more costly and difficult to popularize.
The above-mentioned studies on the water-richness zoning of karst aquifers have achieved reasonable and accurate results, but there are also certain limitations. Based on the current shortcomings regarding the evaluation of the water richness of deep mining roof aquifers, the present study proposes a new water-richness zoning model for phosphate mine roofs based on the random forest theory in machine learning. In this study, there are three main components in constructing the random forest model. 1. The selection of important variables and the exclusion of some less important variables can improve the accuracy of prediction. 2. The establishment of training samples and validation samples. 3. The determination of the optimal parameters (the count of decisions and the count of splitting features) in the model-building process. The established random forest model was used to partition the water richness of a karst aquifer on the roof of a phosphate mine as a case study. Finally, the accuracy of the model was validated by the introduction of a water-richness fitting rate (WFP) and comparison with new drillings.
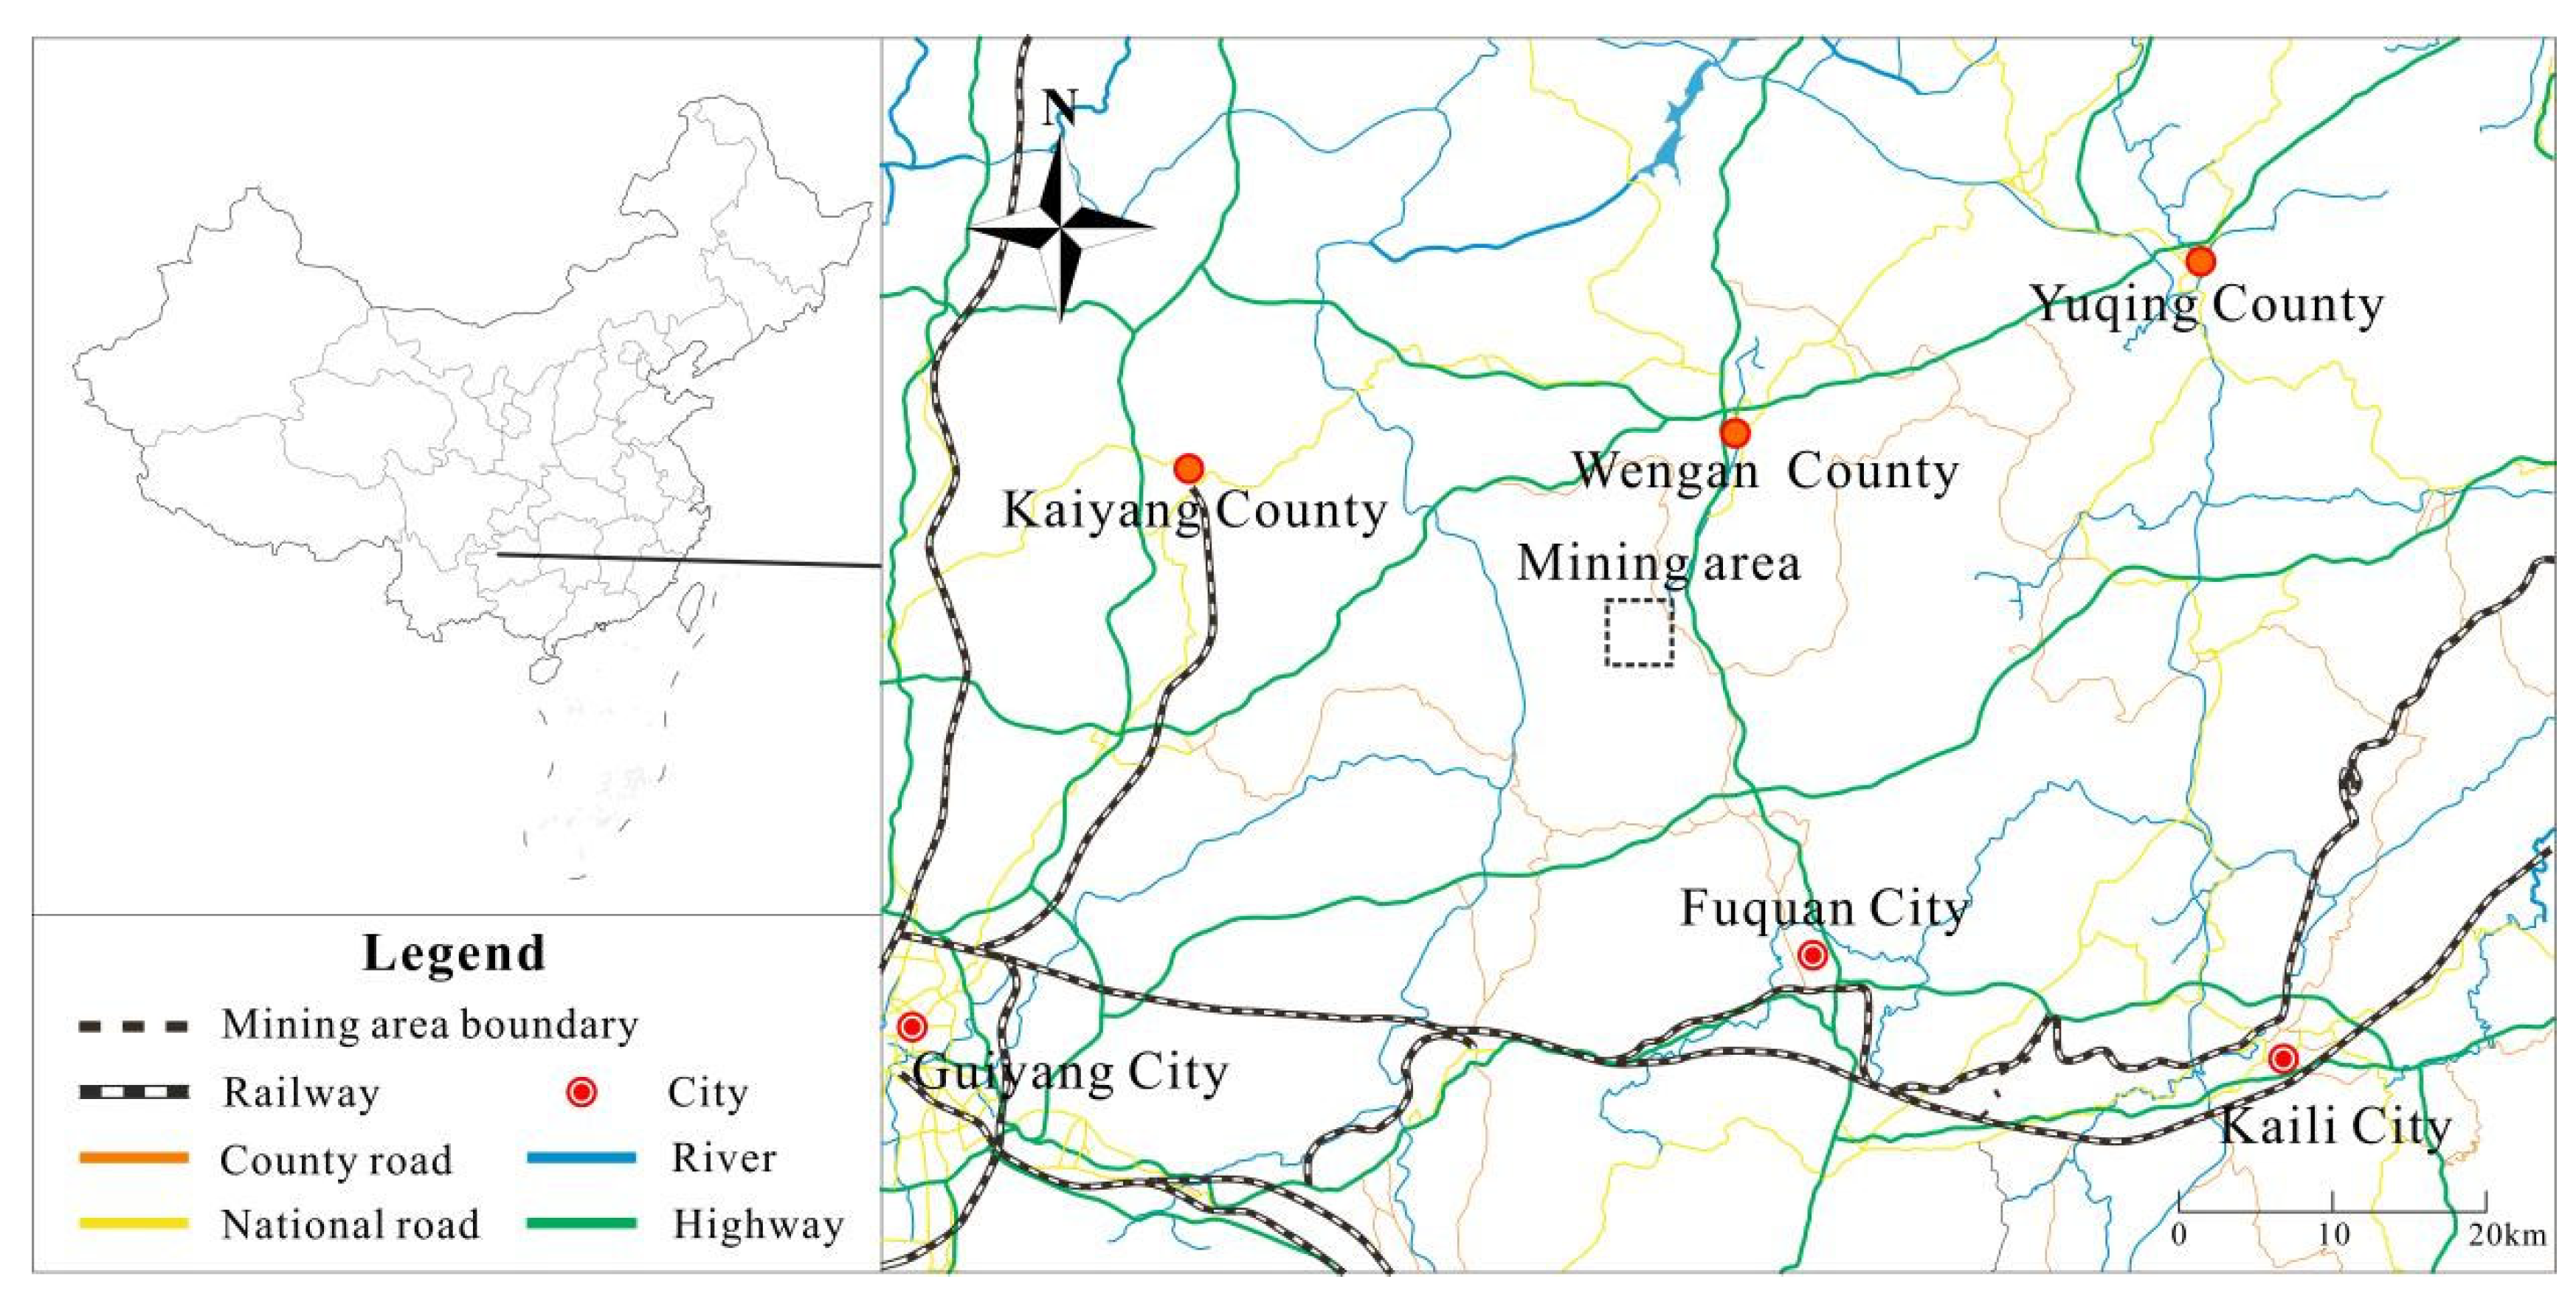
2. Study Area
The research area is located in the east–central part of the Guizhou Plateau, and the geographic location is between 107°21′32″ and 107°22′27″ east longitude and 26°55′40″ and 26°57′34″ north latitude. The mine boundary is a regular rectangle with an area of 2.01 km
2 (
Figure 1). The landform type belongs to the tectonic denudation low–middle mountain karst landform. The natural environment is typical of a karst area. The altitude is 1143 m–1400 m, and the relative height difference is between 100 and 220 m. The study area has a rainy season from May to November each year, with an average annual rainfall of 1068.1 mm.
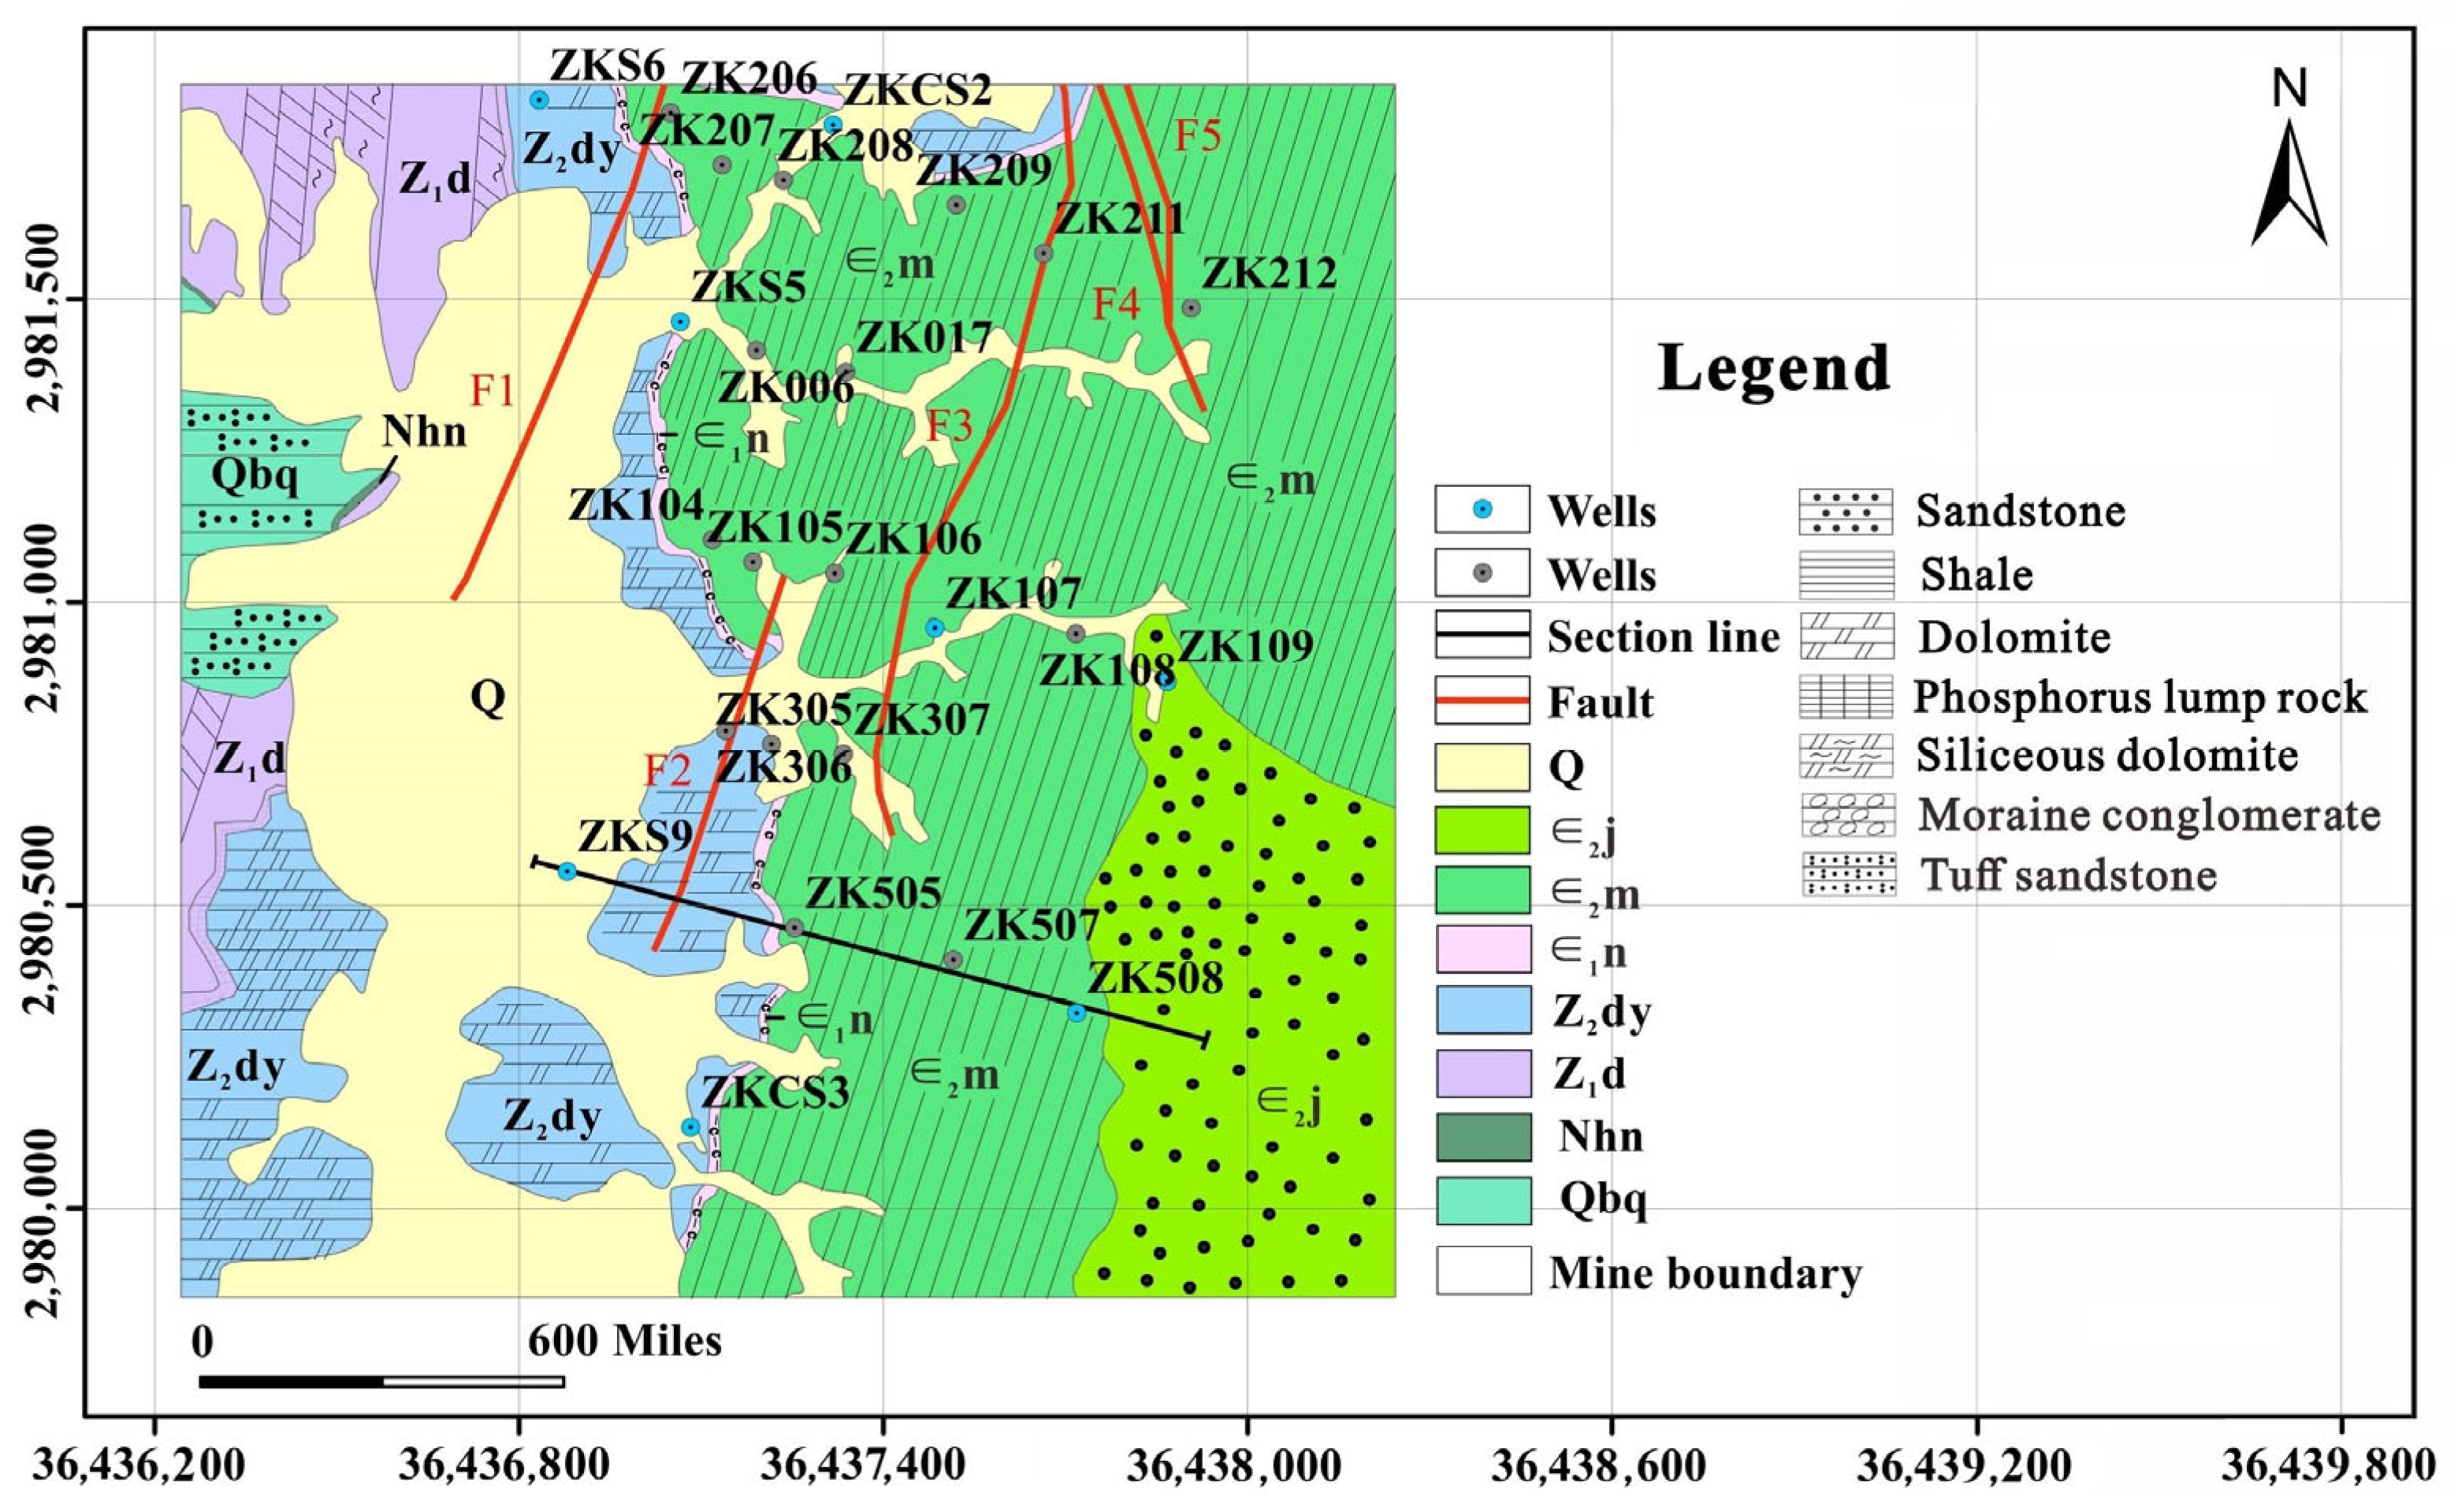
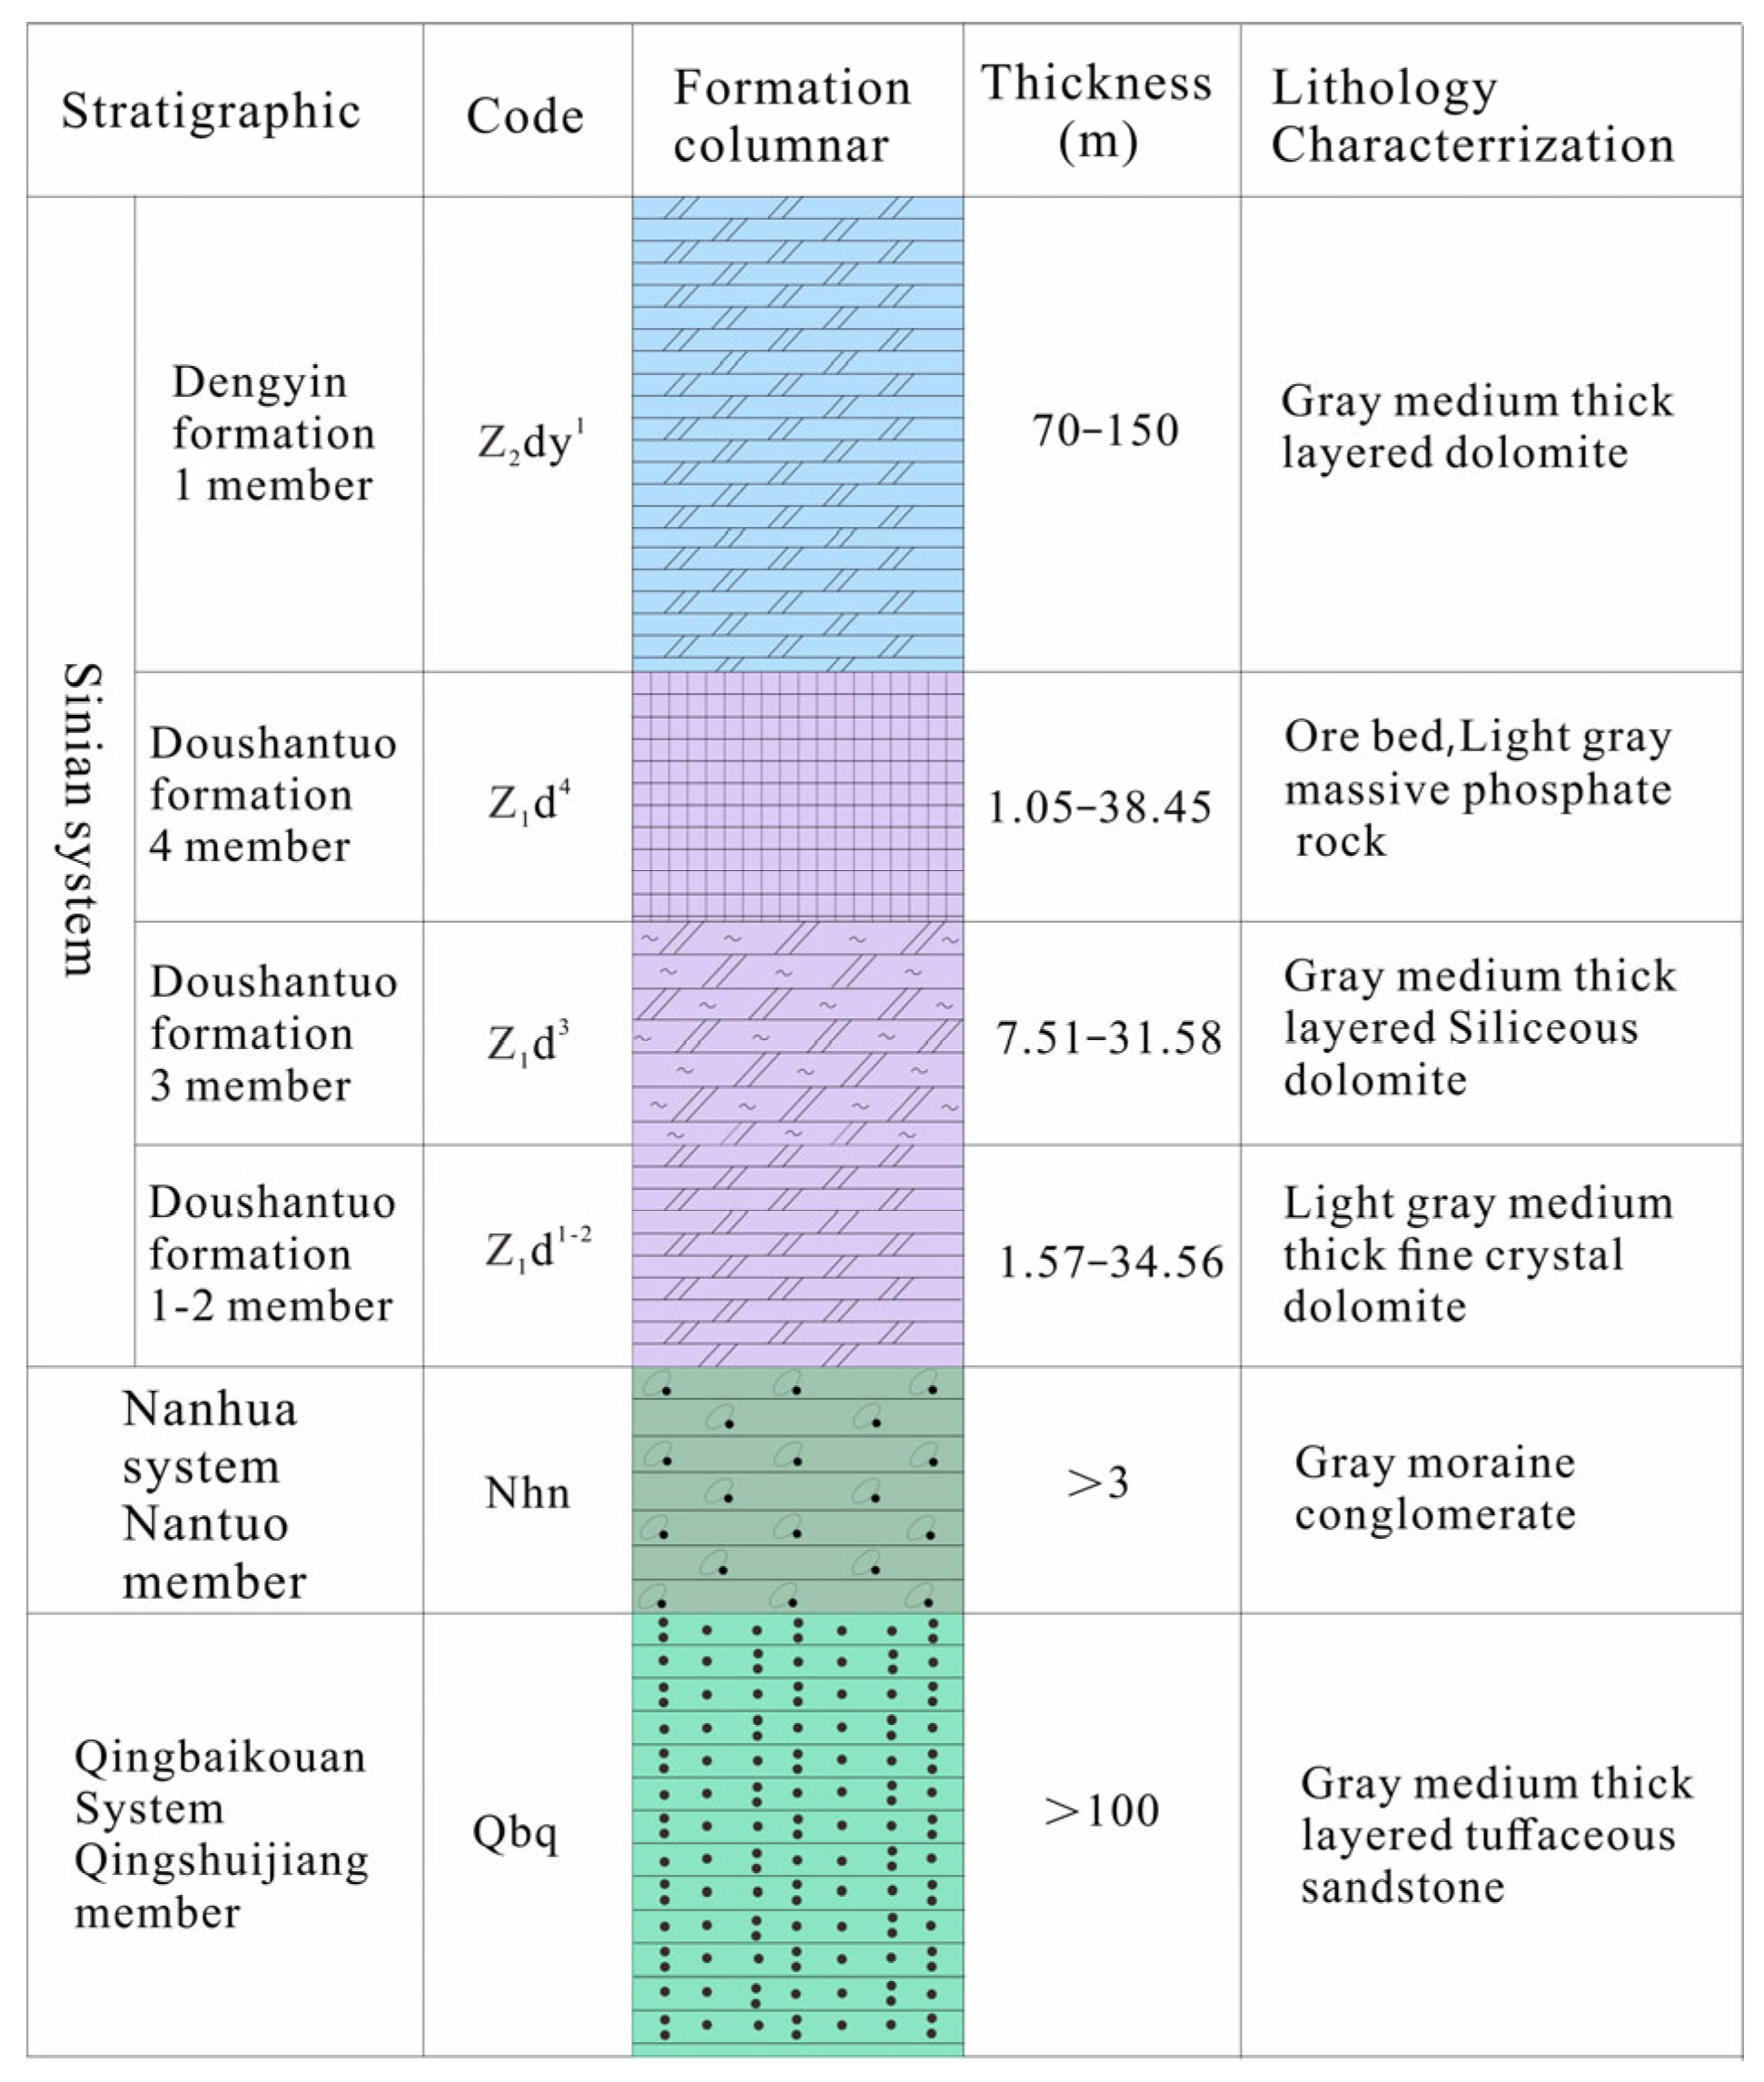
Geologically, the principal strata are the Qingshuijiang Formation (Qbq), Nantuo Formation (Nhn), Doushantuo Formation (Z
1d), and Dengying Formation (Z
2dy), and the Ordovician, Silurian, and Devonian deposits are missing, according to field drilling data. Among them, the ore body is contained in the Sinian Doushantuo Formation (Z
1d), with thicknesses ranging from 1.75 m to 38.45 m, with an average value of 18.48 m (
Figure 2). The lithology of the Qingshuijiang Formation (Qbq) consists of gray medium-thick laminated tuffaceous sandstone with a thickness of more than 100 m. The lithology of the Nantuo Formation (Nhn) is a gray-white moraine conglomerate. Doushantuo Formation (Z
1d) consists of a dolomite, siliceous dolomite, and phosphorite block rock composition of a phosphorus-bearing rock group. The aquifer of the Dengyin Formation (Z
2dy) is 70~150 m thick, and its lithology consists of a set of gray medium-thick dolomite (
Figure 3). The underground karst patterns are fissure-like caves, holes, and gaps.
Structurally, there are five faults in the mining area: F1, F2, F3, F4, and F5. All the faults in the mining area are oriented in the SN direction and play a crucial role in controlling the overall structural framework. The F1 fault originates from the northern end and stretches approximately 3.5 km within the mining area. The fault fragmentation zone exhibits distinct extrusion and deformation characteristics, which are influenced by the displacement of the fault, the development of secondary fractures in both rock strata plates adjacent to the fault, and the fragmentation of the rocks. The F1, F2, F3, and F4 faults all have a destructive effect on the orebody.
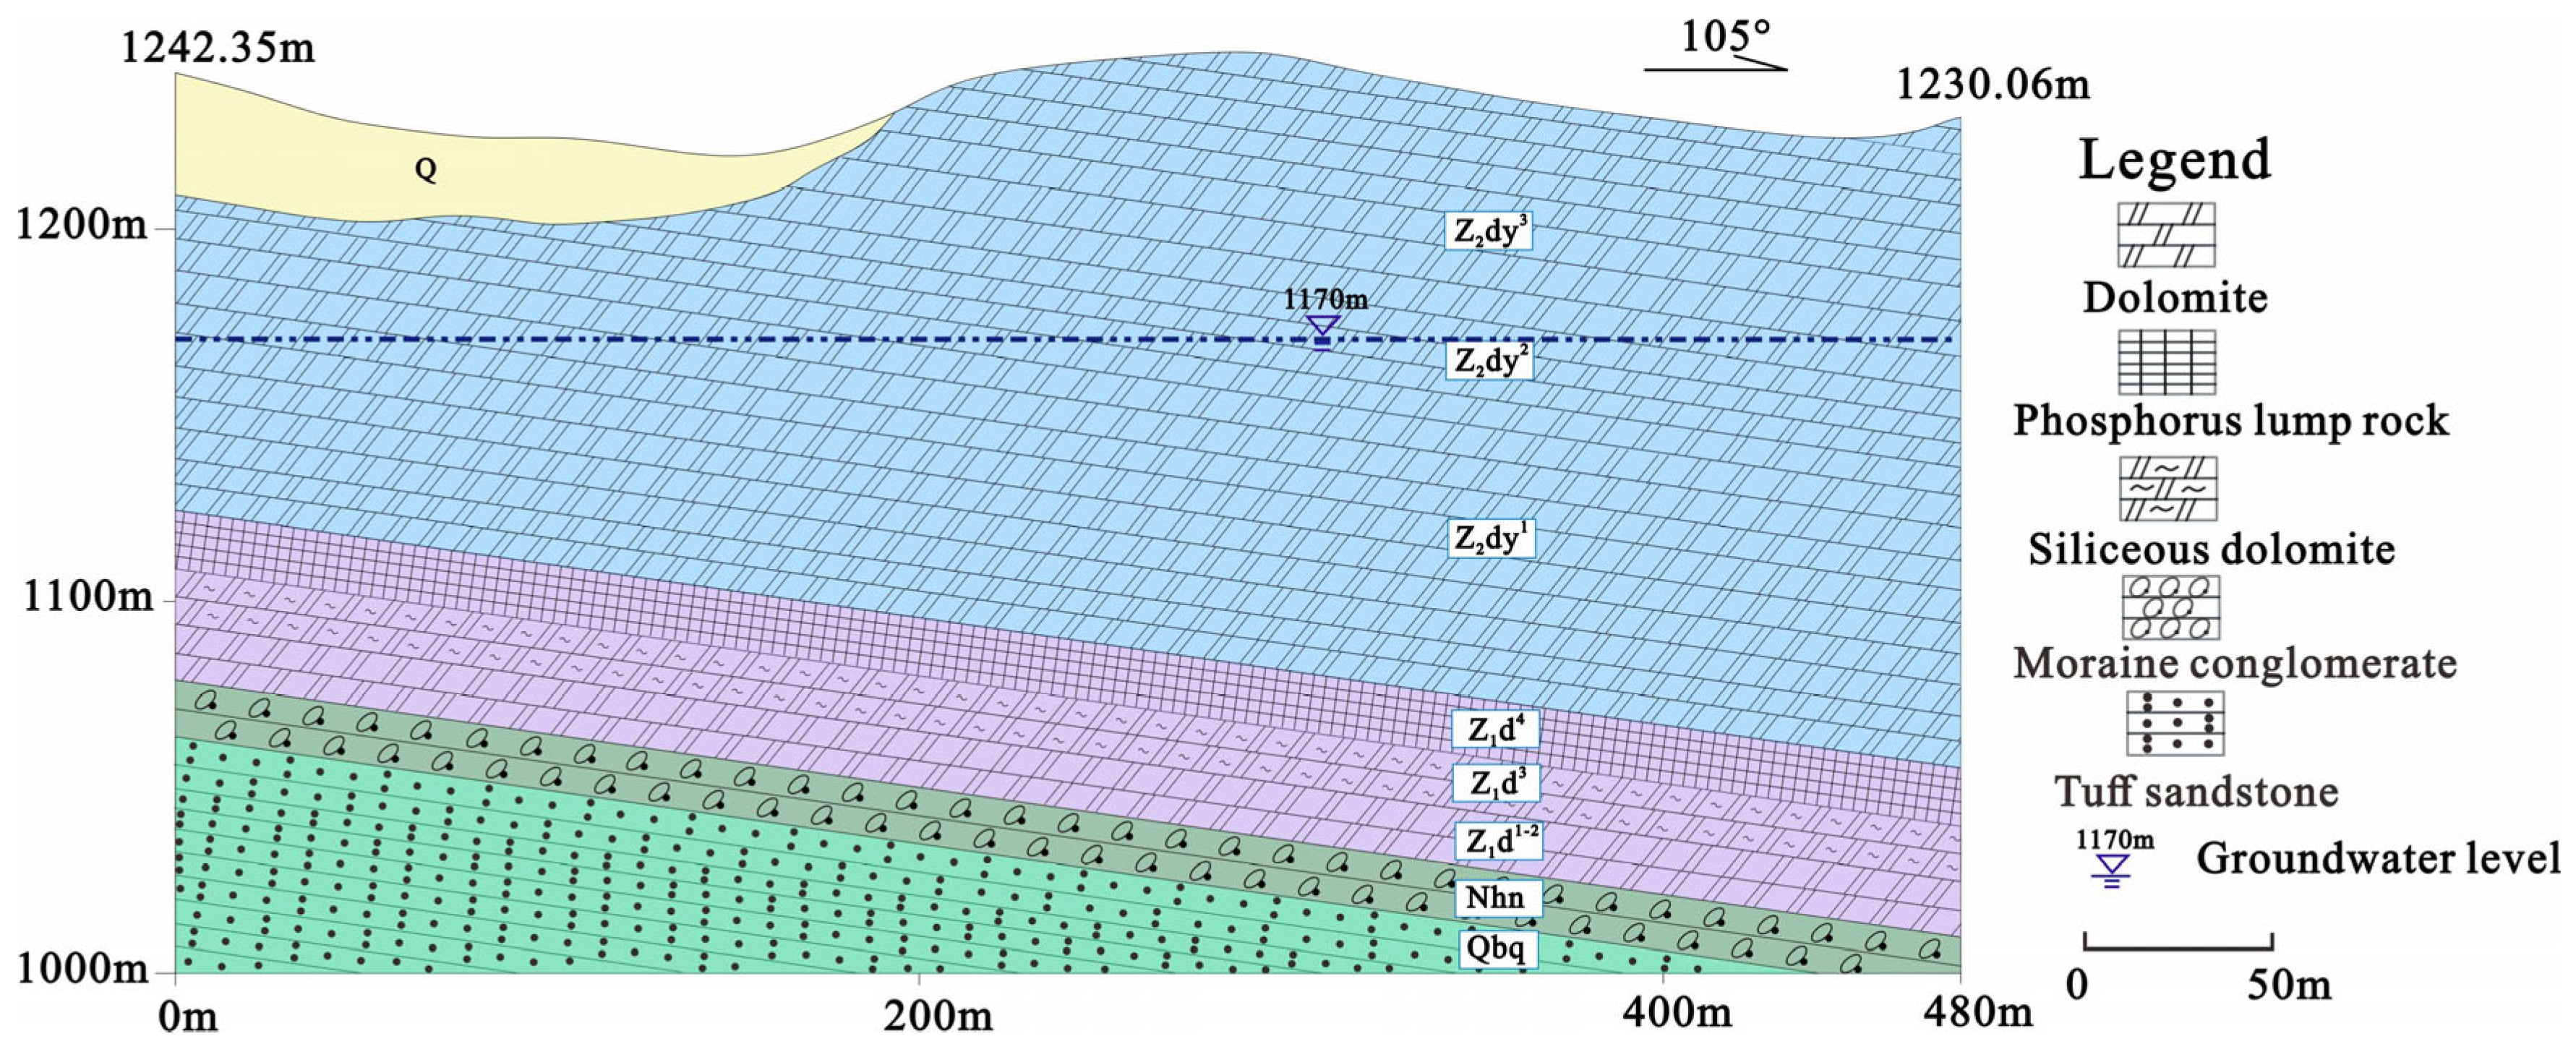
Hydrogeologically, the recharge of the area is due to the effective infiltrations occurring on the area itself. The karst aquifer of the Dengying Formation (Z
2dy) forms the top of the phosphate rock and is the main water-bearing strata (
Figure 4). The aquifer units’ water ranges from 0.0113 to 8.8336 L/s-m, with a static water level that varies between 1127 and 1213 ma.s.l. Additionally, the permeability coefficient ranges from 0.0312 to 2.5021 m/d.
3. Materials and Methods
3.1. Selection of Indicators and Creation of Thematic Maps
3.1.1. Indicator Determination
A total of 7 indicators were identified as the primary factors influencing the assessment of water abundance in the karst aquifer within the phosphate mine’s roof. A brief description of the 7 indicators is presented hereafter.
Aquifer unit water inflow: The unit water inflow rate is a crucial factor for measuring the degree of groundwater abundance in the area [
13]. Data were obtained by counting the on-site pumping tests, with larger values indicating a strongly water-rich region.
Drilling flushing fluid consumption: When a borehole is drilled in a rock formation, the consumption of flushing fluid and the change in its properties can often indicate the size of the permeability of the rock formation, and can also indirectly speculate the lithological changes of the aquifer. If a large amount of flushing fluid is consumed during drilling, it may be that a very permeable aquifer or permeable channel is present, or a very permeable dry rock layer is encountered [
14]. The flushing fluid consumption data were obtained statistically for 8 wells.
Permeability coefficient: The permeability coefficient serves as a quantitative parameter that characterizes the hydraulic conductivity of a rock mass [
15]. Typically, a higher permeability coefficient signifies enhanced aquifer permeability within the region, indicating a higher level of water richness. Permeability coefficient data were collected through statistical analysis of eight borehole pumping tests.
Construct fractal dimension: The construct fractal dimension is a value that describes the complexity of structural development in a region and is also commonly used to characterize the development of fractures in rocks due to mining activities [
16]. The specific calculation steps are as follows. The fault is projected into the grid trace map, after which the mine area is divided into several squares. The initial square has a side length of r. Then the squares with side lengths r/2, 4/r, and r/8 are projected into the initial square in turn. The number of fault traces passing through the grid in each edge length square is counted as N(r), and the recorded number is entered into the lg N(r)—lg r coordinate system, with the logarithm of the grid edge length as the horizontal coordinate and the logarithm of the number of grid traces passing through the network of different square edge lengths as the vertical coordinate. The slope of the fitted line using Equation (1) is the constructive fractional dimension value Ds of the block.
Fault distribution: The rock body in the fault distribution area is broken and has low mechanical strength [
17,
18]. Under the action of mining disturbance and water pressure, it is easy to connect the ore body and the overlying karst aquifer, thus causing sudden water disasters. Based on the extent of the fault failure zone, the area around the failure zone is divided into impact zones. By quantifying the fault traces in the geological tectonic map, the damage zone and impact zone were quantified as 1 and 0.7.
Roof water pressure of ore body: One of the most important variables in determining the degree of water richness is water pressure. A higher water pressure indicates a greater presence of groundwater in the area, thus reflecting greater water richness [
19]. The water pressure is related to the elevation of the groundwater acting on the interface of the phosphate roof. The elevation of the top of the ore body is between +600 and +1249 ma.s.l., with a vertical drop of 849 m, high in the west and low in the east. The water pressure acting on the roof of the phosphate mine increases gradually from the west to the east.
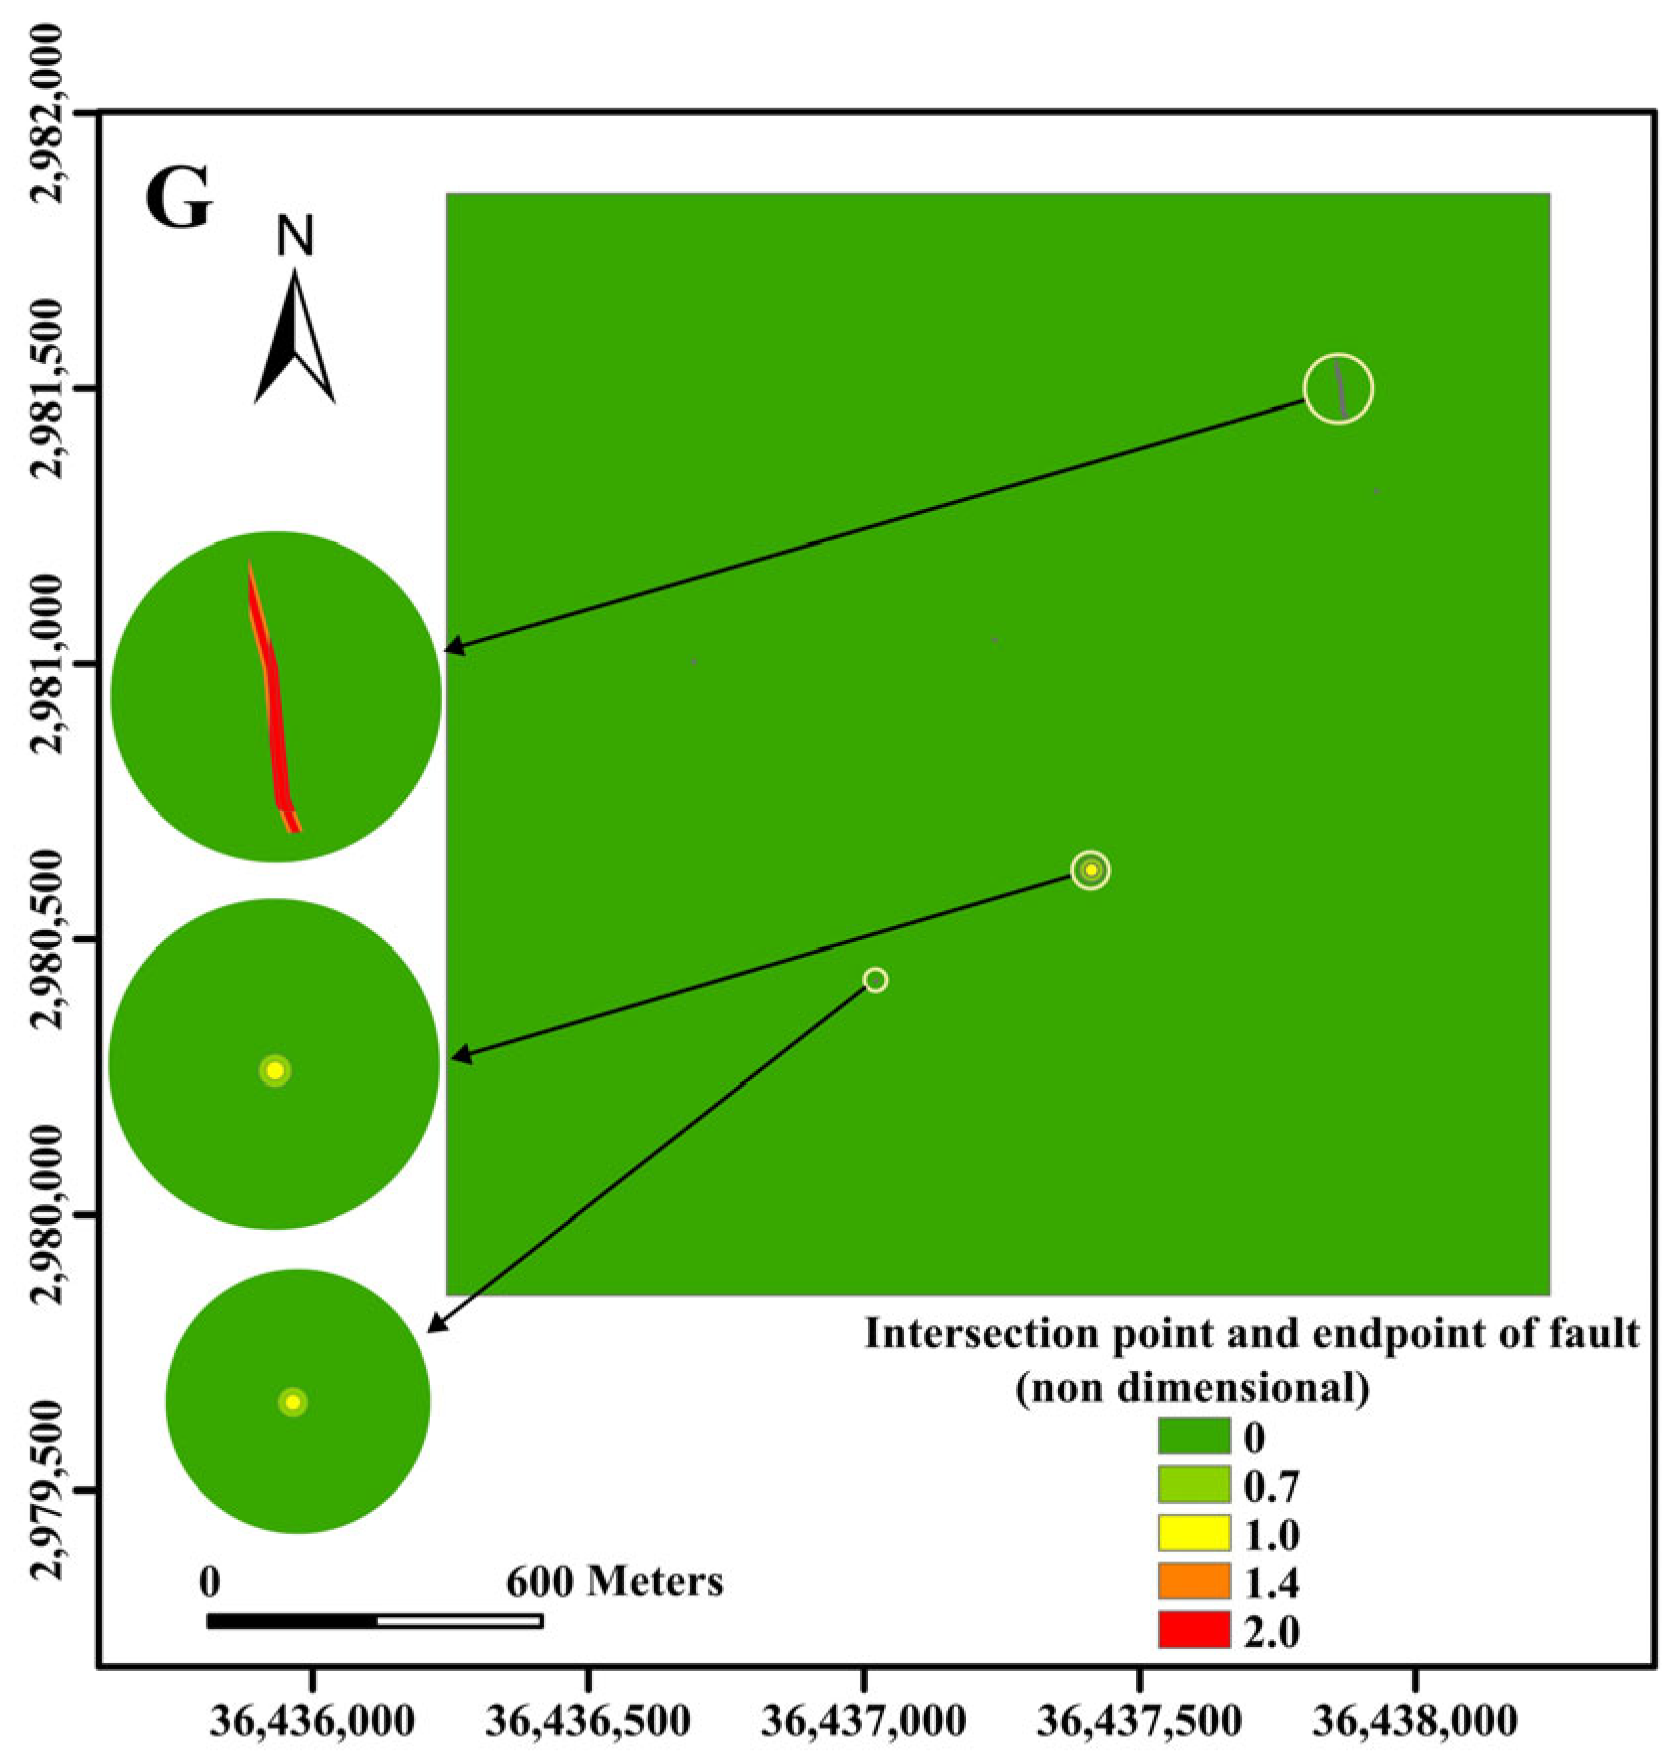
Intersection point and endpoint of fault: Faulting produces certain endpoints and intersections in spatial distribution, and is a place where ground stress is more concentrated and where rock breaks, as well as fractures, develop [
20]. These points are often strongly water-rich areas and are prone to forming water-conducting channels. The fault intersection endpoints are quantified in the geotectonic map as 0.7, 1.0, 1.4, and 2.0.
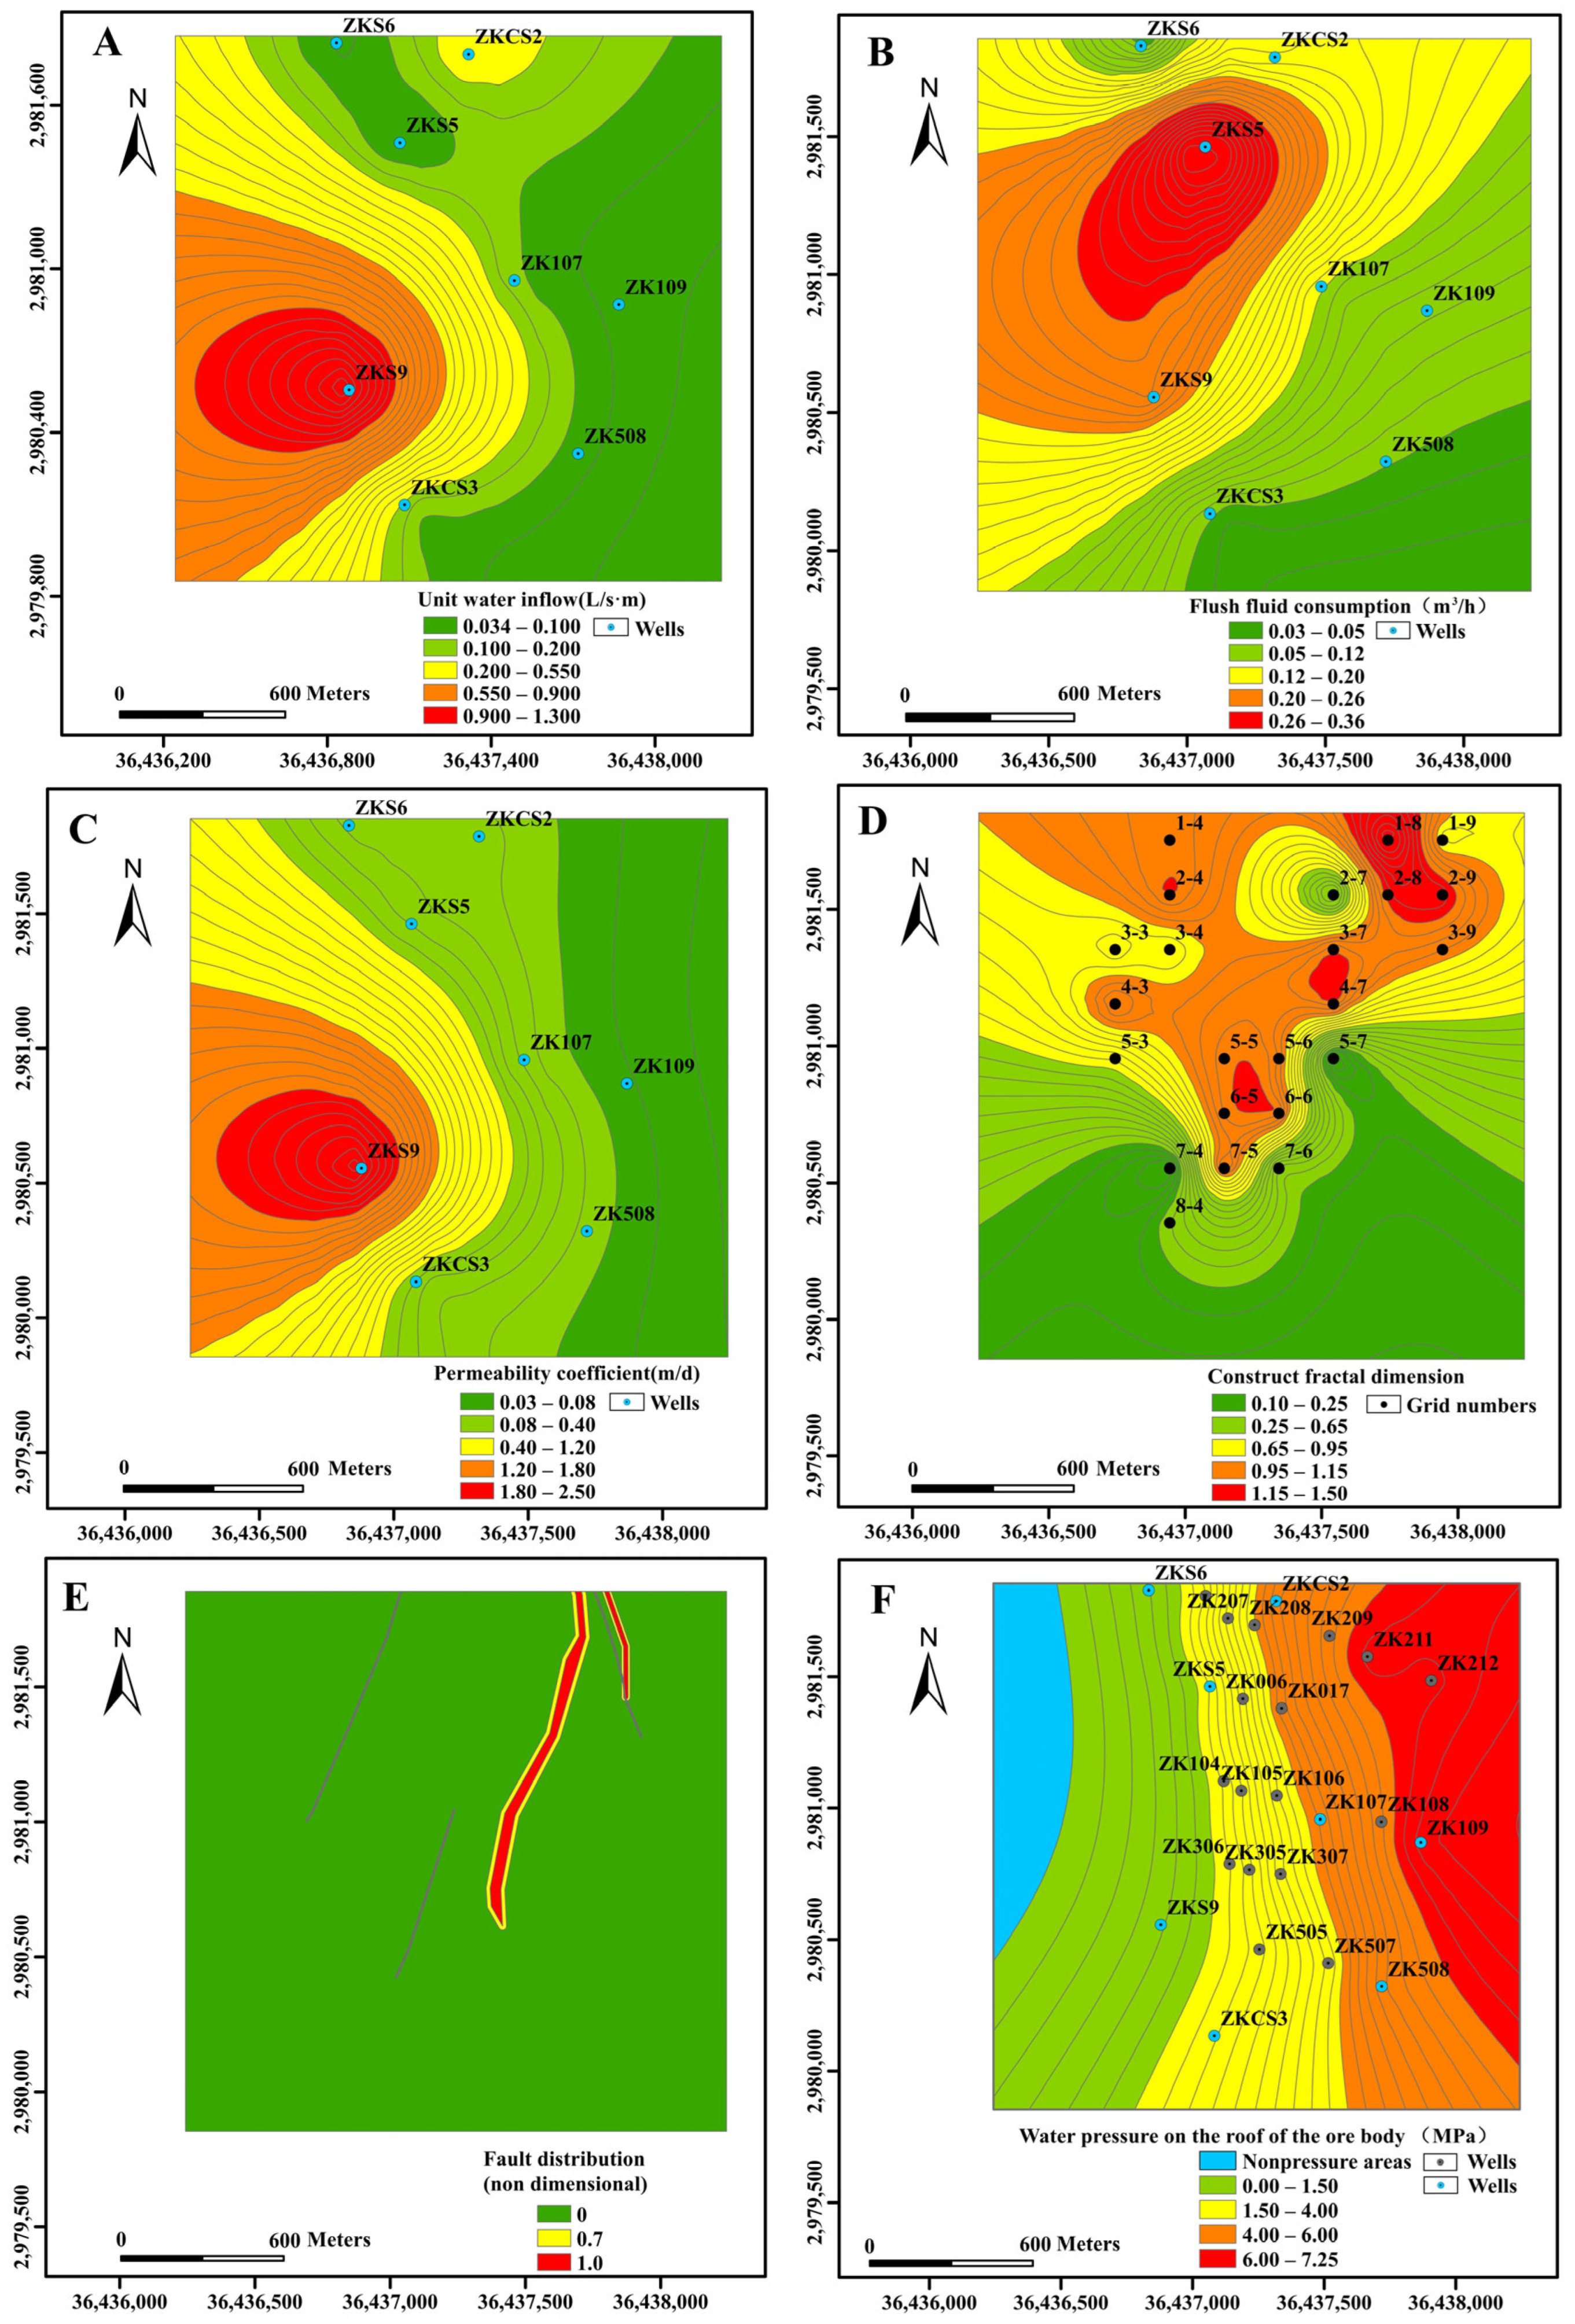
3.1.2. Thematic Maps
When making thematic maps of unit water inflow, permeability coefficient, and drilling flushing fluid consumption, the data for these three indicators were obtained by conducting pumping tests on eight drill holes at the site. The data on the water pressure of the roof of the phosphate mine were obtained by calculating the elevation of the top of the ore body in 50 drill holes and calculating the difference between it and the groundwater level. The constructive dimensional shapes were derived by counting the dimensional values of each block section. Surfer software, version 15.3.307, is a professional software for geographic information systems (GIS) and scientific data visualization that can be used to interpolate data to generate contours. ArcGIS, version 10.5.0.6491, is a powerful GIS software that can be used to create, manage, analyze, and visualize geographic data as well as for map production [
21]. These data were interpolated using Surfer, and the corresponding thematic maps of the indicators were produced using ArcGIS. In addition, for the faults and fault intersection endpoints in the geotectonic map, the quantization process was carried out, and the corresponding indicator thematic maps were produced using ArcGIS (
Figure 5A–G).
3.2. Water-Richness Zoning Model Based on Random Forest
3.2.1. Random Forest Algorithm
Breiman introduced the concept of random forest in 2001 as a statistical learning theory, providing a predictive modeling approach [
22]. It represents a novel approach to combining mine hydrogeology and data integration, offering fast data processing speed, robust anti-interference capability, and the ability to predict the weight of each index in mine-water-richness zoning. Compared with the traditional method of predicting the water richness of aquifers, random forest has high prediction accuracy and insensitivity in dealing with anomalous data, and its prediction results are more objective, accurate, and scientific. It also possesses a number of advantageous traits, including the capacity to manage substantial amounts of complex data and the capacity to clarify the connection between variables and results [
23]. Therefore, random forests are widely used in the fields of finance, medicine, etc.
The random forest algorithm has the following advantages in water-richness zoning of karst aquifers at the top layer of phosphate mines [
24,
25,
26]:
Decision trees perform the splitting process by classifying the data through dichotomization.
Its generated classifier can handle different kinds of data simultaneously.
In the case of missing or incomplete data, it can maintain high prediction accuracy.
It has the ability to estimate the internal generalization error at runtime and to give the importance measure of each feature.
The training is insensitive to outliers or unbalanced datasets, making the error small and the results accurate.
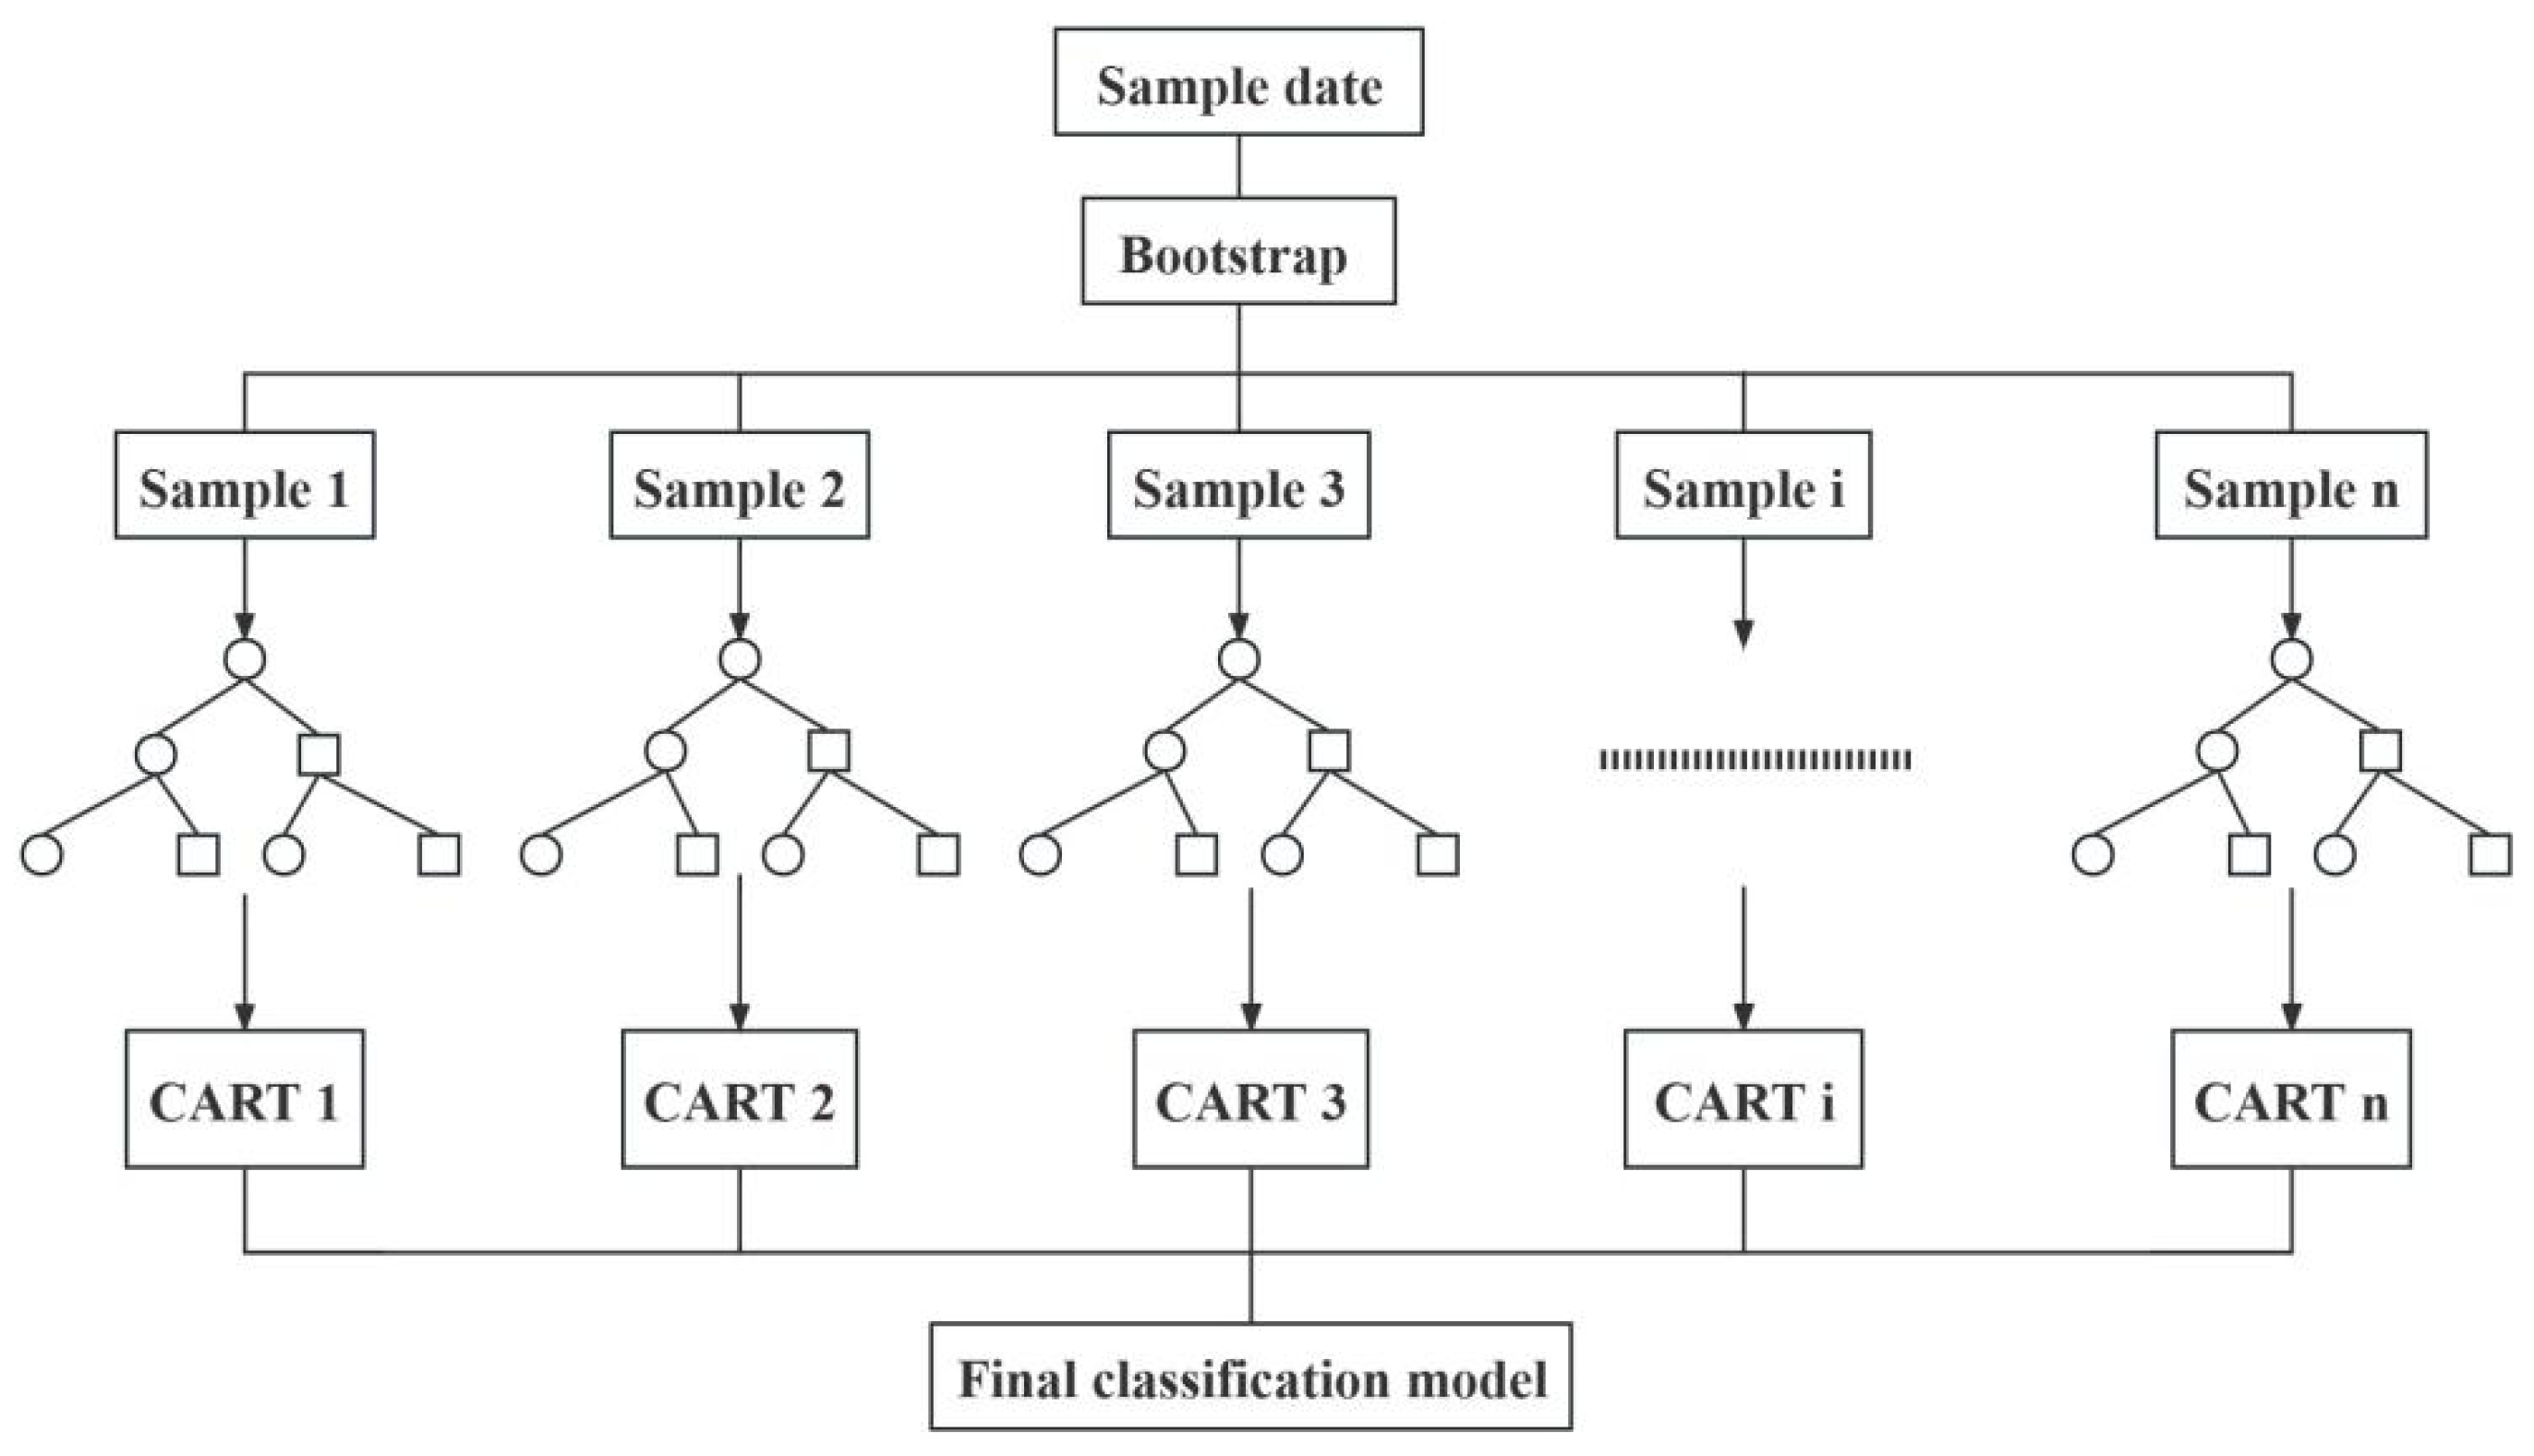
The principle of random forest is to use the Bootstrap resampling method to draw multiple training samples from the original dataset, and each training sample constitutes a single decision tree. The final result of the random forest is created by voting on multiple decision trees that have been built. The node-splitting criteria for a single decision tree model are based on the Gini index after various factor values are chosen for each node [
27]. Decision trees are effective in handling samples from the original dataset, separating high and low values of different indicators in the prediction results, and highlighting the differences in the importance of different indicators. However, the accuracy of a single decision tree is not high in the face of large and complex datasets. Several decision trees are created in the random forest’s development, utilizing the Bootstrap resampling technique to extract numerous training sample subsets. The forest, composed of multiple decision trees, avoids the disadvantage of the low accuracy of single decision trees, and its prediction results are intuitive and highly accurate [
28,
29,
30].
The specific implementation of the random forest algorithm is as follows:
Using the Bootstrap resampling method, m training samples are randomly drawn from the original sample set n with put-back.
For the m training samples drawn by Bootstrap, k unsplit decision trees are created. In the splitting process, m features are randomly selected as internal nodes (m < M) from the total M features in each training sample set, and then the feature with the smallest Gini index is selected as the splitting node according to the Gini algorithm to continue the splitting process without pruning to maximize its growth, and finally a single decision tree is generated. The splitting formula is as follows:
where
pi denotes the probability that the sample belongs to category
i, and
n is the total number of categories. The larger the Gini index, the more impure the samples.
- 3.
The process is repeated m times to obtain m decision trees; after m decision trees are obtained, voting occurs to obtain the final classification results.
The specific flow of the random forest algorithm is shown in
Figure 6:
3.2.2. Out-of-Bag Error Estimate
During the construction of the random forest model, there will be some data that are not collected because of the Bootstrap resampling method used to draw training samples from the original dataset with put-back. The probability of uncollected data is (1 − 1/n)n [
31]. According to this equation, it can be concluded that the probability of data not being captured is approximately equal to 0.368, which is the out-of-bag data OOB. While constructing the random forest model, the out-of-bag data can be utilized to compute the model error, commonly referred to as the out-of-bag error. Because of the unbiased nature of out-of-bag errors, there is no longer a requirement for cross-validation or separate test sets in the random forest technique to produce unbiased estimates of the test set errors [
32,
33,
34].
3.2.3. Feature Importance Analysis Method
In the random forest algorithm, there are two approaches to assessing the importance of features. One method is the mean decrease accuracy based on the Gini index (Equation (1)), while the other method is the mean accuracy decrease approach. Mean accuracy decrease is a measure of feature importance based on out-of-bag data [
35]. The basic principle is to repeat the process by recording the prediction error of the out-of-bag data for each decision number and then ranking or adding noise to each predictor variable. After averaging the difference between the two overall decision trees and normalizing the standard deviation of the difference, the feature importance (Equation (3)) is obtained. The greater the difference in prediction error between the two out-of-bag data, the greater the influence generated by the feature and the higher the importance.
where
Xj is the
jth eigenvalue in the OOB data,
n is the number of decisions,
ei2 is the prediction error of OOB after adding noise or making permutations,
ei is the original error, and
W(
Xj) is the importance of the variable
Xj.
3.2.4. Selection of Training and Validation Samples
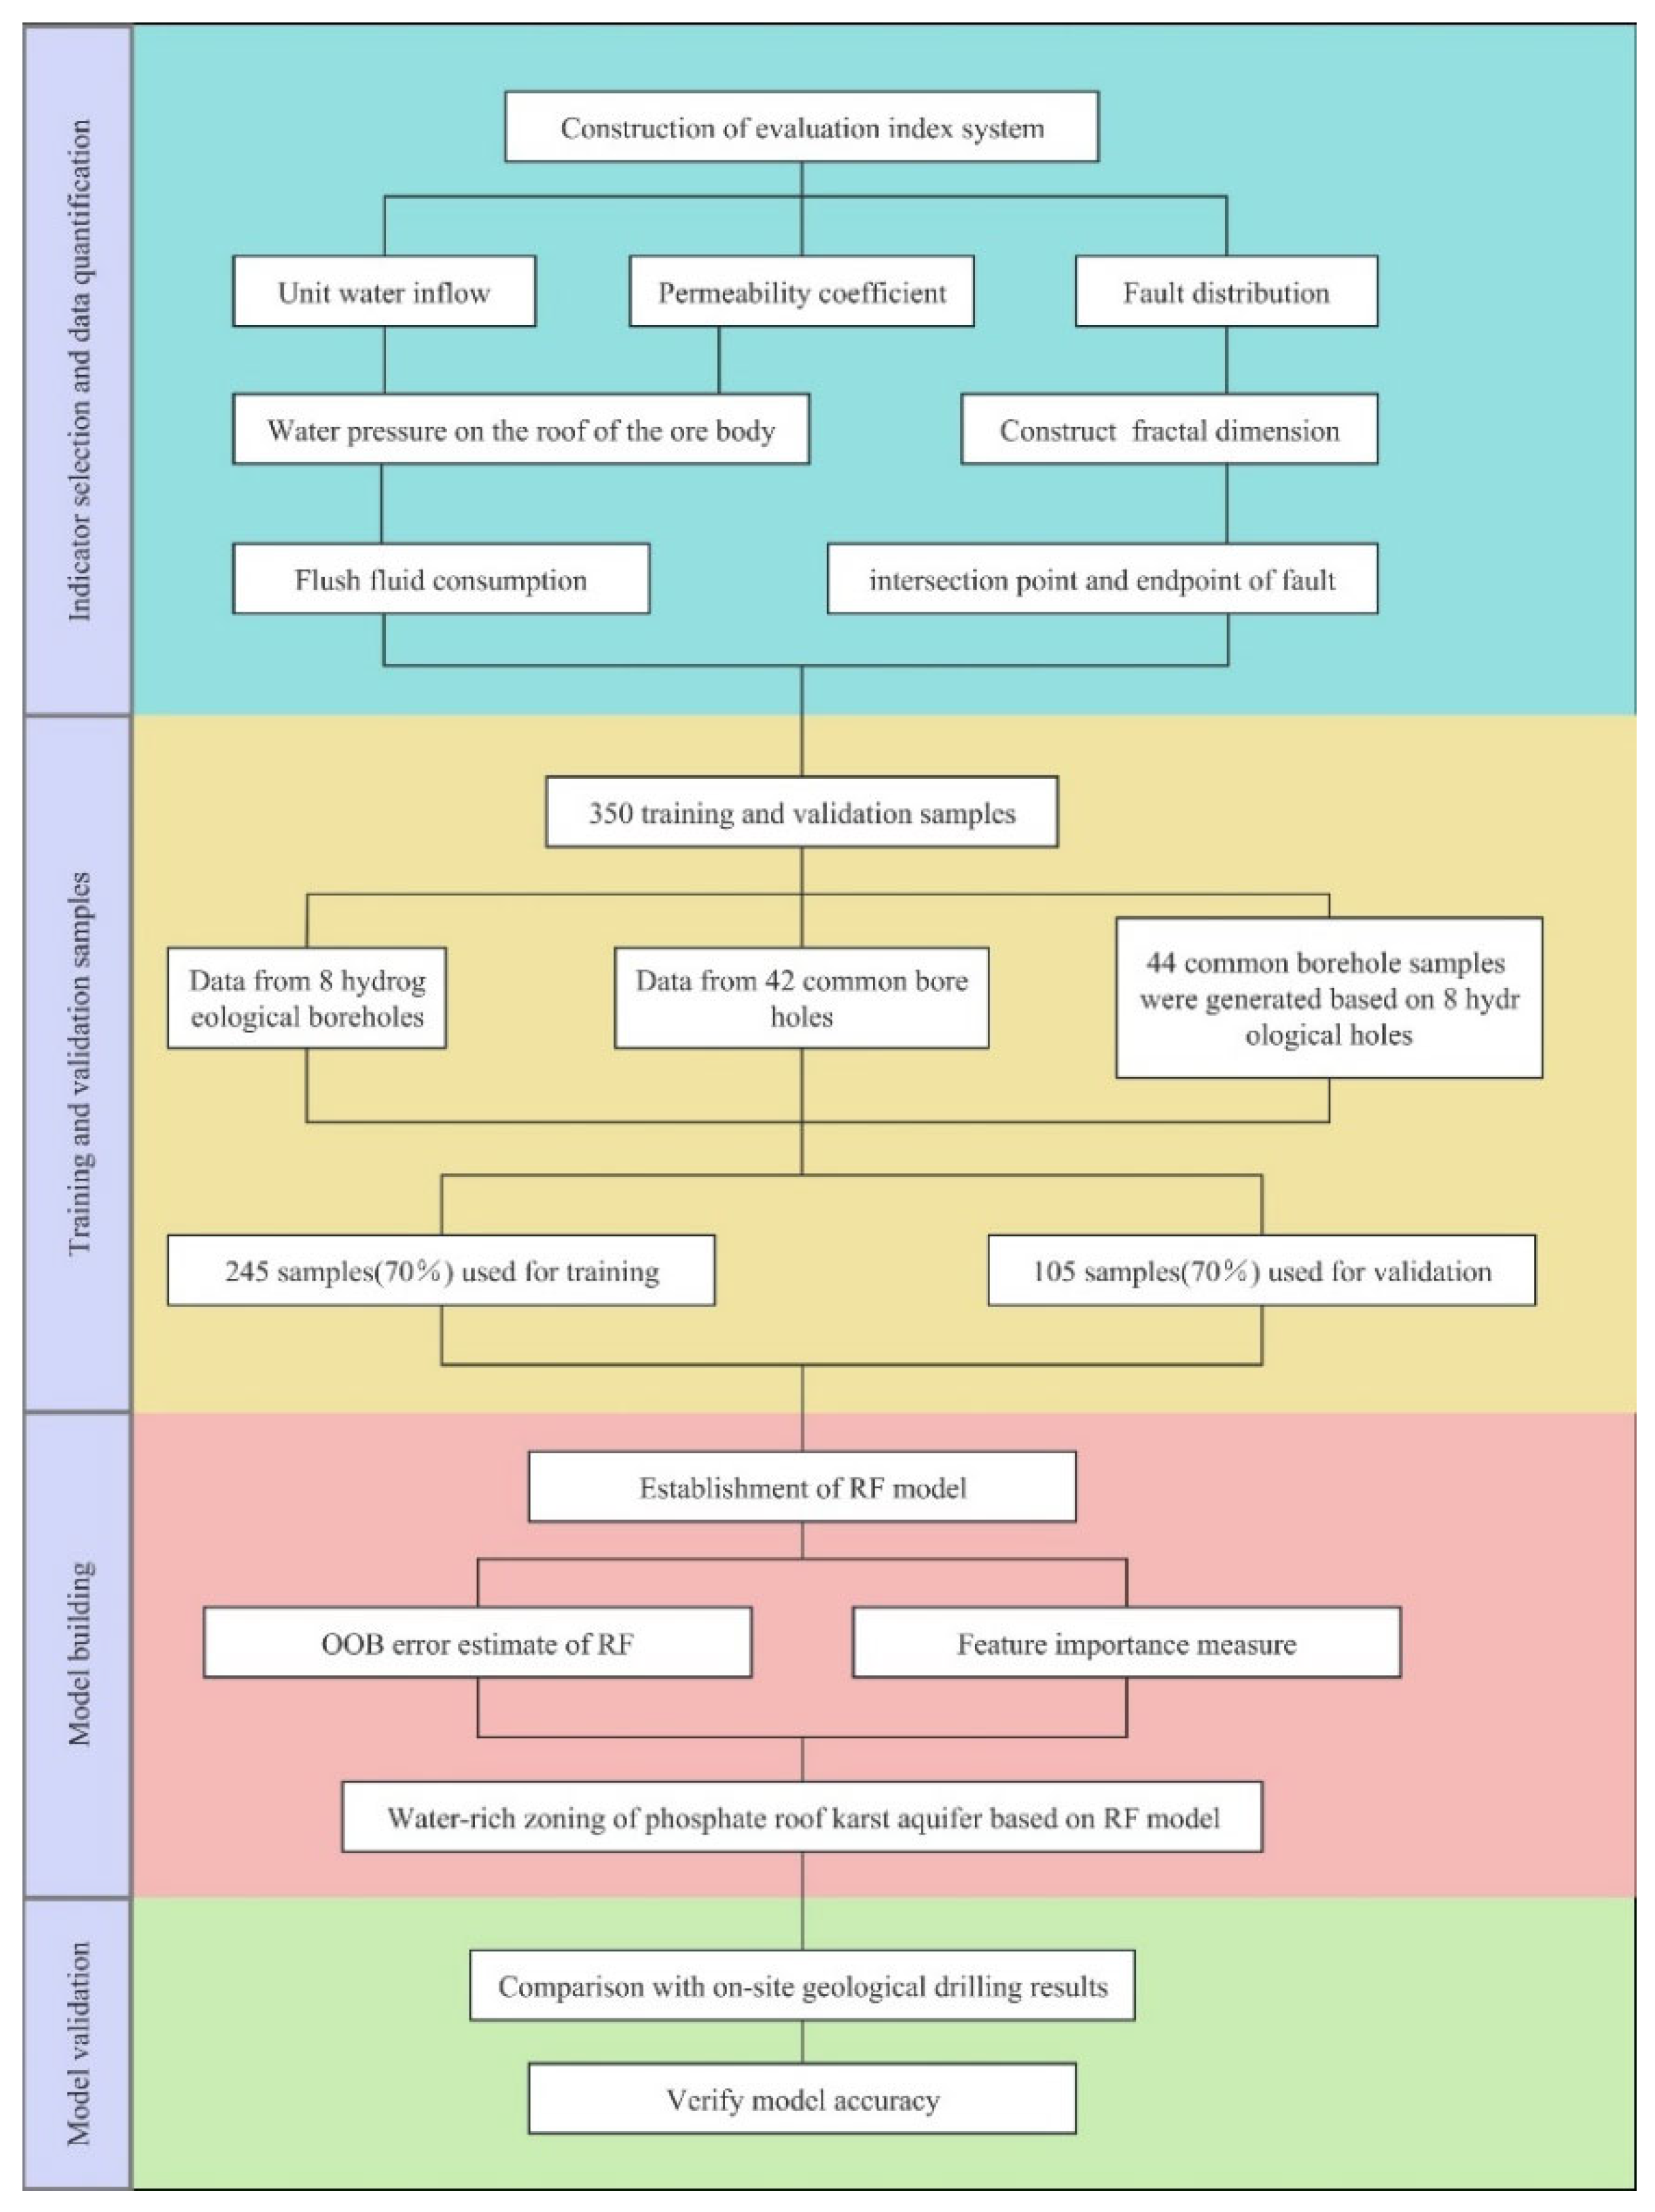
Before using the random forest to determine the weights of each index in the water-richness partition of the study area, the data of each index need to be selected as sample training data for model building.
Figure 7 shows the detailed flow of the complete building process of the random forest model. The data of each indicator in this paper are positive samples, and the larger the data samples, the greater the representation of the water-rich region, so there is no need to consider the influence of negative samples on the model. More complete pumping test information was provided by collecting data from a total of 50 boreholes in the study area, including eight wells. Since some of the drillings were not within the mining boundary, they are not all indicated on the structural outline map. On the eight sites, pumping test data were collected to obtain the permeability coefficient and unit water inflow. According to the thematic maps based on the data of these eight wells, the unit water inflow and permeability coefficient of the other 42 boreholes were obtained to supplement the random forest training samples. In addition to this, the structure development area was quantified. A total of 350 data were obtained to characterize seven indicators of water-richness intensity in the study area, which were large enough to be used as training samples for constructing a random forest model.
3.2.5. Establishment of the Random Forest Model
In this paper, the random forest model was constructed with the indicator data constituting the water-richness partition as training samples, and the importance of each indicator feature was obtained by classification through the random forest algorithm, which defined the objective weight of the indicator. The count of split features (m) and the count of decision trees (k) during the random forest model’s creation have an important influence on the model’s accuracy. To enhance the accuracy of the random forest model, it is essential to carefully choose the number of decision trees and the number of split features. Insufficient decision trees during the model construction can result in unmanageable classification errors and suboptimal performance. If the number of decision trees becomes excessively large, it can lead to increased computation time and introduce fluctuations in model accuracy.
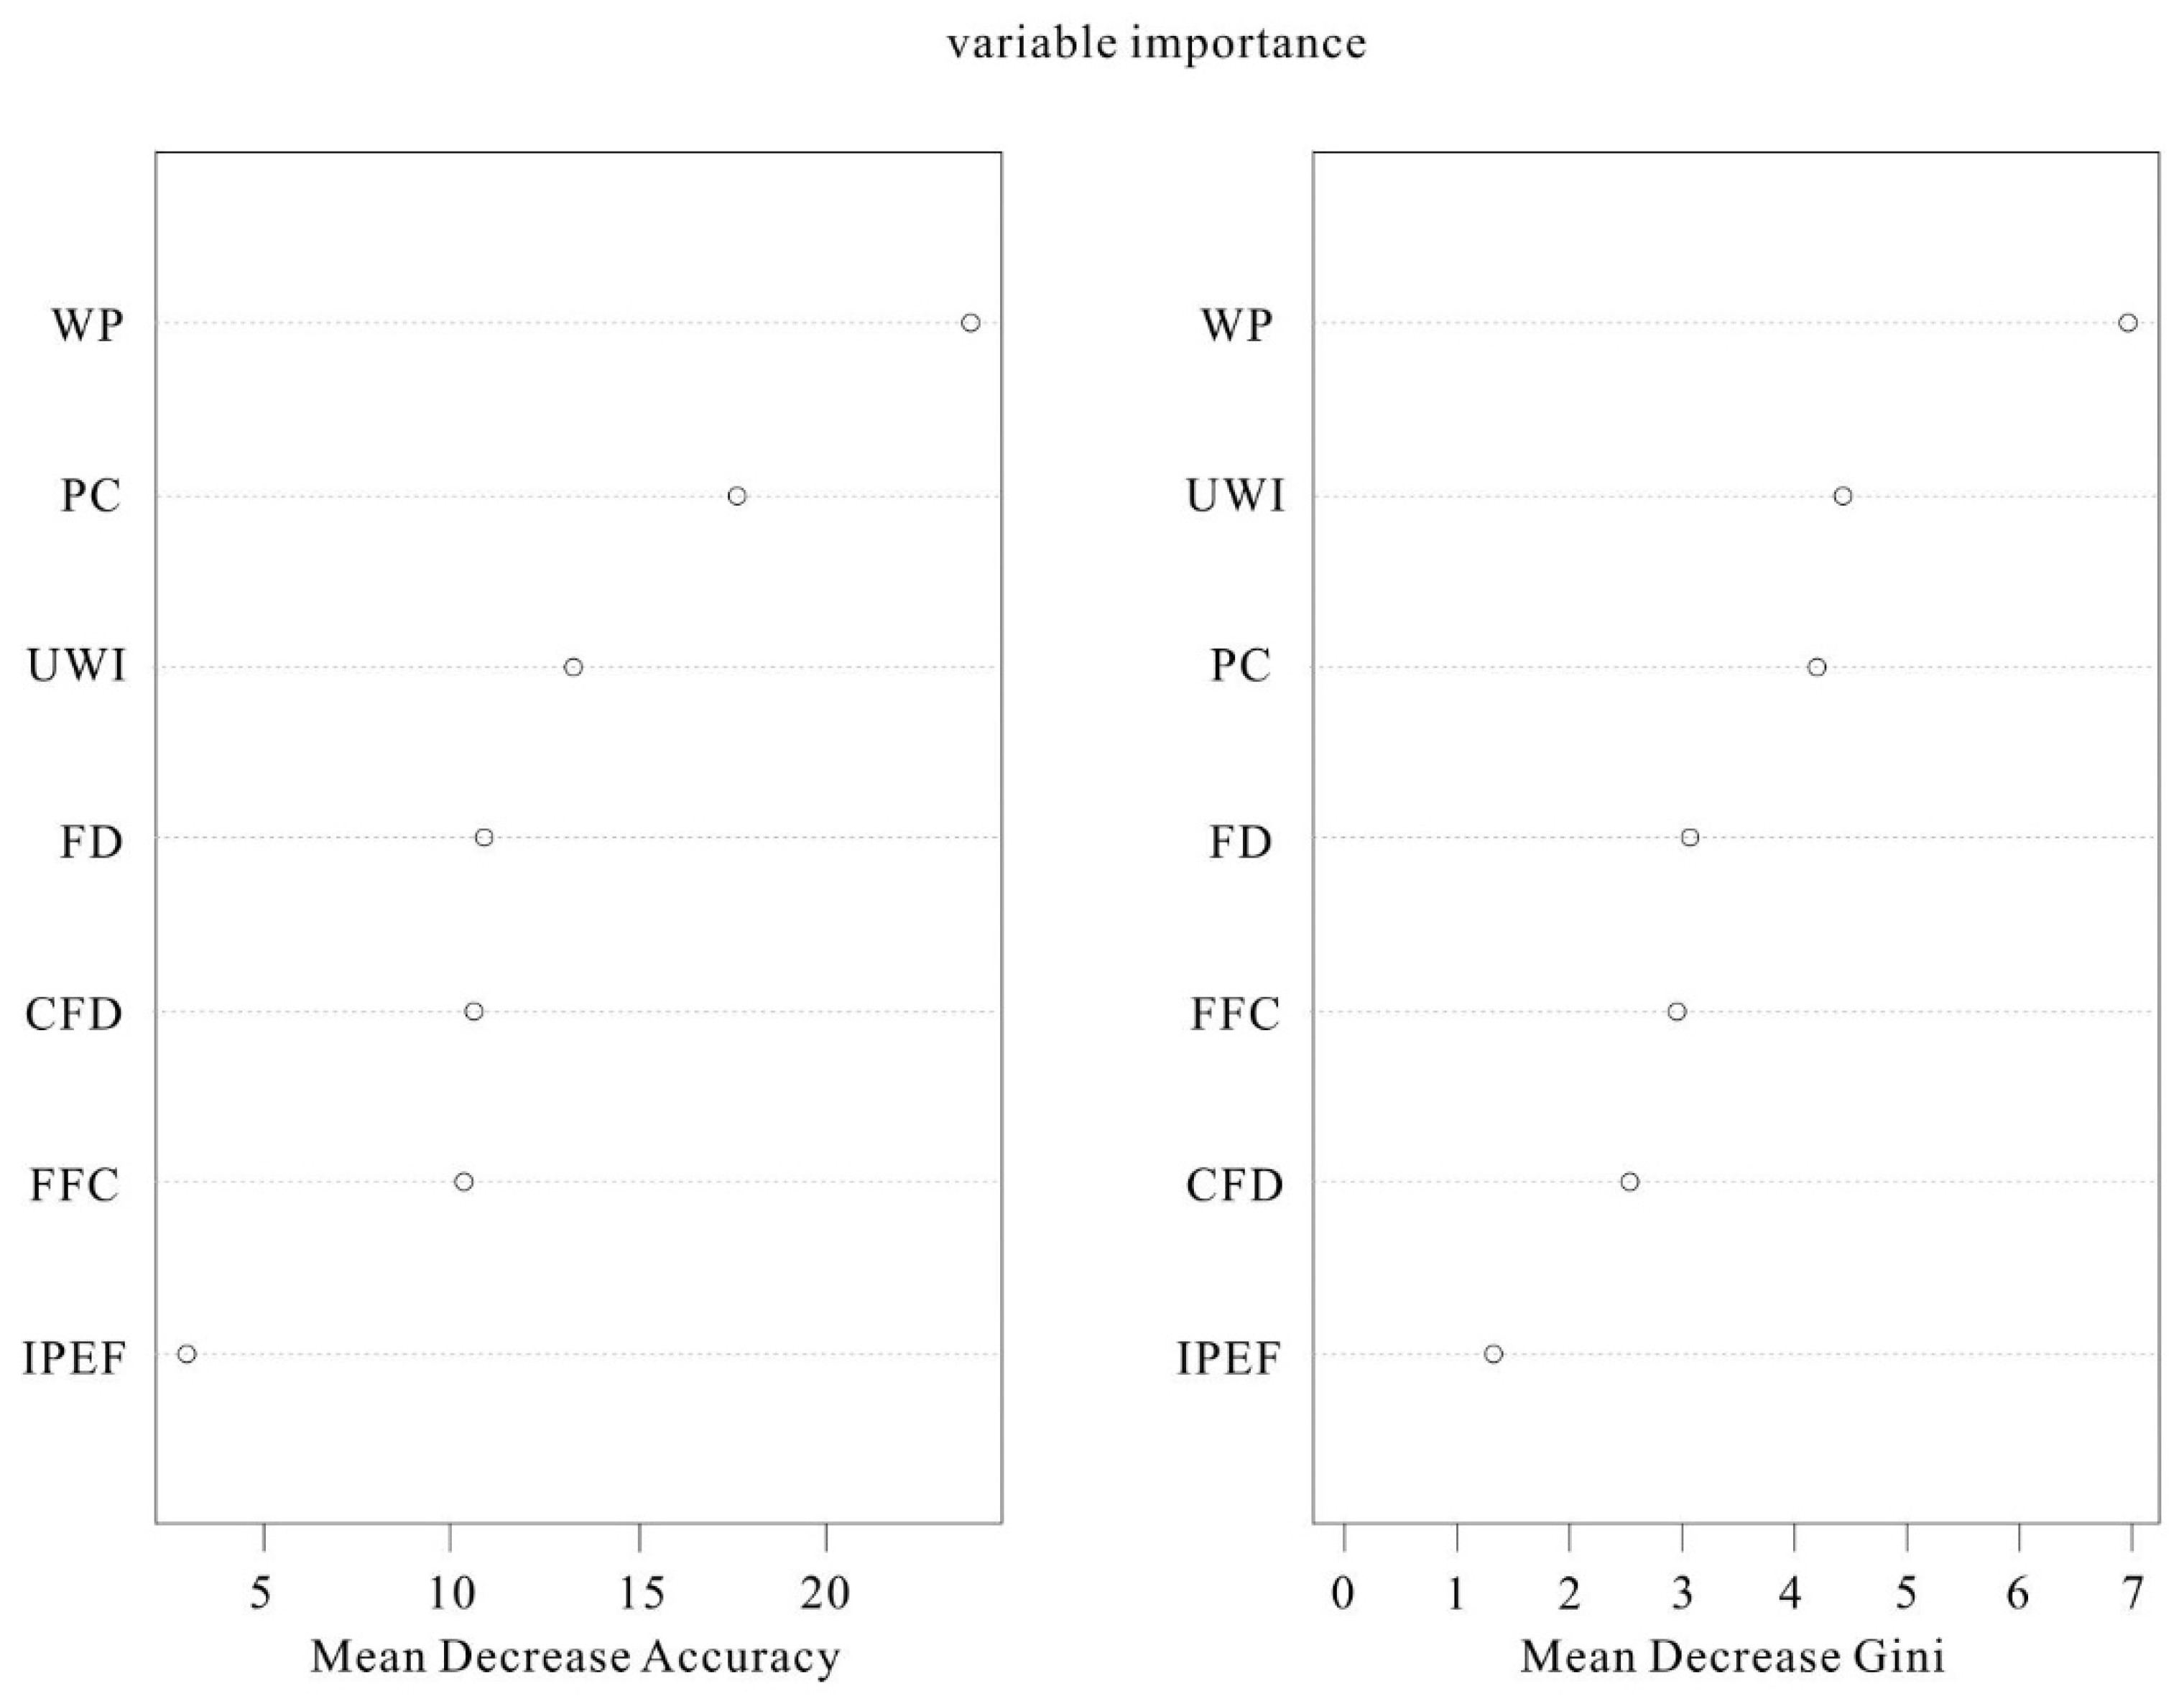
The random forest model feature importance map was obtained by model calculation, and the importance map of each indicator is shown in the figure (
Figure 8). In the model construction process of random forest, the importance of indicators can be determined not only by Gini decrease accuracy but also by using the mean decrease accuracy of out-of-bag error. According to the Gini index, the highest importance of water pressure at the roof of the phosphate mine was followed by the unit water inflow and permeability coefficient of the aquifer, indicating that these three factors were the most important variables affecting the intensity of water richness in the phosphorus mine area. Next was the fault distribution and drilling flushing fluid consumption, while the number of construction fractal dimensional shapes and fault intersection endpoints were of low significance. According to the mean decrease in accuracy of out-of-bag error, the water pressure at the roof of the phosphate mine was of highest importance, and the fault intersection was of lowest importance. The order of importance of permeability coefficient, aquifer unit water inflow, constructional fractal shape number, and drilling flushing fluid consumption changed. Combining the two indicators for determining the characteristic importance, the three factors that had the most significant impact on the water abundance in the phosphate mine were the water pressure indicators on the roof, the unit water inflow from the aquifer, and the permeability coefficient. These indicators held the highest importance, suggesting that they exerted the greatest influence on the water content in the phosphate mine. This is consistent with previous studies. From the viewpoint of the overall distribution of the study area, indicators such as water pressure of the roof plate of the phosphorus mine, permeability coefficient, water influx per unit of the aquifer, and the consumption of drilling flushing fluid represented the overall nature of the mine area. The local tectonic development area in the mining area also had a significant influence on the distribution of water richness. Therefore, all seven indicators had indispensable and important roles in the construction of the water-richness zoning model of the study area. All these seven factors were applied to constitute the indicator system in this paper to generate the random forest model.
According to the ranking diagram of the characteristic importance obtained from the Gini index and OOB error reduction accuracy, the characteristic importance calculated from the Gini index was selected as the weight of each indicator of the water-richness subdivision in combination with previous studies. The weights of each indicator are shown in the following table (
Table 1):
4. Model Application and Validation
4.1. Results of Water-Richness Zoning Evaluation Based on Random Forest
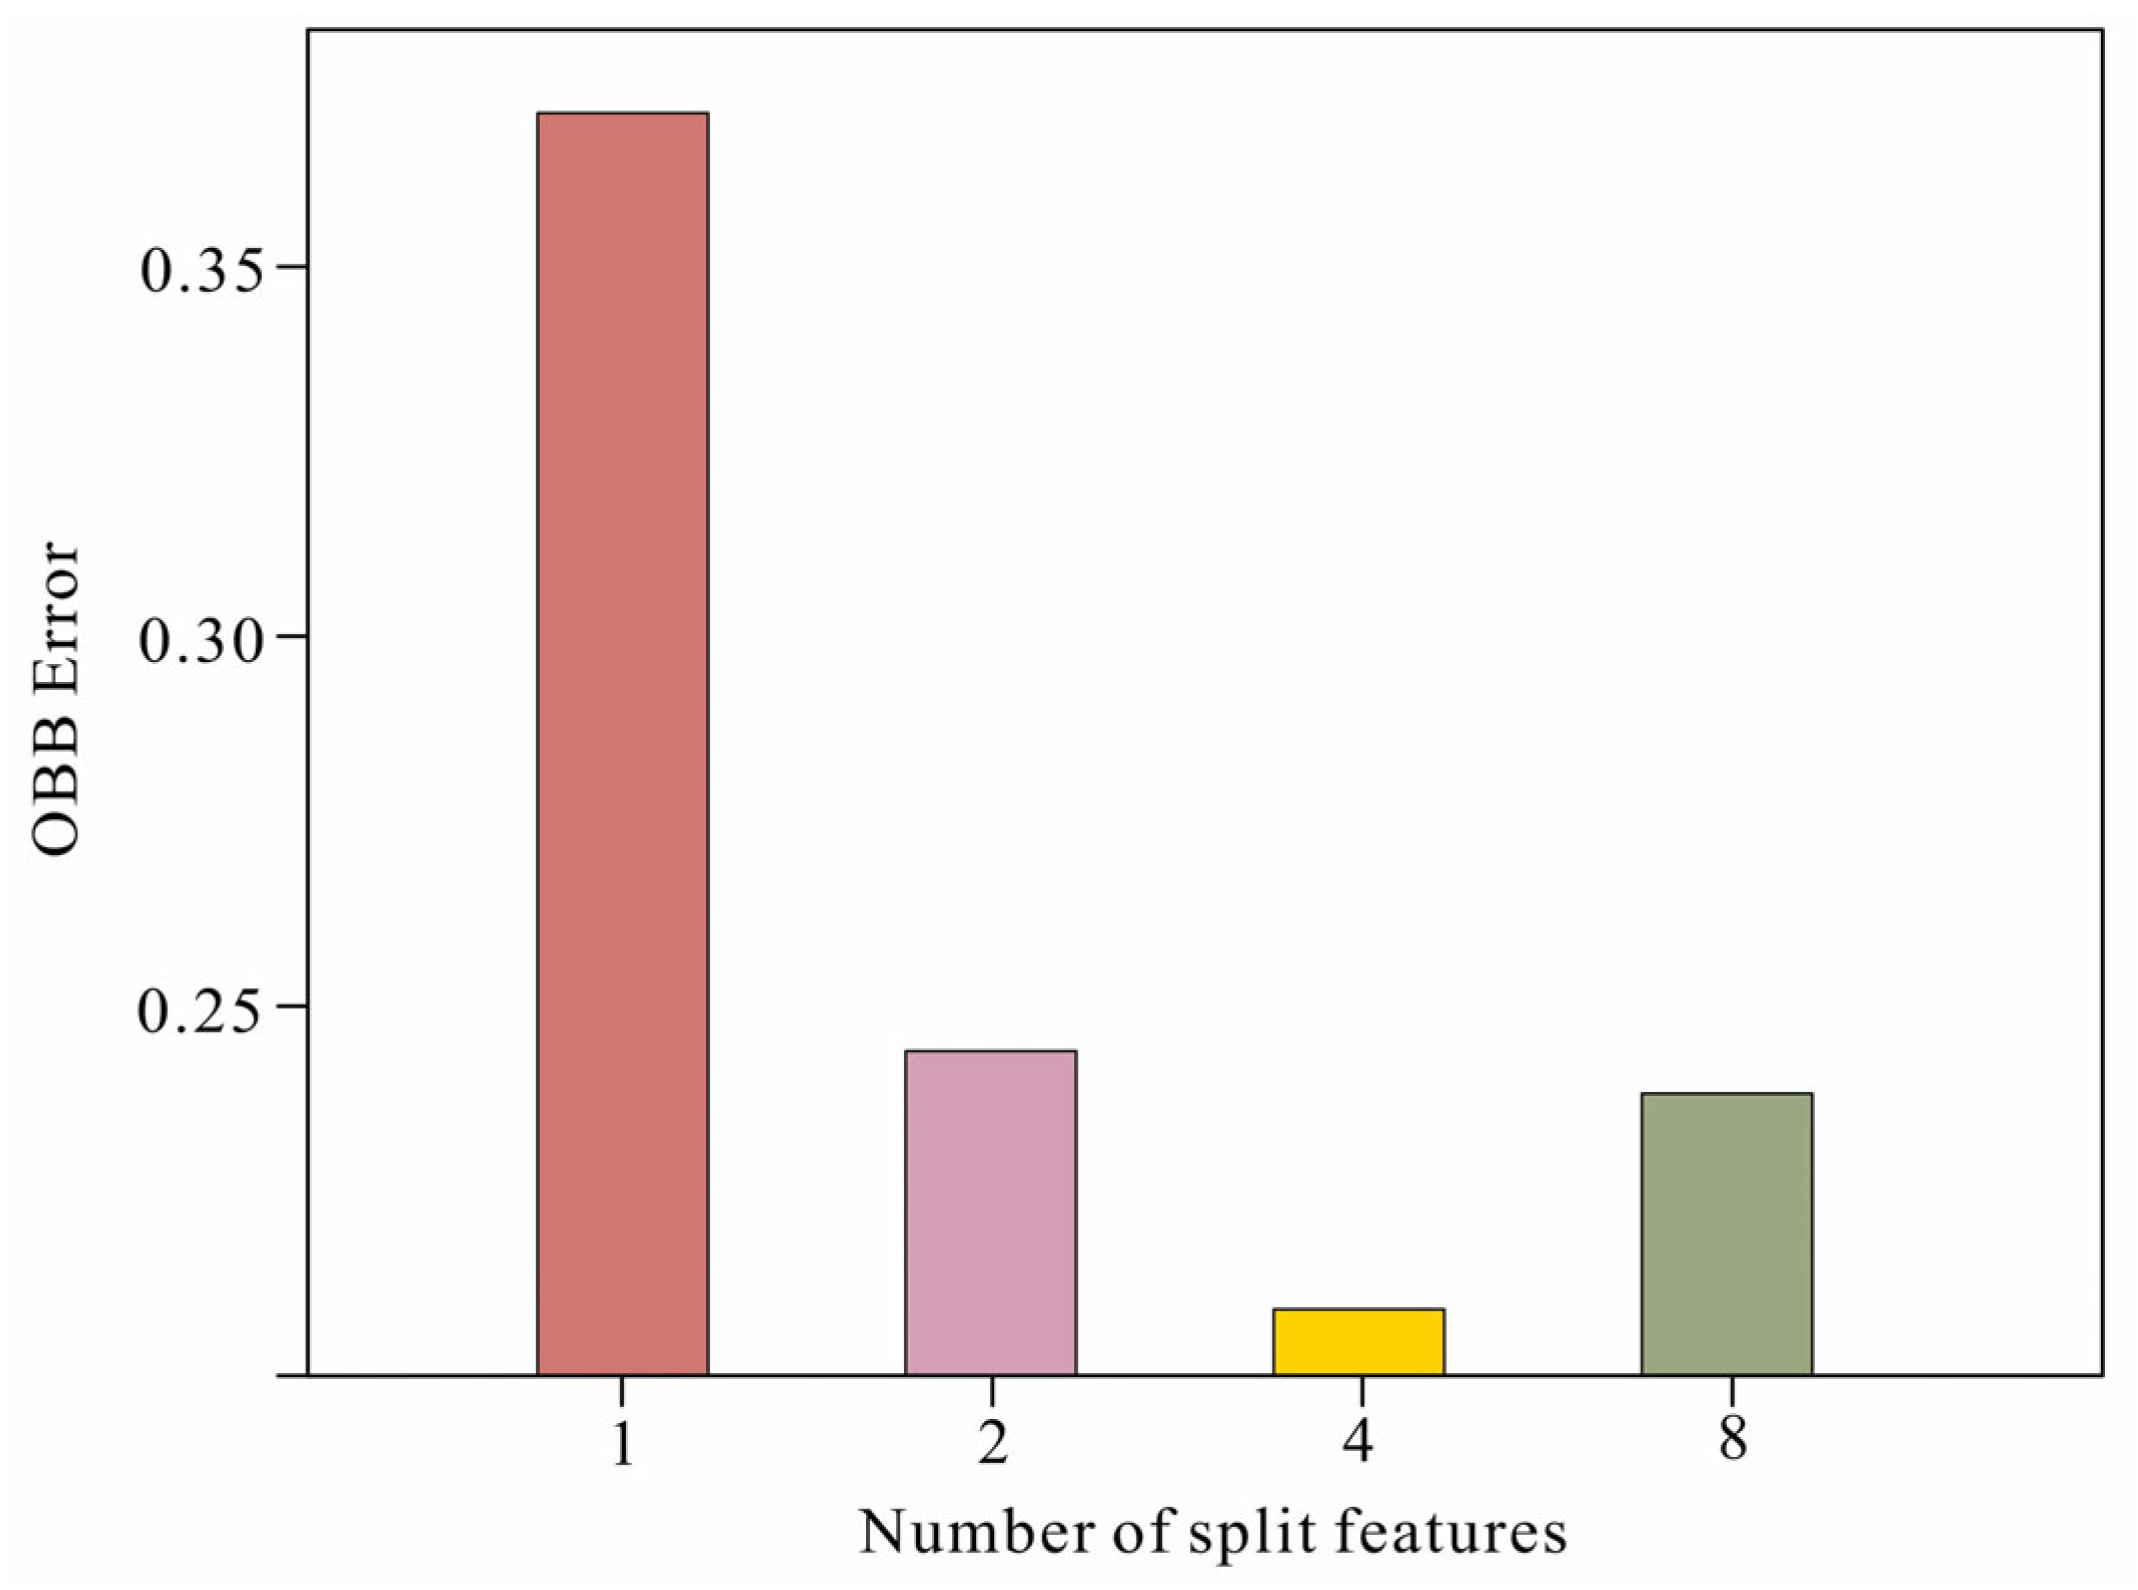
In this study, the two most important parameters, the number of decision numbers and the number of splitting features, were optimized to make the random forest model achieve the highest accuracy in order to determine the optimal number of splitting features (m), that is, to identify the number of splitting features for the lowest out-of-bag error case. By testing the values of m from 1 to 15, it was found that the lowest out-of-bag error occurred when m was set to 4 (
Figure 9).
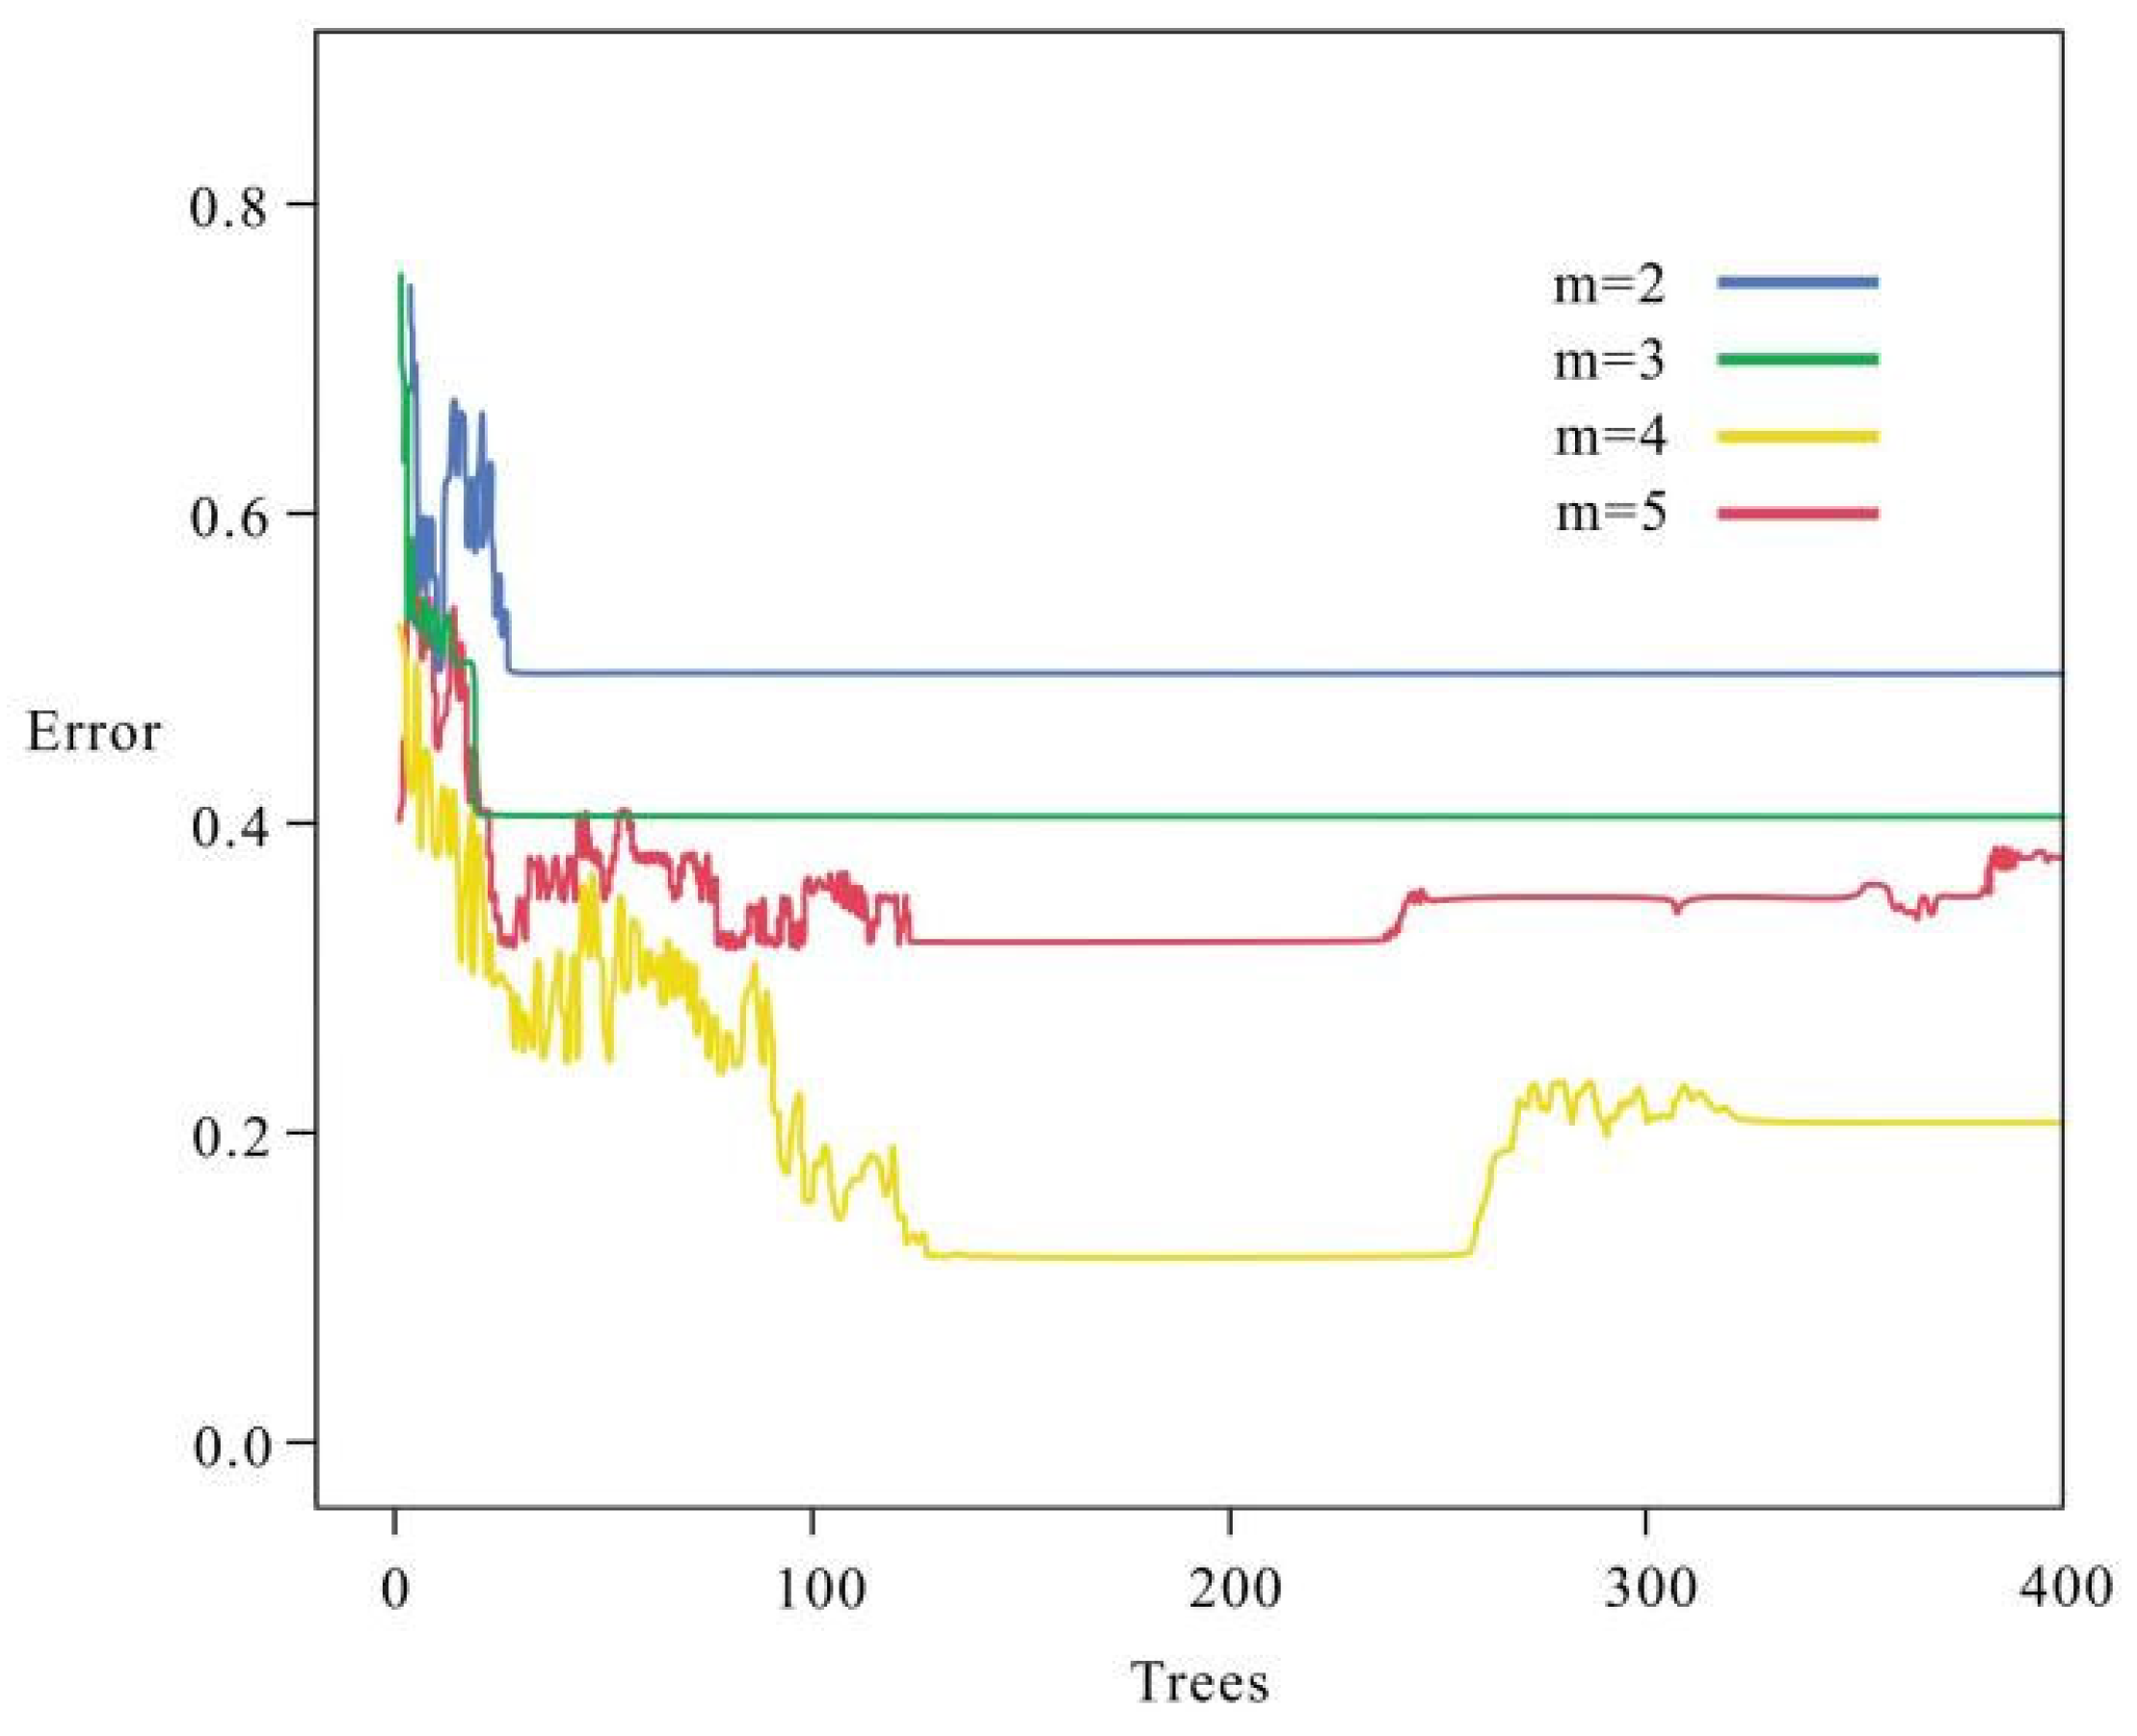
In the context of determining the number of splitting features m to be 4, the model error of the random forest was calculated for m = 2, 3, 4, and 5, respectively, in order to determine the optimal number of decisions (
Figure 10). The figure demonstrates that the optimal performance, characterized by the highest training sample accuracy and the lowest out-of-bag error, was attained when the number of decision trees was set to k = 200. The error relationship between the combined quantity of decisions and the splitting features led to the following conclusion: the highest model accuracy was reached at the quantity of splitting features of 4 and the number of decisions of 200, which was 0.875. Therefore, the optimal number of two important parameters of the stochastic model was determined in this paper. k = 200 and m = 4.
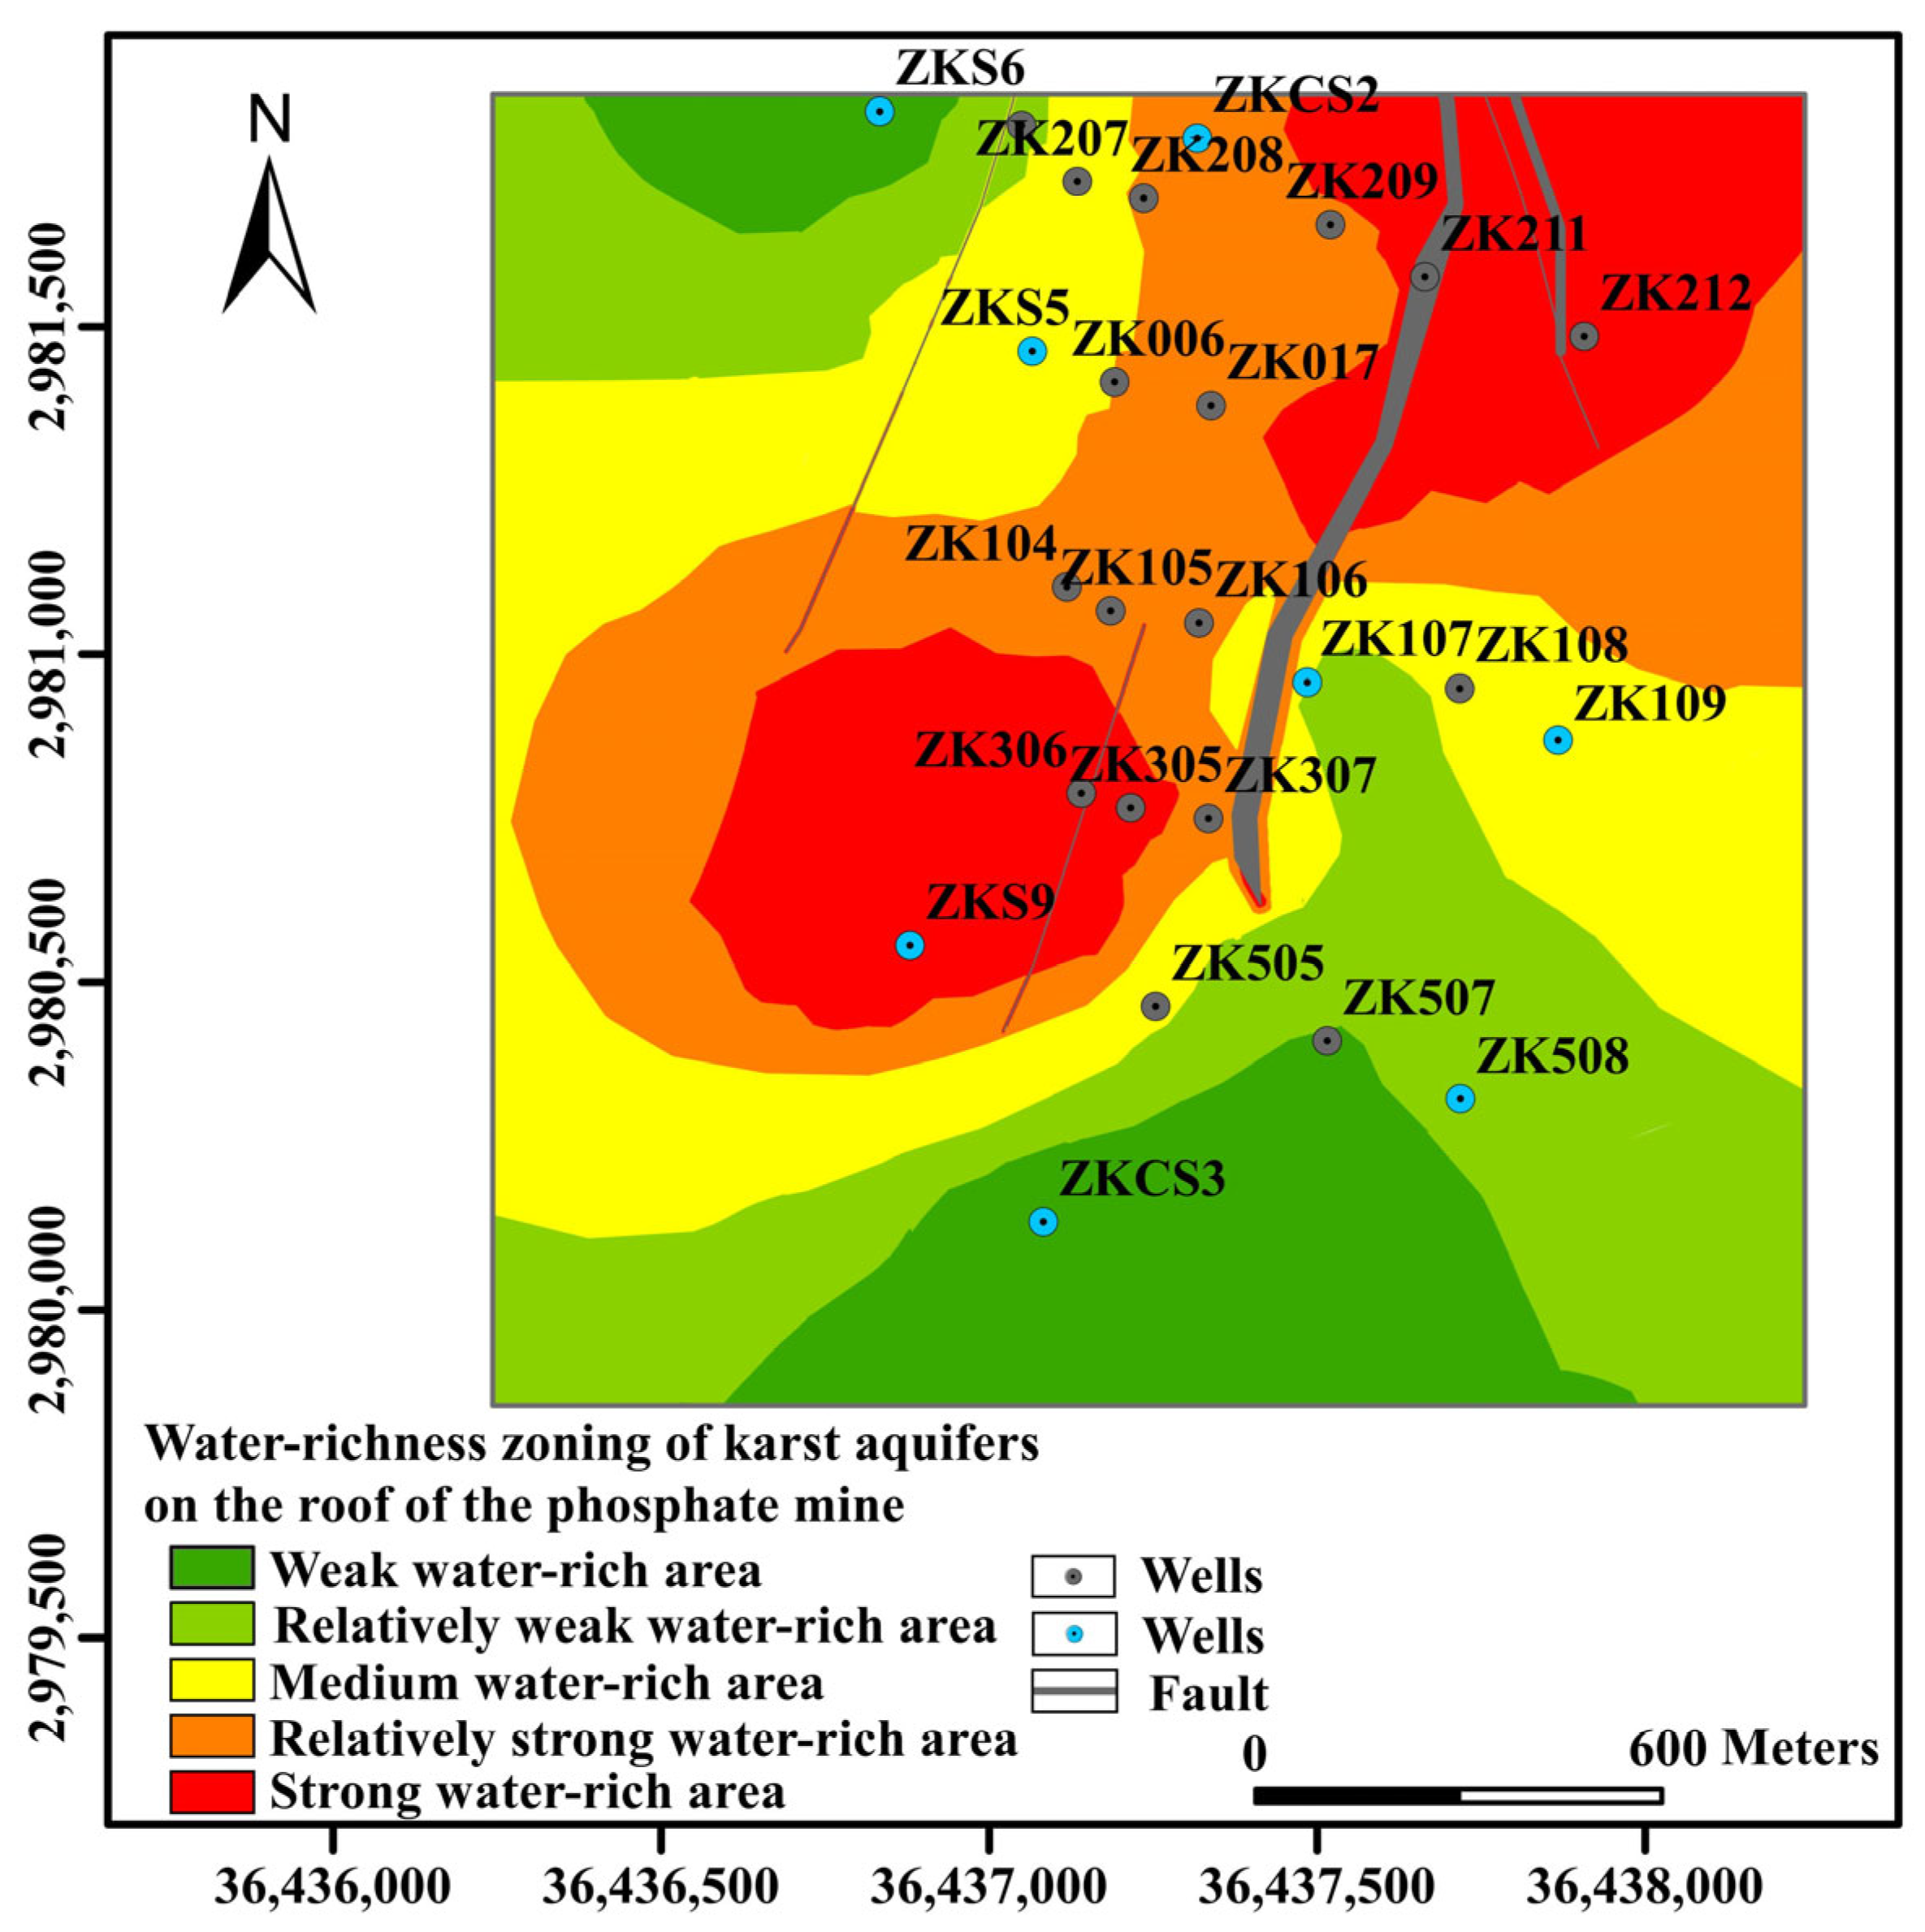
By building a random forest model using the sample data, we obtained the weights for each indicator of water-richness zoning. The normalized layer data of each indicator were multiplied with the corresponding weights calculated by the constructed random forest model, and then multiplied using GIS technology to finally obtain the evaluation result diagram of water-richness zoning in the study area (
Figure 11).
As shown in
Figure 11, the intensity of water-richness in the study area shows a transition from east-west to north-south. Among them, the strongly water-rich areas are mainly concentrated in the central and northeastern parts and the tectonically developed areas, and the strongly water-rich areas account for 16.7% of the total area. The characteristics of different water-rich areas are shown in
Table 2:
4.2. Validation of Evaluation Results
In the identification and testing of the water richness of karst aquifers on the roof of phosphate mines, this paper introduces the concept of water-rich fitting percentage (WFP) to confirm the evaluation model’s accuracy. To match the model, wells were selected for validation in both highly water-rich and non-water-rich locations. When WFP was greater than 90%, the model was considered to meet the relevant criteria; otherwise, the parameters were modified to re-match, the expression of which is given in Equation (4).
where
DS stands for the total number of fitted points, and
DF stands for the number of points where the assessment findings match the actual.
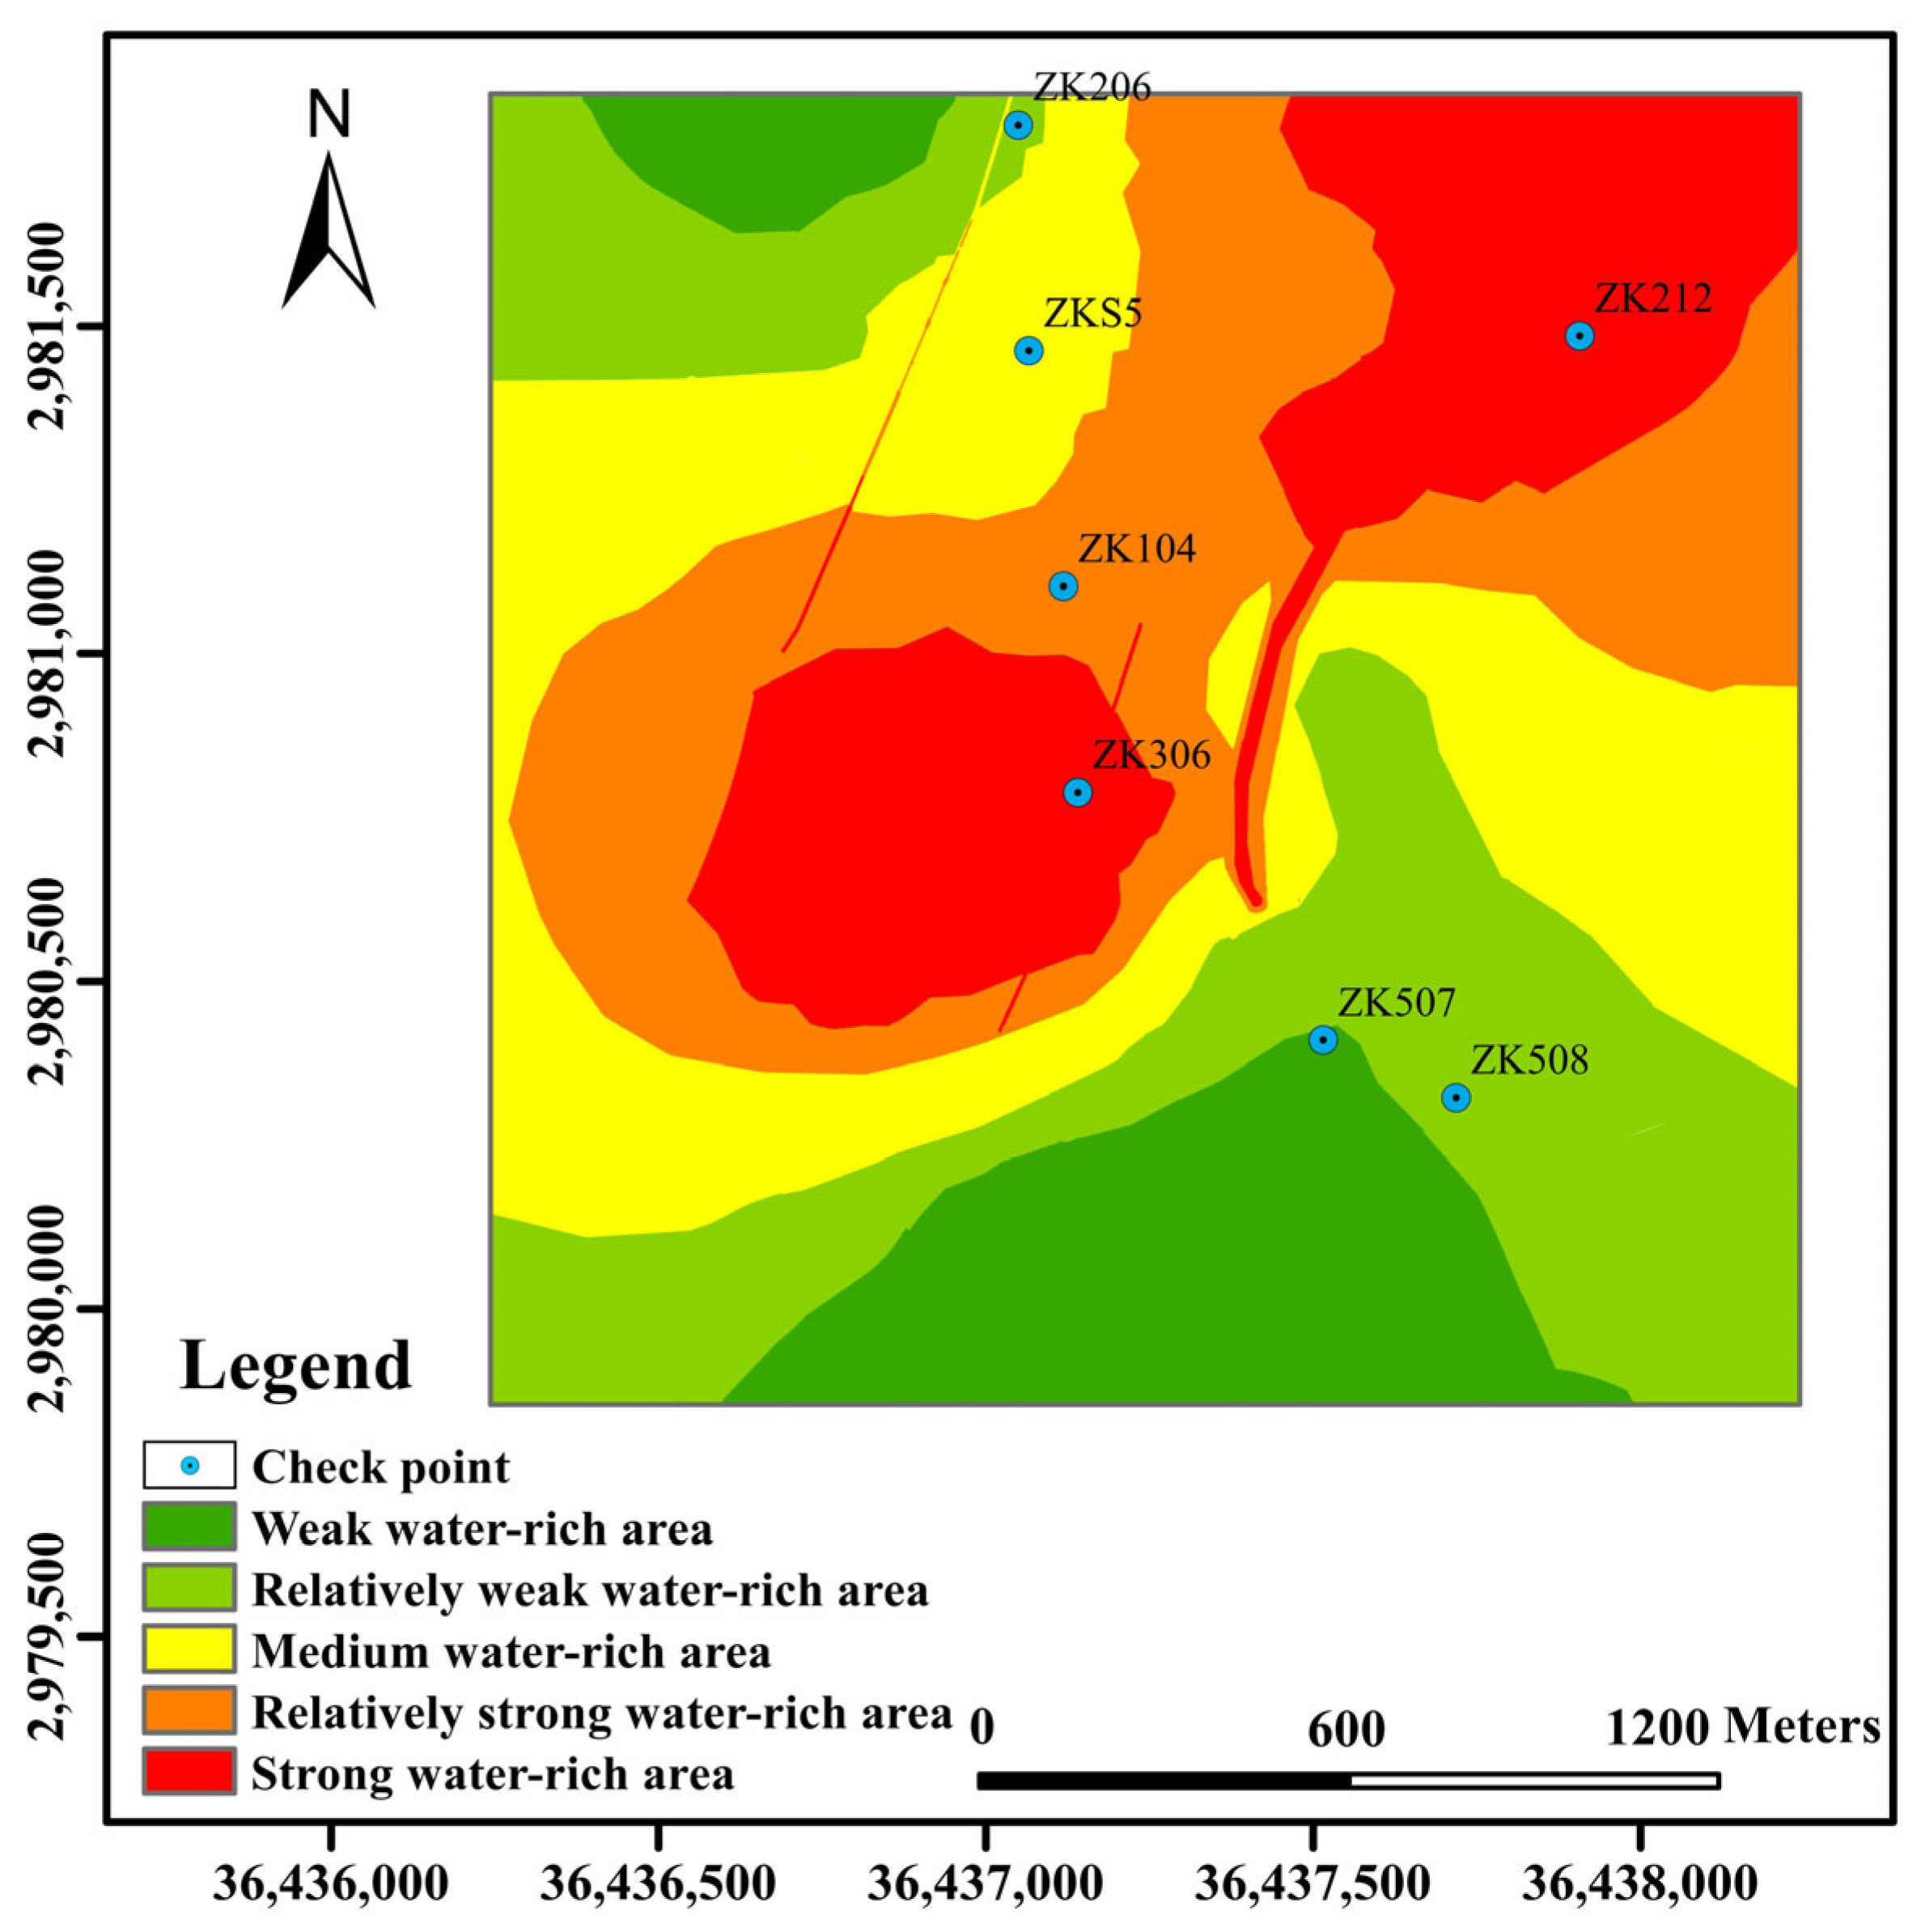
A total of seven wells (ZK206, ZKS5, ZK104, ZK212, ZK306, ZK507, and ZK508) were selected in strongly water-rich and non-water-rich areas. Water richness was identified according to the water pressure of the phosphate mine roof, permeability coefficient, and unit water gush of the aquifer at the location of the boreholes, and when the values of water pressure of the phosphate mine roof, permeability coefficient, and unit water gush of the aquifer were small, then the area was identified as non-water-rich (
Figure 12). Otherwise, the area was identified as water-rich. For instance, as ZK507 aquifer water pressure was 1.4 MPA and the unit water inflow was 0.012L/S·m, it belonged to the non-water-rich area. The model was created to meet the accuracy standards, and the identification of the remaining six boreholes as water-rich was compatible with the evaluation results.
5. Conclusions
The potential for water-intrusion disasters is a prominent problem for the production safety of dangerous phosphorus mines, and the water-richness zoning evaluation of phosphorus mines provides a reference for risk-management, risk-reduction, and prevention of sudden water disasters. In this study, the geological conditions of a phosphate rock mine in southern China were analyzed, and the spatial location structure relationship between the main water-bearing (compartment) layers and the ore body of this phosphate rock mine was studied in depth. Seven indicators for measuring water richness were identified and quantified, and a thematic map of the indicators was established using GIS technology.
A random-forest-based zoning model for phosphate mine water richness was proposed by introducing the random forest algorithm in machine learning. Training and validation samples were created based on 350 indicator data from 50 wells in the study area. The maximum accuracy of the model was achieved by optimizing two important parameters (decision number m and splitting feature number k) in the random forest model. The objective weights of the indicators were derived from both the Gini index and the mean decrease accuracy in the random forest model. The three most significant elements impacting the water richness of the research region were the permeability coefficient, the unit water inflow, and the water pressure at the roof of the phosphate mine, according to the ranking of the relevance of indicator weights. The constructed random forest model was applied to a phosphate mine in southern China. The evaluation’s findings indicate that the study area is generally water-rich, and that this trend is increasing in all directions. Within this zone, the strongly water-rich areas and the more strongly water-rich areas account for 41.01% of the total area of the mine. This area has the potential for water intrusion in future phosphate mine production and must be prevented. The evaluation results were consistent with the accuracy of the model, which was able to categorize the water richness of the research area objectively and accurately.
The random forest model in the application of water-richness zoning of karst aquifers on the roofs of phosphate mines embodies a high degree of accuracy and greater conformity with the actual water richness of the mine area, and thus provides a useful reference for future water-richness zoning of mines. However, there are also many objective problems, such as the difficulty of producing a classification with high accuracy when the measured data sample is too small, the impossibility of estimating the model’s internal run, and the fact that the adjustment can only be made between different parameters and random seeds. Through the reasonable selection of indicators and the use of precise data, more accurate evaluation results can be achieved.
Author Contributions
Methodology, X.L. and B.L.; Investigation, X.L. and T.L.; Resources, Y.L., H.H. and W.Z.; Data curation, B.Z.; Project administration, X.L.; Funding acquisition, X.L. All authors have read and agreed to the published version of the manuscript.
Funding
This research was financially supported by Natural Science Foundation of China (42162022; 41702270), Guizhou Science and Technology Department Project (Qian Ke He Ping Tai Ren Cai [2021]5626; Qian Ke He Zhi Cheng [2020]4Y048).
Data Availability Statement
The datasets used or analyzed during the current study are available from the corresponding author upon reasonable request.
Conflicts of Interest
The authors declare that they have no known competing financial interest or personal relationship that could have appeared to influence the work reported in this paper.
References
- Planavsky, N.J.; Rouxel, O.J.; Bekker, A.; Lalonde, S.V.; Konhauser, K.O.; Reinhard, C.T.; Lyons, T.W. The evolution of the marine phosphate reservoir. Nature 2010, 467, 1088–1090. [Google Scholar] [CrossRef] [PubMed]
- Boyle, R.A.; Dahl, T.W.; Dale, A.W.; Shields-Zhou, G.A.; Zhu, M.; Brasier, M.D.; Canfield, D.E.; Lenton, T.M. Stabilization of the coupled oxygen and phosphorus cycles by the evolution of bioturbation. Nat. Geosci. 2014, 7, 671–676. [Google Scholar] [CrossRef]
- Pan, D.; Li, S.; Xu, Z.; Lin, P.; Huang, X. Experimental and numerical study of the water inrush mechanisms of underground tunnels due to the proximity of a water-filled karst cavern. Bull. Eng. Geol. Environ. 2019, 78, 6207–6219. [Google Scholar] [CrossRef]
- Wu, M.; Ye, Y.; Hu, N.; Wang, Q.; Tan, W. Visualization Analysis and Progress of Mine Water Inrush Disaster-Related Research. Mine Water Environ. 2022, 41, 599–613. [Google Scholar] [CrossRef]
- Li, L.; Tu, W.; Shi, S.; Chen, J.; Zhang, Y. Mechanism of water inrush in tunnel construction in karst area. Geomat. Nat. Hazards Risk 2016, 7, 35–46. [Google Scholar] [CrossRef]
- Qu, X.; Han, J.; Shi, L.; Qu, X.; Bilal, A.; Qiu, M.; Gao, W. An extended ITL-VIKOR model using triangular fuzzy numbers for applications to water-richness evaluation. Expert Syst. Appl. 2023, 222, 119793. [Google Scholar] [CrossRef]
- Zini, L.; Chiara, C.; Franco, C. The challenge of tunneling through Mediterranean karst aquifers: The case study of Trieste (Italy). Environ. Earth Sci. 2015, 74, 281–295. [Google Scholar] [CrossRef]
- Wu, Q.; Xu, K.; Zhang, W.; Wei, Z. Roof aquifer water abundance evaluation: A case study in Taigemiao, China. Arab. J. Geosci. 2017, 10, 254. [Google Scholar] [CrossRef]
- Wu, Q.; Guo, X.; Shen, J.; Xu, S.; Liu, S.; Zeng, Y. Risk Assessment of Water Inrush from Aquifers Underlying the Gushuyuan Coal Mine, China. Mine Water Environ. 2017, 36, 96–103. [Google Scholar] [CrossRef]
- Qiu, M.; Huang, F.; Wang, Y.; Guan, T.; Shi, L.; Han, J. Prediction model of water yield property based on GRA, FAHP and TOPSIS methods for Ordovician top aquifer in the Xinwen coalfield of China. Environ. Earth Sci. 2020, 79, 214. [Google Scholar] [CrossRef]
- Wang, Y.; Pu, Z.; Ge, Q.; Liu, J. Study on the water-richness law and zoning assessment of mine water-bearing aquifers based on sedimentary characteristics. Sci. Rep. 2022, 12, 14107. [Google Scholar] [CrossRef]
- Zhou, N.; Xue, G.; Chen, W.; Cheng, J. Large-depth hydrogeological detection in the North China-type coalfield through short-offset grounded-wire TEM. Environ. Earth Sci. 2015, 74, 2393–2404. [Google Scholar] [CrossRef]
- Zhang, G.-D.; Xue, Y.-G.; Bai, C.-H.; Su, M.-X.; Zhang, K.; Tao, Y.-F. Risk assessment of floor water inrush in coal mines based on MFIM-TOPSIS variable weight model. J. Cent. South Univ. 2021, 28, 2360–2374. [Google Scholar] [CrossRef]
- Zeng, Y.; Wu, Q.; Liu, S.; Zhai, Y.; Lian, H.; Zhang, W. Evaluation of a coal seam roof water inrush: Case study in the Wangjialing coal mine, China. Mine Water Environ. 2017, 37, 174–184. [Google Scholar] [CrossRef]
- Zhang, Z.; Zhang, Q.; Duan, K.; Zhang, R.; Lin, H.; Xiang, W. A fully coupled hydraulic-mechanical model of deep tunnel considering permeability variation. Comput. Geotech. 2022, 151, 104984. [Google Scholar] [CrossRef]
- Yang, B.; Liu, Y. Application of Fractals to Evaluate Fractures of Rock Due to Mining. Fractal Fract. 2022, 6, 96. [Google Scholar] [CrossRef]
- Xiao, Z.; Gu, S.; Zhang, Y.; Wang, H. An effective control method of rock burst induced by shear instability of fault structure under complicated geological conditions. Bull. Eng. Geol. Environ. 2023, 82, 105. [Google Scholar] [CrossRef]
- Li, B.; Liu, Z.; Wu, Q.; Long, J.; Liu, P.; Li, M. Prediction Model for Safe Width of Rock Mass Preventing Water Inrush from Fault in Excavation Roadway and Influencing Factors Analysis: A Case Study of the Xintian Coal Mine. Min. Metall. Explor. 2023, 40, 1225–1235. [Google Scholar] [CrossRef]
- Li, B.; Zhang, W.; Long, J.; Fan, J.; Chen, M.; Li, T.; Liu, P. Multi-source information fusion technology for risk assessment of water inrush from coal floor karst aquifer. Geomat. Nat. Hazards Risk 2022, 13, 2086–2106. [Google Scholar] [CrossRef]
- Yin, H.; Xu, G.; Zhang, Y.; Zhai, P.; Li, X.; Guo, Q.; Wei, Z. Risk Assessment of Water Inrush of a Coal Seam Floor Based on the Combined Empowerment Method. Water 2022, 14, 1607. [Google Scholar] [CrossRef]
- Kotzbek, G. Introduction to GIS programming and fundamentals with python and ArcGIS. Int. J. Geogr. Inf. Sci. 2017, 31, 2329–2330. [Google Scholar] [CrossRef]
- Breiman, L. Random forests. Mach. Learn. 2001, 45, 5–32. [Google Scholar] [CrossRef]
- Hoarau, A.; Martin, A.; Dubois, J.C.; Le Gall, Y. Evidential Random Forests. Expert Syst. Appl. 2023, 230, 120652. [Google Scholar] [CrossRef]
- Ziegler, A.; Koenig, I.R. Mining data with random forests: Current options for real-world applications. WIREs Data Min. Knowl. Discov. 2013, 4, 55–63. [Google Scholar] [CrossRef]
- Ghosh, D.; Cabrera, J. Enriched Random Forest for High Dimensional Genomic Data. EEE-ACM Trans. Comput. Biol. Bioinform. 2022, 19, 2817–2828. [Google Scholar] [CrossRef] [PubMed]
- Speiser, J.L.; Miller, M.E.; Tooze, J.; Ip, E. A comparison of random forest variable selection methods for classification prediction modeling. Expert Syst. Appl. 2019, 134, 93–101. [Google Scholar] [CrossRef] [PubMed]
- Nembrini, S.; König, I.R.; Wright, M.N. The revival of the Gini importance? Bioinformatics 2018, 34, 3711–3718. [Google Scholar] [CrossRef]
- Rokach, L. Decision forest: Twenty years of research. Inf. Fusion 2016, 27, 111–125. [Google Scholar] [CrossRef]
- Bertsimas, D.; Dunn, J. Optimal classification trees. Mach. Learn. 2017, 106, 1039–1082. [Google Scholar] [CrossRef]
- Tehrany, M.S.; Pradhan, B.; Jebur, M.N. Spatial prediction of flood susceptible areas using rule based decision tree (DT) and a novel ensemble bivariate and multivariate statistical models in GIS. J. Hydrol. 2013, 504, 69–79. [Google Scholar] [CrossRef]
- Breiman, L. Bagging predictors. Mach. Learn. 1996, 24, 123–140. [Google Scholar] [CrossRef]
- Marques F, P.C. Confidence intervals for the random forest generalization error. Pattern Recognit. Lett. 2022, 158, 171–175. [Google Scholar] [CrossRef]
- Mohandoss, D.P.; Shi, Y.; Suo, K. Outlier Prediction Using Random Forest Classifier. In Proceedings of the 2021 IEEE 11th Annual Computing and Communication Workshop and Conference (CCWC), Las Vegas, NV, USA, 27–30 January 2021; pp. 0027–0033. [Google Scholar]
- Cho, G.; Jung, K.; Hwang, H. Out-of-bag Prediction Error: A Cross Validation Index for Generalized Structured Component Analysis. Multivar. Behav. Res. 2019, 54, 505–513. [Google Scholar] [CrossRef]
- Janitza, S.; Hornung, R. On the overestimation of random forest’s out-of-bag error. PLoS ONE 2018, 13, e0201904. [Google Scholar] [CrossRef]
| Disclaimer/Publisher’s Note: The statements, opinions and data contained in all publications are solely those of the individual author(s) and contributor(s) and not of MDPI and/or the editor(s). MDPI and/or the editor(s) disclaim responsibility for any injury to people or property resulting from any ideas, methods, instructions or products referred to in the content. |
© 2023 by the authors. Licensee MDPI, Basel, Switzerland. This article is an open access article distributed under the terms and conditions of the Creative Commons Attribution (CC BY) license (https://creativecommons.org/licenses/by/4.0/).


