
PEMFC Current Control Using a Novel Compound Controller Enhanced by the Black Widow Algorithm: A Comprehensive Simulation Study

 ,
,  ,
,  ,
,  and
and
Abstract
:1. Introduction
1.1. Motivations
1.2. State of the Art
1.3. Contributions
1.4. Structure Overview
2. PEM Fuel Cell Power System Modeling
2.1. Nernst Voltage
2.2. Activation Polarization
2.3. Ohmic Polarization
2.4. Concentration Polarization
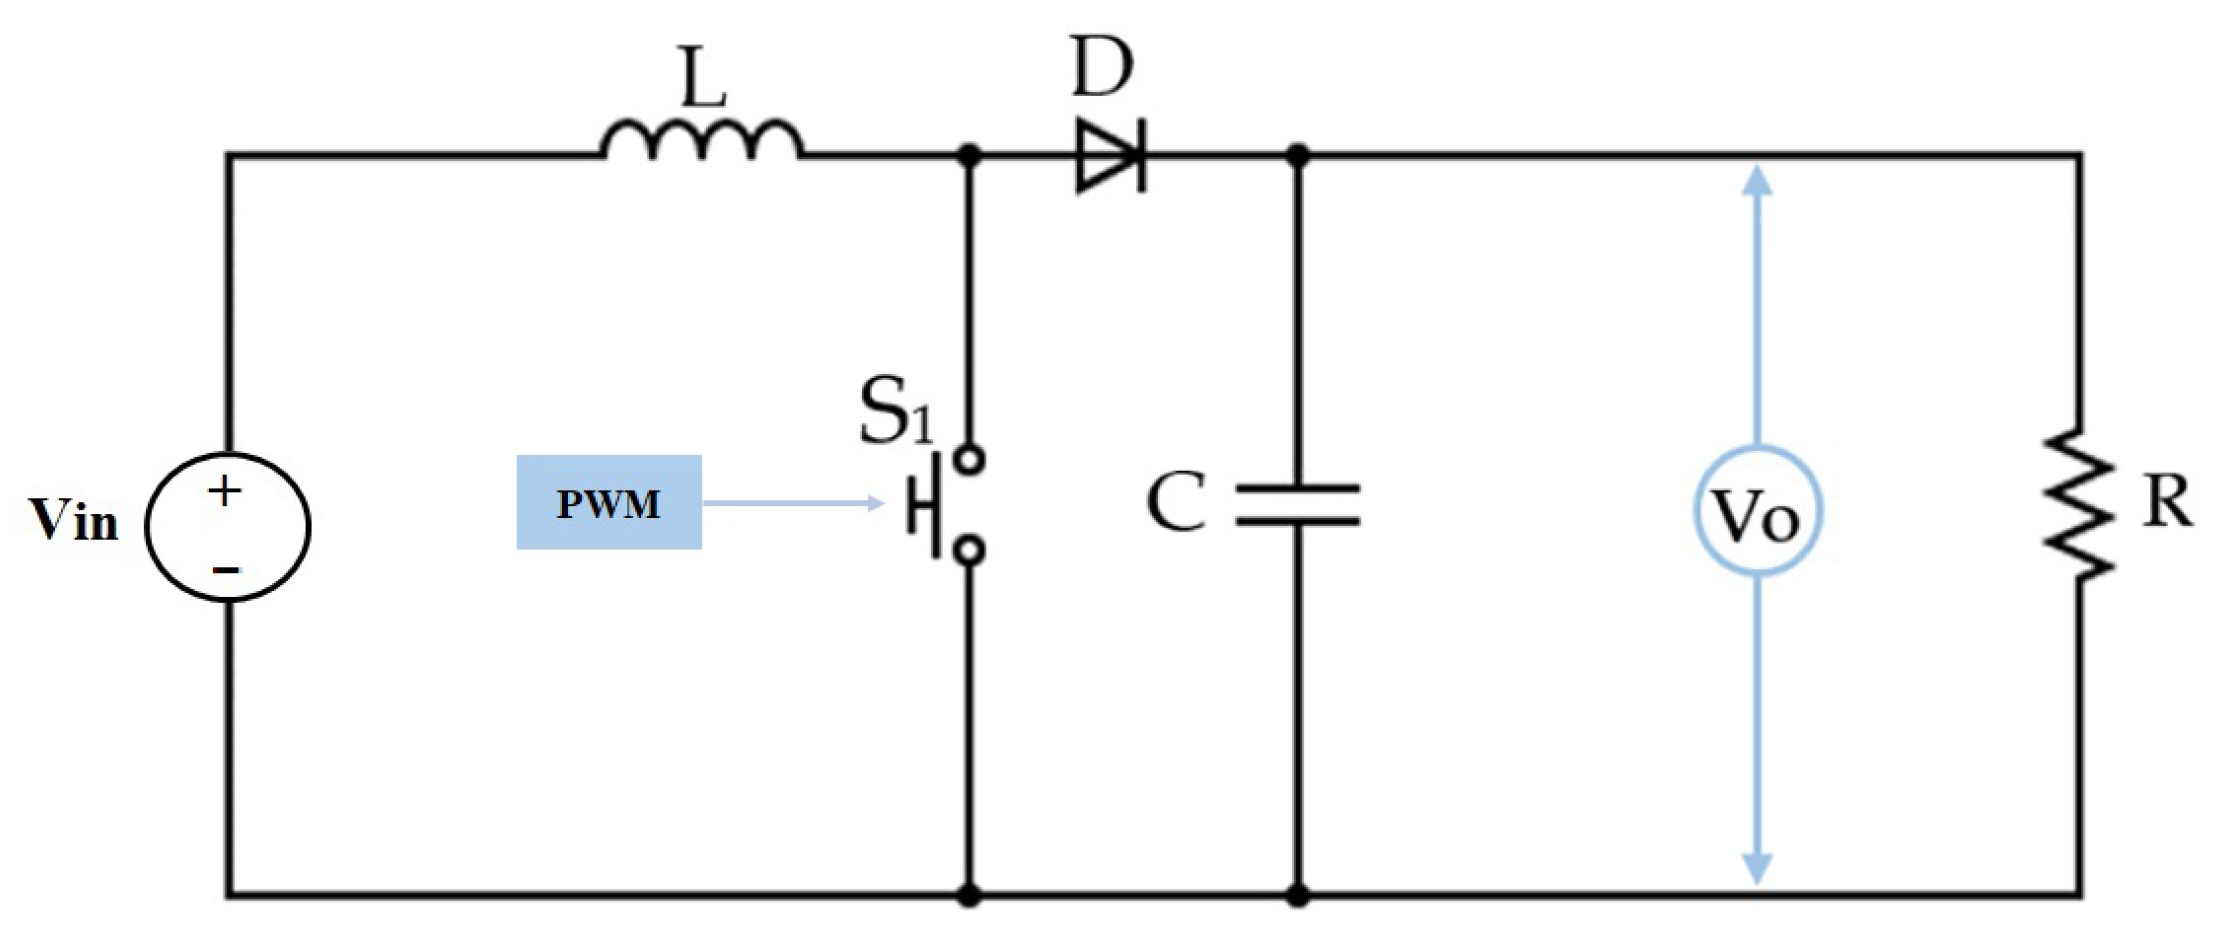
3. DC/DC Boost Converter Linked to PEMFC
- is ON: The inductor current will increase linearly until it reaches a peak value of current and, at this point, the voltage around the inductor will be equal to the input voltage source: = . In this step, the current in the inductor and the output voltage are dependent on the following dynamic (13):
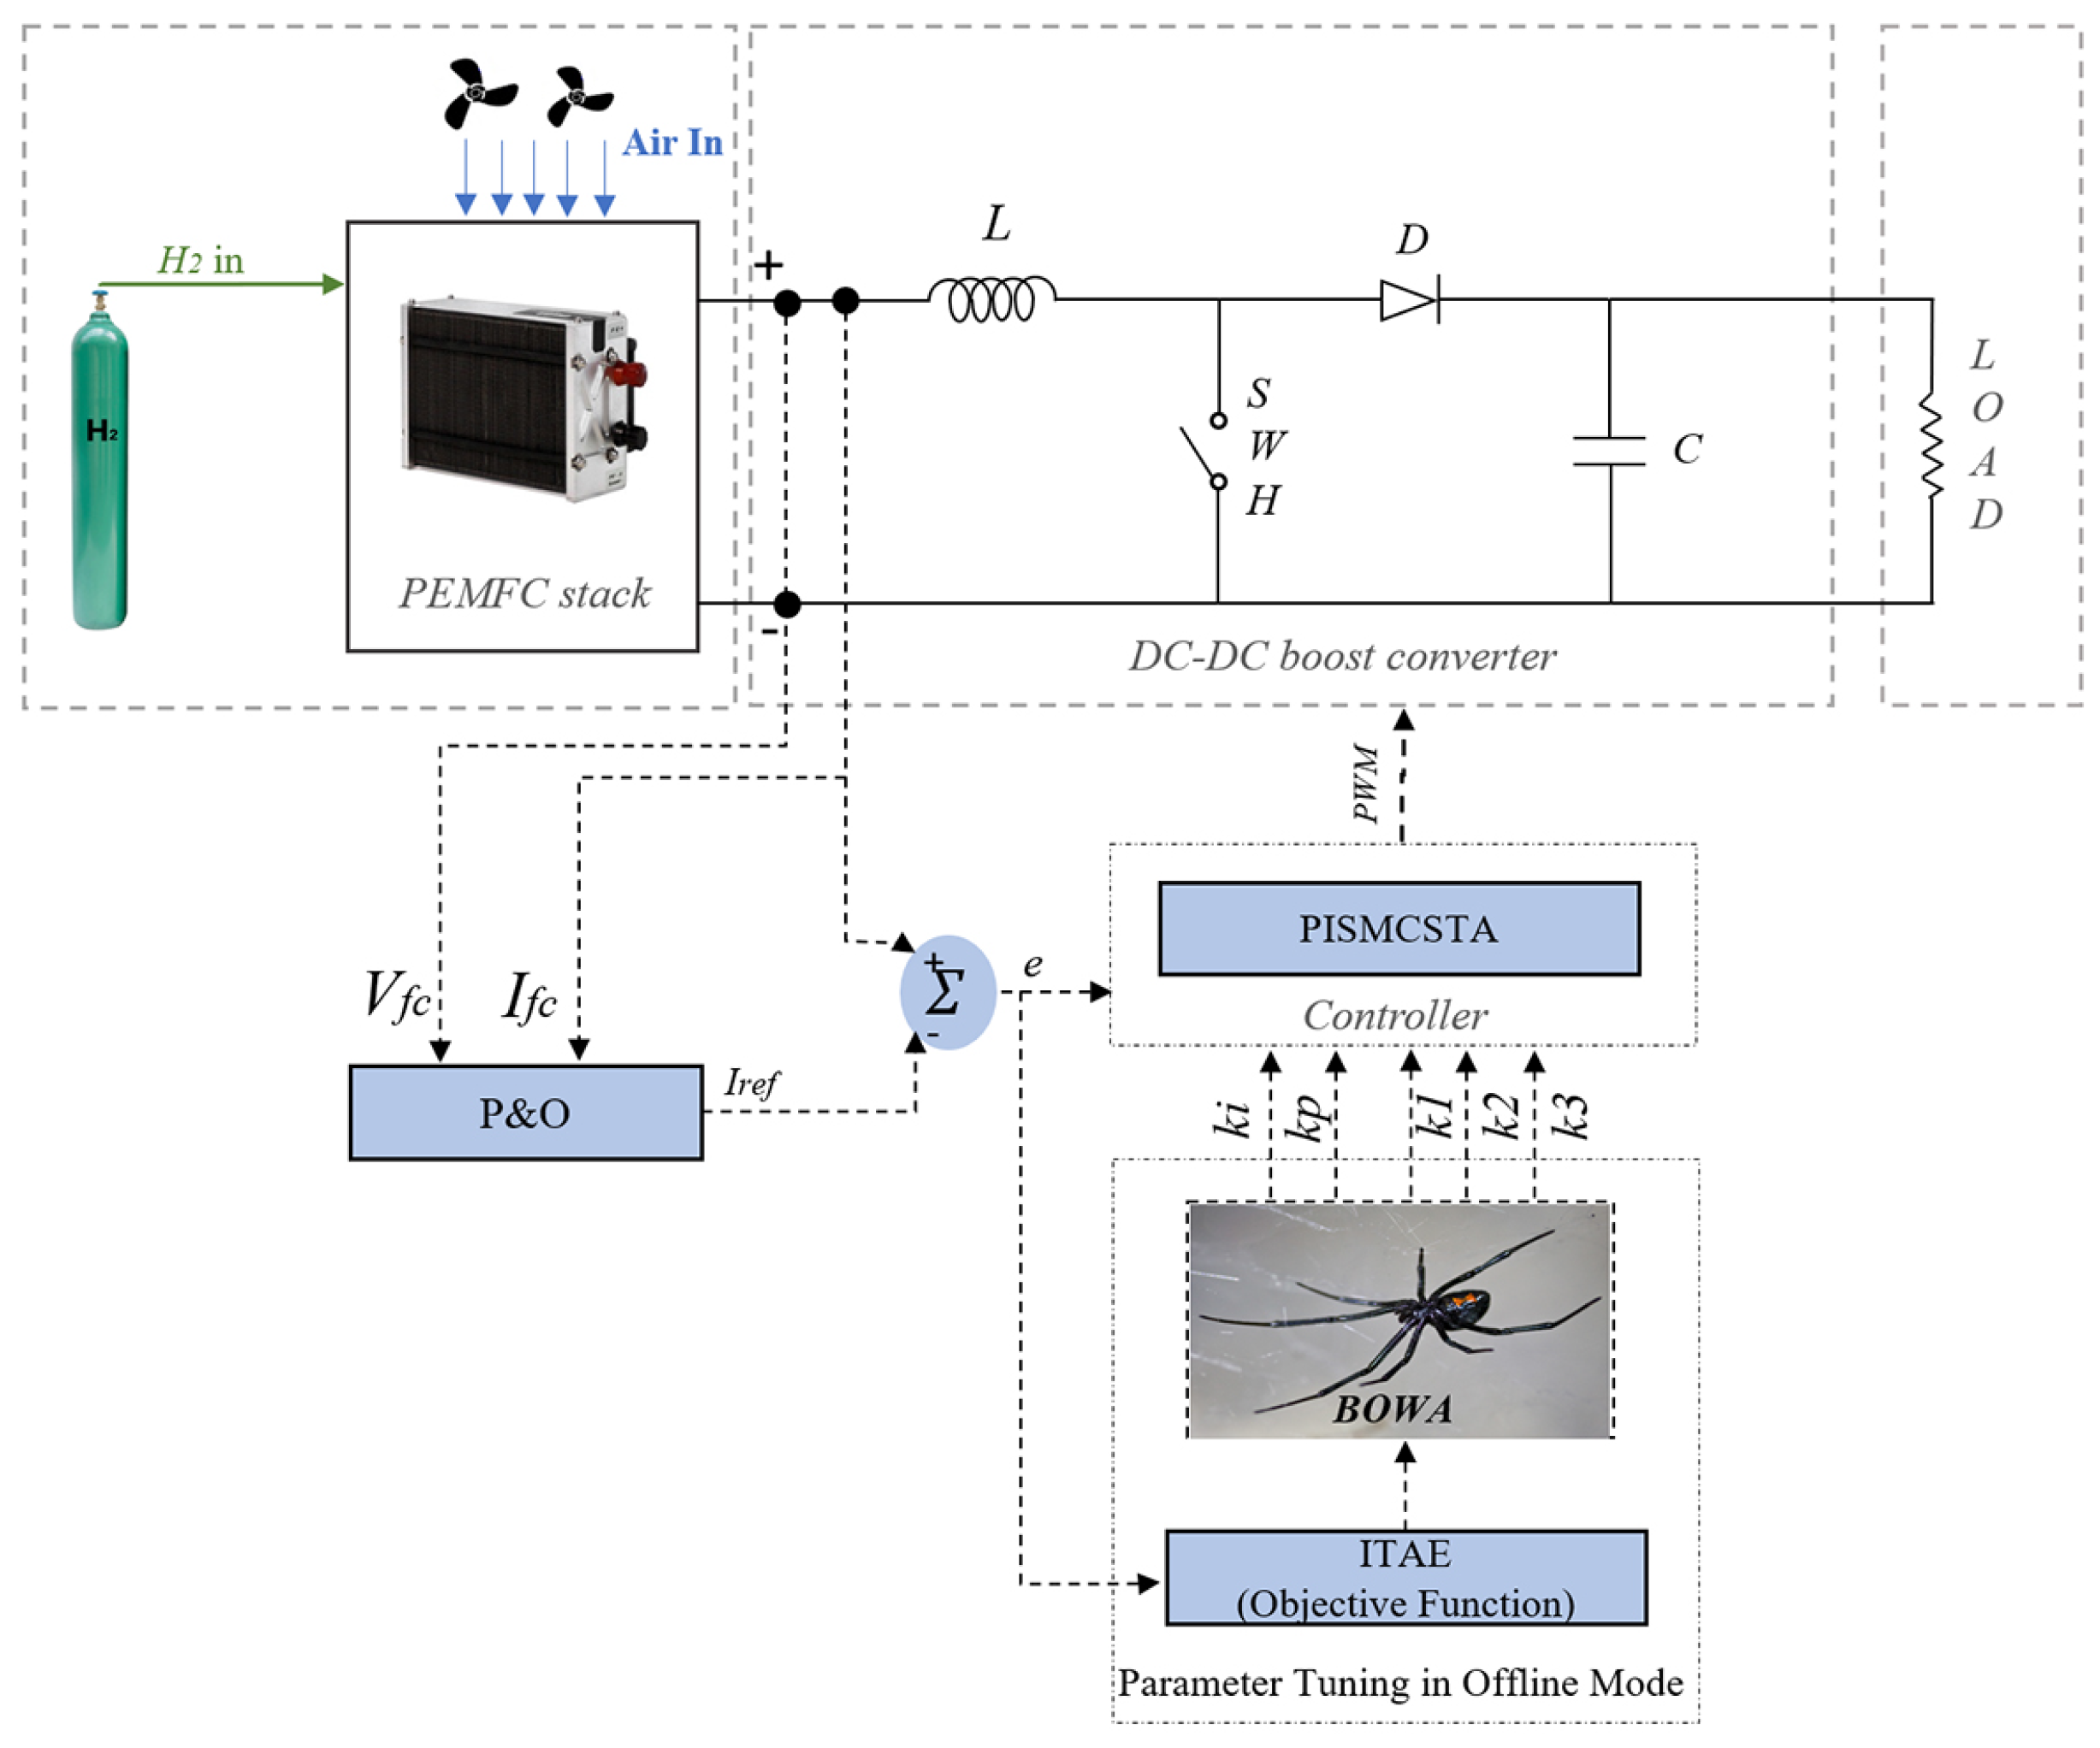
4. Control Design
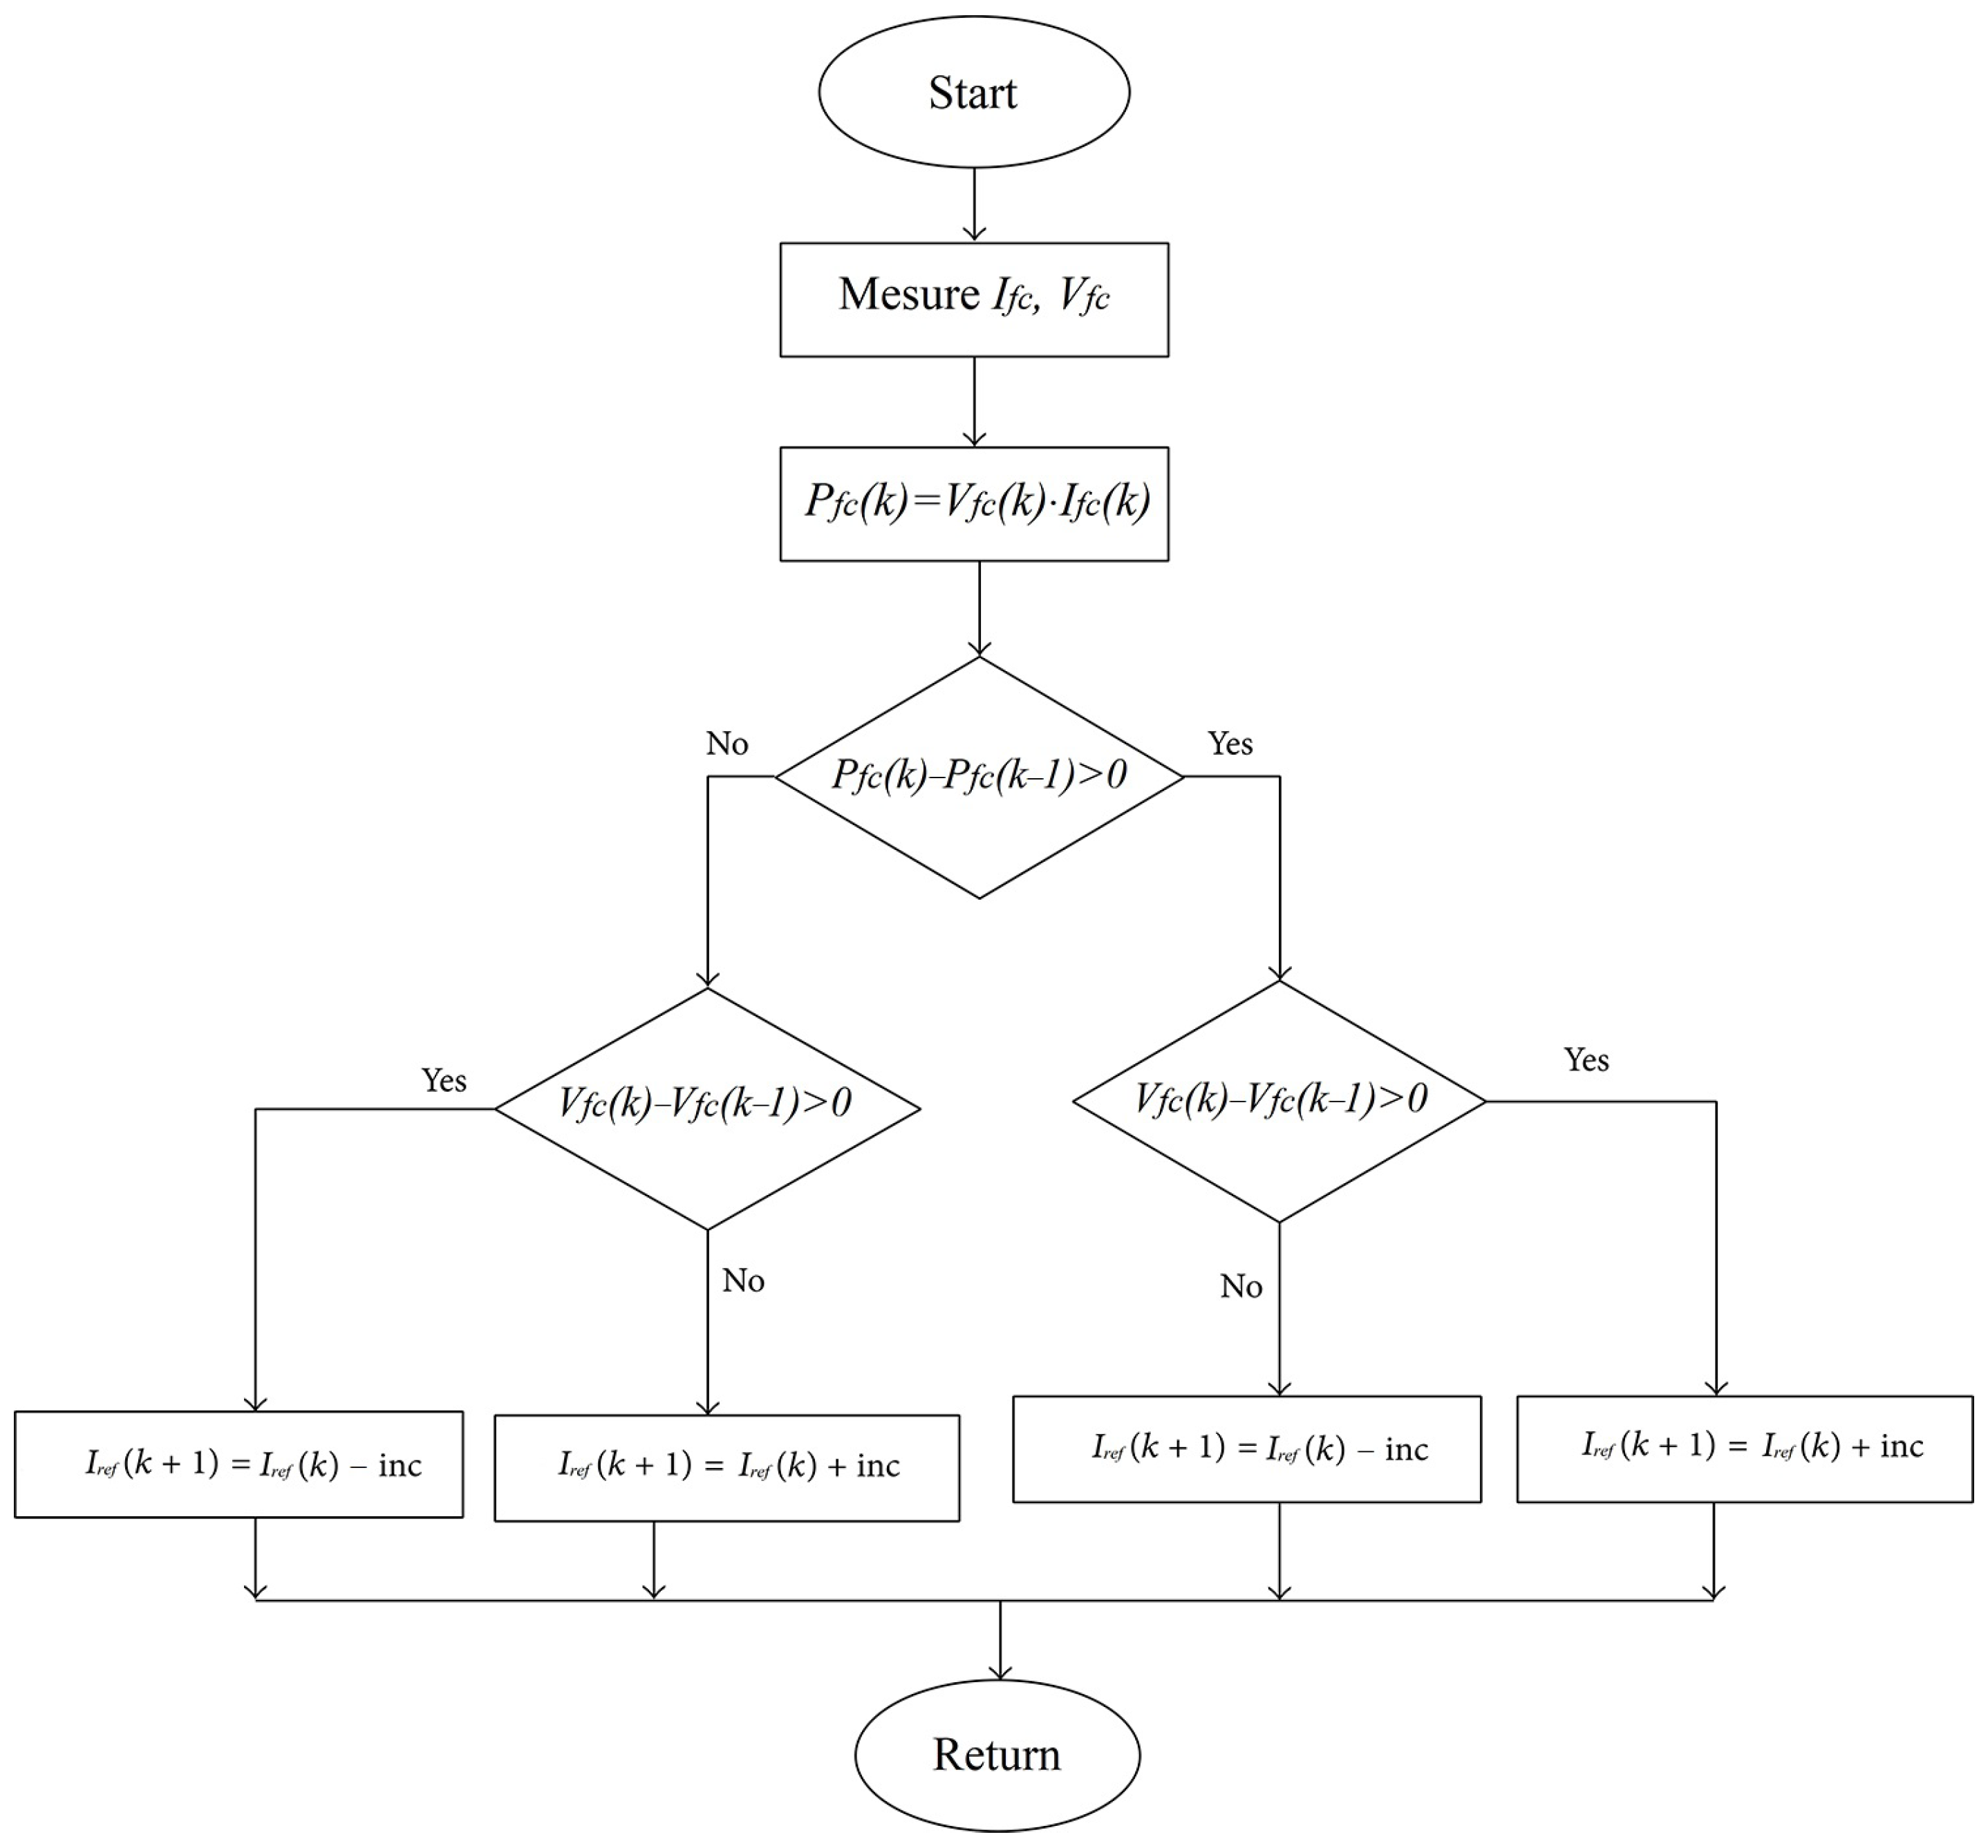
4.1. Reference Current Based MPPT
4.2. Super-Twisting Algorithm
4.3. Novel PI Sliding Mode Super-Twisting Controller
4.4. Stability Proof of STA and PISMCSTA
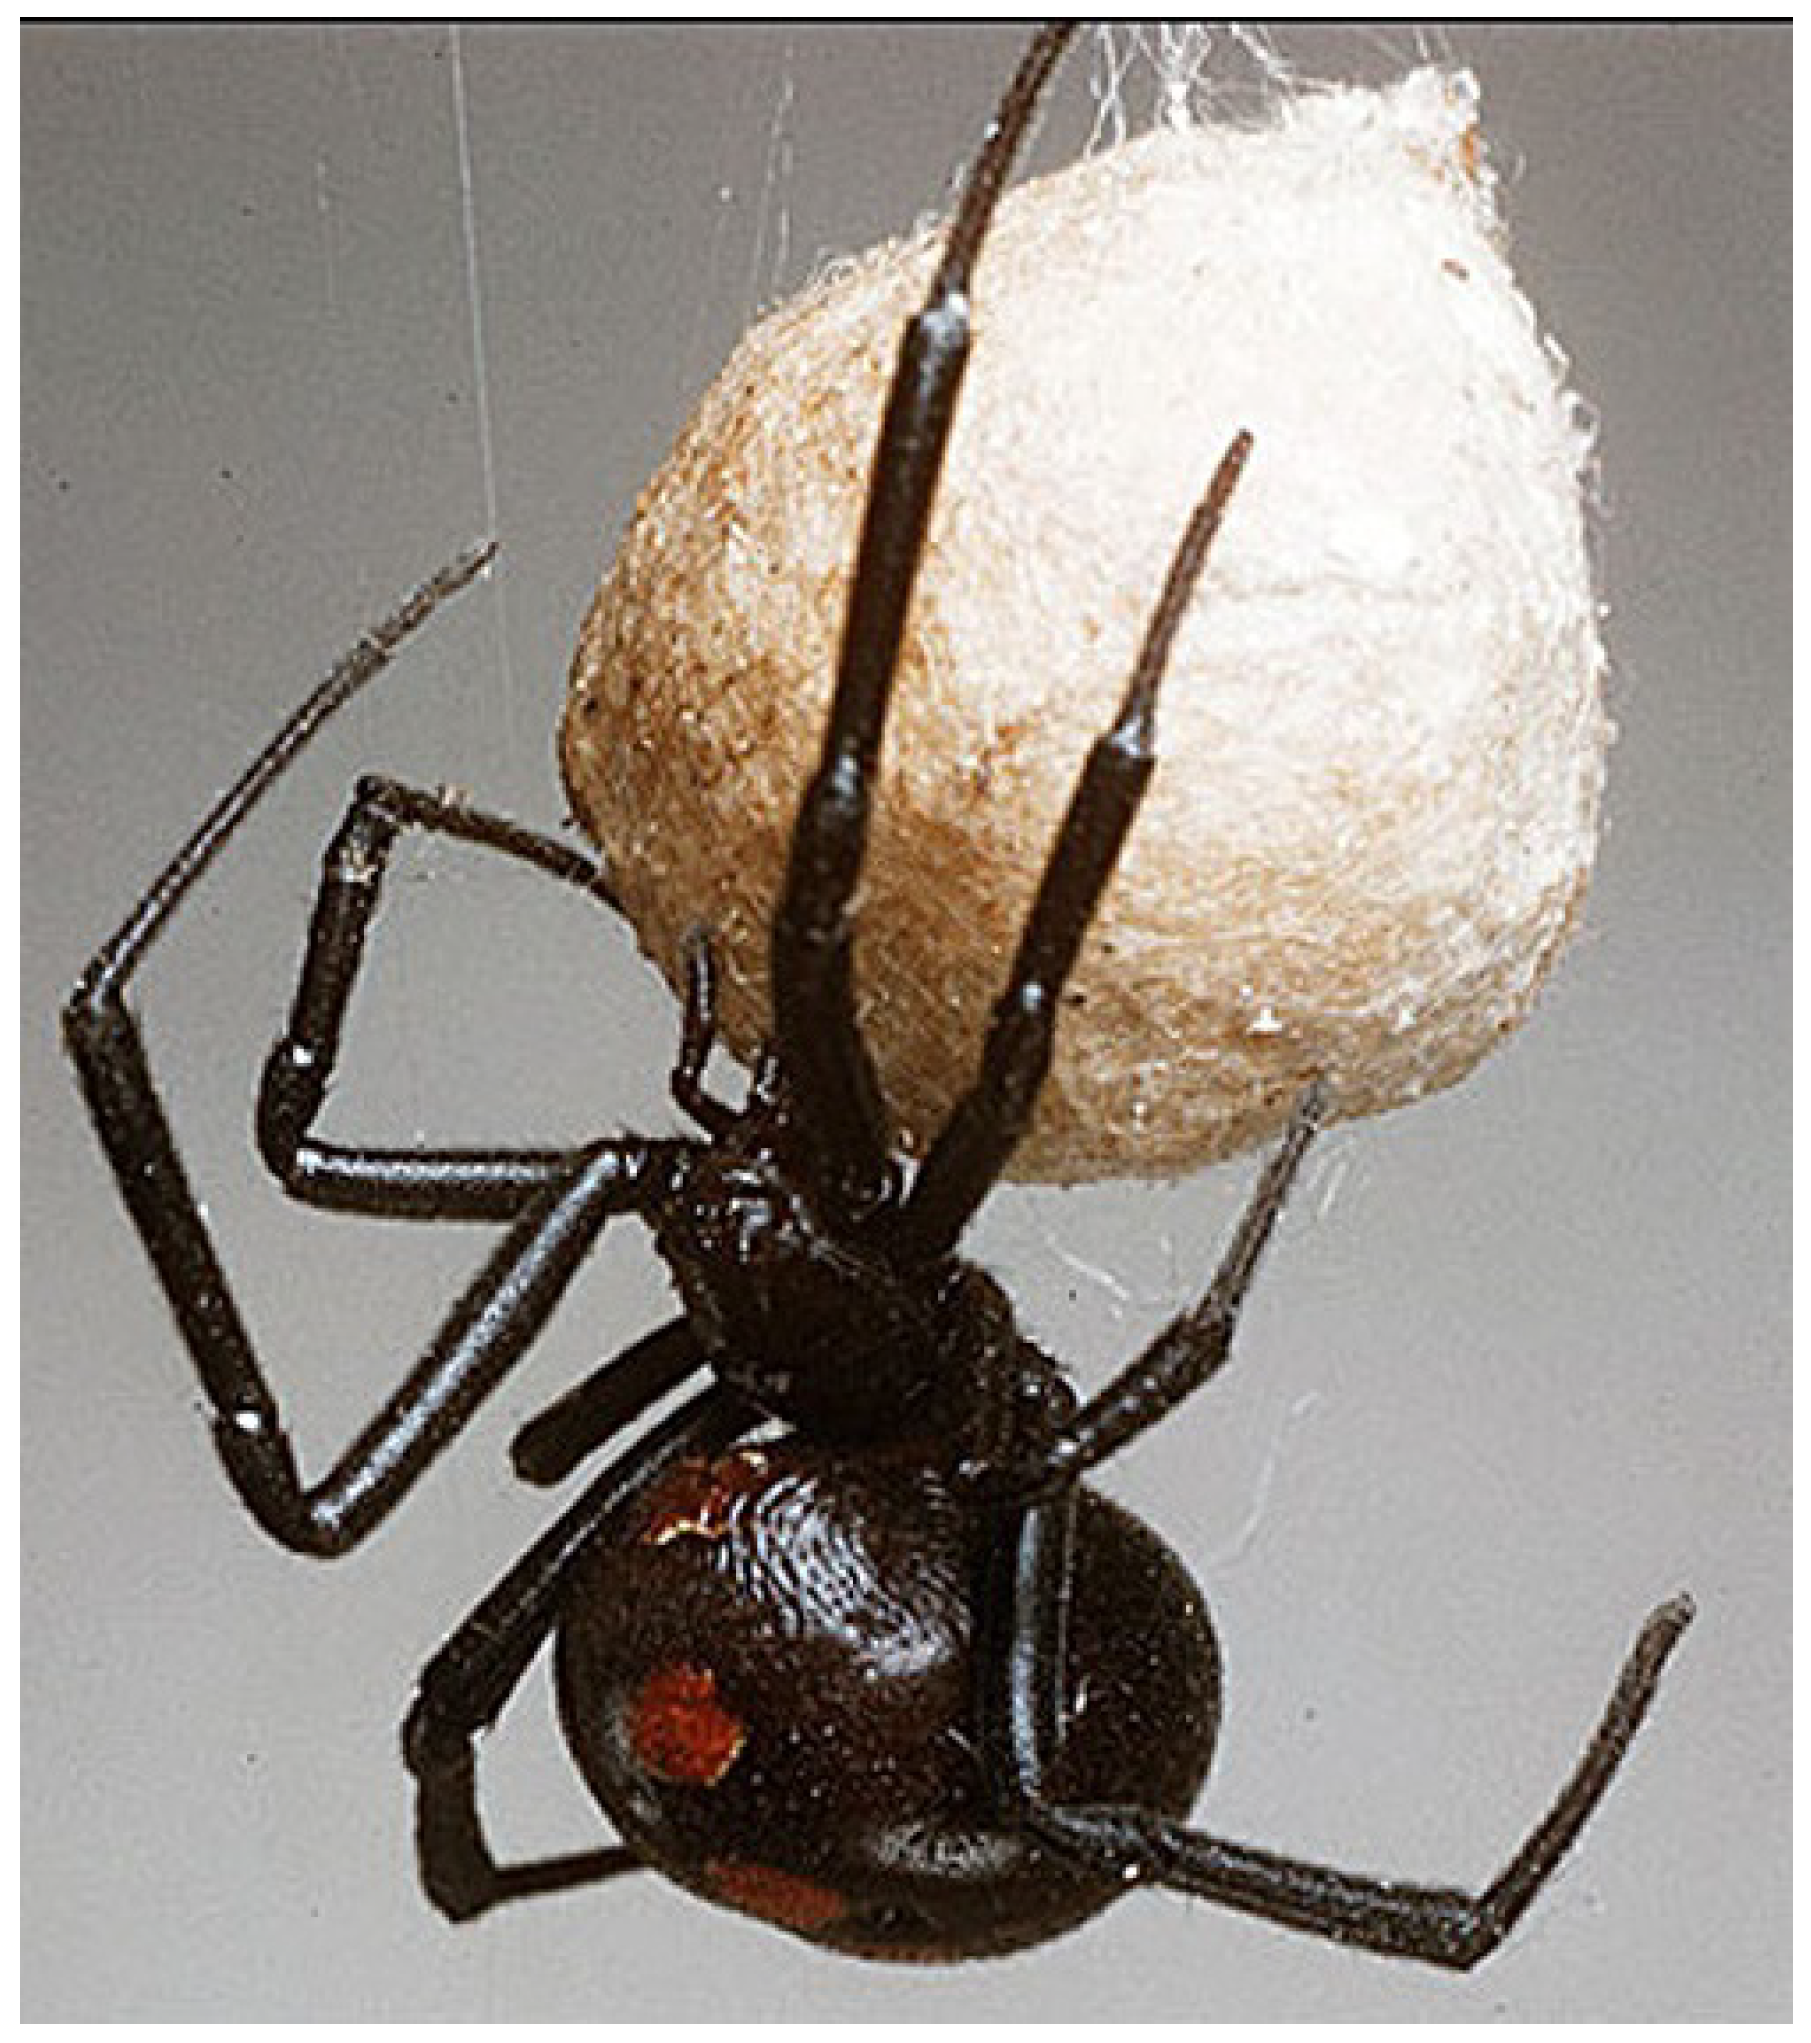
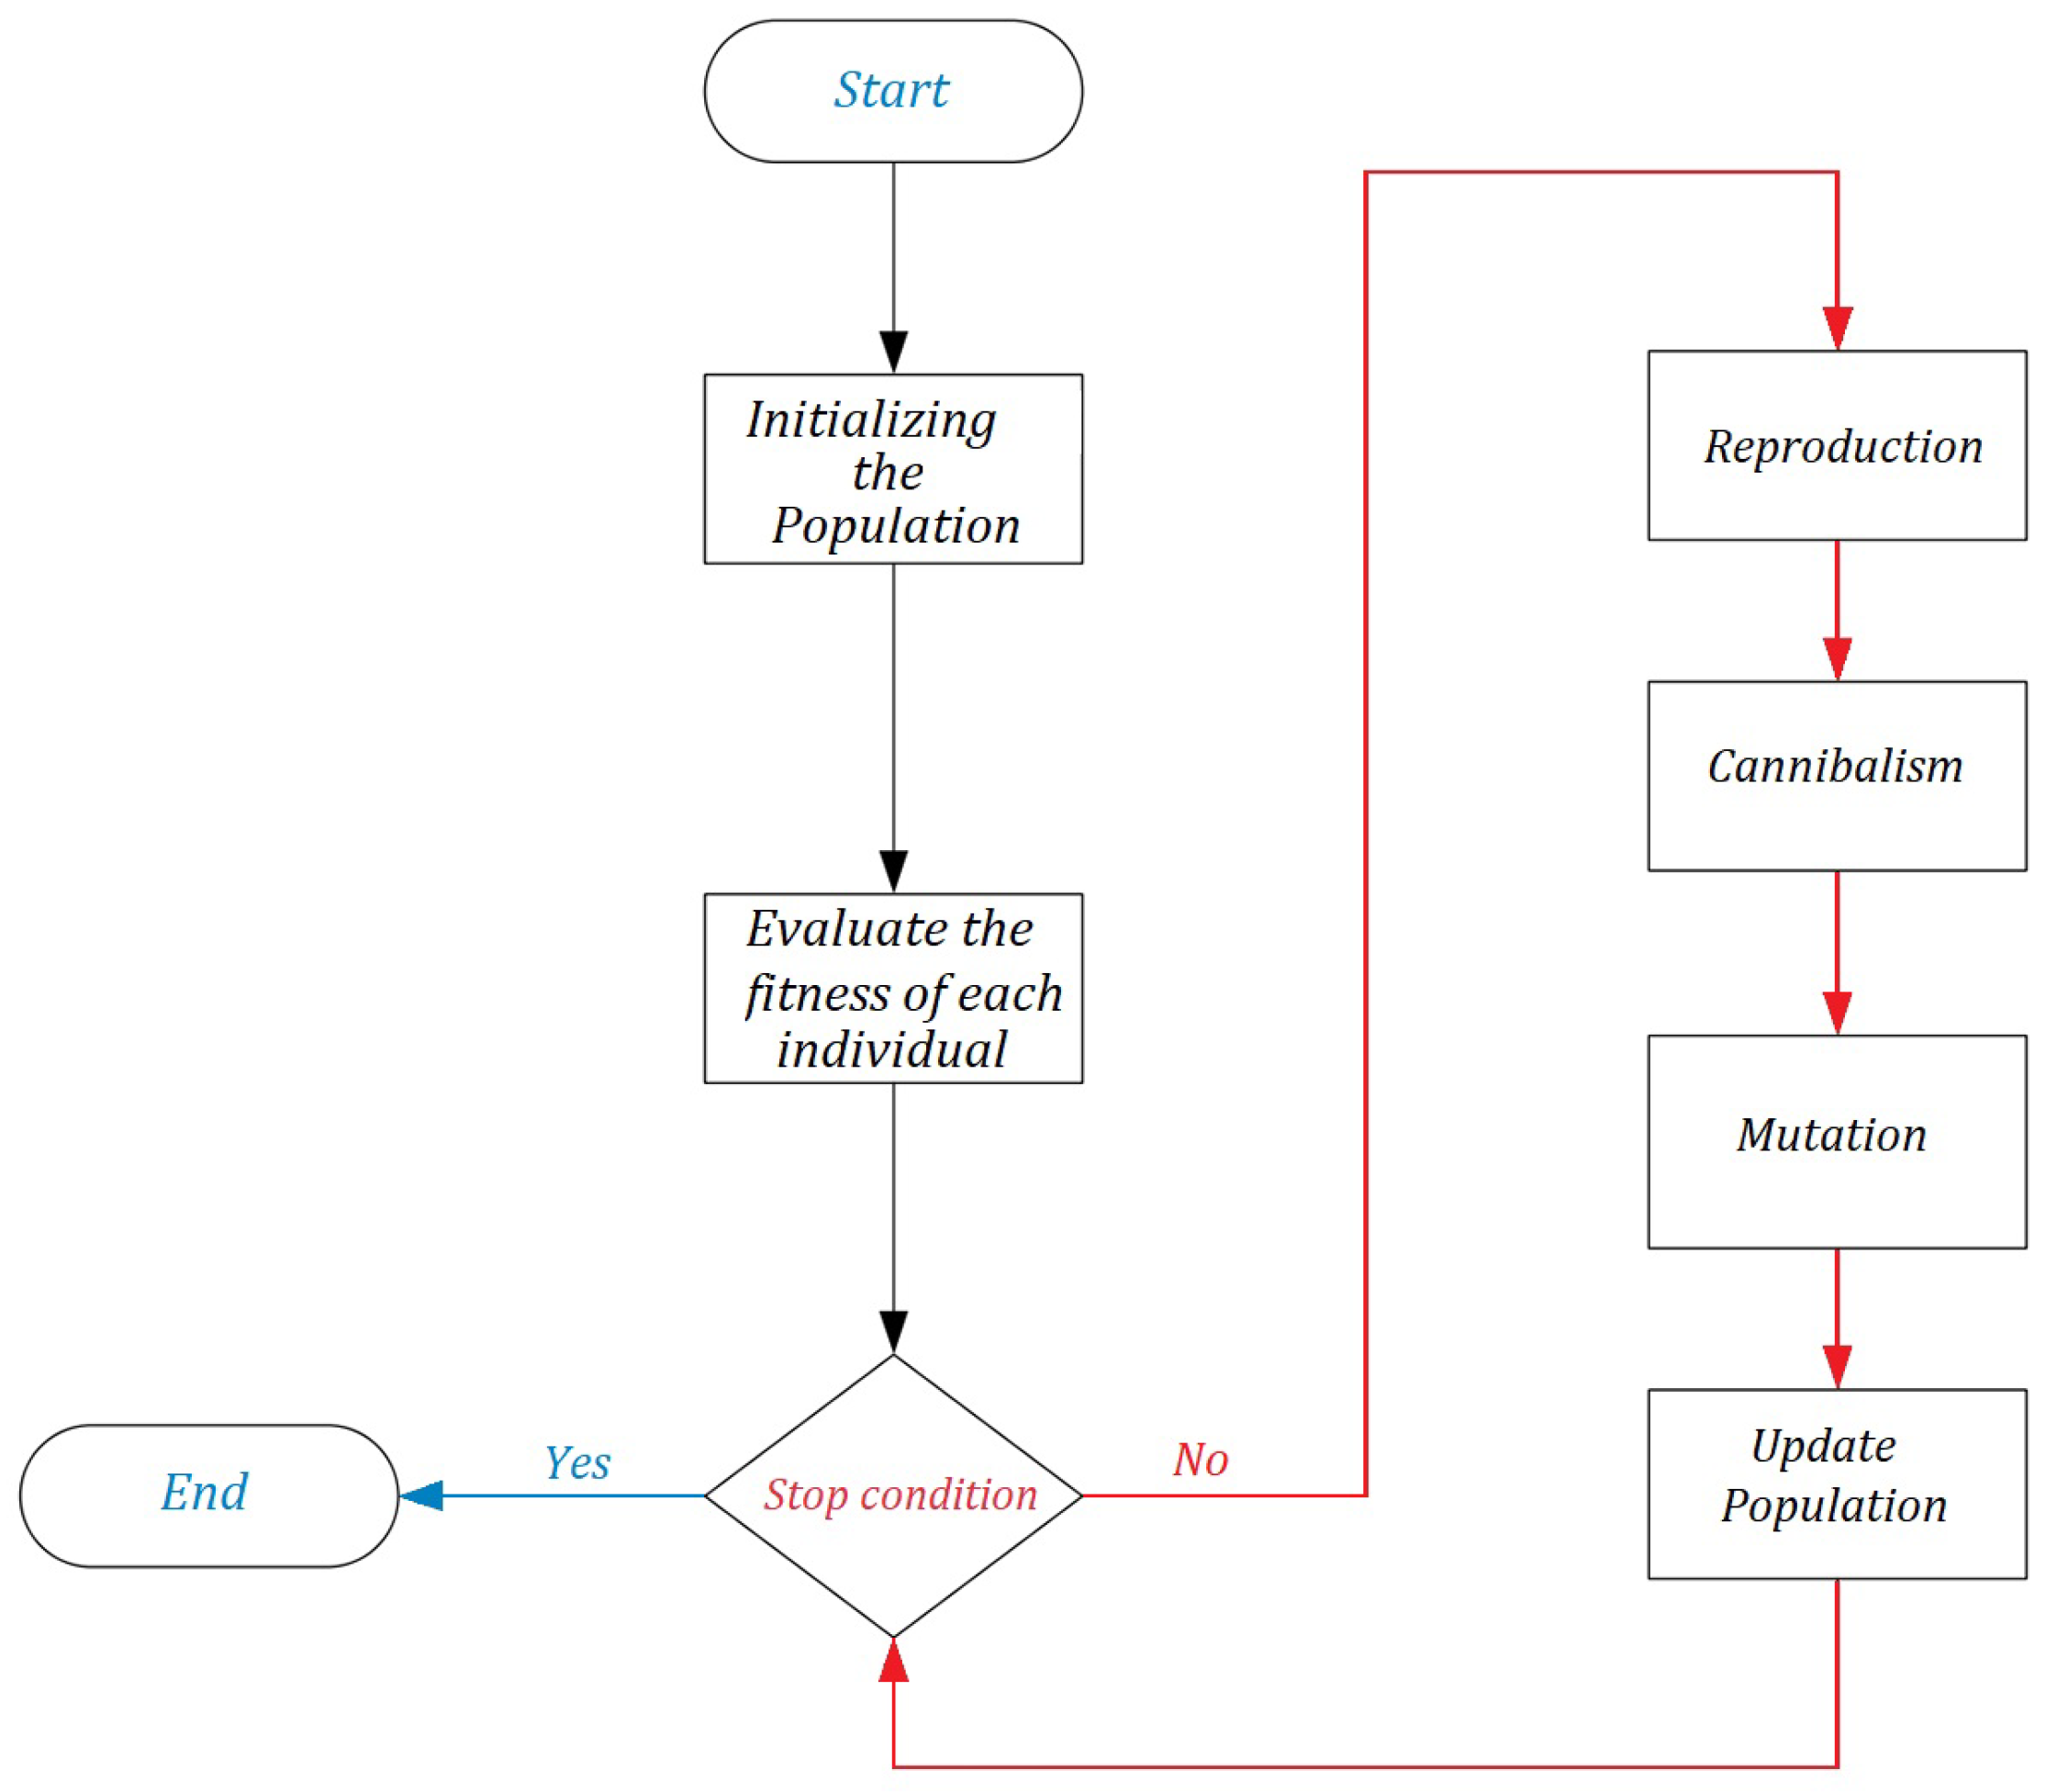
5. Optimization Using the Black Widow Algorithm
5.1. Initializing the Population
5.2. Reproduction
5.3. Cannibalism
5.4. Mutation
5.5. Update Population
5.6. Stop Conditions
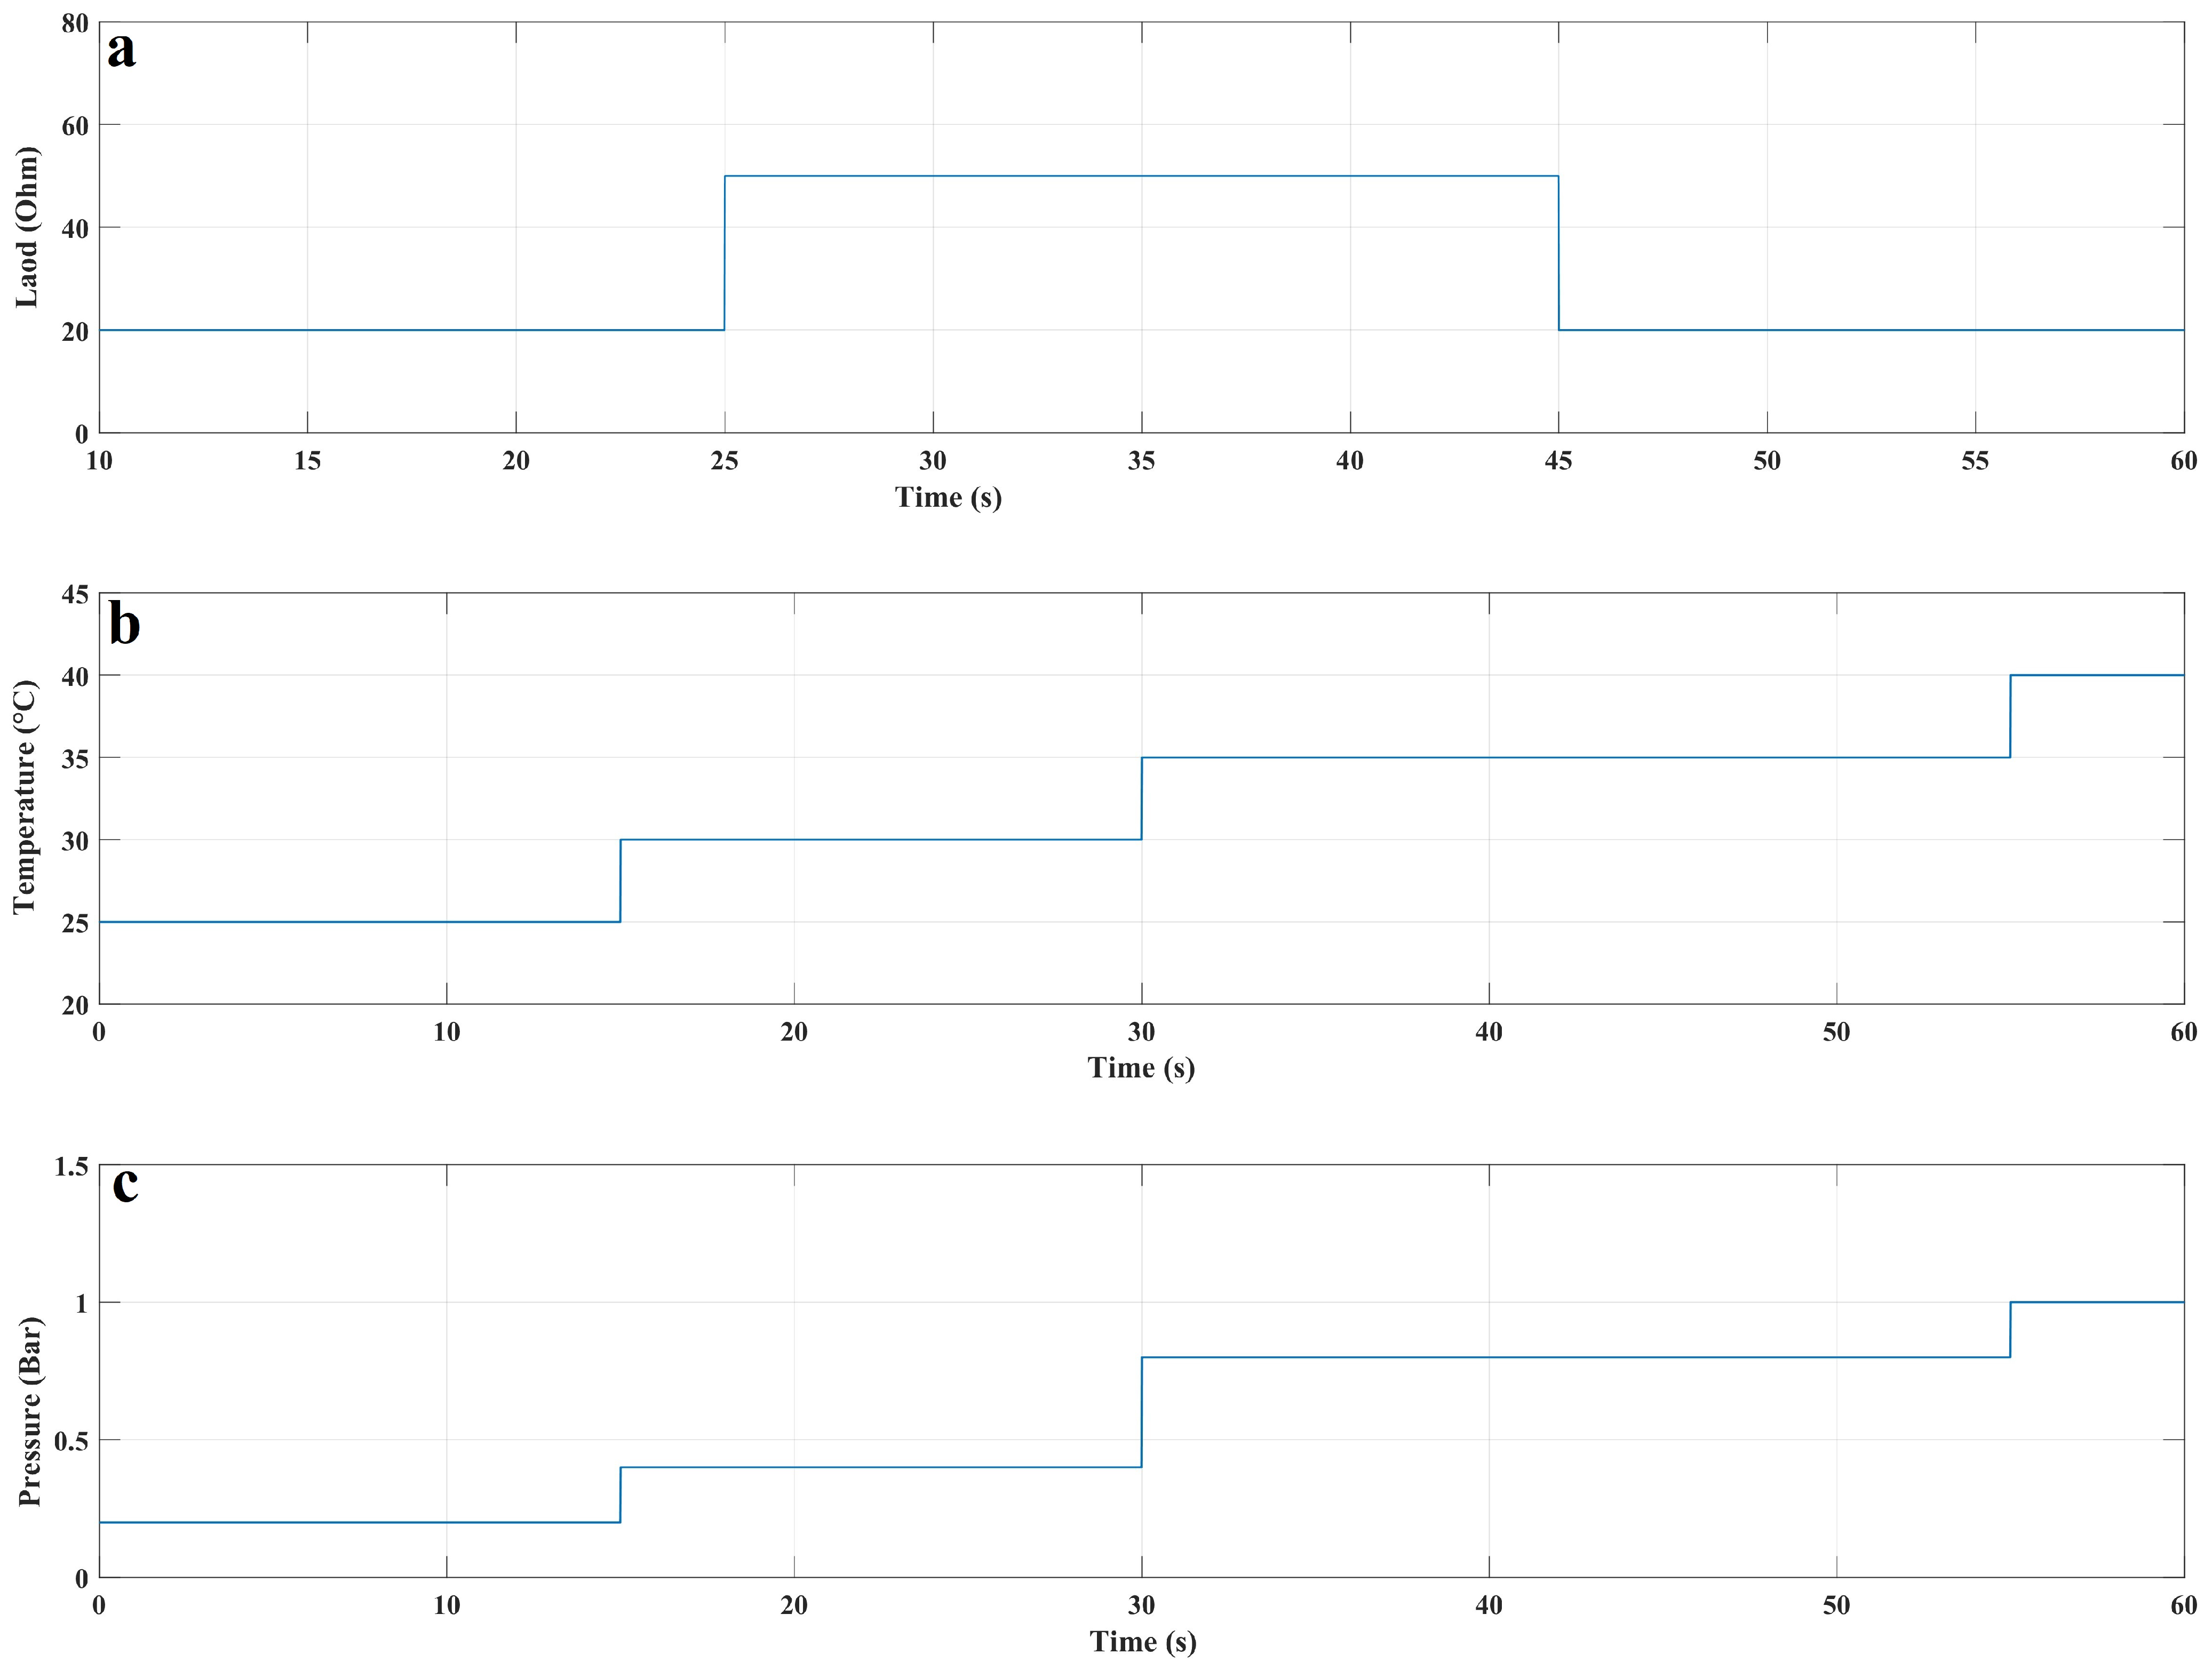
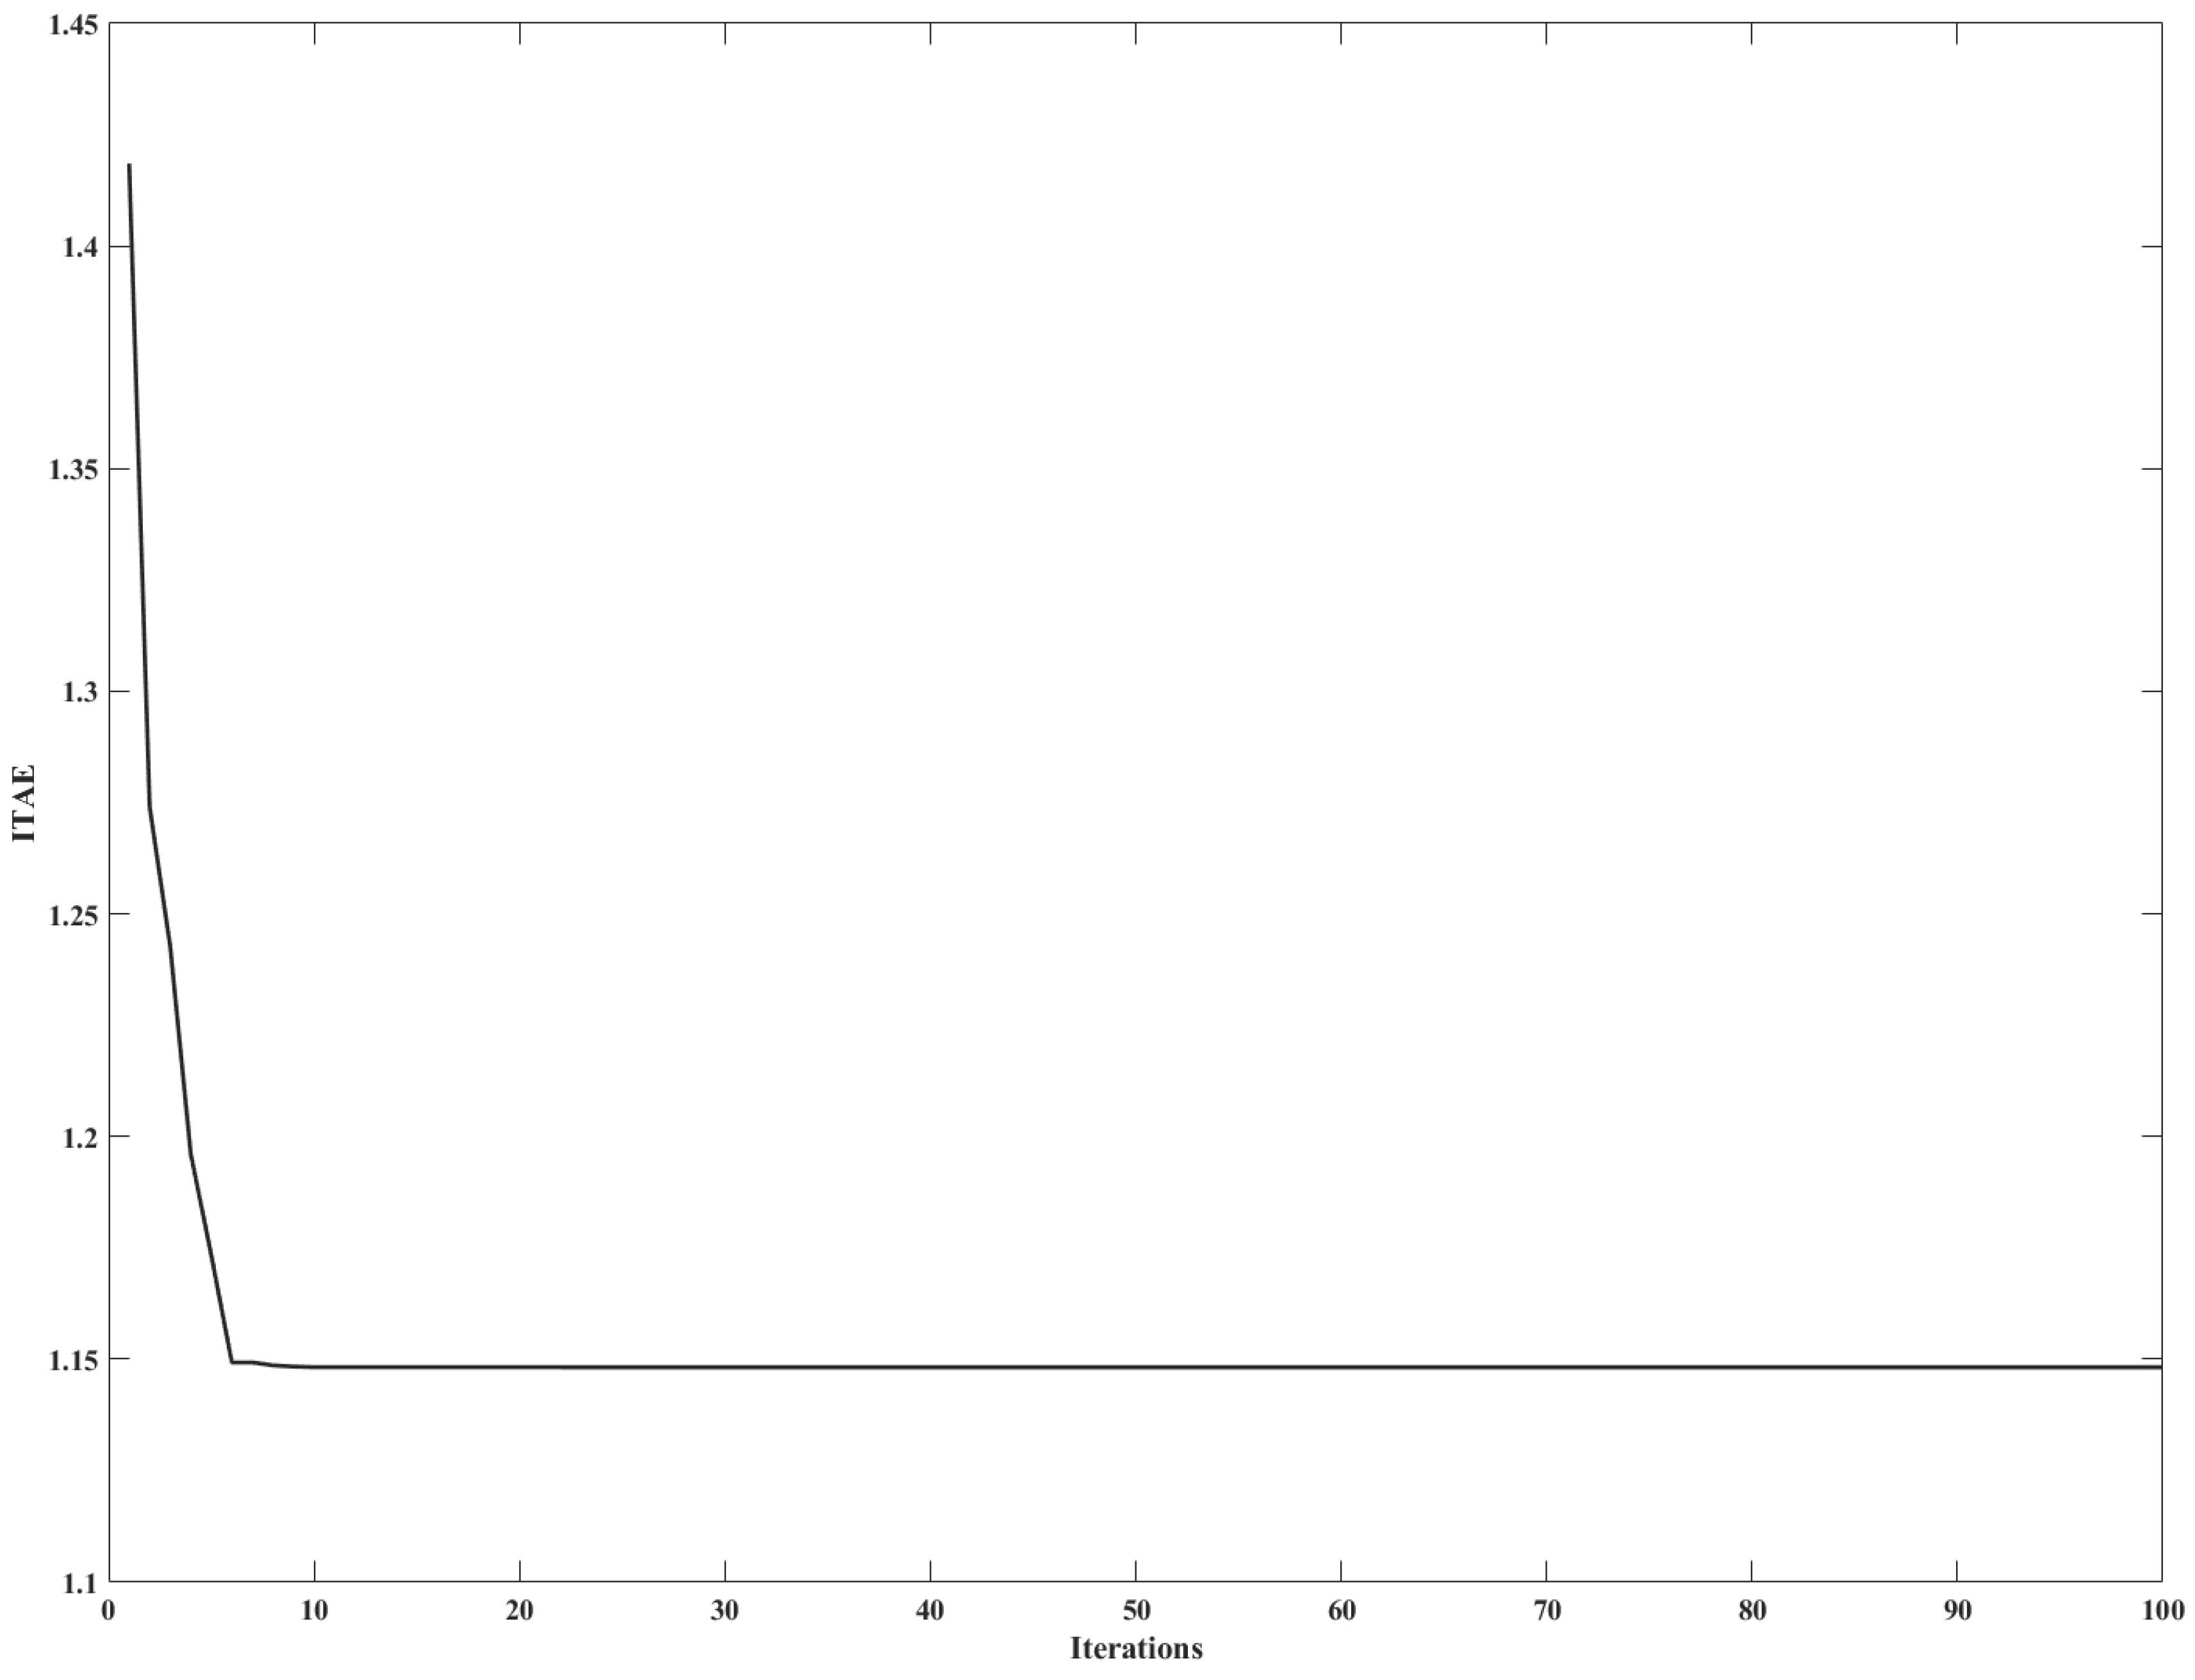
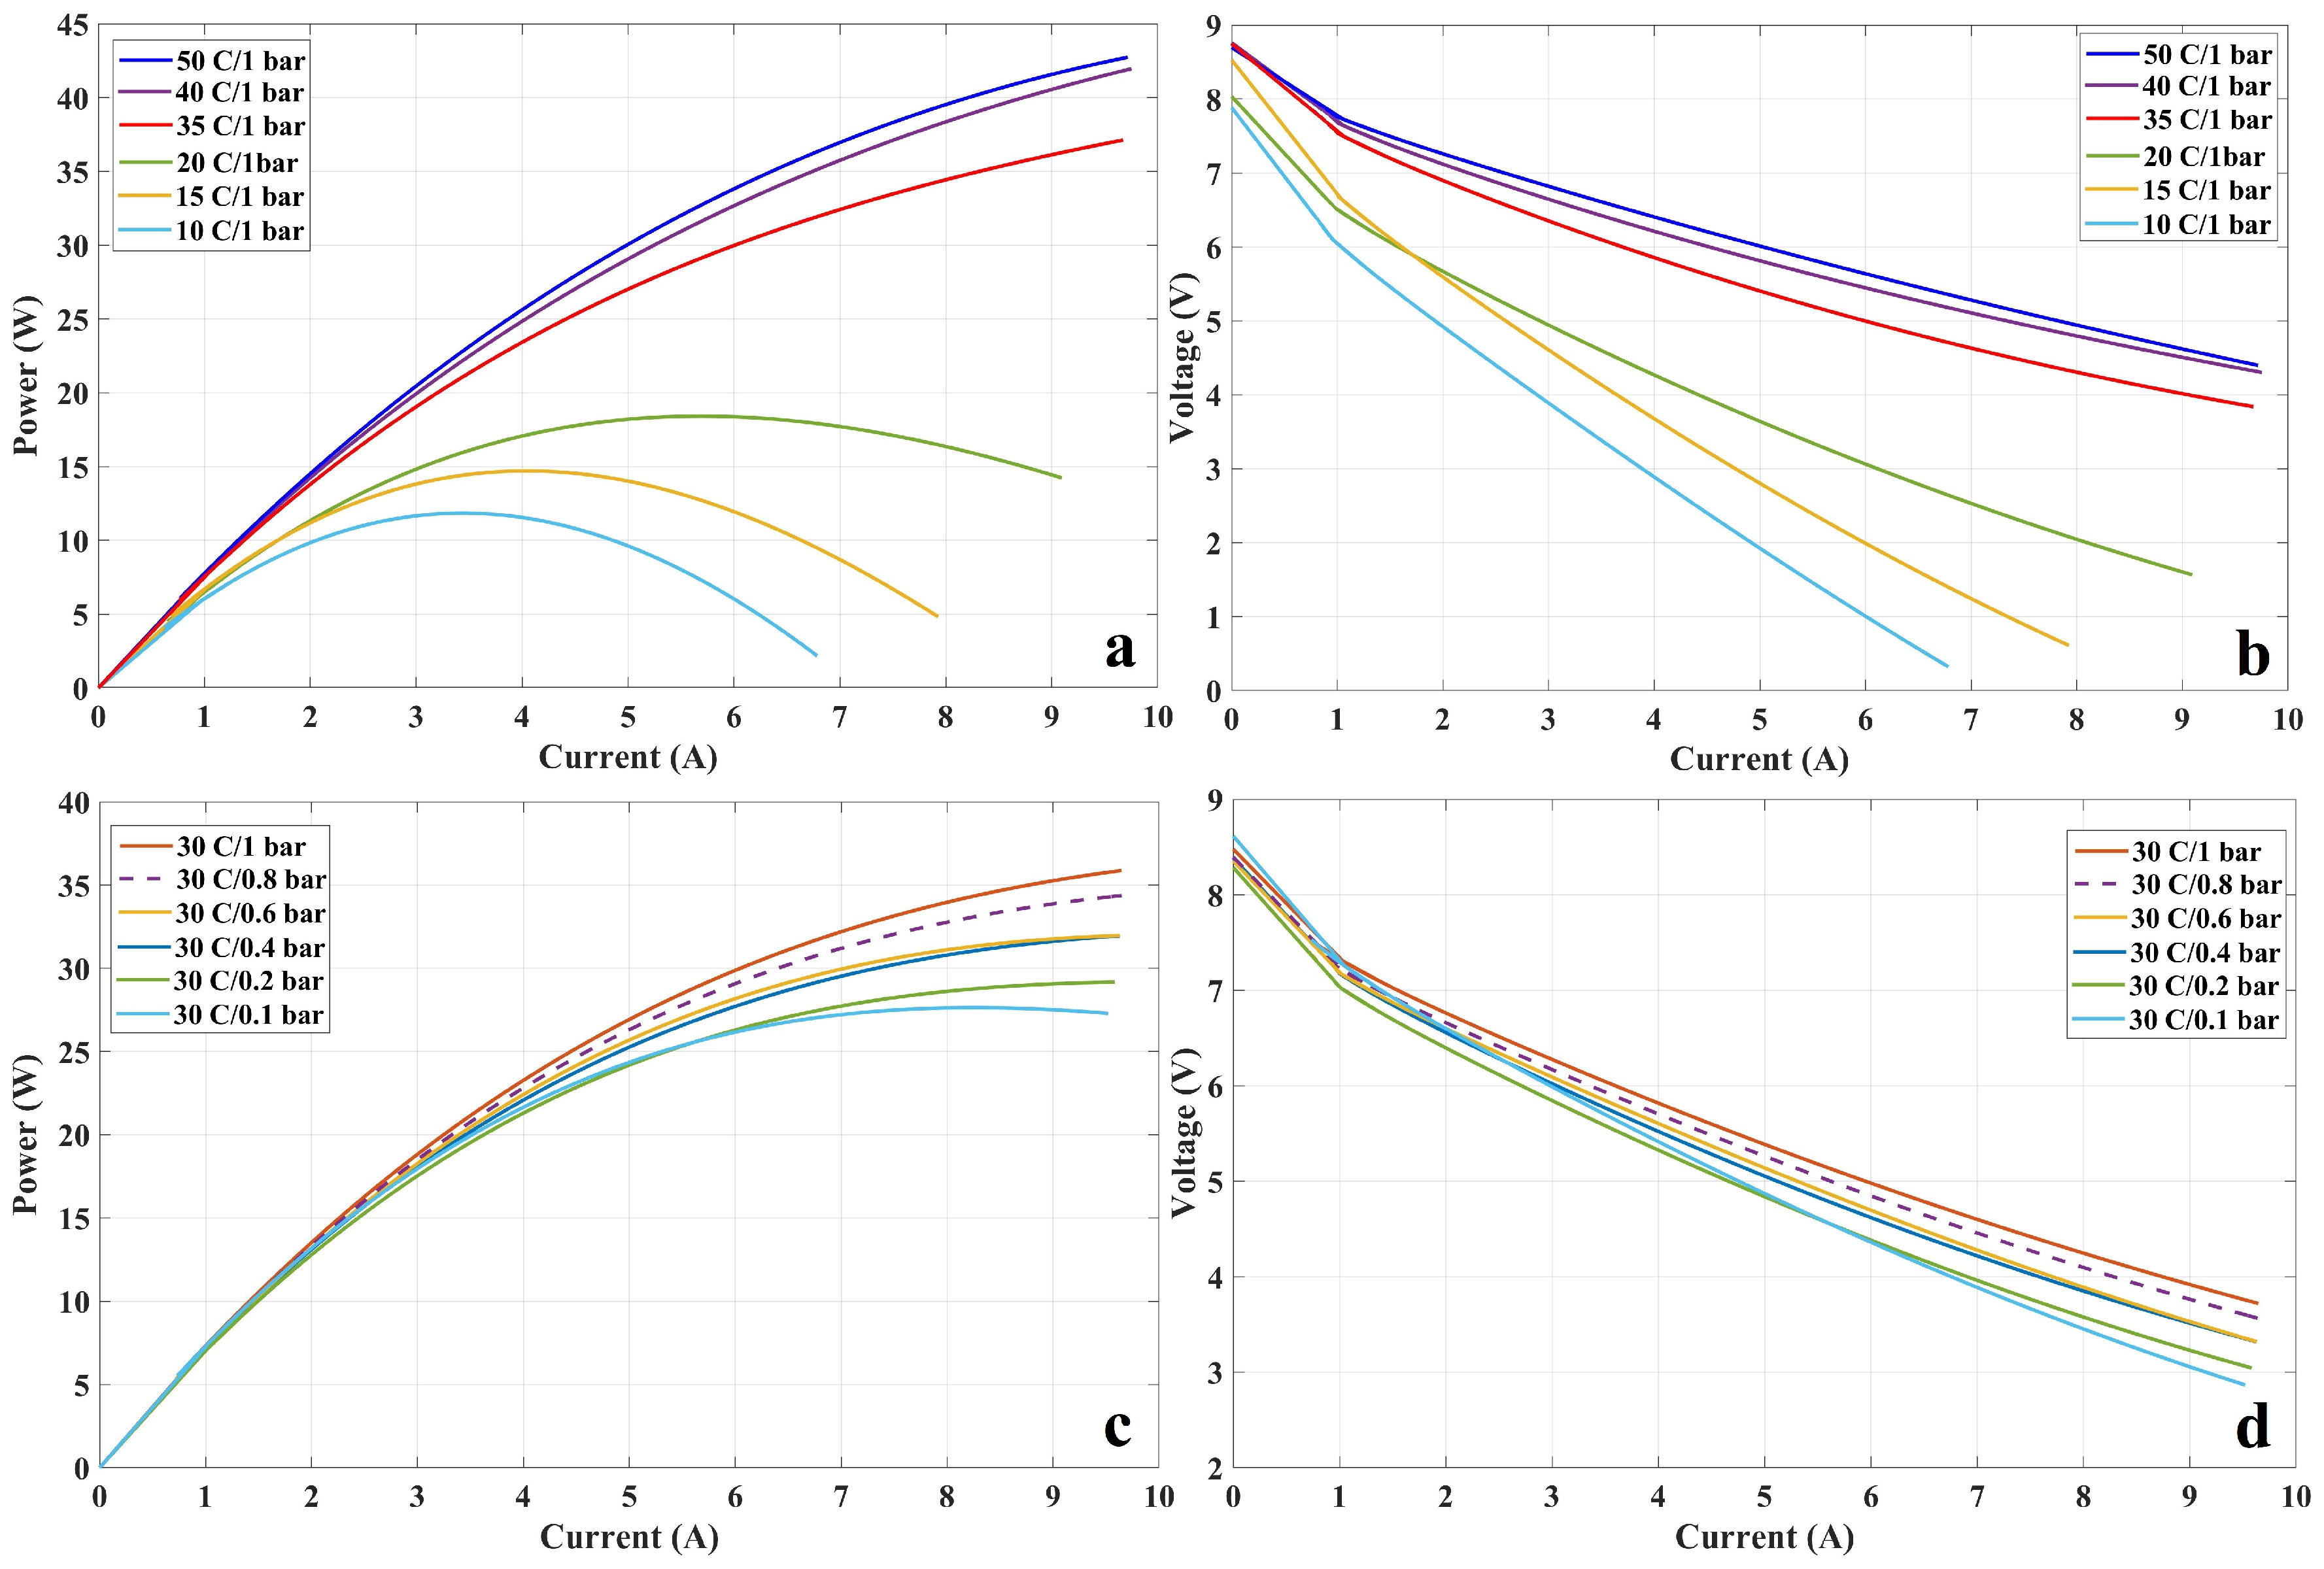
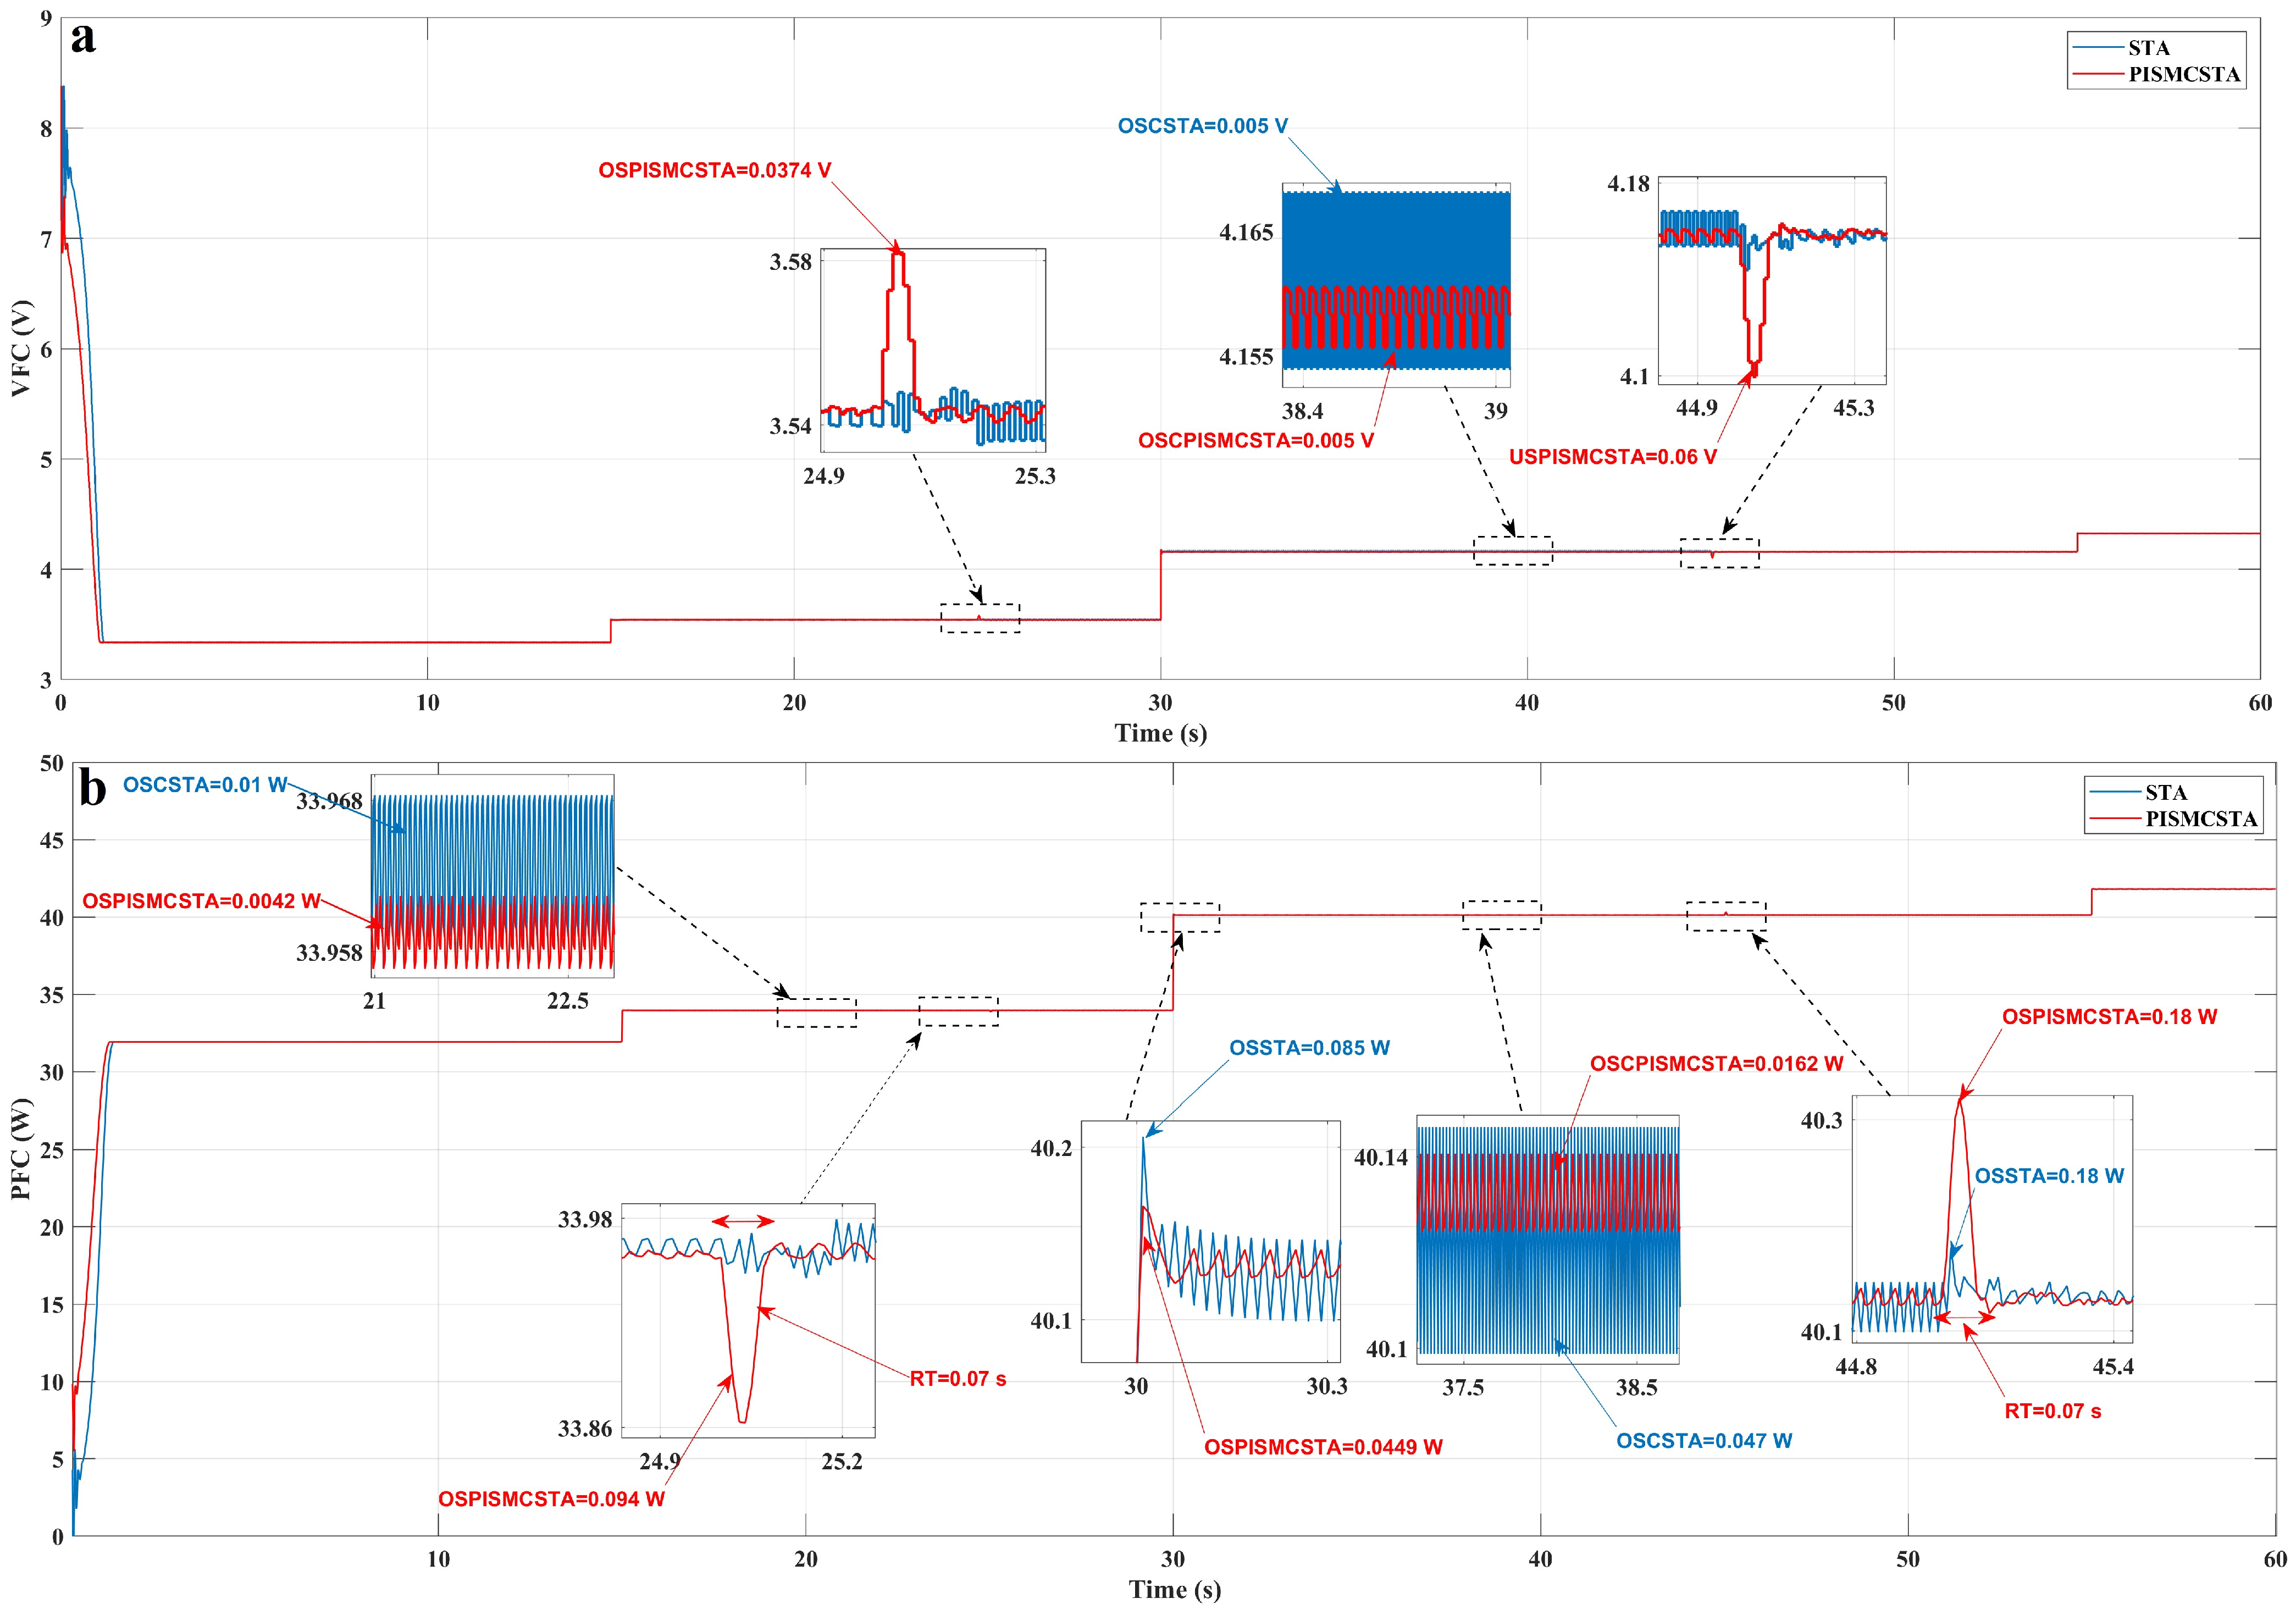
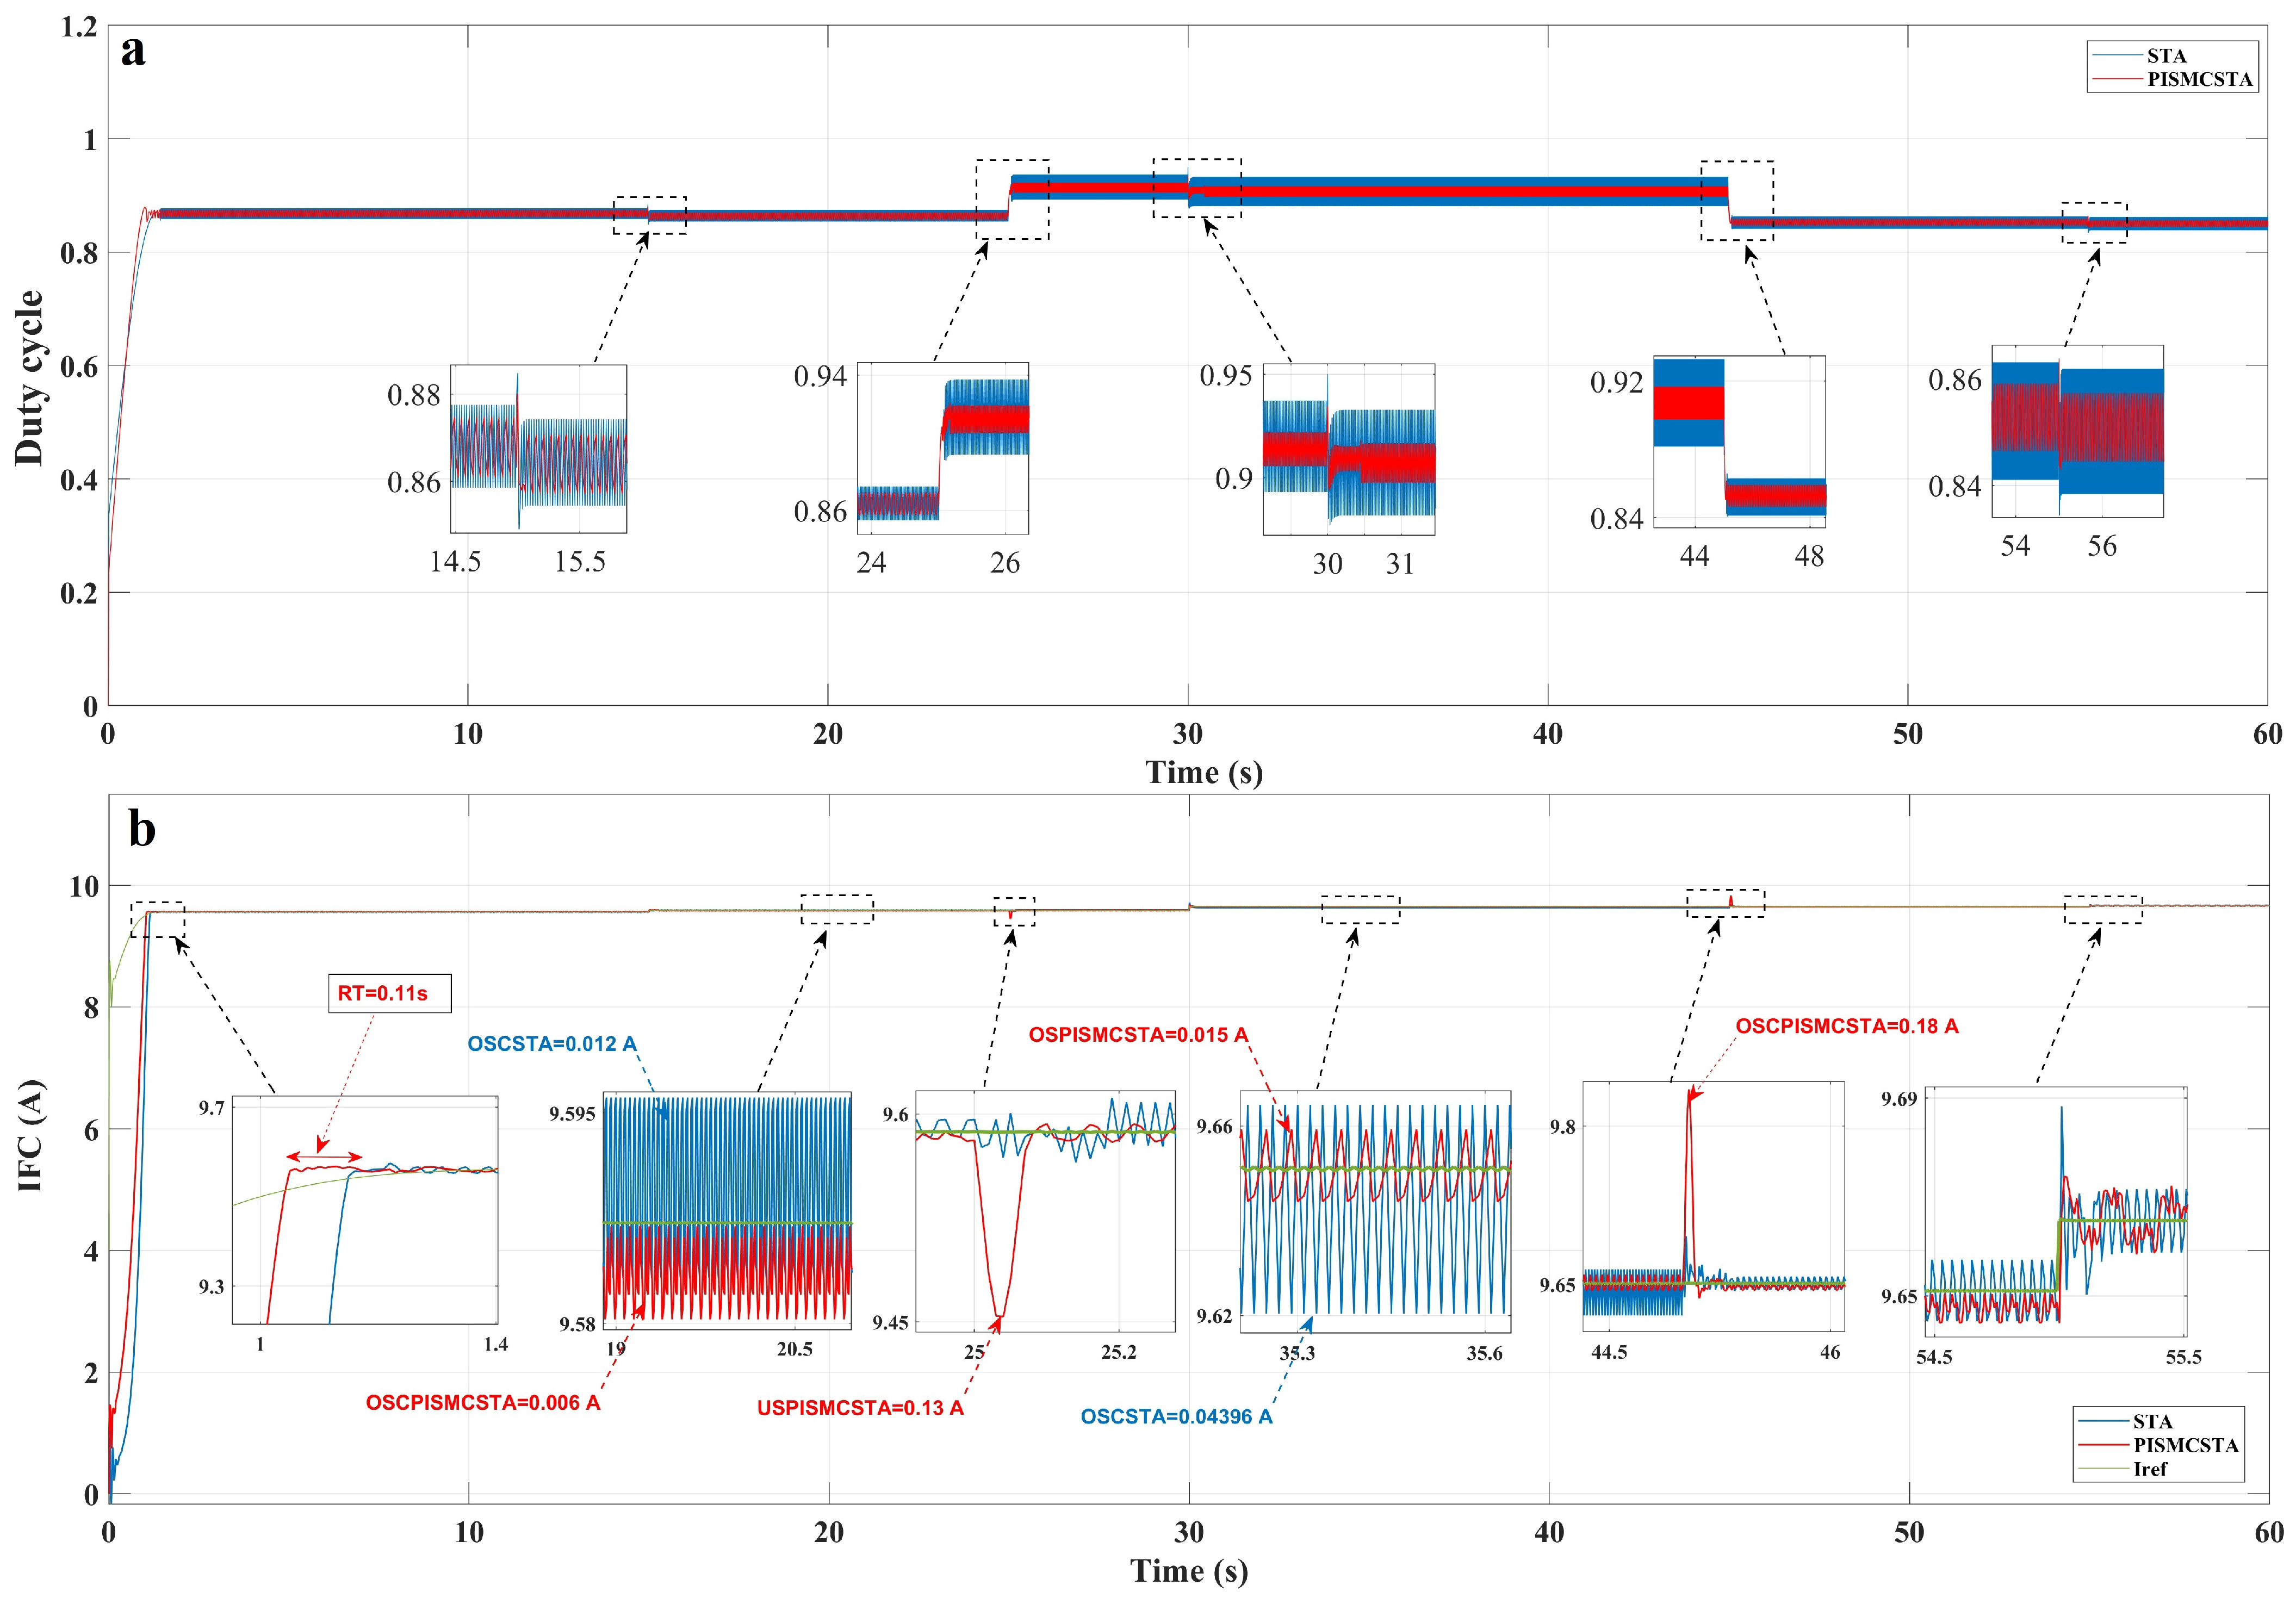
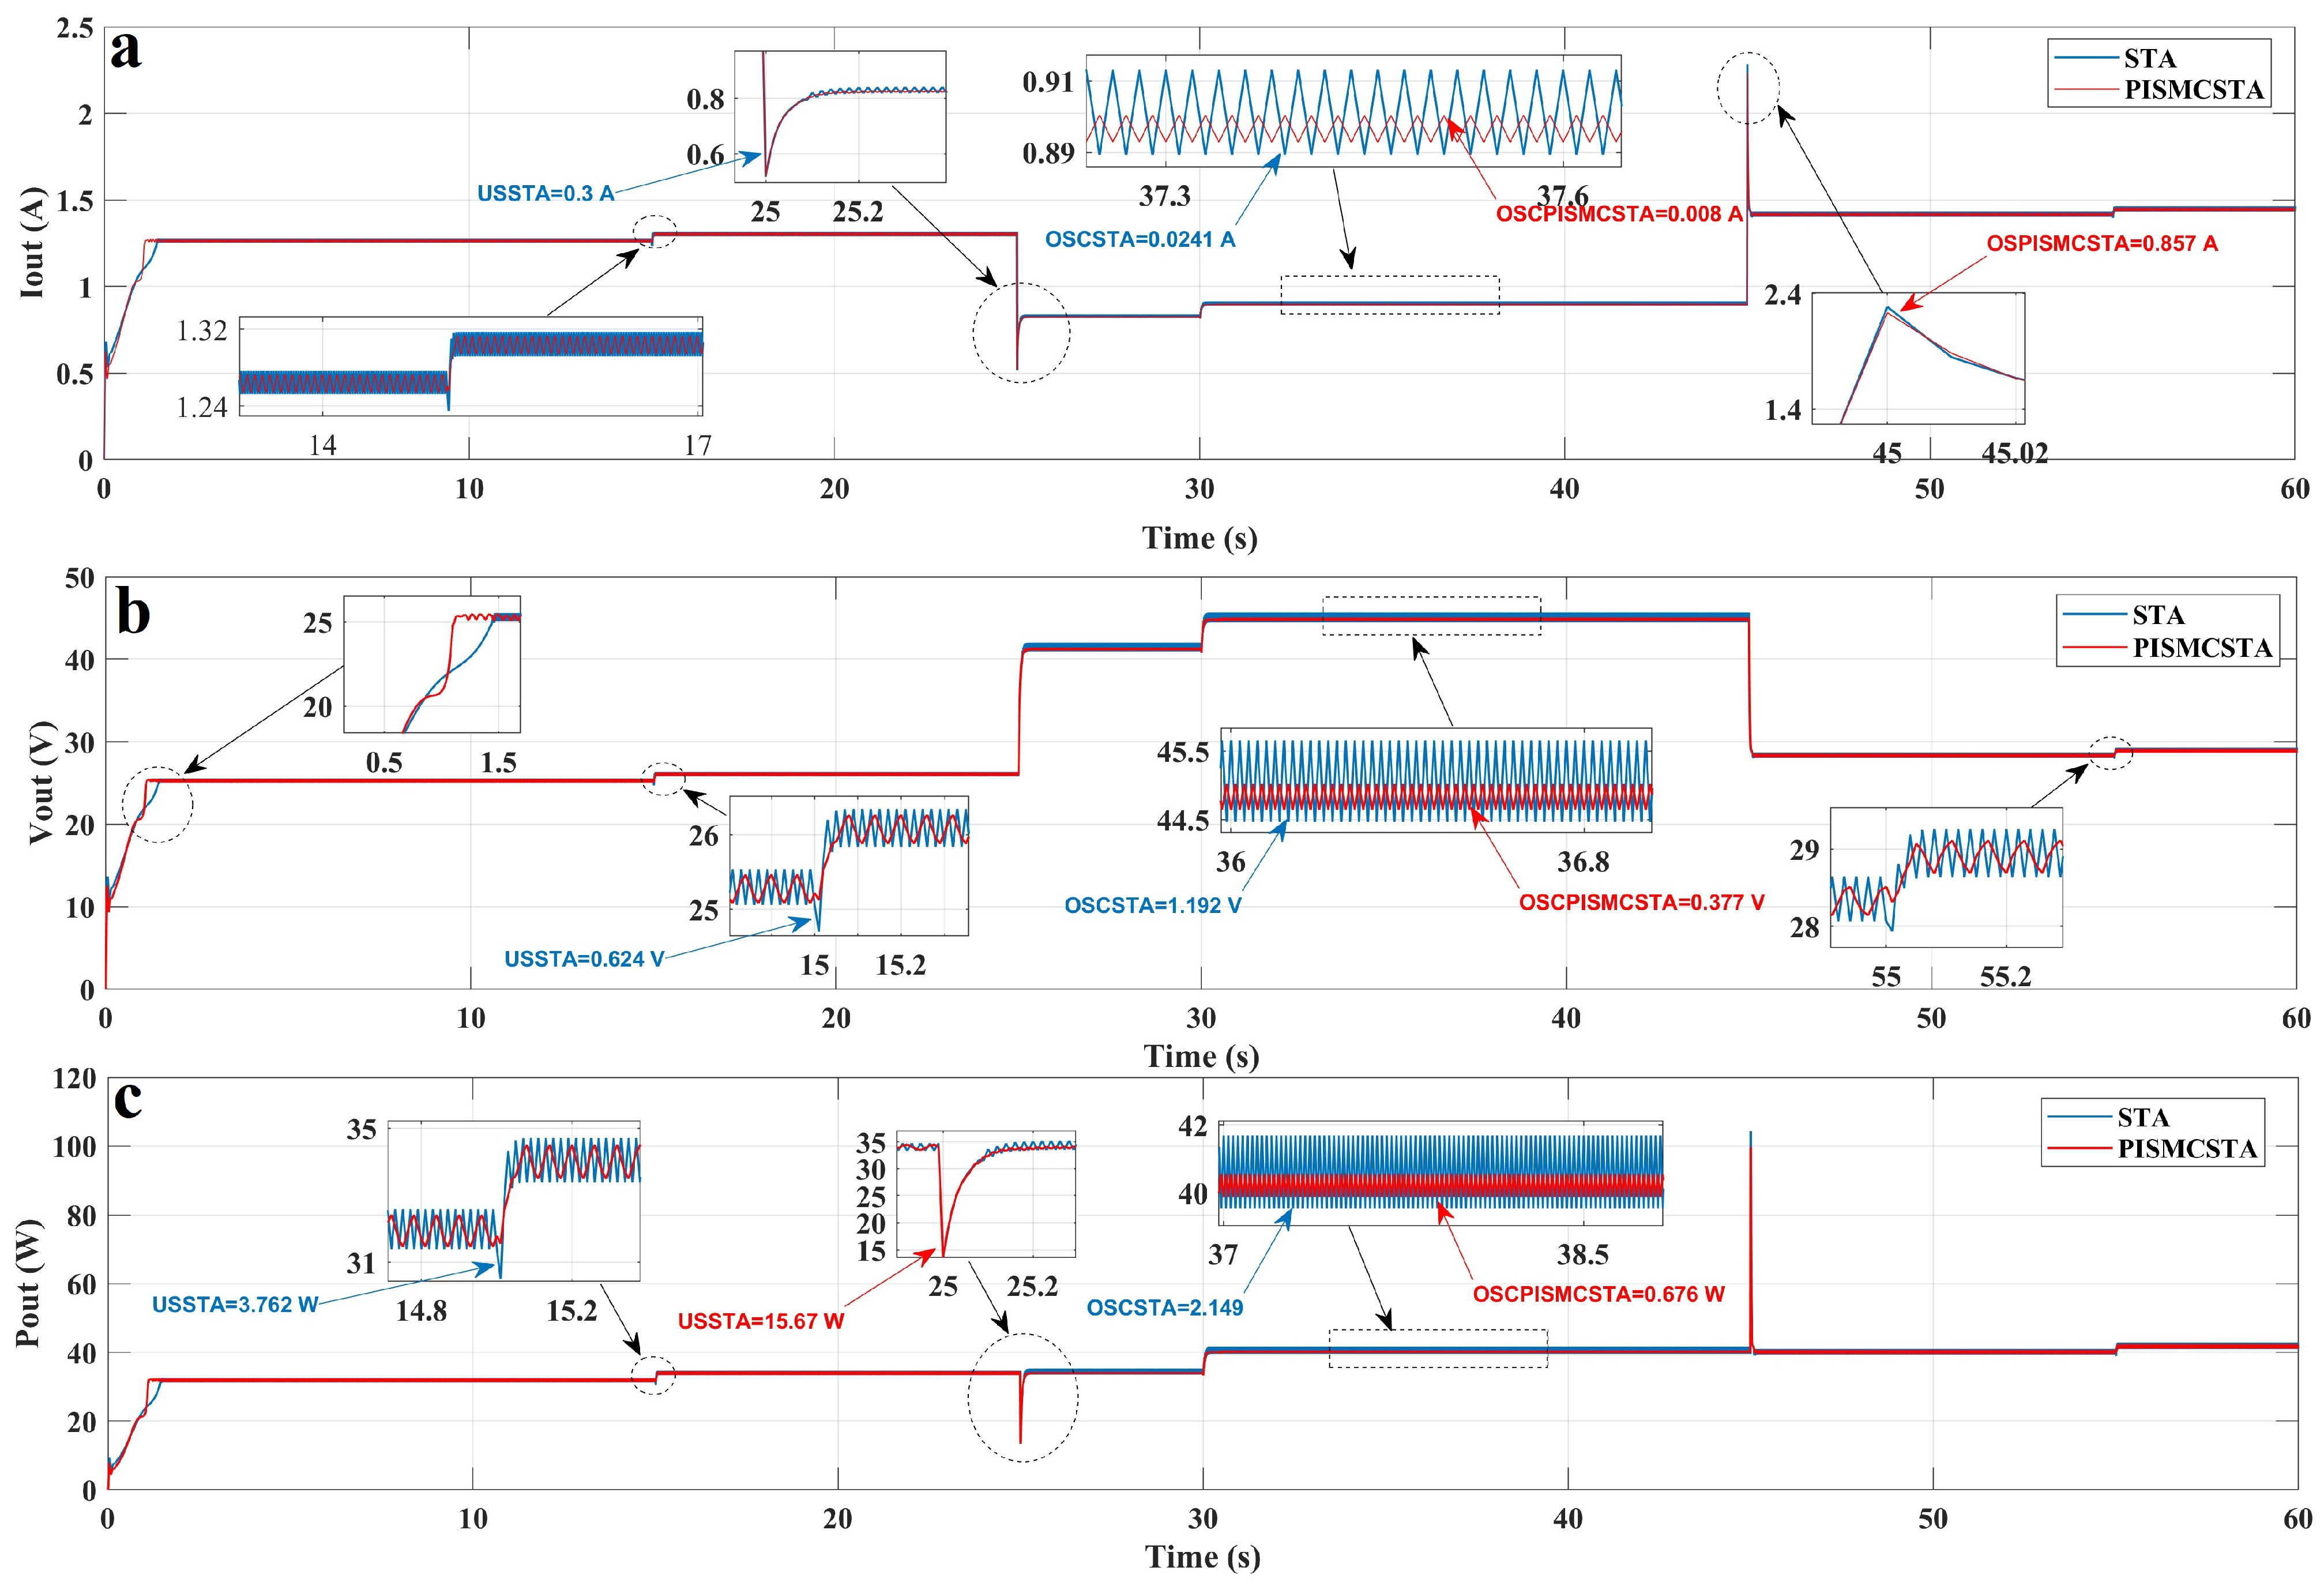
6. Results
7. Conclusions
Author Contributions
Funding
Institutional Review Board Statement
Informed Consent Statement
Data Availability Statement
Acknowledgments
Conflicts of Interest
Abbreviations
| PI | Proportional–integral |
| SMC | Sliding mode control |
| PISMCSTA | PI sliding mode controller-based super-twisting algorithm |
| PEMFCs | Proton exchange membrane fuel cells |
| SGDM | Stochastic gradient descent with momentum |
| HOSM-TA | High-order sliding mode-based twisting algorithm |
| PID | Proportional–integral–derivative |
| FLC | Fuzzy logic controller |
| IFLC | Incremental fuzzy logic controller |
| AFLC | Adaptive fuzzy controller |
| NN | Neural network |
| NNFF | Neural network feed-forward |
| BP-NN | Back propagation neural network |
| ISE | Integral square error |
| IAE | Integral absolute error |
| ITAE | Integral time-weighted absolute error |
| PWM | Pulse-width modulation |
| BWOA | Black widow optimization algorithm |
| CR | Cannibalism rate |
| MR | Mutation rate |
| PR | Procreating rate |
| MPPT | Maximum power point-tracking |
| Perturb and observe |
References
- Overland, J.E.; Wang, M. The 2020 Siberian heat wave. Int. J. Climatol. 2021, 41, E2341–E2346. [Google Scholar] [CrossRef]
- Perera, F. Pollution from fossil-fuel combustion is the leading environmental threat to global pediatric health and equity: Solutions exist. Int. J. Environ. Res. Public Health 2018, 15, 16. [Google Scholar] [CrossRef] [PubMed]
- Zhao, J.; Zhang, M.; Zhao, B.; Du, X.; Zhang, H.; Shang, L.; Wang, C. Integrated Reactive Power Optimisation for Power Grids Containing Large-Scale Wind Power Based on Improved HHO Algorithm. Sustainability 2023, 15, 12962. [Google Scholar] [CrossRef]
- Mustafa, R.J.; Gomaa, M.R.; Al-Dhaifallah, M.; Rezk, H. Environmental impacts on the performance of solar photovoltaic systems. Sustainability 2020, 12, 608. [Google Scholar] [CrossRef]
- Reza, M.S.; Taweekun, J.; Afroze, S.; Siddique, S.A.; Islam, M.S.; Wang, C.; Azad, A.K. Investigation of Thermochemical Properties and Pyrolysis of Barley Waste as a Source for Renewable Energy. Sustainability 2023, 15, 1643. [Google Scholar] [CrossRef]
- Tziritas, D.; Stavrakakis, G.M.; Bakirtzis, D.; Kaplanis, G.; Patlitzianas, K.; Damasiotis, M.; Zervas, P.L. Techno-Economic Analysis of a Hydrogen-Based Power Supply Backup System for Tertiary Sector Buildings: A Case Study in Greece. Sustainability 2023, 15, 7646. [Google Scholar] [CrossRef]
- Li, L.; Wang, S.; Zhang, S.; Liu, D.; Ma, S. The Hydrogen Energy Infrastructure Location Selection Model: A Hybrid Fuzzy Decision-Making Approach. Sustainability 2023, 15, 10195. [Google Scholar] [CrossRef]
- Huang, H.; Ding, H.; Hu, D.; Cheng, Z.; Qiu, C.; Shen, Y.; Su, X. Thermal Performance Optimization of Multiple Circuits Cooling System for Fuel Cell Vehicle. Sustainability 2023, 15, 3132. [Google Scholar] [CrossRef]
- Fayyazi, M.; Sardar, P.; Thomas, S.I.; Daghigh, R.; Jamali, A.; Esch, T.; Kemper, H.; Langari, R.; Khayyam, H. Artificial Intelligence/Machine Learning in Energy Management Systems, Control, and Optimization of Hydrogen Fuel Cell Vehicles. Sustainability 2023, 15, 5249. [Google Scholar] [CrossRef]
- He, K.; Qin, D.; Chen, J.; Wang, T.; Wu, H.; Wang, P. Adaptive Equivalent Consumption Minimization Strategy for Fuel Cell Buses Based on Driving Style Recognition. Sustainability 2023, 15, 7781. [Google Scholar] [CrossRef]
- Wang, S.; Zhu, H.; Zhang, S. Two-stage grid-connected frequency regulation control strategy based on photovoltaic power prediction. Sustainability 2023, 15, 8929. [Google Scholar] [CrossRef]
- Mumtaz, F.; Yahaya, N.Z.; Meraj, S.T.; Singh, N.S.S.; Rahman, M.S.; Hossain Lipu, M.S. A High Voltage Gain Interleaved DC-DC Converter Integrated Fuel Cell for Power Quality Enhancement of Microgrid. Sustainability 2023, 15, 7157. [Google Scholar] [CrossRef]
- Soomro, A.H.; Larik, A.S.; Mahar, M.A.; Sahito, A.A. Simulation-based comparison of PID with sliding mode controller for matrix-converter-based dynamic voltage restorer under variation of system parameters to alleviate the voltage sag in distribution system. Sustainability 2022, 14, 14661. [Google Scholar] [CrossRef]
- Derbeli, M.; Farhat, M.; Barambones, O.; Sbita, L. A review on DC/DC converter architectures for power fuel cell applications. In Proceedings of the 2017 International Conference on Green Energy Conversion Systems (GECS), Hammamet, Tunisia, 23–25 March 2017; pp. 1–5. [Google Scholar]
- Silaa, M.Y.; Barambones, O.; Bencherif, A. A Novel Adaptive PID Controller Design for a PEM Fuel Cell Using Stochastic Gradient Descent with Momentum Enhanced by Whale Optimizer. Energy Convers. Manag. 2022, 11, 2610. [Google Scholar] [CrossRef]
- Weng, Y.; Wang, N. SMC-based model-free tracking control of unknown autonomous surface vehicles. ISA Trans. 2022, 130, 684–691. [Google Scholar] [CrossRef] [PubMed]
- Russo, A.; Canciello, G.; Cavallo, A. Generalized super-twisting control of a dual active bridge for more electric aircraft. In Proceedings of the 2021 European Control Conference (ECC), Delft, The Netherlands, 29 June–2 July 2021; pp. 1610–1615. [Google Scholar]
- Russo, A.; Incremona, G.P.; Cavallo, A. A Saturated Higher Order Sliding Mode Control Approach for DC/DC Converters. In Proceedings of the 2022 IEEE 17th International Conference on Control & Automation (ICCA), Naples, Italy, 27–30 June 2022; pp. 44–49. [Google Scholar]
- Silaa, M.Y.; Derbeli, M.; Barambones, O.; Cheknane, A. Design and implementation of high order sliding mode control for PEMFC power system. Energies 2020, 13, 4317. [Google Scholar] [CrossRef]
- Laghrouche, S.; Harmouche, M.; Ahmed, F.S.; Chitour, Y. Control of PEMFC air-feed system using Lyapunov-based robust and adaptive higher order sliding mode control. IEEE Trans. Control Syst. Technol. 2014, 23, 1594–1601. [Google Scholar] [CrossRef]
- Rakhtala, S.M.; Noei, A.R.; Ghaderi, R.; Usai, E. Control of oxygen excess ratio in a PEM fuel cell system using high-order sliding-mode controller and observer. Turk. J. Electr. Eng. Comput. Sci. 2015, 23, 255–278. [Google Scholar] [CrossRef]
- Moslehpour, M.; Faez, S.E.; Gupta, B.B.; Arya, V. A Fuzzy-Based Analysis of the Mediating Factors Affecting Sustainable Purchase Intentions of Smartphones: The Case of Two Brands in Two Asian Countries. Sustainability 2023, 15, 9396. [Google Scholar] [CrossRef]
- Hu, P.; Cao, G.Y.; Zhu, X.J.; Hu, M. Coolant circuit modeling and temperature fuzzy control of proton exchange membrane fuel cells. Int. J. Hydrogen Energy 2010, 35, 9110–9123. [Google Scholar] [CrossRef]
- Nguyen, T.A. A novel approach with a fuzzy sliding mode proportional integral control algorithm tuned by fuzzy method (FSMPIF). Sci. Rep. 2023, 13, 7327. [Google Scholar] [CrossRef]
- Nguyen, D.N.; Nguyen, T.A. Proposing an original control algorithm for the active suspension system to improve vehicle vibration: Adaptive fuzzy sliding mode proportional-integral-derivative tuned by the fuzzy (AFSPIDF). Heliyon 2023, 13, e14210. [Google Scholar] [CrossRef]
- Zheng, W.; Zhang, H.; You, S.; Ye, T. Numerical and experimental investigation of a helical coil heat exchanger for seawater-source heat pump in cold region. Int. J. Heat Mass Transf. 2016, 96, 1–10. [Google Scholar] [CrossRef]
- Li, C.H.; Sun, Z.H.; Wang, Y.L.; Wu, X.D. Fuzzy sliding mode control of air supply flow of a PEM fuel cell system. In Unifying Electrical Engineering and Electronics Engineering, Proceedings of the 2012 International Conference on Electrical and Electronics Engineering, Shanghai, China, 17–20 August 2014; Springer: Berlin/Heidelberg, Germany, 2014; pp. 933–942. [Google Scholar]
- Fan, L.; Liu, Y. Fuzzy logic based constant power control of a proton exchange membrane fuel cell. Methods 2012, 2. Available online: http://pe.org.pl/articles/2012/5b/17.pdf (accessed on 28 August 2023).
- Yin, P.; Chen, J.; He, H. Control of Oxygen Excess Ratio for a PEMFC Air Supply System by Intelligent PID Methods. Sustainability 2023, 15, 8500. [Google Scholar] [CrossRef]
- Li, G.; Li, Y. Temperature control of PEMFC stack based on BP neural network. In Proceedings of the 2016 4th International Conference on Machinery, Materials and Computing Technology, Hangzhou, China, 23–24 January 2016; pp. 1372–1376. [Google Scholar]
- Vinu, R.; Varghese, P. Robust optimized artificial neural network based PEM fuelcell voltage tracking. In Innovations in Bio-Inspired Computing and Applications, Proceedings of the 6th International Conference on Innovations in Bio-Inspired Computing and Applications (IBICA 2015), Kochi, India, 16–18 December 2015; Springer: Berlin/Heidelberg, Germany, 2016; pp. 79–91. [Google Scholar]
- Singla, M.K.; Nijhawan, P.; Oberoi, A.S. Parameter estimation of proton exchange membrane fuel cell using a novel meta-heuristic algorithm. Environ. Sci. Pollut. Res. 2021, 28, 34511–34526. [Google Scholar] [CrossRef]
- Le Ny, M.; Chadebec, O.; Cauffet, G.; Dedulle, J.M.; Bultel, Y. A three dimensional electrical model of PEMFC stack. Fuel Cells 2023, 12, 225–238. [Google Scholar] [CrossRef]
- Ali, M.A.; Mandour, M.E.; Lotfy, M.E. Adaptive Estimation of Quasi-Empirical Proton Exchange Membrane Fuel Cell Models Based on Coot Bird Optimizer and Data Accumulation. Sustainability 2023, 15, 9017. [Google Scholar] [CrossRef]
- Fathy, A.; Alanazi, A. An Efficient White Shark Optimizer for Enhancing the Performance of Proton Exchange Membrane Fuel Cells. Sustainability 2023, 15, 11741. [Google Scholar] [CrossRef]
- Islam, M.T.; Alam, M.A.; Lipu, M.S.H.; Hasan, K.; Meraj, S.T.; Masrur, H.; Rahman, M.F. A Single DC Source Five-Level Switched Capacitor Inverter for Grid-Integrated Solar Photovoltaic System: Modeling and Performance Investigation. Sustainability 2023, 15, 8405. [Google Scholar] [CrossRef]
- Rabah, S.; Zaier, A.; Lloret, J.; Dahman, H. Efficiency Enhancement of a Hybrid Sustainable Energy Harvesting System Using HHHOPSO-MPPT for IoT Devices. Sustainability 2023, 15, 10252. [Google Scholar] [CrossRef]
- Hayat, A.; Sibtain, D.; Murtaza, A.F.; Shahzad, S.; Jajja, M.S.; Kilic, H. Design and Analysis of Input Capacitor in DC-DC Boost Converter for Photovoltaic-Based Systems. Sustainability 2023, 15, 6321. [Google Scholar] [CrossRef]
- Pandiyan, P.; Saravanan, S.; Prabaharan, N.; Tiwari, R.; Chinnadurai, T.; Babu, N.R.; Hossain, E. Implementation of different MPPT techniques in solar PV tree under partial shading conditions. Sustainability 2021, 13, 7208. [Google Scholar] [CrossRef]
- Silaa, Y.; Bencherif, A.; Barambones, O. A novel robust adaptive sliding mode control using stochastic gradient descent for PEMFC power system. Int. J. Hydrogen Energy 2023, 48, 17277–17292. [Google Scholar] [CrossRef]
- Slotine, J.J.E. Sliding controller design for non-linear systems. Int. J. Control 1984, 40, 421–434. [Google Scholar] [CrossRef]
- Shtessel, Y.; Edwards, C.; Fridman, L.; Levant, A. Sliding Mode Control and Observation; Springer: Berlin/Heidelberg, Germany, 2014; Volume 10. [Google Scholar]
- Zine Laabidine, N.; Bossoufi, B.; El Kafazi, I.; El Bekkali, C.; El Ouanjli, N. Robust Adaptive Super Twisting Algorithm Sliding Mode Control of a Wind System Based on the PMSG Generator. Sustainability 2023, 15, 10792. [Google Scholar] [CrossRef]
- Hussien, A.M.; Kim, J.; Alkuhayli, A.; Alharbi, M.; Hasanien, H.M.; Tostado-Véliz, M.; Turky, R.A.; Jurado, F. Adaptive PI Control Strategy for Optimal Microgrid Autonomous Operation. Sustainability 2022, 14, 14928. [Google Scholar] [CrossRef]
- Levant, A. Sliding order and sliding accuracy in sliding mode control. Int. J. Control 1993, 58, 1247–1263. [Google Scholar] [CrossRef]
- Hayyolalam, V.; Kazem, A.A.P. Black widow optimization algorithm: A novel meta-heuristic approach for solving engineering optimization problems. Eng. Appl. Artif. Intell. 2020, 87, 103249. [Google Scholar] [CrossRef]
- Ganguly, A.; Biswas, P.K.; Sain, C.; Azar, A.T.; Mahlous, A.R.; Ahmed, S. Horse Herd Optimized Intelligent Controller for Sustainable PV Interface Grid-Connected System: A Qualitative Approach. Sustainability 2023, 15, 11160. [Google Scholar] [CrossRef]


| Parameter | Value |
|---|---|
| A | 162 cm2 |
| 23 | |
| l | 175 × 10 cm |
| 0.1 V | |
| 0.0003 | |
| 0.062 A · cm−1 | |
| 10 | |
| − 0.9514 V | |
| −0.00312 V/K | |
| −7.4 × 10 V/K | |
| 1.87 × 10 V/K |
| Parameter | Value |
|---|---|
| Inductance | 69 mH |
| Capacitor | mF |
| Maximum switching frequency | 10 kHz |
| Maximum input voltage | 25 V |
| Maximum input current | 15 A |
| Maximum output voltage | 80 V |
| Maximum output current | 2 A |
| Algorithm | Range | ||||||
|---|---|---|---|---|---|---|---|
| BWOA | Min | 0 | 0 | 0 | 0 | 0 | |
| Max | 1 | 1 | 10 | 10 | 10 |
| Controller | ||||||
|---|---|---|---|---|---|---|
| STA | 0 | 0 | − | |||
| PISMCSTA |
Disclaimer/Publisher’s Note: The statements, opinions and data contained in all publications are solely those of the individual author(s) and contributor(s) and not of MDPI and/or the editor(s). MDPI and/or the editor(s) disclaim responsibility for any injury to people or property resulting from any ideas, methods, instructions or products referred to in the content. |
© 2023 by the authors. Licensee MDPI, Basel, Switzerland. This article is an open access article distributed under the terms and conditions of the Creative Commons Attribution (CC BY) license (https://creativecommons.org/licenses/by/4.0/).
Share and Cite
Silaa, M.Y.; Barambones, O.; Cortajarena, J.A.; Alkorta, P.; Bencherif, A. PEMFC Current Control Using a Novel Compound Controller Enhanced by the Black Widow Algorithm: A Comprehensive Simulation Study. Sustainability 2023, 15, 13823. https://doi.org/10.3390/su151813823
Silaa MY, Barambones O, Cortajarena JA, Alkorta P, Bencherif A. PEMFC Current Control Using a Novel Compound Controller Enhanced by the Black Widow Algorithm: A Comprehensive Simulation Study. Sustainability. 2023; 15(18):13823. https://doi.org/10.3390/su151813823
Chicago/Turabian StyleSilaa, Mohammed Yousri, Oscar Barambones, José Antonio Cortajarena, Patxi Alkorta, and Aissa Bencherif. 2023. "PEMFC Current Control Using a Novel Compound Controller Enhanced by the Black Widow Algorithm: A Comprehensive Simulation Study" Sustainability 15, no. 18: 13823. https://doi.org/10.3390/su151813823
APA StyleSilaa, M. Y., Barambones, O., Cortajarena, J. A., Alkorta, P., & Bencherif, A. (2023). PEMFC Current Control Using a Novel Compound Controller Enhanced by the Black Widow Algorithm: A Comprehensive Simulation Study. Sustainability, 15(18), 13823. https://doi.org/10.3390/su151813823