

Seismic Characterization of a Landslide Complex: A Case History from Majes, Peru

 , , ,
, , ,  , , and
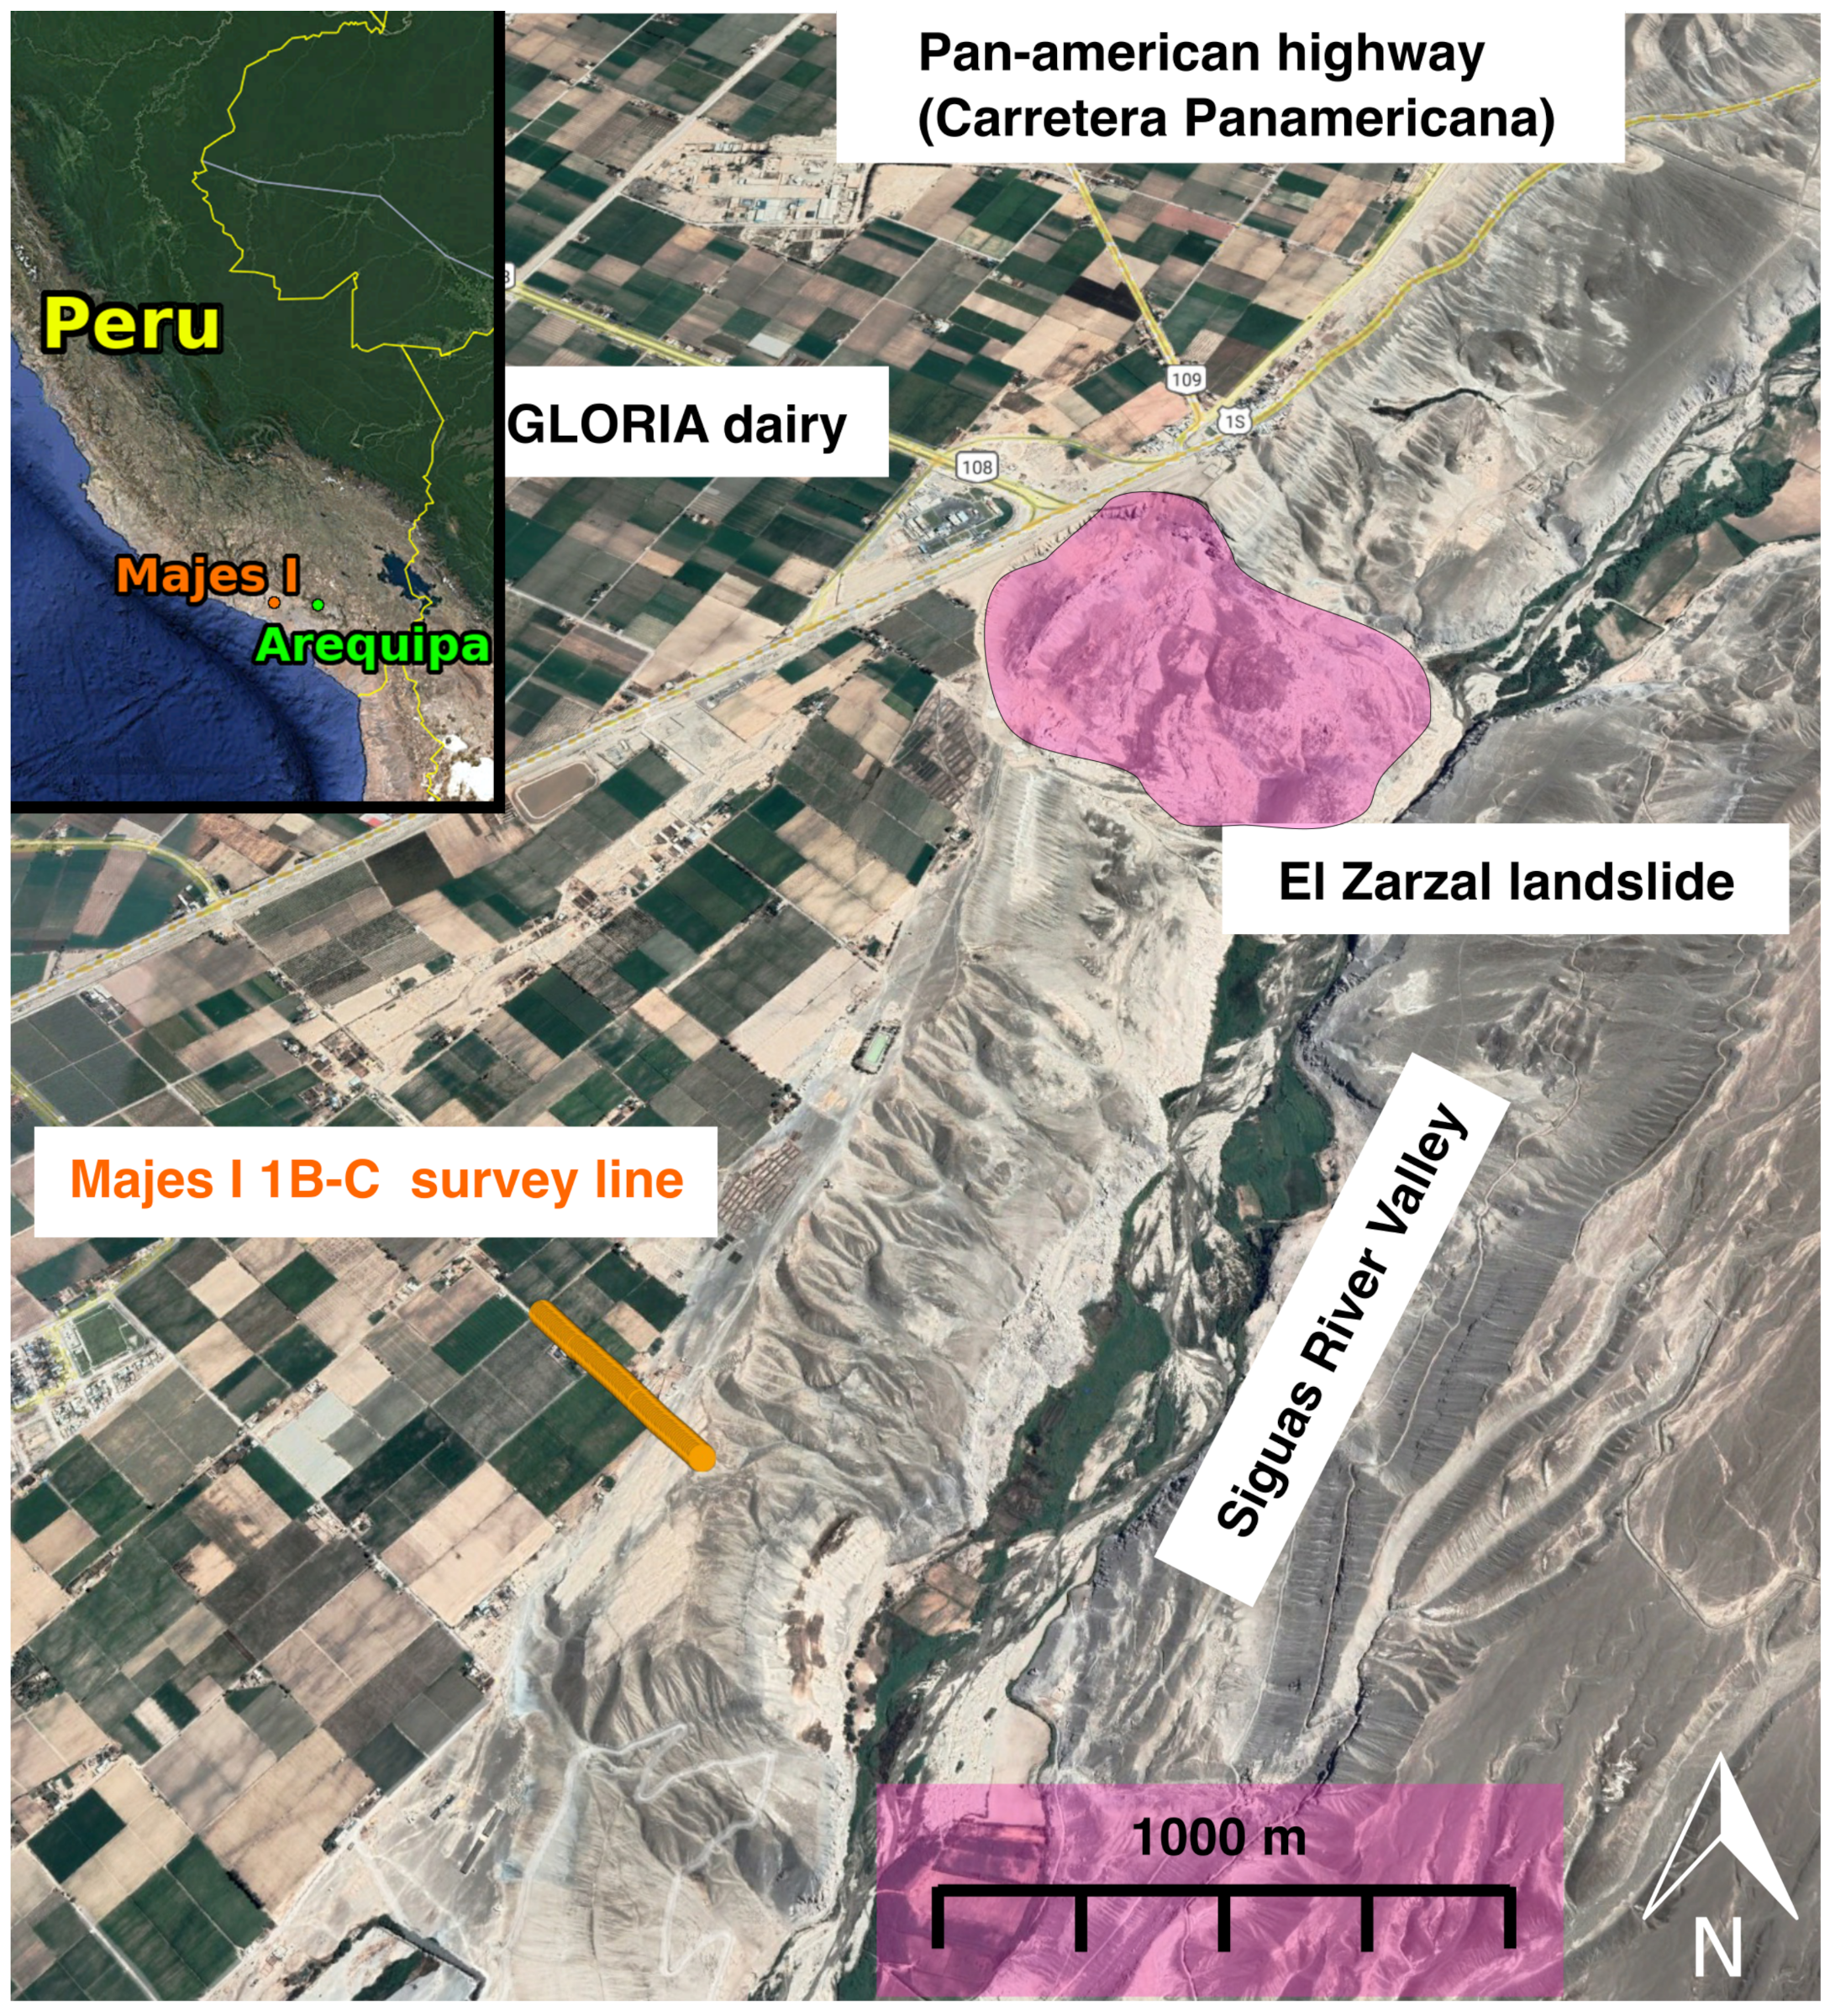
Abstract
:1. Introduction
2. Majes Geology and Hydrology
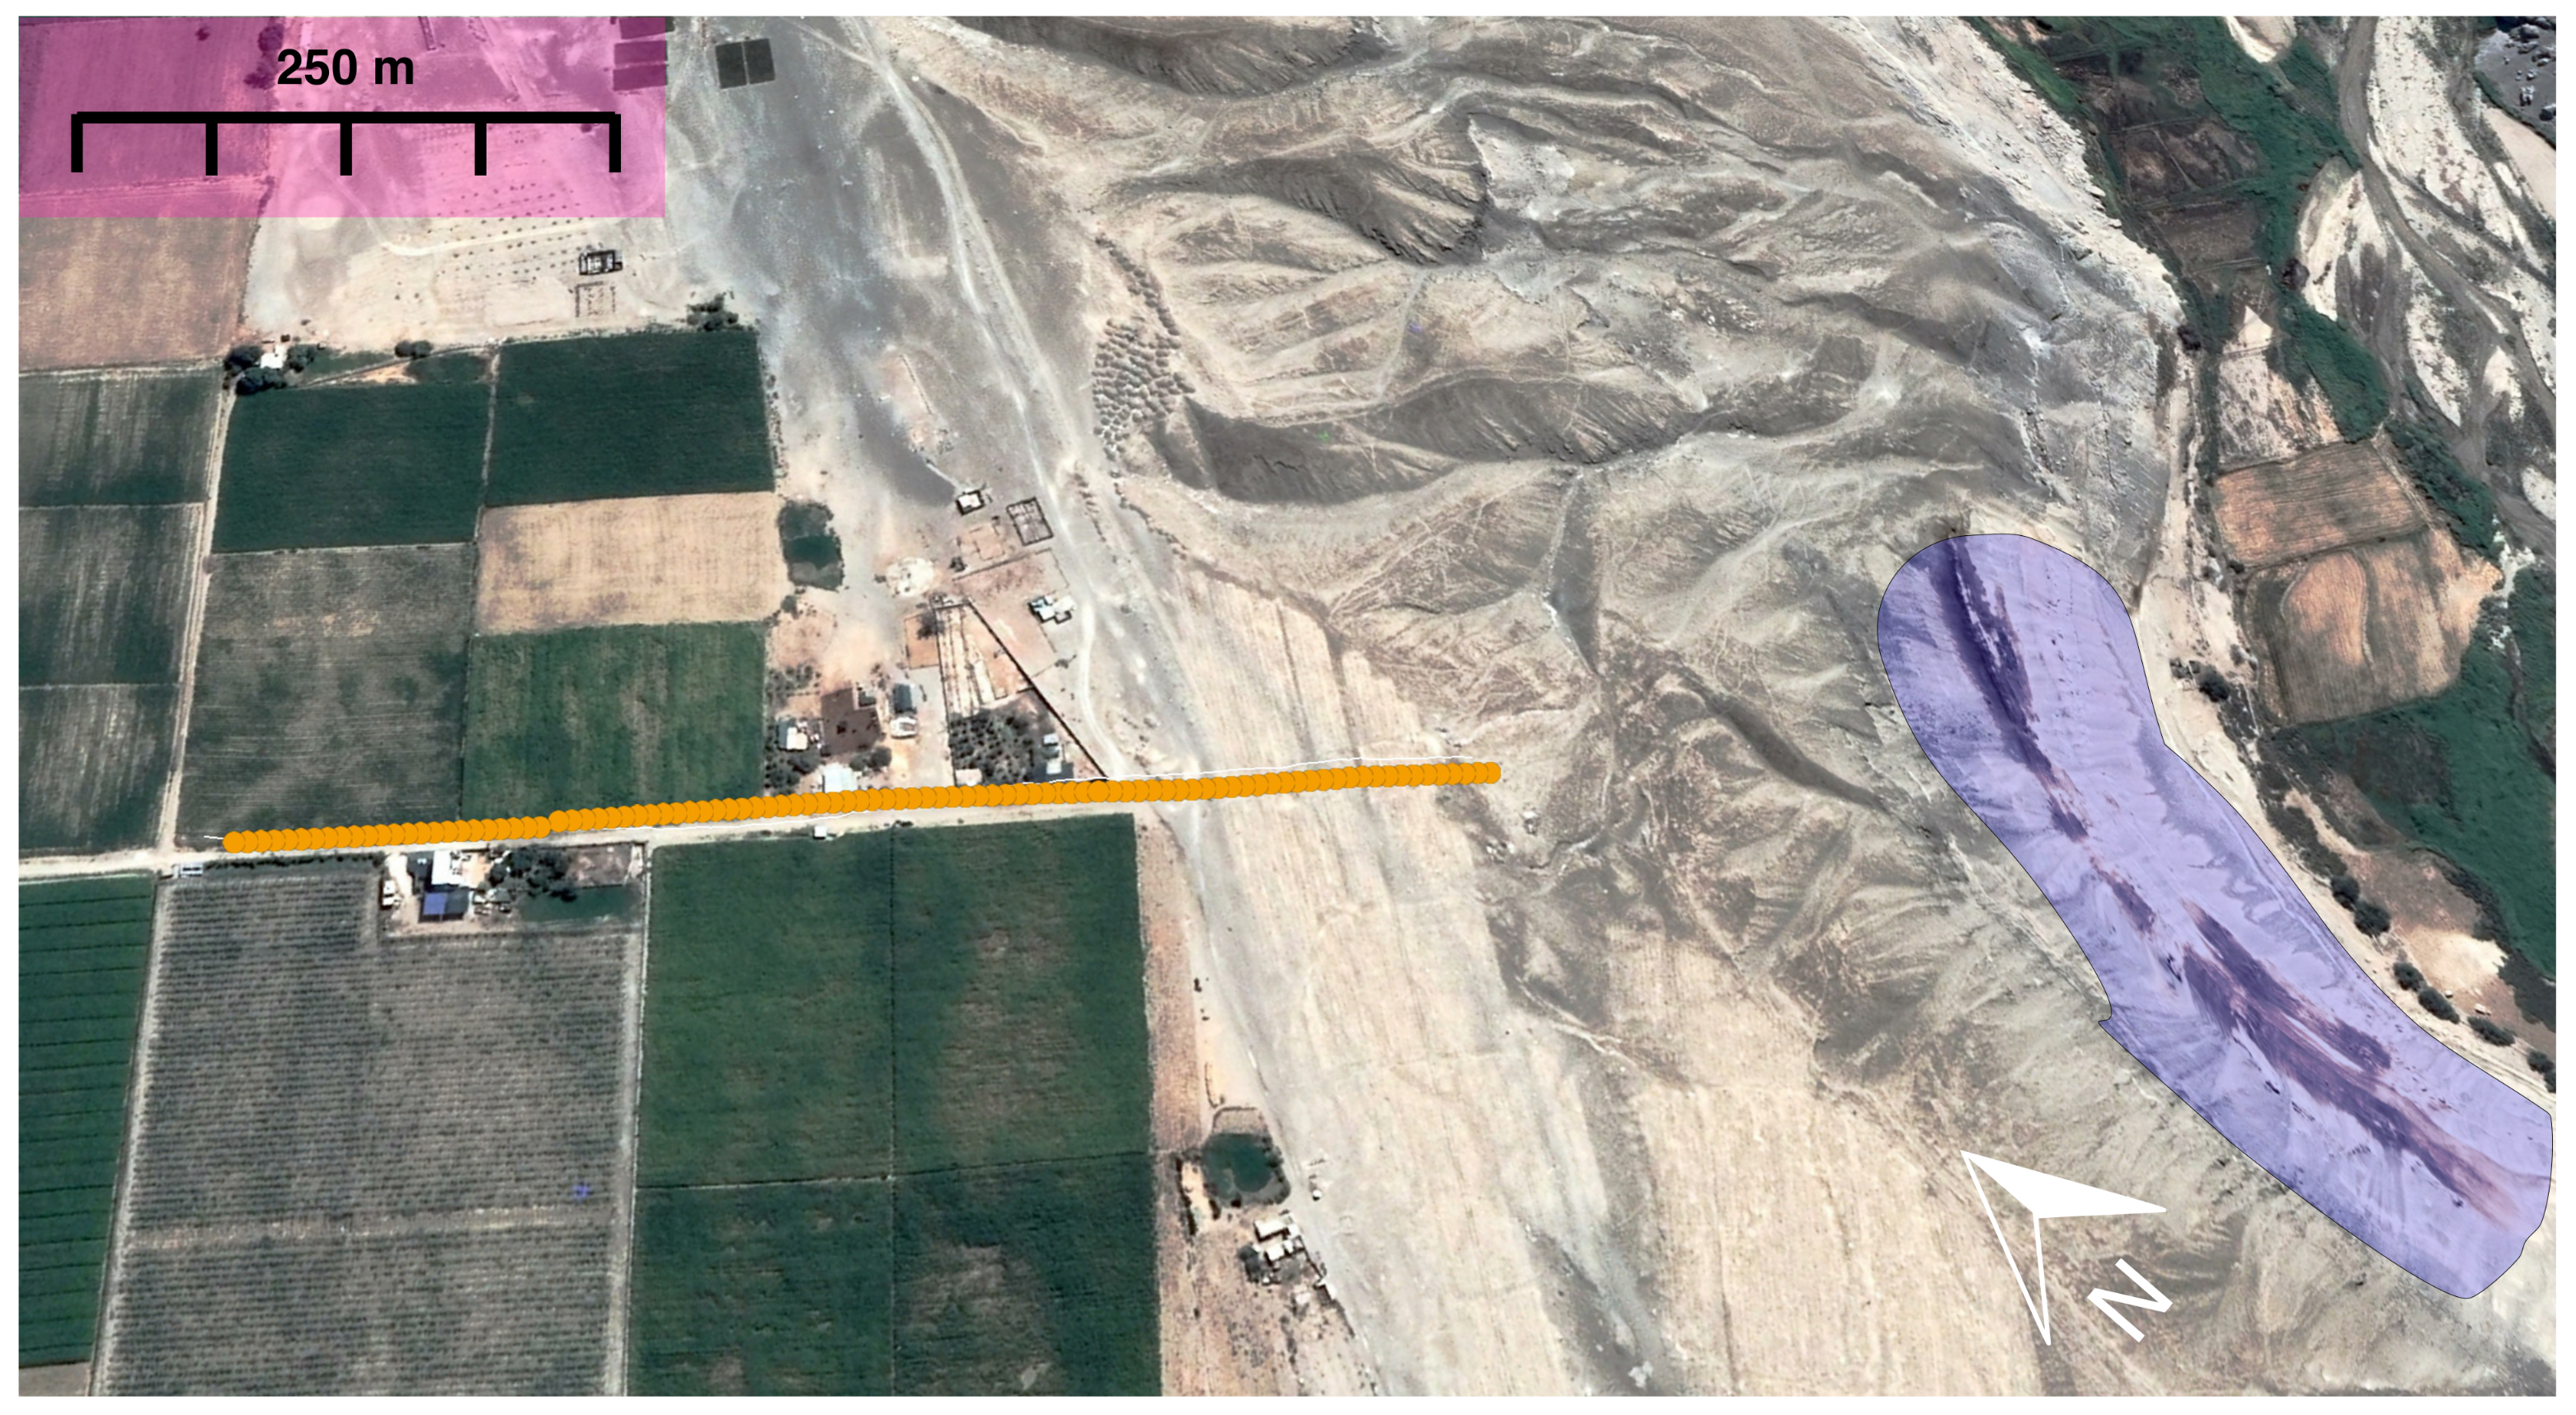
3. Seismic Data Acquisition
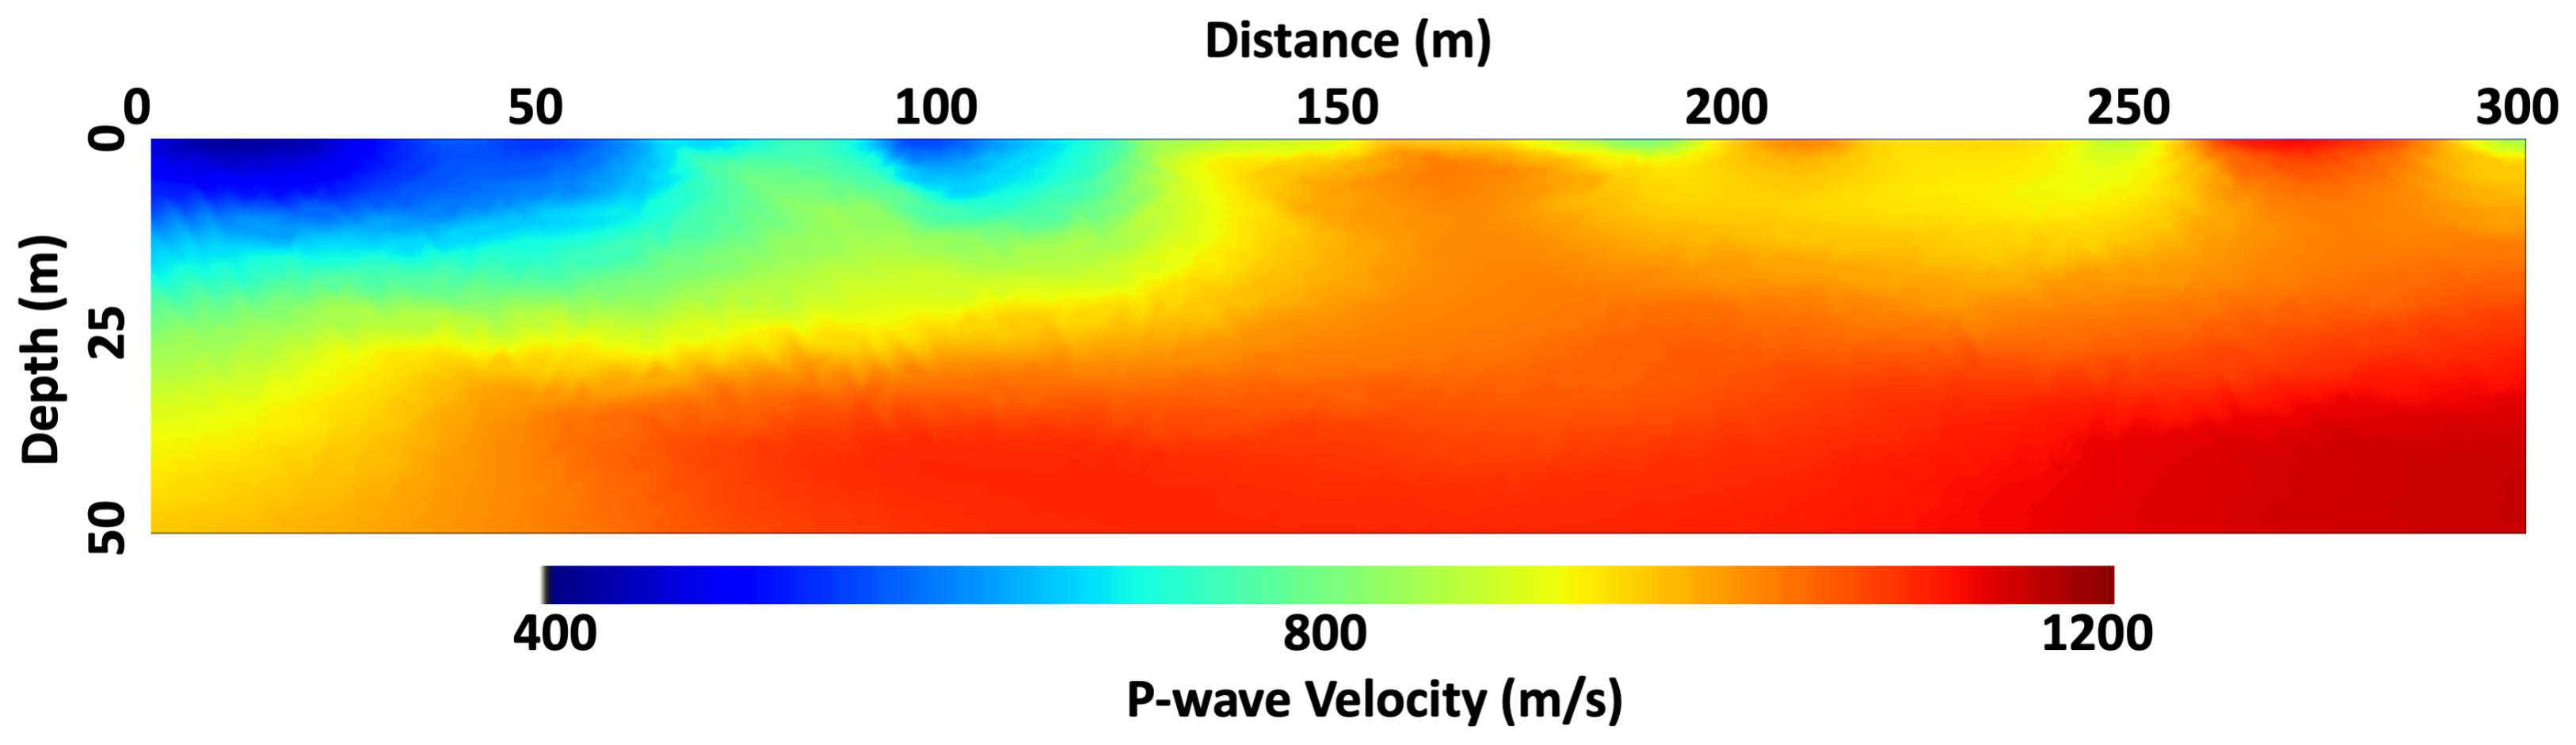
4. P-wave Seismic Refraction Tomography
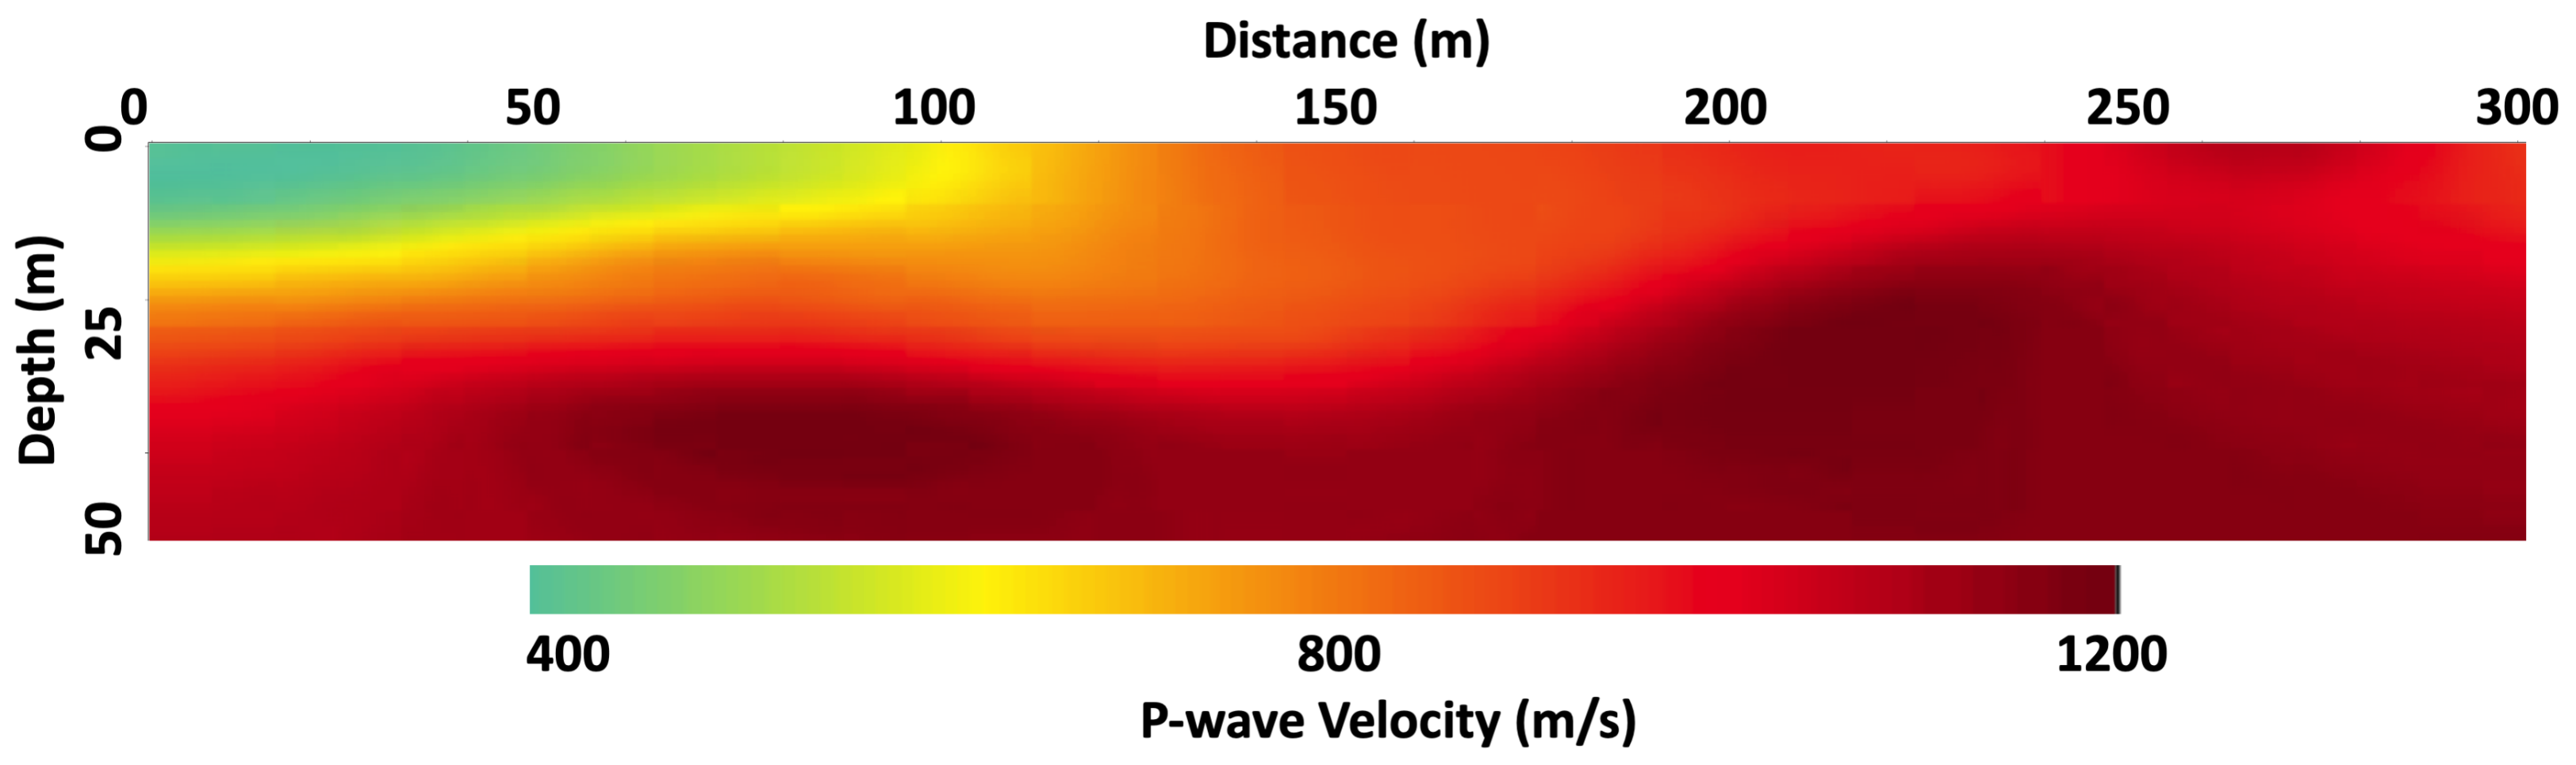
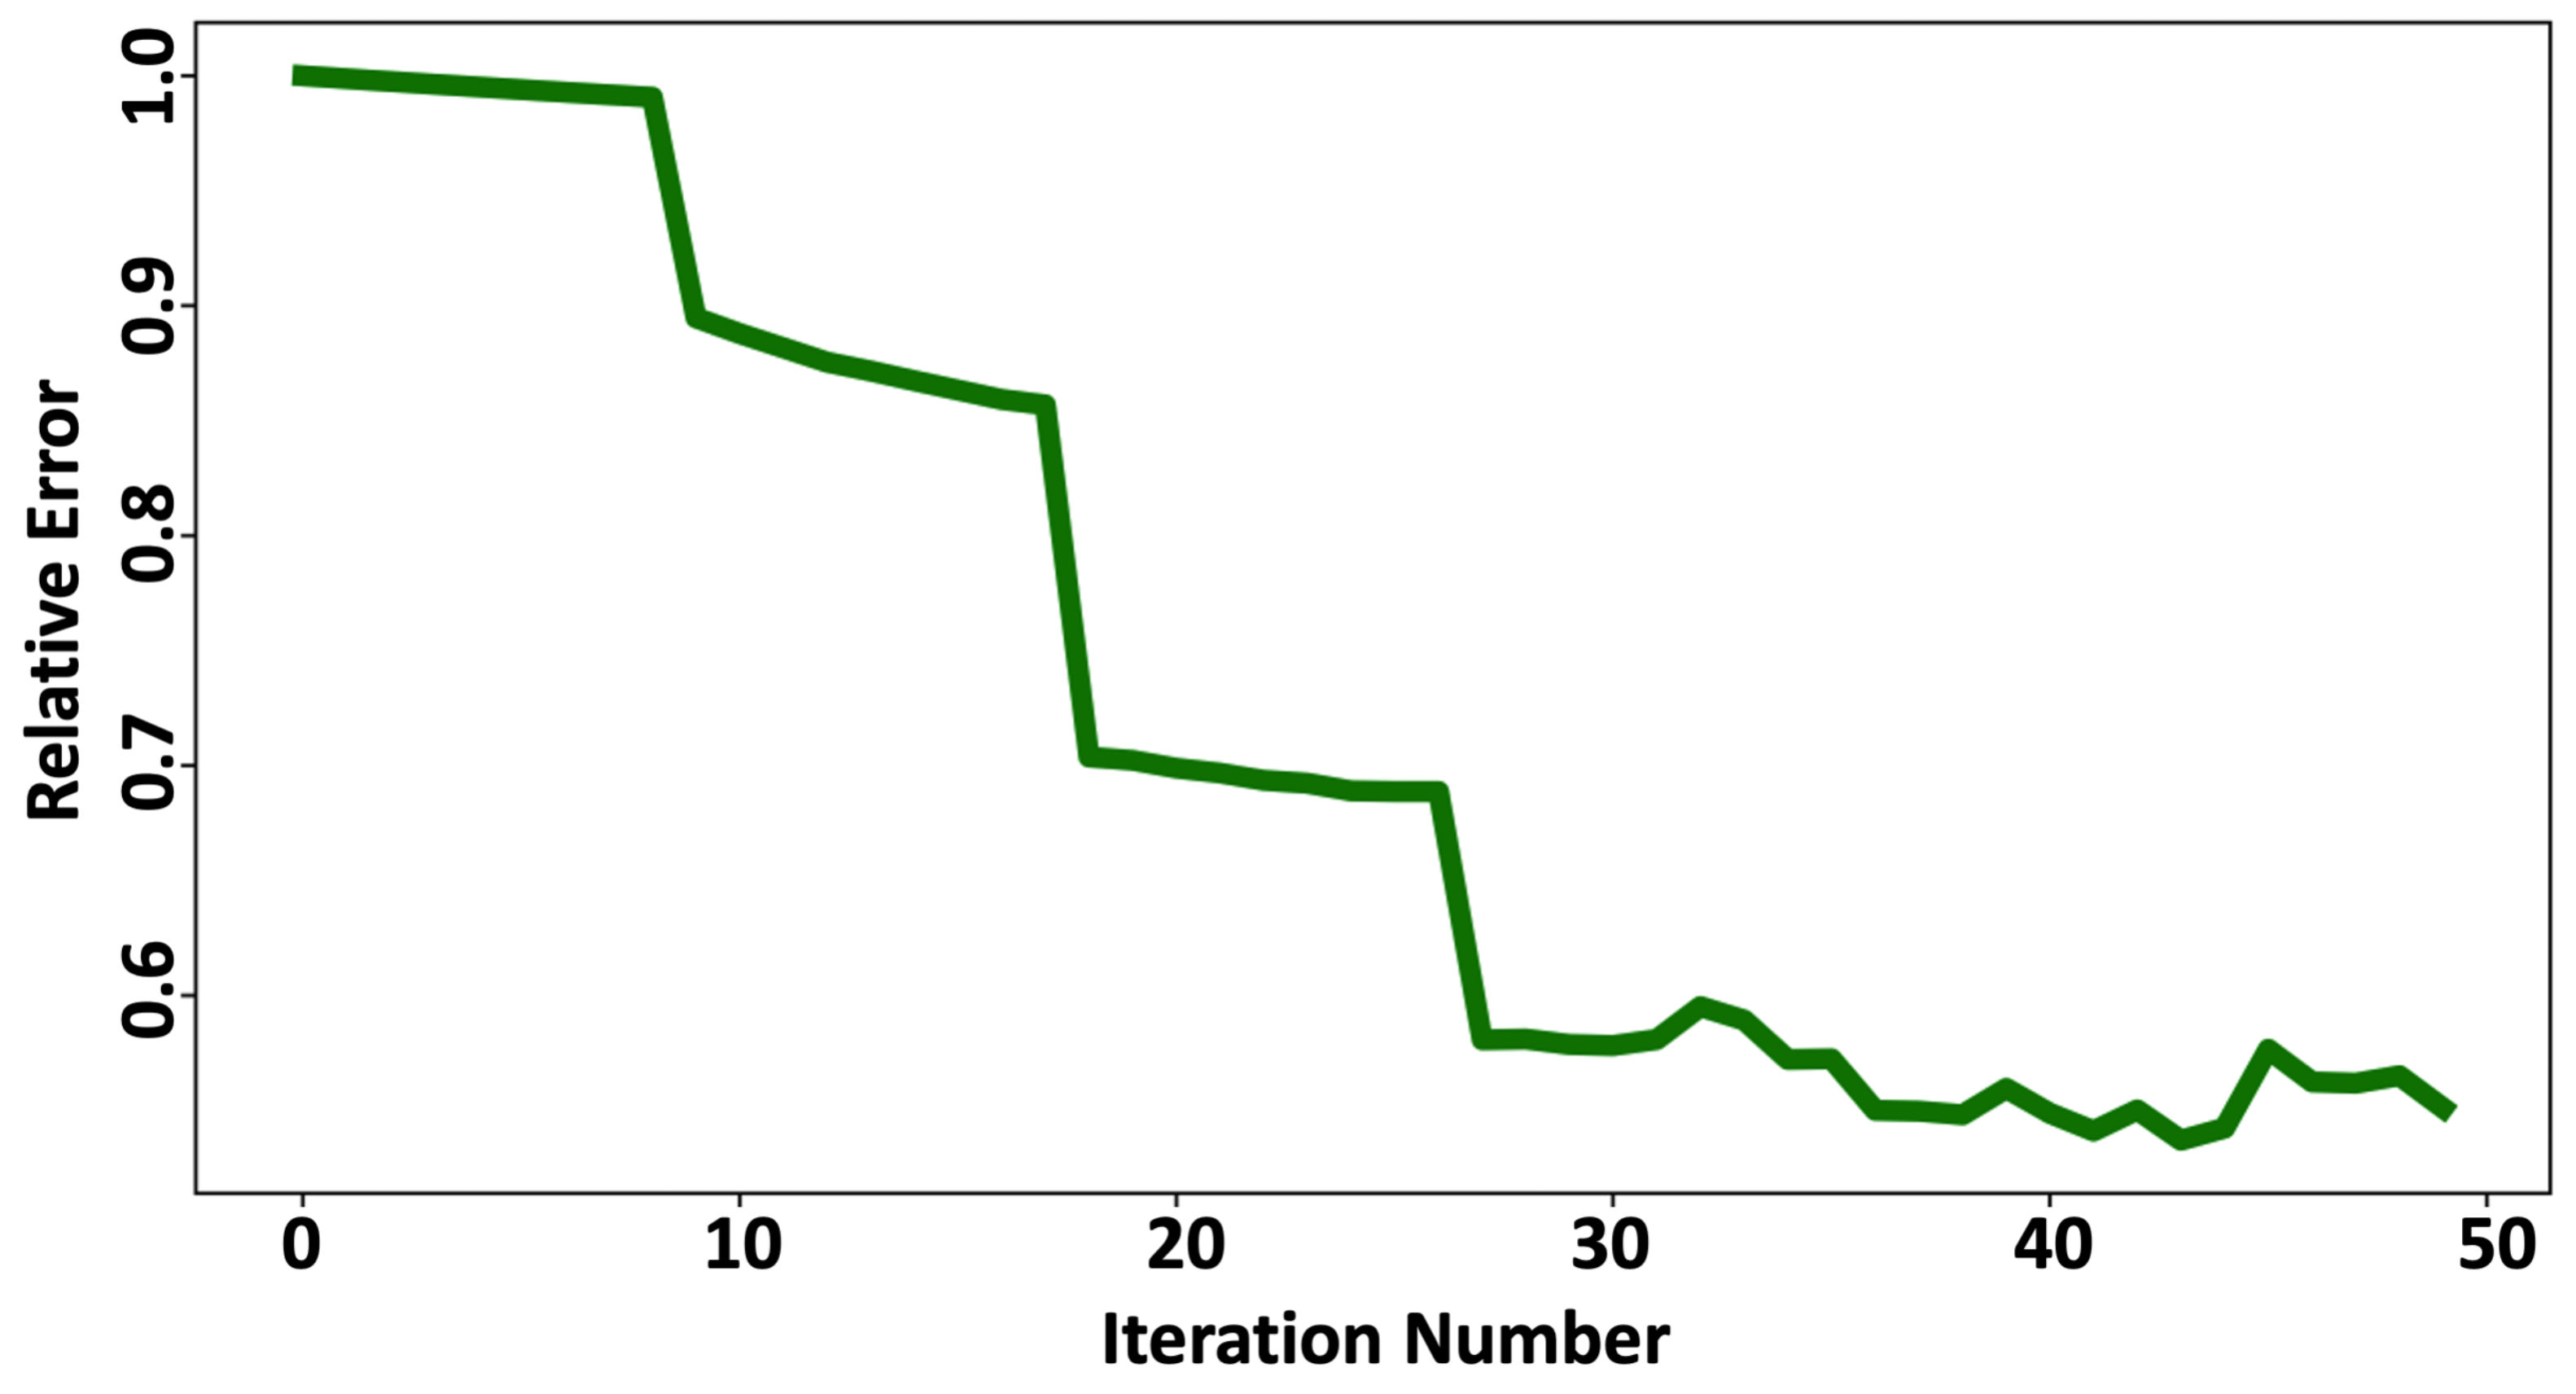
5. Elastic Full Waveform Inversion
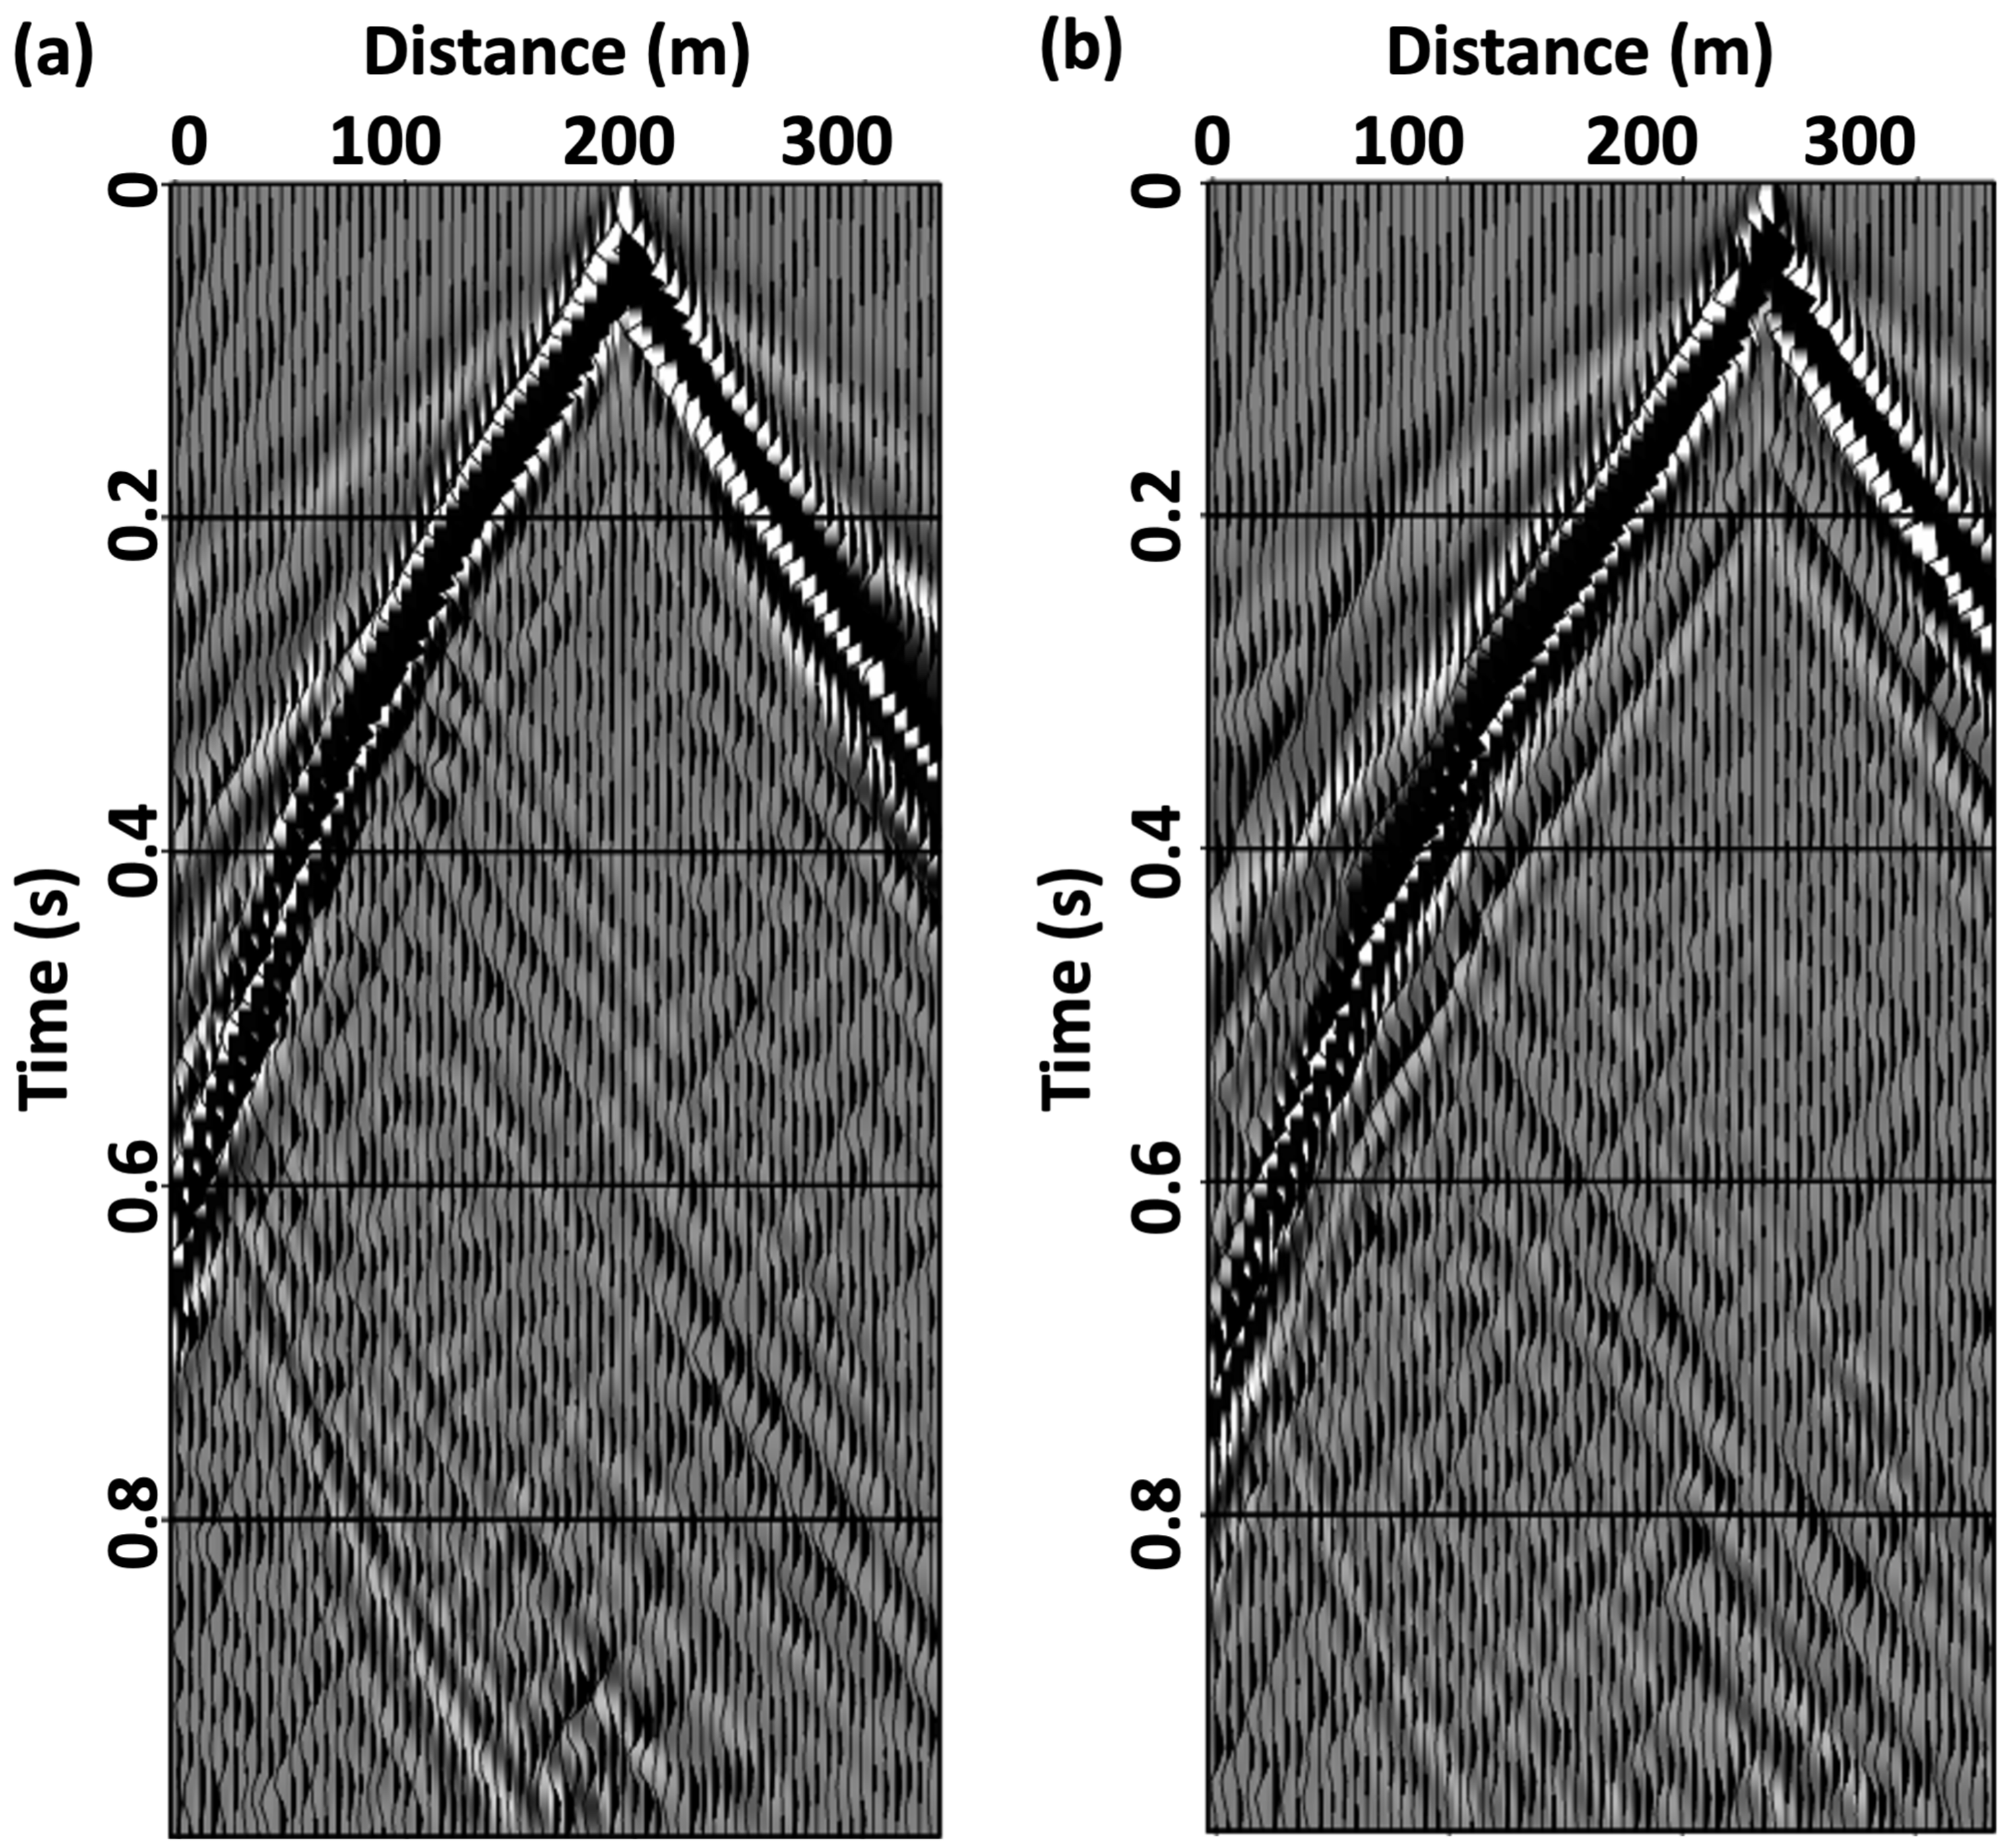
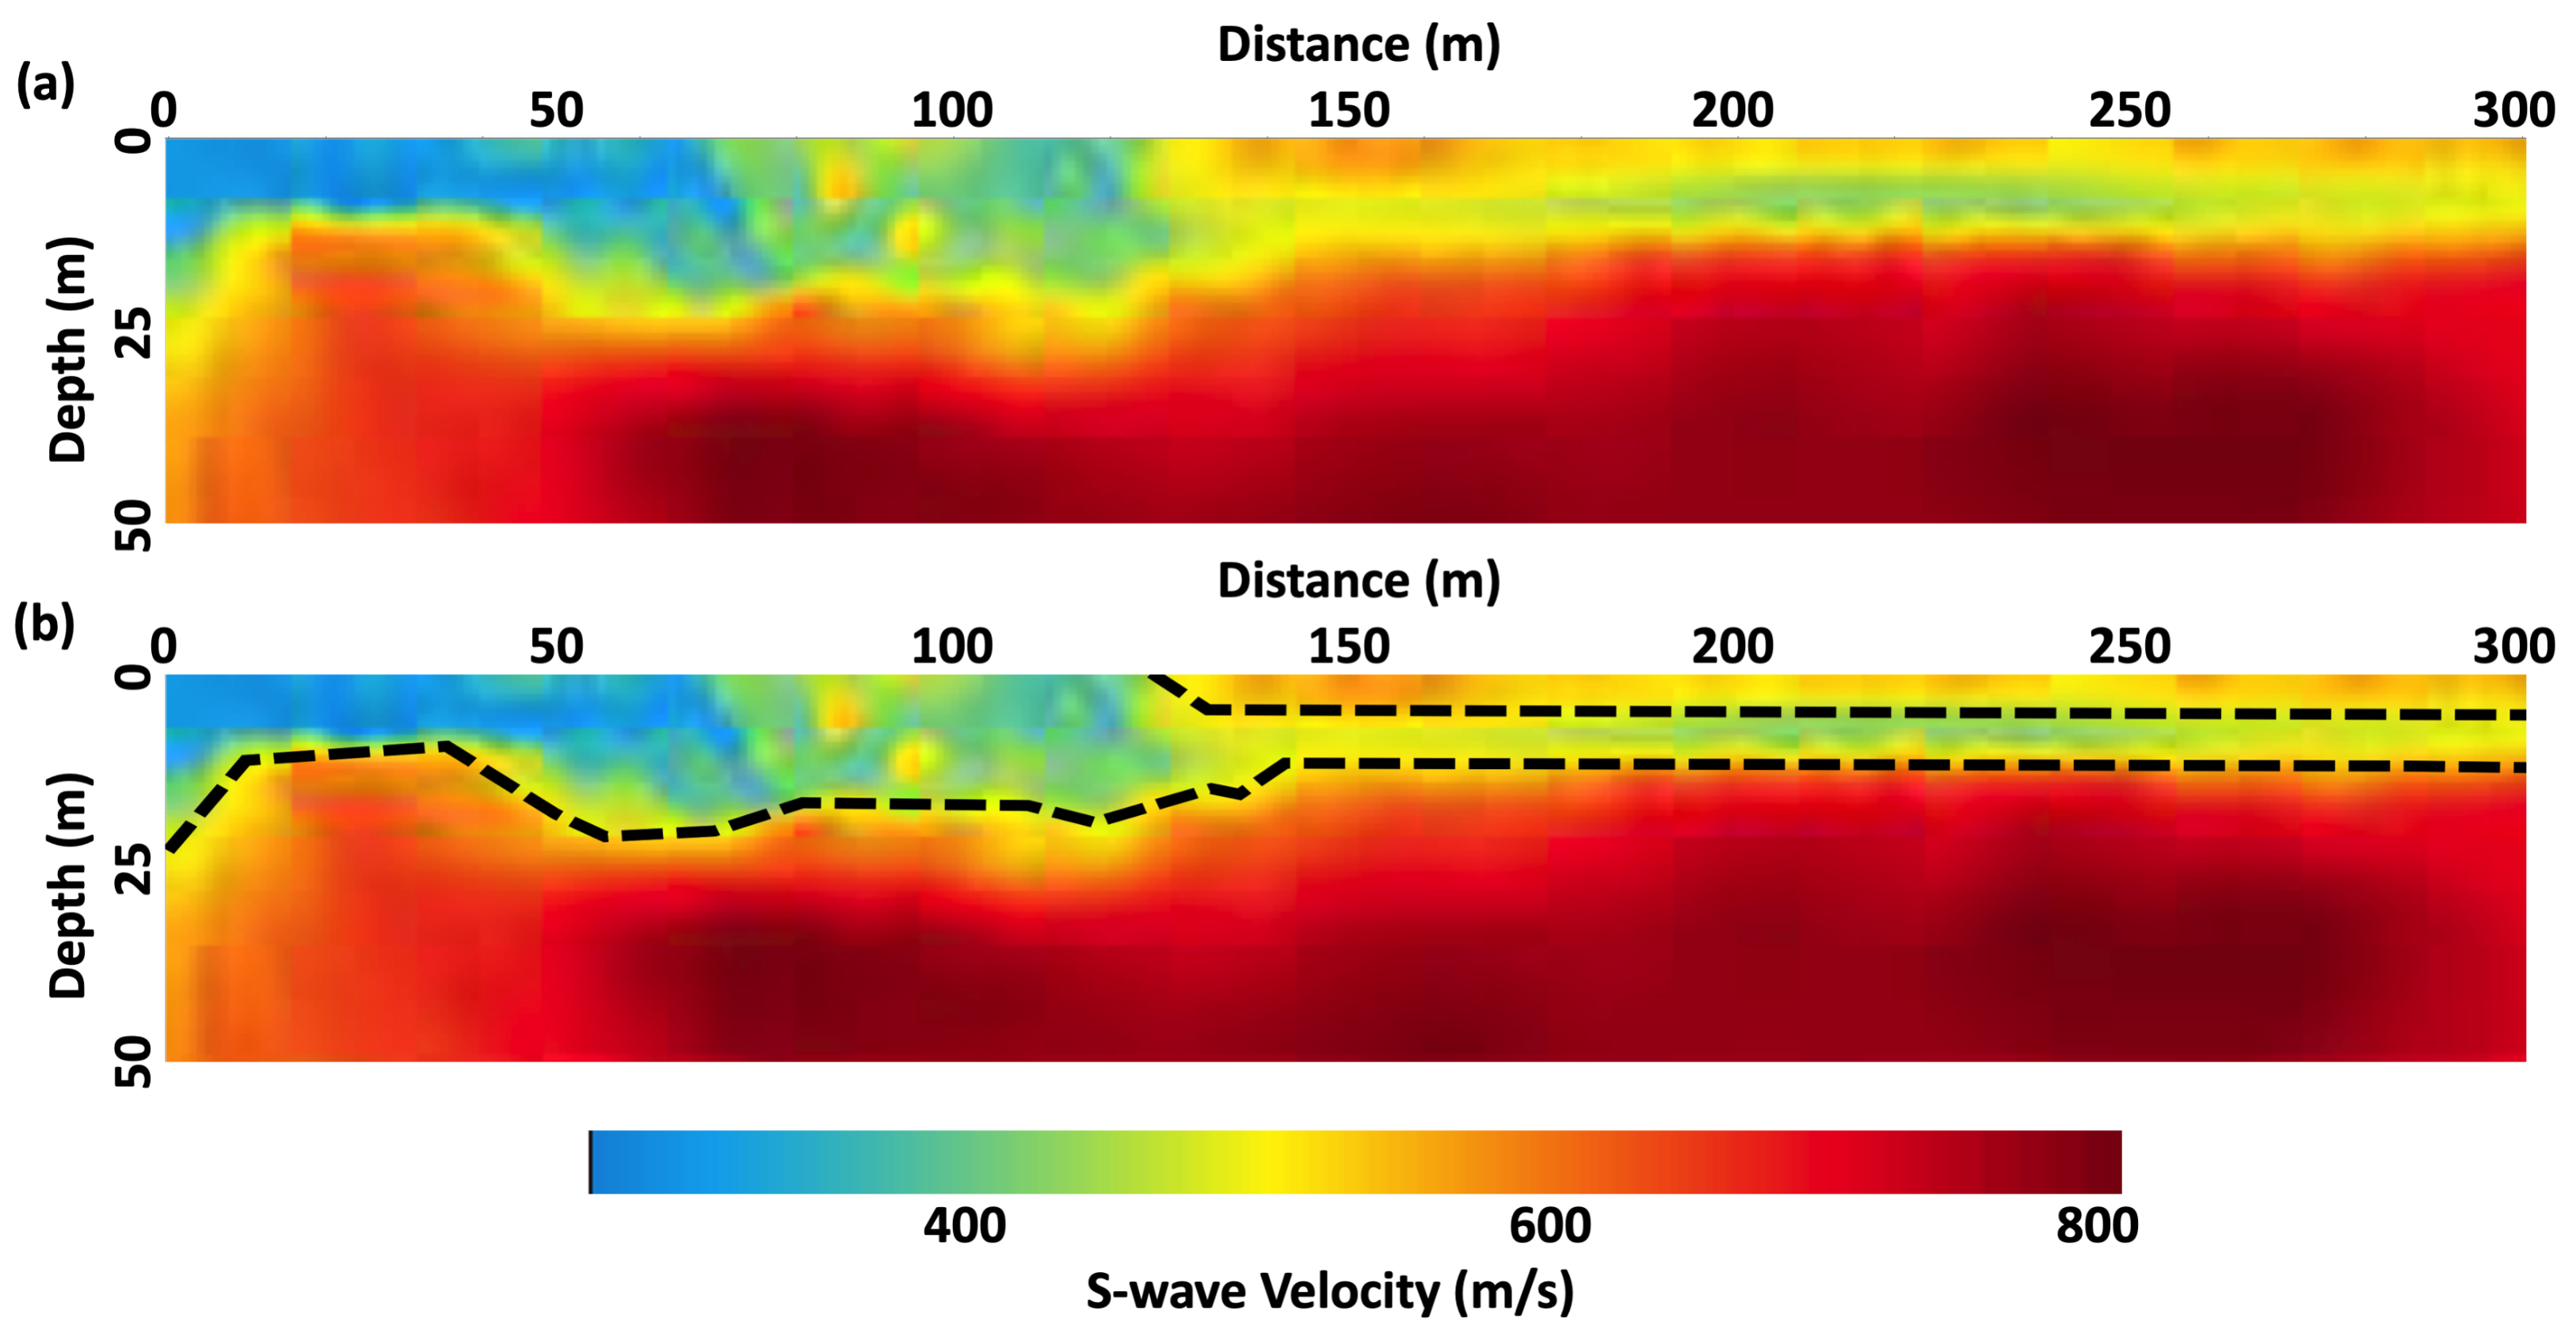
2D E-FWI on Majes I Field Data
6. Discussion
- HVSR uses ambient multicomponent seismic records to develop S-wave model constraint. While this approach requires a limited data set and is highly numerically efficient, it also is generates low-resolution 1D constraints though pseudo 2D sections can be estimated by interpolating the results of neighboring independent HVSR measurements.
- SASW uses single-component data from multiple receivers to characterize shallow S-wave profiles. While this approach also requires a limited data set and is highly numerically efficient, it is limited to 1D (or pseudo-2D) analyses and suffers from several limitations that arise due to seismic wavefields being comprised of more wavefield phases than the fundamental Rayleigh mode.
- MASW uses waveforms from a receiver array to address some of the issues arising in SASW; however, this approach requires additional acquisition resources and provides an spatially averaged 1D S-wave velocity profile beneath the array (though pseudo-2D sections can be generated).
- SH-SRT uses first-arrival energy generated by a SH-wave source and seismic data acquired on shear geophones to estimate a 2D S-wave velocity profile of somewhat low resolution. This approach requires additional acquisition resources, involves picking arrivals, and involves higher computational requirements.
- The SRT+FWI method reported herein uses geophone array data to develop a fully 2D high-resolution S-wave velocity model estimate. Compared to the four previous methods, though, this approach is significantly more computationally challenging, demands careful data preprocessing, requires reasonably accurate starting models, and is not guaranteed to converge to the global minimum.
Potential Research Opportunities
7. Conclusions
Author Contributions
Funding
Institutional Review Board Statement
Informed Consent Statement
Data Availability Statement
Acknowledgments
Conflicts of Interest
Abbreviations
| 2D | Two-dimensional |
| CSM | Colorado School of Mines |
| DAS | Distributed Acoustic Sensing |
| DC | Direct Current |
| E-FWI | Elastic full waveform inversion |
| E-TRI | Elastic time reverse imaging |
| HVSR | Horizontal-vertical spectral ratio |
| FWI | Full waveform inversion |
| MASW | Multichannel analysis of surface waves |
| P wave | Compressional wave |
| PML | Perfectly matched layer |
| SASW | Spectral analysis of surface waves |
| SH wave | Horizontal shear wave |
| S wave | Shear wave |
| SRT | Seismic refraction tomography |
| UNSA | Universidad Nacional de San Augstín |
References
- Fan, X.; Scaringi, G.; Korup, O.; West, A.J.; van Westen, C.J.; Tanyas, H.; Hovius, N.; Hales, T.C.; Jibson, R.W.; Allstadt, K.E.; et al. Earthquake-Induced Chains of Geologic Hazards: Patterns, Mechanisms, and Impacts. Rev. Geophys. 2019, 57, 421–503. [Google Scholar] [CrossRef]
- Tanyaş, H.; Görüm, T.; Kirschbaum, D.; Lombardo, L. Could road constructions be more hazardous than an earthquake in terms of mass movement? Nat. Hazards 2022, 112, 639–663. [Google Scholar] [CrossRef]
- Schuster, R.L.; Highland, L. Socioeconomic and Environmental Impacts of Landslides in the Western Hemisphere; US Department of the Interior, US Geological Survey: Denver, CO, USA, 2001. [Google Scholar]
- Guzzetti, F. Landslide Hazard and Risk Assessment. Ph.D. Thesis, Universitäts-und Landesbibliothek, Bonn, Germany, 2006. [Google Scholar]
- Van Westen, C.J.; Castellanos, E.; Kuriakose, S.L. Spatial data for landslide susceptibility, hazard, and vulnerability assessment: An overview. Eng. Geol. 2008, 102, 112–131. [Google Scholar] [CrossRef]
- Lepore, C.; Kamal, S.A.; Shanahan, P.; Bras, R.L. Rainfall-induced landslide susceptibility zonation of Puerto Rico. Environ. Earth Sci. 2012, 66, 1667–1681. [Google Scholar] [CrossRef]
- Zhang, Y.; Yang, J.; Yang, F. Field investigation and numerical analysis of landslide induced by tunneling. Eng. Fail. Anal. 2015, 47, 25–33. [Google Scholar] [CrossRef]
- Salmi, E.F.; Nazem, M.; Karakus, M. Numerical analysis of a large landslide induced by coal mining subsidence. Eng. Geol. 2017, 217, 141–152. [Google Scholar] [CrossRef]
- Lacroix, P.; Dehecq, A.; Taipe, E. Irrigation-triggered landslides in a Peruvian desert caused by modern intensive farming. Nat. Geosci. 2020, 13, 56–60. [Google Scholar] [CrossRef]
- Li, Y.; Wang, X.; Mao, H. Influence of human activity on landslide susceptibility development in the Three Gorges area. Nat. Hazards 2020, 104, 2115–2151. [Google Scholar] [CrossRef]
- Bogoslovsky, V.; Ogilvy, A. Geophysical methods for the investigation of landslides. Geophysics 1977, 42, 562–571. [Google Scholar] [CrossRef]
- Mahmood, K.; ur Rehman, Z.; Farooq, K.; Memon, S.A. One dimensional equivalent linear ground response analysis — A case study of collapsed Margalla Tower in Islamabad during 2005 Muzaffarabad Earthquake. J. Appl. Geophys. 2016, 130, 110–117. [Google Scholar] [CrossRef]
- Aleotti, P.; Chowdhury, R. Landslide hazard assessment: Summary review and new perspectives. Bull. Eng. Geol. Environ. 1999, 58, 21–44. [Google Scholar] [CrossRef]
- Jongmans, D.; Demanet, D.; Havenith, H.; Hemroulle, P. Application of 2D electrical and seismic tomography techniques for investigating landslide sites. In Proceedings of the 5th EEGS-ES Meeting, Budapest, Hungary, 6–9 September 1999; European Association of Geoscientists & Engineers: Utrecht, The Netherlands, 1999; p. cp–35. [Google Scholar]
- Pazzi, V.; Tanteri, L.; Bicocchi, G.; D’Ambrosio, M.; Caselli, A.; Fanti, R. H/V measurements as an effective tool for the reliable detection of landslide slip surfaces: Case studies of Castagnola (La Spezia, Italy) and Roccalbegna (Grosseto, Italy). Phys. Chem. Earth Parts A/B/C 2017, 98, 136–153. [Google Scholar] [CrossRef]
- Stucchi, E.; Tognarelli, A.; Ribolini, A. SH-wave seismic reflection at a landslide (Patigno, NW Italy) integrated with P-wave. J. Appl. Geophys. 2017, 146, 188–197. [Google Scholar] [CrossRef]
- Flamme, H.E.; Krahenbuhl, R.A.; Li, Y.; Dugan, B.; Shragge, J.; Graber, A.; Sirota, D.; Wilson, G.; Gonzales, E.; Ticona, J. Integrated geophysical investigation for understanding agriculturally induced landslides in southern Peru. Environ. Earth Sci. 2022, 81, 1–14. [Google Scholar] [CrossRef]
- Jongmans, D.; Garambois, S. Geophysical investigation of landslides: A review. Bull. Société Géologique Fr. 2007, 178, 101–112. [Google Scholar] [CrossRef]
- Ferrucci, F.; Amelio, M.; Sorriso-Valvo, M.; Tansi, C. Seismic prospecting of a slope affected by deep-seated gravitational slope deformation: The Lago Sackung, Calabria, Italy. Eng. Geol. 2000, 57, 53–64. [Google Scholar] [CrossRef]
- Bichler, A.; Bobrowsky, P.; Best, M.; Douma, M.; Hunter, J.; Calvert, T.; Burns, R. Three-dimensional mapping of a landslide using a multi-geophysical approach: The Quesnel Forks landslide. Landslides 2004, 1, 29–40. [Google Scholar] [CrossRef]
- Hack, R. Geophysics for slope stability. Surv. Geophys. 2000, 21, 423–448. [Google Scholar] [CrossRef]
- Uhlemann, S.; Hagedorn, S.; Dashwood, B.; Maurer, H.; Gunn, D.; Dijkstra, T.; Chambers, J. Landslide characterization using P-and S-wave seismic refraction tomography—The importance of elastic moduli. J. Appl. Geophys. 2016, 134, 64–76. [Google Scholar] [CrossRef]
- Wei, X.; Garcia-Chevesich, P.; Alejo, F.; García, V.; Martínez, G.; Daneshvar, F.; Bowling, L.C.; Gonzáles, E.; Krahenbuhl, R.; McCray, J.E. Hydrologic analysis of an intensively irrigated area in southern Peru using a crop-field scale framework. Water 2021, 13, 318. [Google Scholar] [CrossRef]
- Lacroix, P.; Araujo, G.; Hollingsworth, J.; Taipe, E. Self-Entrainment Motion of a Slow-Moving Landslide Inferred From Landsat-8 Time Series. J. Geophys. Res. Earth Surf. 2019, 124, 1201–1216. [Google Scholar] [CrossRef]
- Graber, A.; Santi, P.; Radach, K.; Meza Arestegui, P.; Chacon Arcaya, S. Finite element model calibration in the context of limited data and limited access: A case study from a large landslide in Southern Peru. In Proceedings of the 54th US Rock Mechanics/Geomechanics Symposium, Golden, CO, USA, 28 June–1 July 2020; OnePetro: Richardson, TX, USA, 2020. [Google Scholar]
- Graber, A.; Santi, P.; Meza Arestegui, P. Constraining the critical groundwater conditions for initiation of large, irrigation-induced landslides, Siguas River Valley, Peru. Landslides 2021, 18, 3753–3767. [Google Scholar] [CrossRef]
- Araujo Huamán, G.E.; Taipe Maquerhua, E.L.; Miranda Cruz, R.; Valderrama Murillo, P.A. Dinámica y Monitoreo del Deslizamiento de Siguas; Minero y Metalúrgico—INGEMMET, Informe Técnico, N∘ A6748; Región Arequipa, provincia Caylloma y Arequipa, distrito Majes y San Juan de Siguas, Instituto Geológico: San Juan de Siguas, Peru, 2017. [Google Scholar]
- Ronczka, M.; Hellman, K.; Günther, T.; Wisén, R.; Dahlin, T. Electric resistivity and seismic refraction tomography: A challenging joint underwater survey at Äspö Hard Rock Laboratory. Solid Earth 2017, 8, 671–682. [Google Scholar] [CrossRef]
- Moser, T. Shortest path calculation of seismic rays. Geophysics 1991, 56, 59–67. [Google Scholar] [CrossRef]
- Giroux, B.; Larouche, B. Task-parallel implementation of 3D shortest path raytracing for geophysical applications. Comput. Geosci. 2013, 54, 130–141. [Google Scholar] [CrossRef]
- Rücker, C.; Günther, T.; Wagner, F.M. pyGIMLi: An open-source library for modelling and inversion in geophysics. Comput. Geosci. 2017, 109, 106–123. [Google Scholar] [CrossRef]
- Guedes, V.J.C.B.; Maciel, S.T.R.; Rocha, M.P. Refrapy: A Python program for seismic refraction data analysis. Comput. Geosci. 2022, 159, 105020. [Google Scholar] [CrossRef]
- Mollaret, C.; Wagner, F.M.; Hilbich, C.; Scapozza, C.; Hauck, C. Petrophysical joint inversion applied to alpine permafrost field sites to image subsurface ice, water, air, and rock contents. Front. Earth Sci. 2020, 8, 85. [Google Scholar] [CrossRef]
- Virieux, J.; Operto, S. An overview of full-waveform inversion in exploration geophysics. Geophysics 2009, 74, WCC1–WCC26. [Google Scholar] [CrossRef]
- Robein, E. Seismic Imaging: A Review of the Techniques, their Principles, Merits and Limitations (EET 4); EAGE Publications: Houten, The Netherlands, 2010. [Google Scholar]
- Schuster, G.T. Seismic Inversion; Society of Exploration Geophysicists: Tulsa, OK, USA, 2017. [Google Scholar]
- Komatitsch, D.; Martin, R. An unsplit convolutional perfectly matched layer improved at grazing incidence for the seismic wave equation. Geophysics 2007, 72, SM155–SM167. [Google Scholar] [CrossRef]
- Gélis, C.; Virieux, J.; Grandjean, G. Two-dimensional elastic full waveform inversion using Born and Rytov formulations in the frequency domain. Geophys. J. Int. 2007, 168, 605–633. [Google Scholar] [CrossRef]
- Sears, T.J.; Singh, S.; Barton, P. Elastic full waveform inversion of multi-component OBC seismic data. Geophys. Prospect. 2008, 56, 843–862. [Google Scholar] [CrossRef]
- Mora, P. Nonlinear two-dimensional elastic inversion of multioffset seismic data. Geophysics 1988, 52, 1211–1228. [Google Scholar] [CrossRef]
- Tromp, J.; Tape, C.; Liu, Q. Seismic tomography, adjoint methods, time reversal and banana-doughnut kernels. Geophys. J. Int. 2005, 160, 195–216. [Google Scholar] [CrossRef]
- Köhn, D.; De Nil, D.; Kurzmann, A.; Przebindowska, A.; Bohlen, T. On the influence of model parametrization in elastic full waveform tomography. Geophys. J. Int. 2012, 191, 325–345. [Google Scholar] [CrossRef]
- Nocedal, J.; Wright, S.J. Quadratic programming. In Numerical Optimization; Springer: New York, NY, USA, 2006; pp. 448–492. [Google Scholar]
- Métivier, L.; Bretaudeau, F.; Brossier, R.; Operto, S.; Virieux, J. Full waveform inversion and the truncated Newton method: Quantitative imaging of complex subsurface structures. Geophys. Prospect. 2014, 62, 1353–1375. [Google Scholar] [CrossRef]
- Hu, W.; Chen, J.; Liu, J.; Abubakar, A. Retrieving low wavenumber information in FWI: An overview of the cycle-skipping phenomenon and solutions. IEEE Signal Process. Mag. 2018, 35, 132–141. [Google Scholar] [CrossRef]
- Bunks, C.; Saleck, F.M.; Zaleski, S.; Chavent, G. Multiscale seismic waveform inversion. Geophysics 1995, 60, 1457–1473. [Google Scholar] [CrossRef]
- Groos, L.; Schäfer, M.; Forbriger, T.; Bohlen, T. The role of attenuation in 2D full-waveform inversion of shallow-seismic body and Rayleigh waves. Geophysics 2014, 79, R247–R261. [Google Scholar] [CrossRef]
- Nakamura, Y. Method for dynamic characteristics estimation of subsurface using microtremor on the ground surface. Railw. Tech. Res. Inst. Q. Rep. 1989, 30, 25–33. [Google Scholar]
- Heisey, J.; Stokoe, K.; Meyer, A. Moduli of pavement systems from Spectral analysis of surface waves. Transp. Res. Rec. 1982, 852, 22–31. [Google Scholar]
- Park, C.B.; Miller, R.D.; Xia, J. Multichannel analysis of surface waves. Geophysics 1999, 64, 800–808. [Google Scholar] [CrossRef]
- Chen, J.; Zelt, C.; Jaiswal, P. Detecting a known near-surface target through application of frequency-dependent traveltime tomography and full-waveform inversion to P- and SH-wave seismic refraction data. Geophysics 2017, 82, R1–R17. [Google Scholar] [CrossRef]
- Grandjean, G.; Gourry, J.C.; Sanchez, O.; Bitri, A.; Garambois, S. Structural study of the Ballandaz landslide (French Alps) using geophysical imagery. J. Appl. Geophys. 2011, 75, 531–542. [Google Scholar] [CrossRef]


Disclaimer/Publisher’s Note: The statements, opinions and data contained in all publications are solely those of the individual author(s) and contributor(s) and not of MDPI and/or the editor(s). MDPI and/or the editor(s) disclaim responsibility for any injury to people or property resulting from any ideas, methods, instructions or products referred to in the content. |
© 2023 by the authors. Licensee MDPI, Basel, Switzerland. This article is an open access article distributed under the terms and conditions of the Creative Commons Attribution (CC BY) license (https://creativecommons.org/licenses/by/4.0/).
Share and Cite
Yang, J.; Shragge, J.; Girard, A.J.; Gonzales, E.; Ticona, J.; Minaya, A.; Krahenbuhl, R. Seismic Characterization of a Landslide Complex: A Case History from Majes, Peru. Sustainability 2023, 15, 13574. https://doi.org/10.3390/su151813574
Yang J, Shragge J, Girard AJ, Gonzales E, Ticona J, Minaya A, Krahenbuhl R. Seismic Characterization of a Landslide Complex: A Case History from Majes, Peru. Sustainability. 2023; 15(18):13574. https://doi.org/10.3390/su151813574
Chicago/Turabian StyleYang, Jihyun, Jeffrey Shragge, Aaron J. Girard, Edgard Gonzales, Javier Ticona, Armando Minaya, and Richard Krahenbuhl. 2023. "Seismic Characterization of a Landslide Complex: A Case History from Majes, Peru" Sustainability 15, no. 18: 13574. https://doi.org/10.3390/su151813574
APA StyleYang, J., Shragge, J., Girard, A. J., Gonzales, E., Ticona, J., Minaya, A., & Krahenbuhl, R. (2023). Seismic Characterization of a Landslide Complex: A Case History from Majes, Peru. Sustainability, 15(18), 13574. https://doi.org/10.3390/su151813574