


The COVID-19 Pandemic and the Implementation of Sustainable Development Goals: The EU Perspective


Abstract
:1. Introduction
- How much time is needed to achieve the different SDGs targets in the EU?
- Has it shortened during the pandemic period or lengthened, and by how much?
- Which targets are challenging for the EU to achieve, and which ones are safe?
2. Literature Review
3. Materials and Methods
- the long-term trend, which covers the indicator change over the last 15 years, before and after the pandemic (usually 2005–2019, 2005–2021/2022). For shorter time series, we calculate the long-term trend if data were available for at least 10 successive years (usually 2010–2019, 2010–2021). In a few exceptional cases, we calculate the long-term trend for shorter time periods (2012/2013–2019, 2012/2013–2021),
- the short-term trend, which covers the indicator change during the last five years, before and after the pandemic (usually 2015–2019, 2015–2021/2022).
- t0 = base year,
- t = 2019 and most recent year,
- = indicator value in base year (2010, 2015; see Appendix A—first year in short- and long-term period),
- yt = indicator value in 2019 and most recent year (2020, 2021, 2022),
- y2030 = target value in target year (2030).
- t0 = base year,
- 2030 = target year,
- R = observed annual growth year,
- = indicator value in base year (2019, 2021),
- y2030 = target value in target year.
4. Results
- Group A—SDGs that are highly likely to be achievable by 2030 (the number of years needed to meet the target, based on the long-term trend from 2010–2022, is less than 8; there is small or hardly any risk),
- Group B—SDGs that are difficult to achieve by 2030, but with additional effort can be achieved within the target timeframe (the number of years needed to meet the target, based on the long-term trend from 2010–2022, is higher than 8 but lower than 20; medium risk),
- Group C—SDGs that are at high risk of being met and are likely to be impossible to achieve by 2030 (the number of years needed to meet the target, based on the long-term trend from 2010–2022, is higher than 21; significant risk).
5. Discussion
6. Conclusions
Author Contributions
Funding
Institutional Review Board Statement
Informed Consent Statement
Data Availability Statement
Conflicts of Interest
Appendix A

| Sustainable Development Goals | Description of the Goals | 5Ps | Indicators per Goal | Selected Indicators, of Which in UN List | EU SDGs Indicators with Quantitative Target |
|---|---|---|---|---|---|
| 1. No poverty | End poverty in all its forms everywhere | People | 6 | 5 | 1 |
| 2. Zero hunger | End hunger, achieve food security and improved nutrition and promote sustainable agriculture | People | 5 | 1 | 2 |
| 3. Good health and well-being | Ensure healthy lives and promote well-being for all at all ages | People | 6 | 3 | 2 |
| 4. Quality education | Ensure inclusive and equitable quality education and promote lifelong learning opportunities for all | People | 6 | 5 | 5 |
| 5. Gender equality | Achieve gender equality and empower all women and girls | People | 6 | 5 | 1 |
| 6. Clean water and sanitation | Ensure availability and sustainable management of water and sanitation for all | People | 6 | 5 | - |
| 7. Affordable and clean energy | Ensure access to affordable, reliable, sustainable and modern energy for all | Prosperity | 6 | 3 | 2 |
| 8. Decent work and economic growth | Promote sustained, inclusive and sustainable economic growth, full and productive employment and decent work for all | Prosperity | 6 | 4 | 2 |
| 9. Industry, innovation and infrastructure | Build resilient infrastructure, promote inclusive and sustainable industrialization and foster innovation | Prosperity | 6 | 5 | 3 |
| 10. Reduced inequalities | Reduce inequality within and among countries | Prosperity | 6 | 4 | - |
| 11. Sustainable cities and communities | Make cities and human settlements inclusive, safe, resilient and sustainable | Planet | 6 | 5 | 3 |
| 12. Responsible consumption and production | Ensure sustainable consumption and production patterns | Planet | 6 | 2 | 2 |
| 13. Climate action | Take urgent action to combat climate change and its impacts | Planet | 5 | 3 | 3 |
| 14. Life below water | Conserve and sustainably use the oceans, seas and marine resources for sustainable development | Planet | 6 | 4 | 1 |
| 15. Life on land | Protect, restore and promote sustainable use of terrestrial ecosystems, sustainably manage forests, combat desertification and halt and reverse land degradation and halt biodiversity loss | Planet | 6 | 5 | 1 |
| 16. Peace, justice and strong institutions | Promote peaceful and inclusive societies for sustainable development, provide access to justice for all and build effective, accountable and inclusive institutions at all levels | Peace | 6 | 5 | - |
| 17. Partnerships for the goals | Strengthen the means of implementation and revitalize the global partnership for sustainable development | Partnership | 6 | 4 | 2 |
| Total | 100 | 68 | 23 * |
| No. of the SDG | Indicator | Target | Target for 2030 | Oldest Data | Most Recent Data | Long-Term Trend (Pre- and Post-COVID-19) | Short-Term Trend (Pre- and Post-COVID-19) |
|---|---|---|---|---|---|---|---|
| SDG 1 | People at risk of poverty or social exclusion | Reduce the number of people at risk of poverty or social exclusion by 15 million by 2030, including at least 5 million children | 72.2 million | 2010 (from previous reports) | 2022 | 2010–2019 2010–2022 | 2015–2019 2015–2020 2015–2022 |
| Children (<18 years old) at risk of poverty or social exclusion | 13.4 million | 2015 | 2022 | x | |||
| SDG 2 | Area under organic farming | At least 25% of the EU’s agricultural land should be under organic farming by 2030 | 25% | 2012 | 2020 | 2012–2019 2012–2020 | 2015–2019 2015–2020 |
| SDG 3, SDG 11 | Premature deaths due to exposure to fine particulate matter (PM2.5) | Reduce the health impacts of air pollution by at least 55% by 2030 | 194,021 pers. | 2005 | 2020 | 2010–2019 2010–2020 | 2015–2019 2015–2020 |
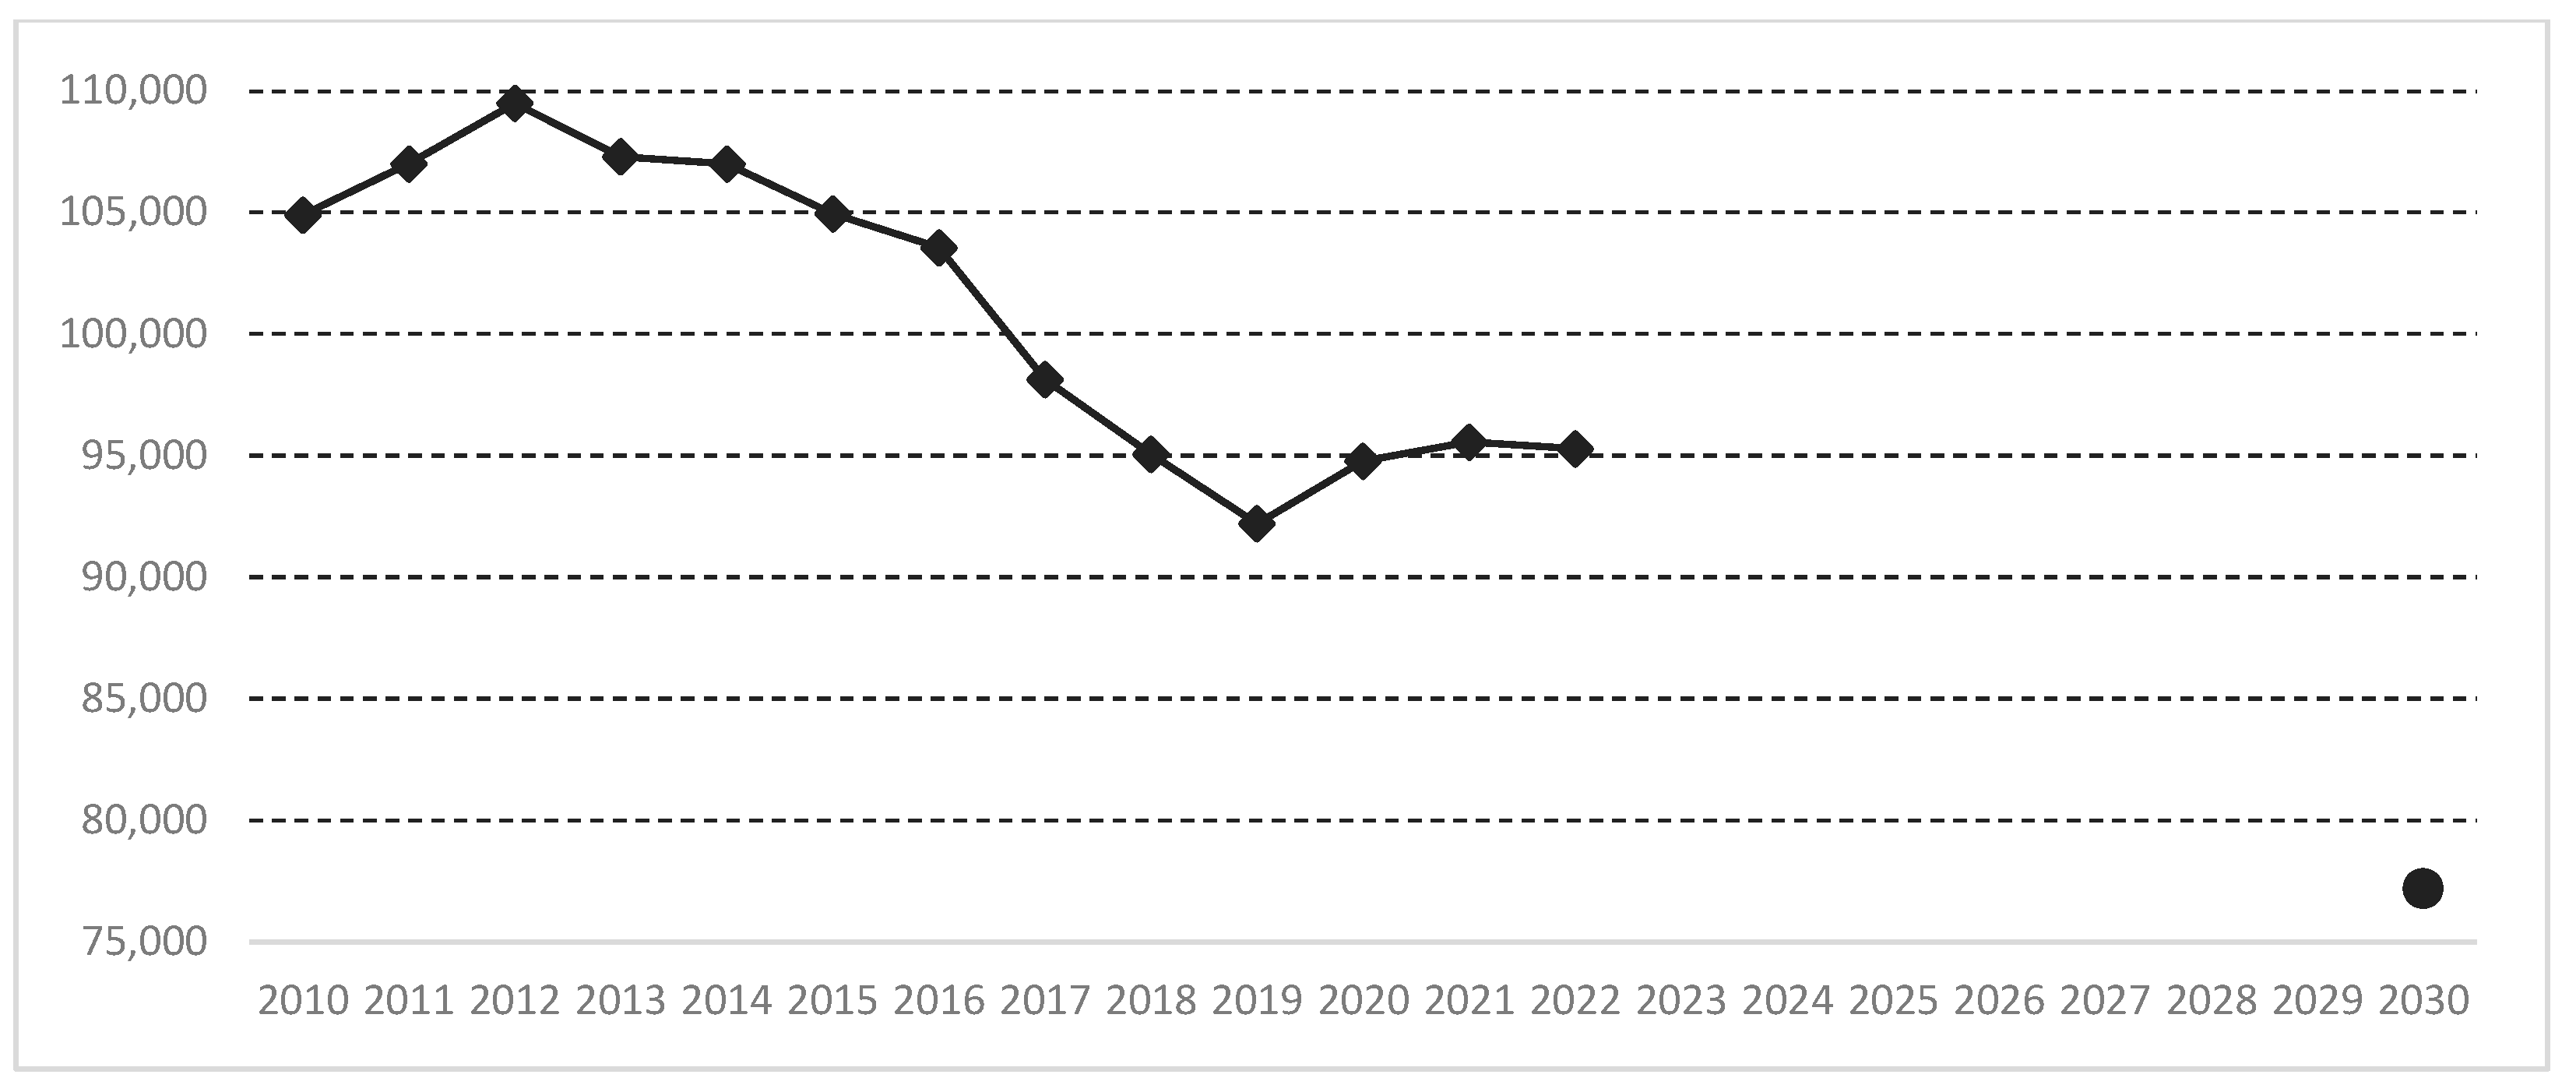
| People killed in road crashes | Halving the overall number of road deaths in the EU by 2030 starting from 2019 | 11,378 pers. | 2000 | 2021 | 2010–2019 2010–2021 | 2015–2019 2015–2021 | |
| SDG 4, | Low achievers in reading, maths and science | The share of low-achieving 15-year-olds in reading, mathematics and science should be less than 15% by 2030 | 15% | 2006 (every 3 years) | 2018 | 2006–2018 | 2015–2018 |
| Participation in early childhood education | At least 96% of children between 3 years old and the starting age for compulsory primary education should participate in early childhood education and care by 2030 | >96% | 2013 | 2021 | 2013–2019 2013–2021 | 2015–2019 2015–2021 | |
| Early leavers from education and training | The share of early leavers from education and training should be less than 9% by 2030 | <9% | 2002 | 2022 | 2005–2019 2005–2022 | 2015–2019 2015–2022 | |
| Share of adults having at least basic digital skills | Due to a major methodological change in 2021, the time series for the revised indicator starts in 2021 | >80% | 2021 | 2021 | x | x | |
| SDG 4, SDG 9 | Tertiary educational attainment | The share of 25 to 34 year olds with tertiary educational attainment should be at least 45% by 2030 | >45% | 2002 | 2022 | 2005–2019 2005–2022 | 2015–2019 2015–2022 |
| SDG 5 | Gender employment gap | Halve the gender employment gap by 2030 compared with 2019 | 5.6 percentage points | 2009 | 2022 | 2009–2019 2009–2022 | 2015–2019 2015–2022 |
| SDG 7 | Primary energy consumption | Reduce final energy consumption of at least 11.7% in 2030 compared with the energy consumption forecasts for 2030 made in 2020; for monitoring purposes, this was translated into absolute levels of primary and final energy consumption | 993 Mtoe | 2000 | 2021 | 2010–2019 2010–2021 | 2015–2019 2015–2021 |
| Final energy consumption | 763 Mtoe | 2000 | 2021 | 2010–2019 2010–2021 | 2015–2019 2015–2021 | ||
| SDG 7, SDG 13 | Share of renewable energy in gross final energy consumption | Raise the share of renewable energy in the EU’s overall energy consumption to 42.5% by 2030 (with an additional 2.5% indicative top up that would allow to reach 45%) | 42.5% | 2004 | 2021 | 2010–2019 2010–2021 | 2015–2019 2015–2021 |
| SDG 8 | Young people neither in employment nor in education and training (NEET) | Decrease the rate of young people neither in employment nor in education or training (NEETs) aged 15 to 29 to 9% by 2030 | 9% | 2009 | 2022 | 2009–2019 2009–2022 | 2015–2019 2015–2022 |
| Employment rate | At least 78% of the population aged 20 to 64 should be in employment by 2030 | >78% | 2009 | 2022 | 2009–2019 2009–2022 | 2015–2019 2015–2022 | |
| SDG 9 | Gross domestic expenditure on R&D | Increase combined public and private investment in R&D to 3% of GDP | 3% of GDP | 2000 | 2021 | 2010–2019 2010–2021 | 2015–2019 2015–2021 |
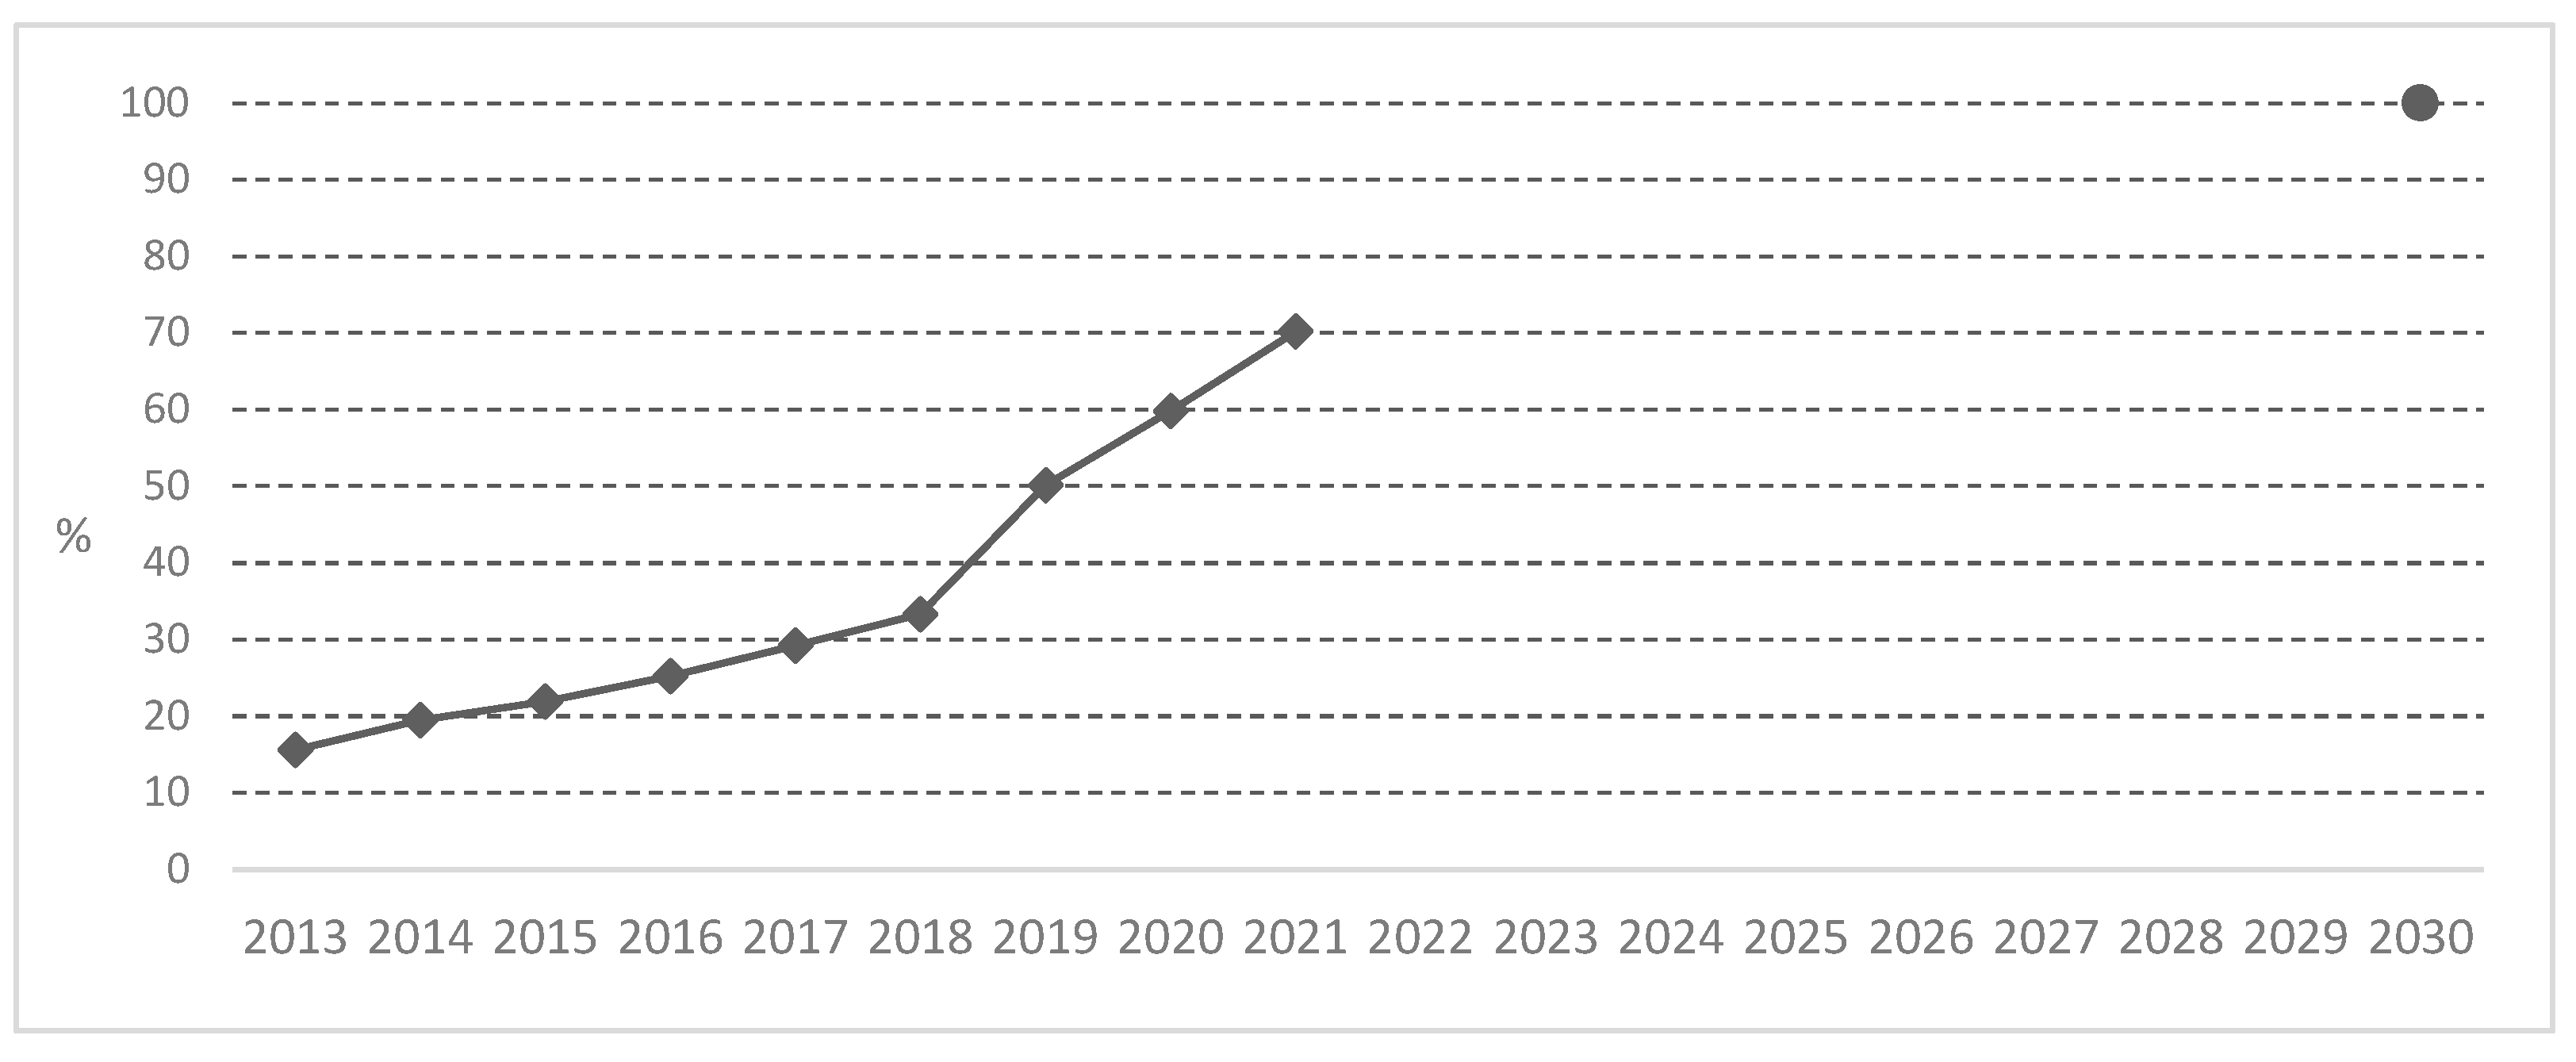
| SDG 9, SDG 17 | Share of households with highspeed internet connection | By 2030, all European households should be covered by a gigabit network | 100% households | 2013 | 2021 | 2013–2019 2013–2021 | 2015–2019 2015–2021 |
| SDG 11 | Recycling rate of municipal waste | Increase the preparing for reuse and the recycling of municipal waste to a minimum of 60% by weight by 2030 | 60% | 2000 | 2021 | 2010–2019 2010–2021 | 2015–2019 2015–2021 |
| SDG 12 | Average CO2 emissions per km from new passenger cars | Reduce by at least 55% by 2030 (compared to 2021) | 49.4 g CO2 per km | 2007 | 2021 (break in time series, provisional) | 2010–2019 2010–2021 | 2015–2019 2015–2021 |
| Circular material use rate | Double the EU’s circular material use rate until 2030 | 23.4% of material input for domestic use | 2004 | 2021 (provisional) | 2010–2019 2010–2021 | 2015–2019 2015–2021 | |
| SDG 13 | Net greenhouse gas emissions | Reduce net greenhouse gas emissions by 55% until 2030 compared to 1990 | 45% of 1990 | 2000 | 2021 | 2010–2019 2010–2021 | 2015–2019 2015–2021 |
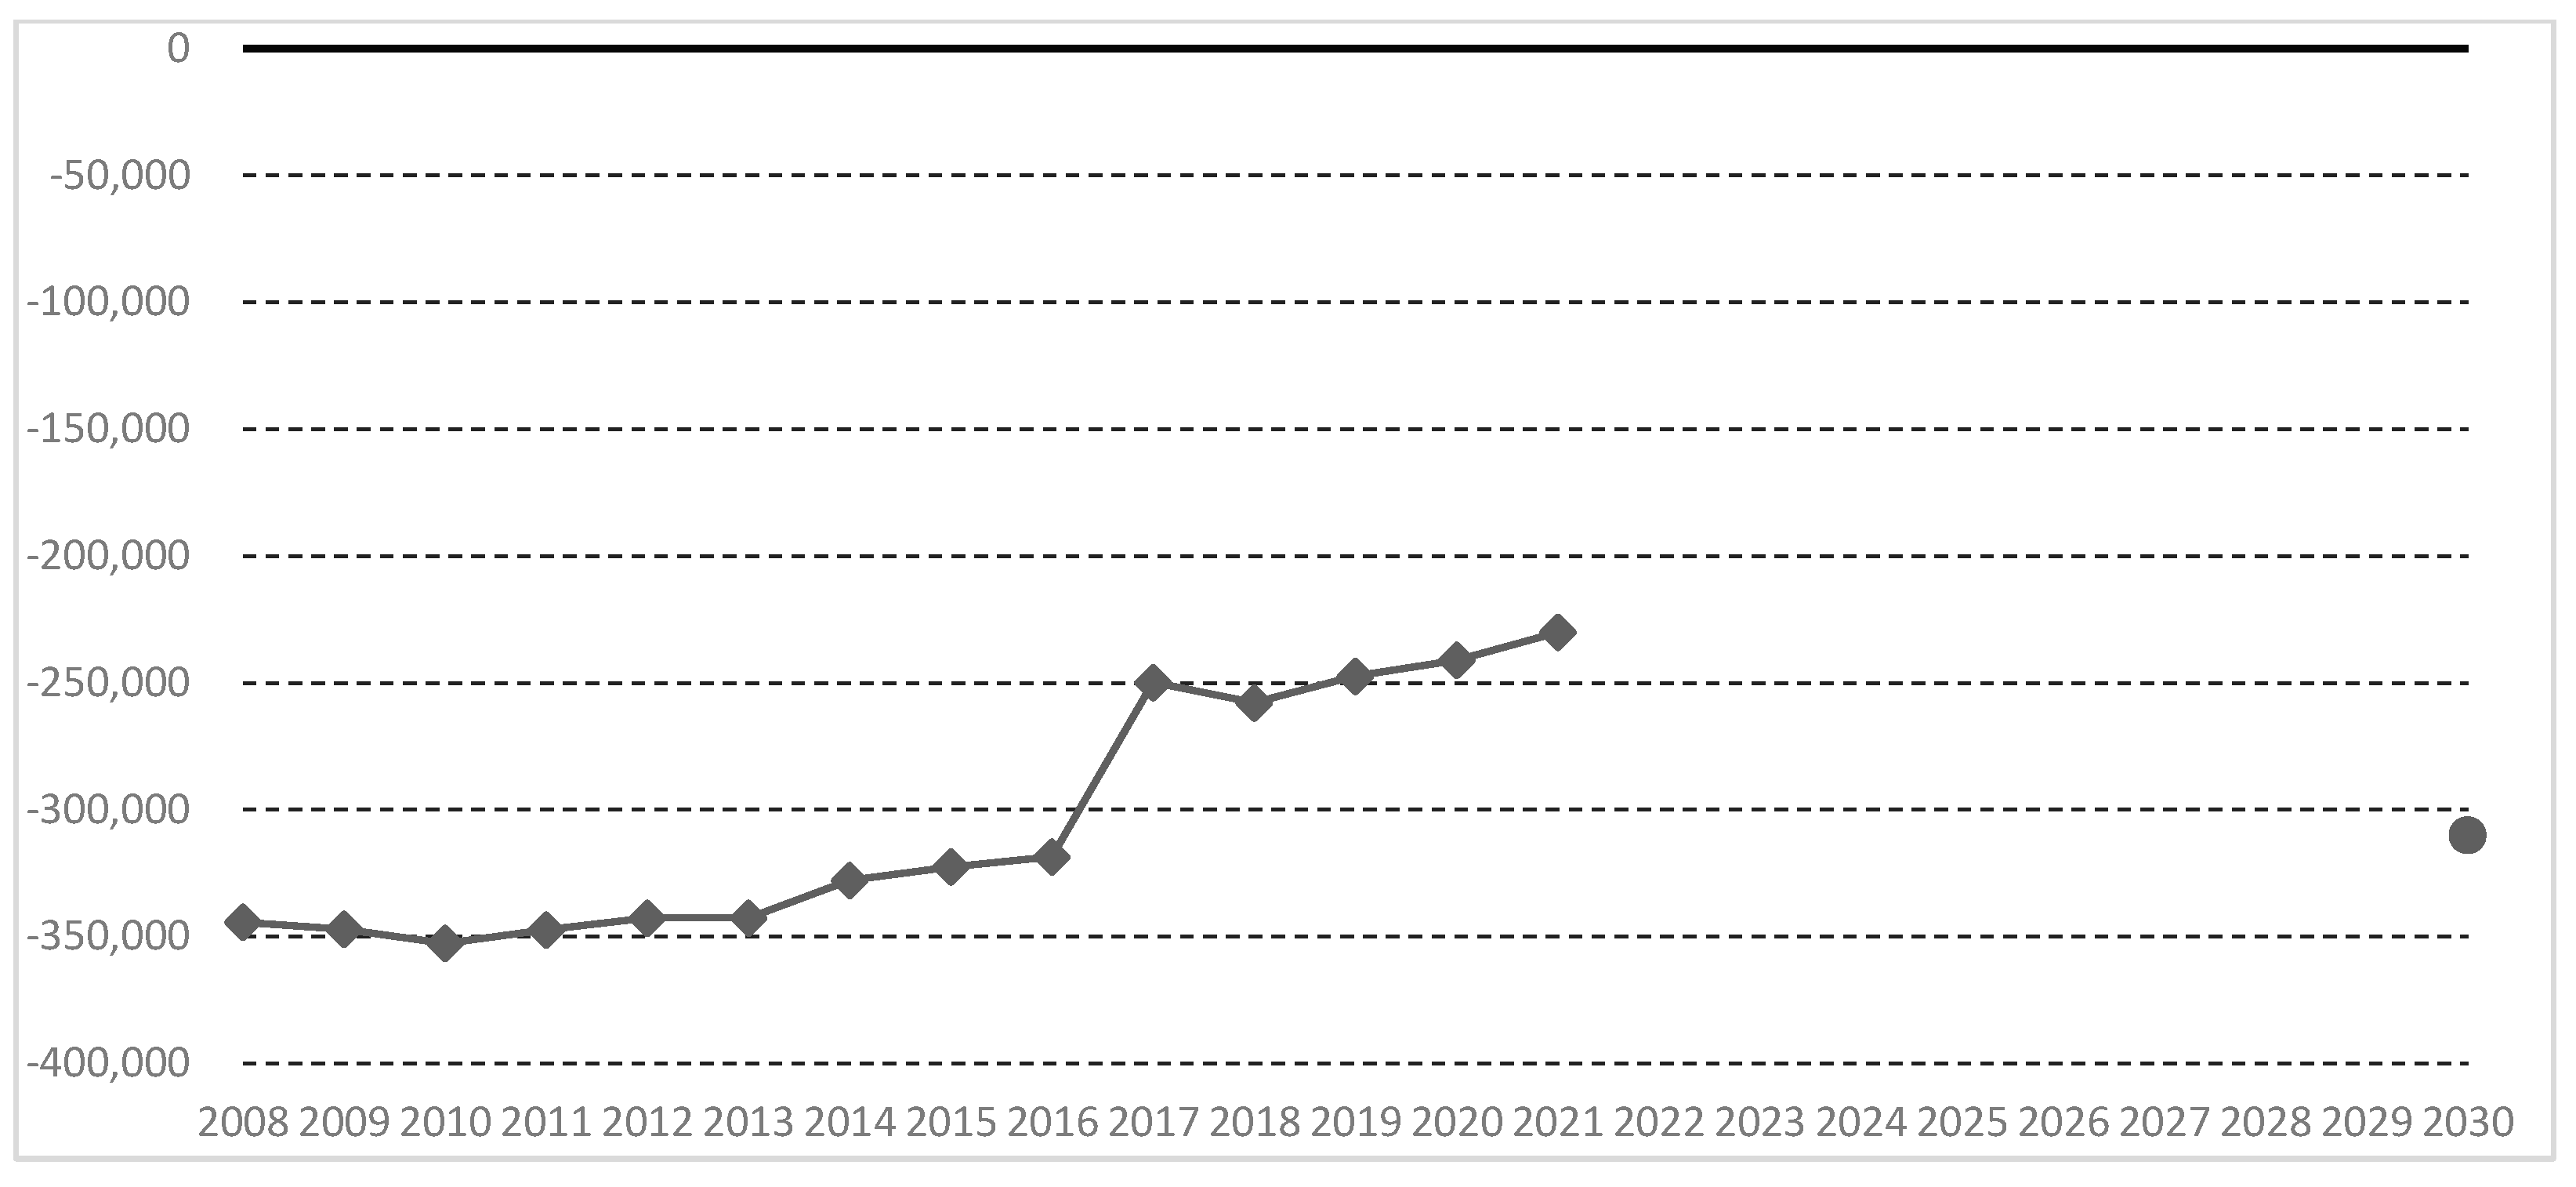
| Net greenhouse gas emissions from land use, land use change and forestry (LULUCF) | Net greenhouse gas removals in the LULUCF sector should reach 310 million tonnes of CO2 equivalent by 2030 | −310 million tonnes of CO2 equivalent | 2000 | 2021 | 2010–2019 2010–2021 | 2015–2019 2015–2021 | |
| SDG 14 | Marine protected areas | Protect a minimum of 30% of the EU’s sea area by 2030 | 30% of the EU’s sea area | 2012 (every 3+ years) | 2021 | 2012–2019 2012–2021 | 2015–2019 2015–2021 |
| SDG 15 | Terrestrial protected areas | Protect a minimum of 30% of the EU’s land area by 2030 | 30% of the EU’s land area | 2013 | 2021 | 2013–2019 2013–2021 | 2015–2019 2015–2021 |
| SDG 17 | Official development assistance | Provide 0.7% of gross national income (GNI) as ODA within the timeframe of the 2030 Agenda | 0.7% of GNI | 2000 | 2021 | 2010–2019 2010–2021 | 2015–2019 2015–2021 |
References
- Banerjee, A.; Duflo, E. Poor Economics: A Radical Rethinking of the Way to Fight Global Poverty; Public Affairs: New York, NY, USA, 2011; 320p. [Google Scholar]
- Transforming Our World: The 2030 Agenda for Sustainable Development; Outcome Document for the UN Summit to Adopt the Post-2015 Development Agenda: Draft for Adoption; United Nations: New York, NY, USA, 2015; A/RES/70/1.
- The Millennium Development Goals Report; United Nations: New York, NY, USA, 2000.
- European Commission; Statistical Office of the European Union. Sustainable Development in the European Union: Monitoring Report on Progress towards the SDGs in an EU Context: 2023 Edition, 7th ed.; Publications Office: Luxembourg, 2023. [Google Scholar]
- European Commission; Statistical Office of the European Union. Sustainable Development in the European Union: Statistical Annex to the EU Voluntary Review: 2023 Edition; Publications Office: Luxembourg, 2023. [Google Scholar]
- Boto-Álvarez, A.; García-Fernández, R. Implementation of the 2030 Agenda Sustainable Development Goals in Spain. Sustainability 2020, 12, 2546. [Google Scholar] [CrossRef]
- Raszkowski, A.; Bartniczak, B. On the Road to Sustainability: Implementation of the 2030 Agenda Sustainable Development Goals (SDG) in Poland. Sustainability 2019, 11, 366. [Google Scholar] [CrossRef]
- Wang, Q.; Huang, R. The Impact of COVID-19 Pandemic on Sustainable Development Goals—A Survey. Environ. Res. 2021, 202, 111637. [Google Scholar] [CrossRef]
- Burksiene, V.; Dvorak, J.; Burbulyte-Tsiskarishvili, G. Sustainability and Sustainability Marketing in Competing for the Title of European Capital of Culture. Organizacija 2018, 51, 66–78. [Google Scholar] [CrossRef]
- Yuan, H.; Wang, X.; Gao, L.; Wang, T.; Liu, B.; Fang, D.; Gao, Y. Progress towards the Sustainable Development Goals Has Been Slowed by Indirect Effects of the COVID-19 Pandemic. Commun. Earth Environ. 2023, 4, 184. [Google Scholar] [CrossRef]
- Sachs, J.; Kroll, C.; Lafortune, G.; Fuller, G.; Woelm, F. Sustainable Development Report 2022, 1st ed.; Cambridge University Press: Cambridge, UK, 2022; ISBN 978-1-00-921005-8. [Google Scholar]
- Thornton, J. COVID-19 Pandemic Has Derailed Progress on Sustainable Development Goals, Says WHO. BMJ 2020, 369, m1969. [Google Scholar] [CrossRef]
- Shulla, K.; Voigt, B.-F.; Cibian, S.; Scandone, G.; Martinez, E.; Nelkovski, F.; Salehi, P. Effects of COVID-19 on the Sustainable Development Goals (SDGs). Discov. Sustain. 2021, 2, 15. [Google Scholar] [CrossRef]
- Firoiu, D.; Ionescu, G.H.; Pîrvu, R.; Bădîrcea, R.; Patrichi, I.C. Achievement of the Sustainable Development Goals (SDG) in Portugal and Forecast of Key Indicators until 2030. Technol. Econ. Dev. Econ. 2022, 28, 1649–1683. [Google Scholar] [CrossRef]
- Tu, Y.-T.; Aljumah, A.I.; Van Nguyen, S.; Cheng, C.-F.; Tai, T.D.; Qiu, R. Achieving Sustainable Development Goals through a Sharing Economy: Empirical Evidence from Developing Economies. J. Innov. Knowl. 2023, 8, 100299. [Google Scholar] [CrossRef]
- Stiglitz, J. Conquering the Great Divide. The Pandemic Has Laid Bare Deep Divisions, but It’s Not Too Late to Change Course. Financ. Dev. 2020, 57, 17–19. [Google Scholar]
- Hoosain, M.S.; Paul, B.S.; Ramakrishna, S. The Impact of 4IR Digital Technologies and Circular Thinking on the United Nations Sustainable Development Goals. Sustainability 2020, 12, 10143. [Google Scholar] [CrossRef]
- Rahmanov, F.; Aliyeva, R.; Rosokhata, A.; Letunovska, N. Tourism Management in Azerbaijan Under Sustainable Development: Impact of COVID-19. MMI 2020, 3, 195–207. [Google Scholar] [CrossRef]
- Ameli, M.; Shams Esfandabadi, Z.; Sadeghi, S.; Ranjbari, M.; Zanetti, M.C. COVID-19 and Sustainable Development Goals (SDGs): Scenario Analysis through Fuzzy Cognitive Map Modeling. Gondwana Res. 2023, 114, 138–155. [Google Scholar] [CrossRef] [PubMed]
- Elavarasan, R.M.; Pugazhendhi, R.; Shafiullah, G.M.; Kumar, N.M.; Arif, M.T.; Jamal, T.; Chopra, S.S.; Dyduch, J. Impacts of COVID-19 on Sustainable Development Goals and Effective Approaches to Maneuver Them in the Post-Pandemic Environment. Environ. Sci. Pollut. Res. 2022, 29, 33957–33987. [Google Scholar] [CrossRef]
- The Sustainable Development Goals Report 2023. Towards a Rescue Plan for People and Planet; Special Edition; United Nations Publications: New York, NY, USA, 2023; ISBN 978-92-1-101460-0.
- Abidoye, B.; Felix, J.; Kapto, S.; Petterson, L. Leaving No One Behind: Impact of COVID-19 on the Sustainable Development Goals (SDGs); United Nations Development Programme and Frederick S. Pardee Center for International Futures: New York, NY, USA; Denver, CO, USA, 2021. [Google Scholar]
- Hughes, B.B.; Hanna, T.; McNeil, K.; Bohl, D.; Moyer, J.D. Pursuing the Sustainable Development Goals in a World Reshaped by COVID-19; Frederick S. Pardee Center for International Futures and United Nations Development Programme: New York, NY, USA; Denver, CO, USA, 2021. [Google Scholar]
- Xiaolan, F. Partnerships in Response to COVID-1. Building Back Better Together; United Nations Department of Economic and Social Afairs: New York, NY, USA, 2021. [Google Scholar]
- Sachs, J.D.; Lafortune, G.; Fuller, G.; Drumm, E. Implementing the SDG Stimulus. Sustainable Development Report 2023: Sustainable Development Report 2023; Dublin University Press: Dublin, Ireland, 2023. [Google Scholar]
- Rydz-Żbikowska, A. Implementing Sustainable Development Goals within the COVID–19 Pandemic Future Challenges for the 2030 Agenda. CER 2022, 25, 135–160. [Google Scholar] [CrossRef]
- Lekagul, A.; Chattong, A.; Rueangsom, P.; Waleewong, O.; Tangcharoensathien, V. Multi-Dimensional Impacts of Coronavirus Disease 2019 Pandemic on Sustainable Development Goal Achievement. Global Health 2022, 18, 65. [Google Scholar] [CrossRef]
- Mestdagh, B.; Sempiga, O.; Van Liedekerke, L. The Impact of External Shocks on the Sustainable Development Goals (SDGs): Linking the COVID-19 Pandemic to SDG Implementation at the Local Government Level. Sustainability 2023, 15, 6234. [Google Scholar] [CrossRef]
- Sridhar, A.; Balakrishnan, A.; Jacob, M.M.; Sillanpää, M.; Dayanandan, N. Global Impact of COVID-19 on Agriculture: Role of Sustainable Agriculture and Digital Farming. Environ. Sci. Pollut. Res. 2022, 30, 42509–42525. [Google Scholar] [CrossRef]
- Azizuddin, M.; Shamsuzzoha, A.; Piya, S. Influence of Circular Economy Phenomenon to Fulfil Global Sustainable Development Goal: Perspective from Bangladesh. Sustainability 2021, 13, 11455. [Google Scholar] [CrossRef]
- Martín-Blanco, C.; Zamorano, M.; Lizárraga, C.; Molina-Moreno, V. The Impact of COVID-19 on the Sustainable Development Goals: Achievements and Expectations. Int. J. Environ. Res. Public Health 2022, 19, 16266. [Google Scholar] [CrossRef]
- Sá, M.J.; Serpa, S. The COVID-19 Pandemic as an Opportunity to Foster the Sustainable Development of Teaching in Higher Education. Sustainability 2020, 12, 8525. [Google Scholar] [CrossRef]
- Von der Leyen, U. A Union That Strives for More: My Agenda for Europe: Political Guidelines for the Next European Commission 2019–2024; Publications Office of the European Union: Luxembourg, 2019. [Google Scholar]
- Council of the EU. Supporting the Sustainable Development Goals across the World: Council Adopts Conclusions. 2019. Available online: https://www.consilium.europa.eu/en/press/press-releases/2019/07/08/supporting-the-sustainable-development-goals-across-the-world-council-adopts-conclusions/ (accessed on 31 July 2023).
- The European Green Deal. Communication COM/2019/640. 2019. Available online: https://www.eumonitor.eu/9353000/1/j9vvik7m1c3gyxp/vl4cnhyp1ort (accessed on 31 July 2023).
- Von der Leyen, U. European Pillar of Social Rights Action Plan. 2021. Available online: https://op.europa.eu/webpub/empl/european-pillar-of-social-rights/en/ (accessed on 31 July 2023).
- 2030 Digital Compass: The European Way for the Digital Decade; Publications Office of European Commission: Luxembourg, 2021.
- The New European Consensus on Development “Our World, Our Dignity, Our Future”. 2017. Available online: https://reliefweb.int/report/world/new-european-consensus-development-our-world-our-dignity-our-future (accessed on 31 July 2023).
- Communication from the Commission to the European Parliament, The Council, The European Economic and Social Committee and The Committee of Regions on Achieving the European Education Area by 2025. 2021. Available online: https://eur-lex.europa.eu/legal-content/EN/TXT/?uri=CELEX%3A52020DC0625 (accessed on 31 July 2023).
- Eurostat Database. Selected Dataset. Sustainable Development Indicators 2023. Available online: https://ec.europa.eu/eurostat/web/sdi/database (accessed on 31 July 2023).
- EU SDG Indicator Set 2023. Result of the Review in Preparation of the 2023 Edition of the EU SDG Monitoring Report; May 2023. Available online: https://ec.europa.eu/eurostat/documents/276524/16747589/EU-SDG-indicators-2023-final.pdf/0d79cdec-5813-16d6-4161-e21d19cae2d2?t=1683812427141 (accessed on 31 July 2023).
- EU SDG Indicator Set 2023 Result of the Review in Preparation of the 2023 Edition of the EU SDG Monitoring Report; January 2023. Available online: https://ec.europa.eu/eurostat/documents/276524/15877045/EU-SDG-indicators-2023.pdf/31e0dfe2-253b-73b7-fb72-408c7208cb85?t=1673438075710 (accessed on 31 July 2023).
- Digitalisation in Europe 2021-2022: Evidence from the EIB Investment Survey; EIB: Luxembourg, 2022; ISBN 978-92-861-5233-7.
- Contreras, R.R. COVID-19 and Digitalisation. News Article, 15 December 2021. [Google Scholar]
- Road Safety in the EU: Fatalities below Pre-Pandemic Levels but Progress Remains Too Slow. News Article, 21 February 2023.
- Yasin, Y.J.; Grivna, M.; Abu-Zidan, F.M. Global Impact of COVID-19 Pandemic on Road Traffic Collisions. World J. Emerg. Surg. 2021, 16, 51. [Google Scholar] [CrossRef] [PubMed]
- Forster, P.M.; Forster, H.I.; Evans, M.J.; Gidden, M.J.; Jones, C.D.; Keller, C.A.; Lamboll, R.D.; Quéré, C.L.; Rogelj, J.; Rosen, D.; et al. Current and Future Global Climate Impacts Resulting from COVID-19. Nat. Clim. Chang. 2020, 10, 913–919. [Google Scholar] [CrossRef]
- Le Quéré, C.; Jackson, R.B.; Jones, M.W.; Smith, A.J.P.; Abernethy, S.; Andrew, R.M.; De-Gol, A.J.; Willis, D.R.; Shan, Y.; Canadell, J.G.; et al. Temporary Reduction in Daily Global CO2 Emissions during the COVID-19 Forced Confinement. Nat. Clim. Chang. 2020, 10, 647–653. [Google Scholar] [CrossRef]


| Risk of Not Meeting the 2030 Target | Indicator | Desirable Direction of Change | Observed Annual Rate, Based on the Long-Term Trend | Required Annual Rate, from the Most Recent Data to 2030 | Years Needed in 2019 to Meet the 2030 Target | Years Needed in 2021 to Meet the 2030 Target |
|---|---|---|---|---|---|---|
| Group A (small or no risk) | Share of households with high-speed internet connection (SDG 9, SDG 17) | ↑ | 20.68% | 4.01% | 3.6 | 1.9 |
| Early leavers from education and training (SDG 4) | ↓ | −2.98% | −0.94% | 3.7 | 2.8 | |
| Terrestrial protected areas (SDG 15) | ↑ | 4.07% | 1.60% | 2.5 | 3.6 | |
| Tertiary educational attainment (SDG 4, SDG 9) | ↑ | 2.24% | 0.93% | 5.9 | 3.8 | |
| Premature deaths due to exposure to PM2.5 (SDG 3, SDG 11) | ↓ | −4.27% | −2.01% | 3.4 | 4.7 | |
| Employment rate (SDG 8) | ↑ | 0.90% | 0.72% | 7.8 | 7.2 | |
| Marine protected areas (SDG 14) | ↑ | 12.48% | 10.62% | 7.7 | 7.7 | |
| Recycling rate of municipal waste (SDG 11) | ↑ | 2.45% | 2.14% | 10 | 7.9 | |
| Group B (medium risk) | People killed in road crashes (SDG 3, SDG 11) | ↓ | −3.53% | −6.04% | 23.8 | 15.6 |
| Young people neither in employment nor in education and training (SDG 8) | ↓ | −2.26% | −4.09% | 17.1 | 16.4 | |
| Share of renewable energy in gross final energy consumption (SDG 7, SDG 13) | ↑ | 3.83% | 7.71% | 21.2 | 17.8 | |
| Area under organic farming (SDG 2) | ↑ | 5.60% | 10.65% | 20.8 | 18.6 | |
| Group C (significant risk) | Gross domestic expenditure on R&D (SDG 9) | ↑ | 1.26% | 3.20% | 22.7 | 22.7 |
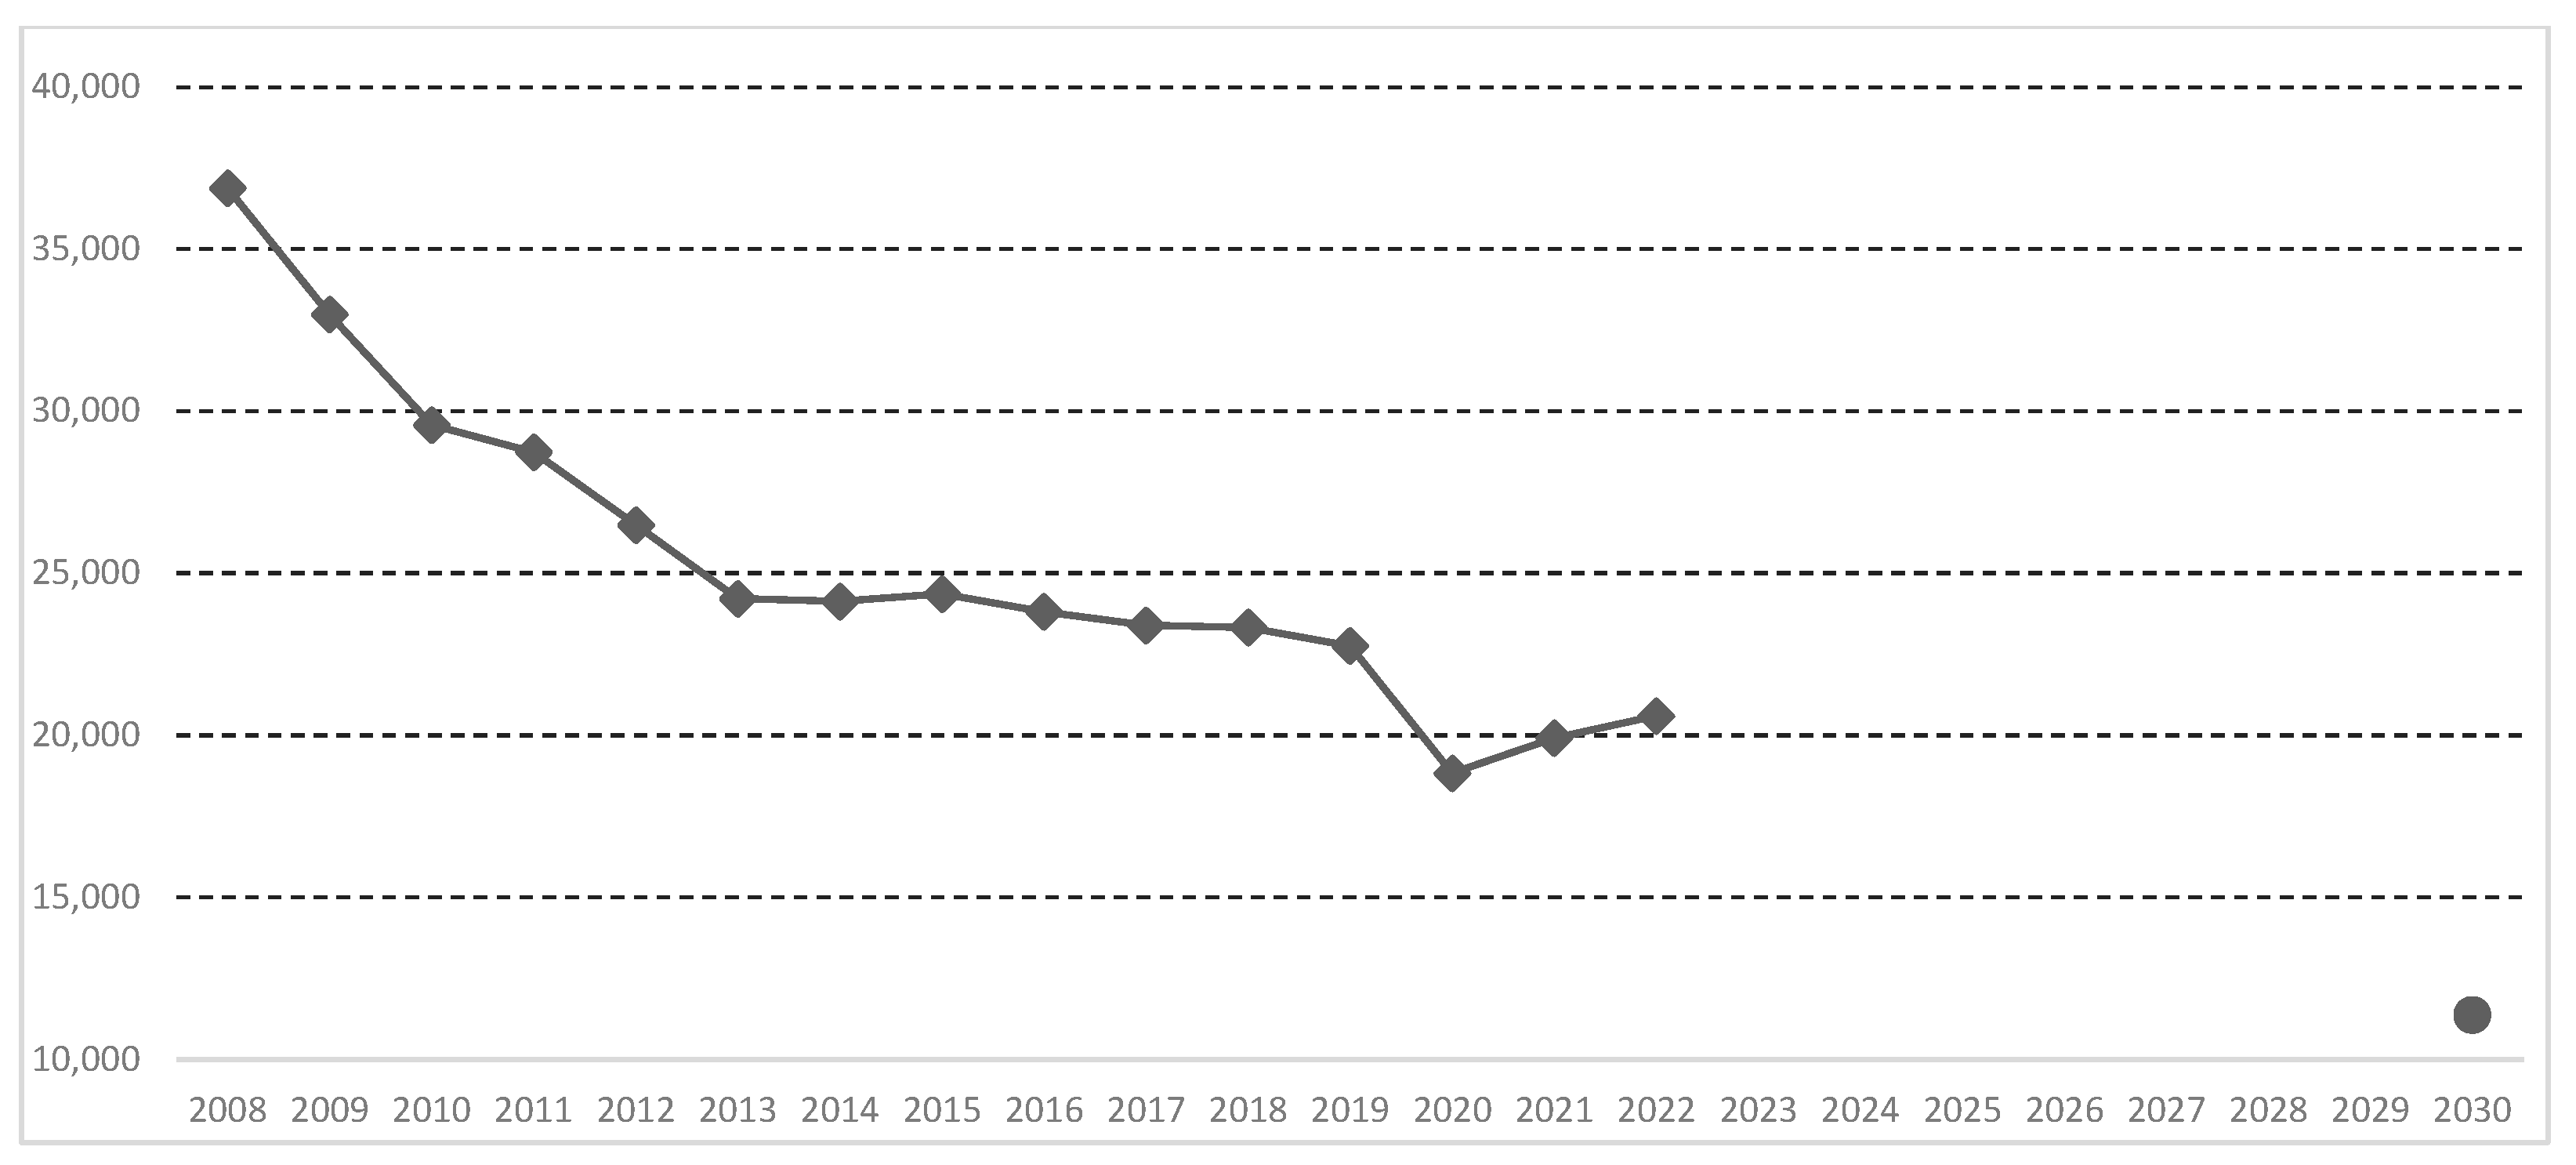
| People at risk of poverty or social exclusion (SDG 1) | ↓ | −0.80% | −2.34% | 12.4 | 26.6 | |
| Net greenhouse gas emissions (SDG 13) | ↓ | −1.71% | −5.09% | 33.7 | 27.3 | |
| Primary energy consumption (SDG 7) | ↓ | −0.97% | −3.02% | 37.8 | 28.3 | |
| Official development assistance (SDG 17) | ↑ | 0.98% | 4.04% | 17.3 | 36.5 | |
| Participation in early childhood education (SDG 4) | ↑ | 0.09% | 0.41% | 16.5 | 39.1 | |
| Final energy consumption (SDG 7) | ↓ | −0.52% | −2.61% | 60.2 | 46.0 | |
| Gender employment gap (SDG 5) | ↓ | −1.42% | −7.13% | 49.6 | 46.6 | |
| Average CO2 emissions per km from new passenger cars (SDG 12) | ↓ | −1.65% | −9.08% | 60.8 | 51.6 | |
| Circular material use rate (SDG 12) | ↑ | 0.73% | 8.01% | 57.1 | 95.3 | |
| Net greenhouse gas emissions from land use, land use change and forestry (SDG 13) | ↓ | −3.81% | −52.02% | 169.6 | 170.1 |
| Long-Term Trend | 2013–2019 | 2013–2021 | ||
|---|---|---|---|---|
| Observed annual rate | 21.47% | 20.68% | ||
| Years needed to meet the target | 3.6 | 1.9 | ||
| Required annual rate (2013–2030) | 11.55% | |||
| Short-Term Trend | 2015–2019 | 2015–2020 | 2015–2021 | |
| Observed annual rate | 22.98% | 22.25% | 21.43% | |
| Years needed to meet the target | 3.3 | 3.4 | 3.6 | |
| Required annual rate (2015–2030) | 10.65% | |||
| Required annual rate (2019–2030) | 6.48% | |||
| Required annual rate (2021–2030) | 4.01% | |||
| Long-Term Trend | 2010–2019 | 2013–2021 | ||
|---|---|---|---|---|
| Observed annual rate | −2.87% | −3.53% | ||
| Years needed to meet the target | 23.8 | 15.6 | ||
| Required annual rate (2013–2030) | −6.11% | |||
| Short-Term Trend | 2015–2019 | 2015–2020 | 2015–2021 | |
| Observed annual rate | −1.69% | −5.01% | −3.30% | |
| Years needed to meet the target | 40.8 | 13.5 | 20.7 | |
| Required annual rate (2015–2030) | −4.95% | |||
| Required annual rate (2019–2030) | −6.11% | |||
| Required annual rate (2021–2030) | −4.92% | |||
| Long-Term Trend | 2010–2019 | 2010–2022 | ||
|---|---|---|---|---|
| Observed annual rate | −3.86% | −3.81% | ||
| Years needed to meet the target | 169.6 | 170.1 | ||
| Required annual rate (2010–2030) | −29.66% | |||
| Short-Term Trend | 2015–2019 | 2015–2020 | 2015–2022 | |
| Observed annual rate | −6.41% | −5.65% | −5.48% | |
| Years needed to meet the target | 100.8 | 114.8 | 118.7 | |
| Required annual rate (2015–2030) | −37.07% | |||
| Required annual rate (2019–2030) | −45.53% | |||
| Required annual rate (2021–2030) | −52.02% | |||
| Long-Term Trend | 2010–2019 | 2010–2022 | ||
|---|---|---|---|---|
| Observed annual rate | −1.42% | −0.80% | ||
| Years needed to meet the target | 12.4 | 26.6 | ||
| Required annual rate (2010–2030) | −1.52% | |||
| Short-Term Trend | 2015–2019 | 2015–2020 | 2015–2022 | |
| Observed annual rate | −3.19% | −2.02% | −1.37% | |
| Years needed to meet the target | 5.5 | 8.7 | 12.9 | |
| Required annual rate (2015–2030) | −2.03% | |||
| Required annual rate (2019–2030) | −1.60% | |||
| Required annual rate (2021–2030) | −2.34% | |||
Disclaimer/Publisher’s Note: The statements, opinions and data contained in all publications are solely those of the individual author(s) and contributor(s) and not of MDPI and/or the editor(s). MDPI and/or the editor(s) disclaim responsibility for any injury to people or property resulting from any ideas, methods, instructions or products referred to in the content. |
© 2023 by the authors. Licensee MDPI, Basel, Switzerland. This article is an open access article distributed under the terms and conditions of the Creative Commons Attribution (CC BY) license (https://creativecommons.org/licenses/by/4.0/).
Share and Cite
Brzyska, J.; Szamrej-Baran, I. The COVID-19 Pandemic and the Implementation of Sustainable Development Goals: The EU Perspective. Sustainability 2023, 15, 13503. https://doi.org/10.3390/su151813503
Brzyska J, Szamrej-Baran I. The COVID-19 Pandemic and the Implementation of Sustainable Development Goals: The EU Perspective. Sustainability. 2023; 15(18):13503. https://doi.org/10.3390/su151813503
Chicago/Turabian StyleBrzyska, Joanna, and Izabela Szamrej-Baran. 2023. "The COVID-19 Pandemic and the Implementation of Sustainable Development Goals: The EU Perspective" Sustainability 15, no. 18: 13503. https://doi.org/10.3390/su151813503
APA StyleBrzyska, J., & Szamrej-Baran, I. (2023). The COVID-19 Pandemic and the Implementation of Sustainable Development Goals: The EU Perspective. Sustainability, 15(18), 13503. https://doi.org/10.3390/su151813503