1. Introduction
Technical efficiency is, apart from allocative efficiency, a component of economic efficiency in the assessment of the activity of each enterprise or project. In the most general sense, it means the ratio of the output achieved to the inputs incurred to achieve it, and in the case of a multidimensional sum of outputs, to the sum of inputs. It describes how inputs are transformed into outputs or inputs into a sum of outputs [
1,
2]. In the enterprise, this can be expressed through indicators, such as the degree of warehouse space utilization or labor productivity, which are often used in practical assessment of technical efficiency. In this form, it characterizes selected aspects of activity well, but does not describe the overall technical efficiency, and, more importantly, it does not take into account the relationship between the efficiency of the unit and the efficiency of units operating in the same technological conditions [
3]. Getting to know this relationship is possible only with the use of advanced research methods for estimating technical efficiency indicators: econometric methods or linear programming methods. Technical efficiency based on cross-sectional data identifies possible levels of inefficiency resulting from the inefficient use of technology.
Most often, the technical efficiency of entities, enterprises, organizations, and sectors is considered from the perspective of their financial results, because it allows for assessing whether a given output has been achieved with a minimum volume and appropriate structure of inputs. However, the pursuit of sustainable production patterns requires consideration of additional factors of input efficiency and the emergence of incidental expected or unexpected production. Enterprises, organizations, and government institutions should, therefore, take into account issues related to, e.g., environmental protection, combating poverty and social exclusion, care for the health and quality of the life of citizens, quality of education, fair employment conditions, ethics [
4,
5,
6] (Global Resources Outlook 2019, European Green Deal, 2019, Trends and forecasts, 2022), because every undertaking today, regardless of the industry, should take into account the principles of sustainable economics and align economic goals with social goals, i.e., access to clean energy sources and natural resources, free access to health care, food security, stability of the banking system, dual education. Measurement of efficiency taking into account these factors has been the subject of many scientific studies, including Akkan et al. [
7], Shair et al. [
8], and Kularatne et al. [
9].
Similarly, agricultural activity in the past focused on the intensive transformation of land and labor resources, as well as current inputs into agricultural production, which, in the short term, was associated with an increase in agricultural efficiency, but in the long run, it led to a decrease in food production and deterioration of its quality [
10], and the loss of biodiversity [
11]. In addition, the negative environmental effects caused by intensive food production techniques, excessive use of mineral fertilizers and plant protection products and antibiotics, and the concentration and mechanization of crops and animal husbandry have increased greenhouse gas emissions, and soil and water have become polluted [
12] and directed the interest of farmers, agricultural economists, and scientists for activities related to sustainable agriculture, and as a result, leaving food security at the center of attention, but combining it with respect for environmental goals [
13,
14]. The current goal of agricultural activity is, therefore, to effectively increase food production in a sustainable way [
15], with minimal use of fertilizers and plant protection products.
The main objective of this article is to better understand the category of technical efficiency of agriculture. Assuming that the main element of economic efficiency is technical efficiency, an empirical study was planned, the subject of which was to estimate the average technical efficiency of agriculture in the European Union countries and to differentiate its level according to the economic size classes of farms. The analysis attempts to answer the questions whether agriculture in the European Union countries is characterized by an efficient transformation of inputs into outputs and whether the economic size of farms differentiates their technical efficiency. The combination of the theoretical concept of efficiency with the results of the analysis of the technical efficiency of EU agriculture provides more opportunities to interpret changes in the perception of economic goals achieved in the agricultural sector. Introduction to the calculation of economic outlays, e.g., related to the use of fertilizers, plant protection products, and antibiotics, is justified by both economic and environmental considerations and is consistent with the assumptions of the Common Agricultural Policy and the European Green Deal.
This article is divided into three main parts. The first part presents the definition and measurement of economic efficiency, indicating that technical efficiency is its main component, in particular, in agriculture, where, apart from the financial efficiency of farms, public objectives play an important role: food security, social, and environmental. Based on the definition of the category of economic efficiency, the main methods of measurement existing in the literature are described. The second part of the article focusses on presenting the methodology of empirical research. It describes a nonparametric method of measuring technical efficiency—the Data Envelopment Analysis (DEA) method—and variables used to measure the technical efficiency of EU agriculture, data sources, and the research scheme. The third part of the article presents the results of the analysis of the average level of technical efficiency of agriculture in EU countries in 2004–2020 and the average technical efficiency of farms operating in agricultural sectors of EU countries according to their economic size classes. The article ends with a discussion of selected theoretical aspects of the category of technical efficiency of agriculture and empirical conditions of the obtained results. This part formulates conclusions regarding the level and conditions of the achieved technical efficiency of agriculture in EU countries and the assumptions of the EU Common Agricultural Policy and the European Green Deal, and outlines future research directions.
2. Literature Review
The category of economic efficiency has so far been devoted to a large part of the scientific literature and practical research [
7,
8,
9,
16]. Because economic efficiency enables the assessment of the achievement of long-term economic goals of enterprises or projects or on a macroeconomic scale—sectors and economies—and numerous methods of measuring it proposed in the literature allow for indicating the level, we determine factors increasing efficiency and areas of inefficiency [
17,
18]. In general, economic efficiency can be thought of as a classic measure based on the financial indicators of the entity or project, or as an alternative measure based on cross-sectional data.
The classic measure of efficiency consists of evaluating the production of a single entity, enterprise, industry, or country based on financial indicators. It is calculated as the ratio of the output or the sum of outputs achieved by the entity as part of its business activity to the input or the sum of inputs incurred to achieve this output (outputs). Its growth is the expected result of any economic activity, because it allows you to achieve long-term goals. In this approach, economic efficiency can be treated as an assessment of the efficiency of economic entities and equated with productivity or profitability [
19,
20]. The widespread use of classical efficiency measures, such as profitability, productivity, and efficiency, makes these measures easy to analyze. The comparison of individual measures can be analyzed over time or between entities operating in the same industry and reliably describe the situation in the long term, especially if they are combined with appropriate quantitative methods. The problem with the use of classical measures of economic efficiency appears at the stage of adopting appropriate measures and when the purpose of the analysis is a comprehensive and unambiguous assessment of the subject of research. Classical measures of economic efficiency do not fully reflect the results of economic activity, because they do not take into account the inefficiency resulting from the use of non-optimal ratios of inputs to outputs, and they do not take into account the environment in which a given entity operates. An enterprise, sector, or economy can achieve high efficiency in one area and, at the same time, be ineffective in another.
One way to eliminate the limitations of using classical measures of economic efficiency is to treat it as an alternative measure. The measure of economic efficiency in this case is the ratio of the efficiency of a given entity to the maximum efficiency possible to be achieved in given technological conditions [
21]. Measuring alternative efficiency requires the use of more advanced methods, e.g., based on the econometric modeling–parametric approach [
22] or using the mathematical programming–non-parametric approach [
23]. At the same time, it is worth mentioning that parametric methods are more often used to determine the level of economic efficiency, explaining the reasons that cause its fluctuations, while non-parametric methods are used to identify and scale technical inefficiency.
Parametric methods in assessing economic efficiency are based on the assumptions of the microeconomic production function. They use econometric modeling to determine the parameters of the production function, i.e., the parameters defining the functional relationships between the inputs and the outputs obtained, to determine the parameters of the efficiency curve. Facility failure is defined as a deviation of the actual values from the values determined on the basis of the determined theoretical efficiency function (with the assumed random error). On the other hand, non-parametric methods allow for determining the frontier efficiency curve by solving a linear programming problem. Based on empirical data, the program determines the measure of efficiency, without prior assumptions as to the relationship between inputs and outputs achieved by the entity. An important limitation of non-parametric methods is the omission of the impact of random factors on the achieved efficiency of entities. In the scientific literature and empirical analyses of economic efficiency, there is no single universal approach to its measurement. Depending on the purpose of the conducted analyses, some methods seem to be more useful. Sometimes, in certain cases, it is required to combine parametric and non-parametric methods, as they complement each other, and only their combination allows for more precise conclusions [
24].
Parametric and non-parametric methods are successfully used to determine the total economic efficiency, which consists of particular technical and allocative efficiency, as well as scale and scope efficiency, each of them emphasizing a different aspect of it [
1].
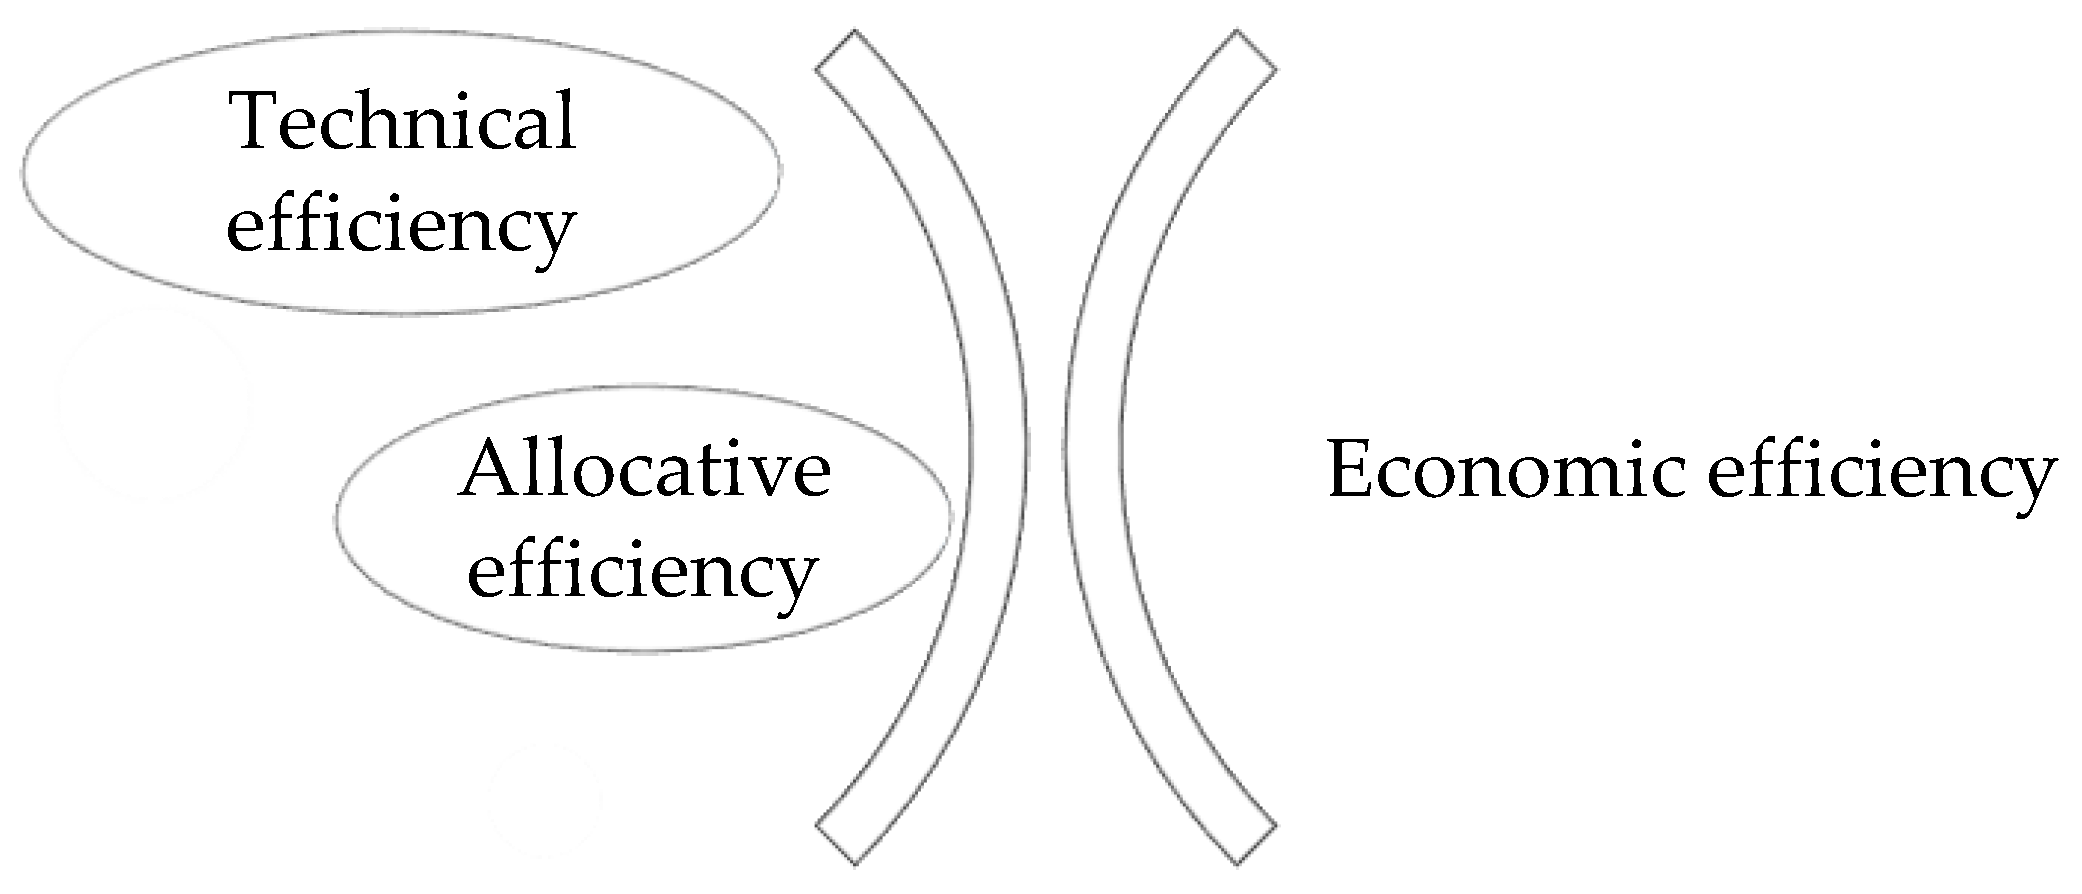
Technical and allocative efficiency are crucial for determining the overall economic efficiency of the audited entity, because the level of economic efficiency is influenced primarily by technological factors, measured by the level of technical efficiency, and price factors, measured by allocative efficiency. Technical efficiency, in accordance with the principle of rational choice, allows for adjusting production in such a way as to achieve a situation in which the effect is maximized with the same level of inputs, or the input is minimized with the same number of output values. The measure of technical efficiency lists the combinations of inputs that affect the achievement of the final output of the activity of the analyzed object, determining the level of its possible technical inefficiency [
7,
16]. Technical inefficiency is explained by the inefficient use of available technology, which means that the output achieved by the facility could be achieved with less input [
25]. The improvement of the technical efficiency of the facility is related to the shifting of the production frontier as a result of changes in technical progress, which means that the existing output can be obtained with less input than before [
26]. In turn, allocative efficiency refers to a situation in which the tested object reaches the optimum in the Pareto sense, i.e., a temporary deterioration of the situation of another object (other objects). Allocative efficiency focuses on maximizing profit; it refers to the ability to match the tested object to the existing prices of inputs in given technological conditions [
27]. If economic efficiency is defined as a measure of achieving given outputs with the lowest possible inputs (costs) or a measure of achieving the greatest possible output (outputs) from a given amount of inputs, then economic efficiency is the product of technical and allocative efficiency. The relationship among economic, technical, and allocative efficiency is shown in
Figure 1.
Factors of economic efficiency may be changes in the structure of production, as losses in efficiency may result from insufficient use of existing economies of scale, and the scope of production.
The amount of goods and services produced reflects the outputs of economic activity units and is defined as the scale of activity. Increasing the scale of activity has a significant impact on the economic effects of the economic activity and causes certain economic benefits, called economies of scale or the scope of scale. Increasing economies of scale occur when long-term average costs decrease as output increases, constant economies of scale when long-term average costs remain constant as output increases, and diminishing economies of scale when long-term average costs increase as output increases [
28,
29]. Economies of scale illustrate the response of the level of production to a proportional increase in inputs. Scale effects determine to what extent the size of the tested object is close to the optimal one, i.e., whether, for example, increasing the scale of operation may result in an increase in efficiency. The operation of entities in the conditions of increasing economies of scale is an impulse to increase the volume of their production and should last until they achieve constant economies of scale. Above this point, an additional increase in production results in losses of scale efficiency [
30]. The reasons for the occurrence of economies of scale may include, among others, the possibility of division of labor and the increasing specialization of tasks, along with the increase in the volume of production.
In addition, a factor influencing the level of economic efficiency of an entity may also be the range of products offered [
31,
32]. The production scope effect (production scope economy) is related to the subaddition of costs and consists in the fact that the cost of producing a group of products by one of the plants is lower than the sum of the costs of production of individual products by a group of different plants producing one product each, assuming constant unit prices of inputs. Therefore, it is crucial to determine whether the integrated offer of all manufactured goods and services brings greater benefits than the offer of all producers specializing in the production of individual goods and services. Thus, the range of production benefits occurs when one producer is able to produce a combination of products cheaper than a group of producers specializing in the production of single products. Production benefits include that they result from the spreading of fixed production costs over a larger number of goods and services produced, and they also reduce the risk of doing business thanks to the diversification of production. Expanding the scope of activities also allows for effective acquisition of information about the needs of customers.
Economic efficiency is an important issue because it is treated as a criterion for achieving long-term goals of any economic activity, and its growth is an expected effect at the micro-, meso-, and macroeconomic levels. The simplest way to determine economic efficiency is to use classical measures, i.e., return on capital/assets and labor productivity. These measures, due to their simplicity, are commonly used in economic practice, but they characterize only a selected area of activity and do not determine how the object adapts to environmental conditions. So, they are useful for assessing the current situation of the facility, but they have limitations in determining how to improve it. These are alternative measures of economic efficiency, i.e., technical efficiency, allocative efficiency, and scale and scope, which make it possible to determine the sources of economic efficiency, set paths for its growth, and, importantly, indicate areas of economic inefficiency; but, their application requires the use of advanced computational procedures. Appropriately selected parametric and non-parametric methods indicate whether the economic efficiency of the facility results from the technologies used or from the cost advantage. This approach to measuring economic efficiency is particularly important in selected sectors of the economy. In sectors such as agriculture, energy, banking, healthcare, or education, the activities of the facility must meet both economic and social goals. Their technical efficiency should cover production inputs related to environmental objectives and social order, and production, including unexpected production. High technical efficiency ensures the achievement of economic efficiency, as it ensures such organization of production that minimizes the use of inputs.
Agriculture is one of the sectors of the economy in which the measurement of technical efficiency and its improvement is particularly important, and this applies to the level of a single farm, regionally, nationally, and internationally. The impact on the efficiency of resource use means not only achieving a competitive advantage of more efficient farms, sectors, and regions, but, more importantly, it is a condition for ensuring the food, social, and environmental security of the world’s population [
33]. Efficient choice of natural resources, both at the level of farms and on a global scale, allows achieving a satisfactory level of economic efficiency, while maintaining the quality of ecosystems.
Since the 1970s, food security has occupied a central place in the discussions of countries gathered in various types of bodies and international organizations [
34]. They all lead to the conclusion that the condition for ensuring food security for the constantly growing population is the adoption by all countries of the world of an appropriate strategy and activities in the fields of food production and trade, such an organization of agriculture to ensure the safety of the life and health of food recipients. According to the conclusions of the FAO World Food Conference, access to sufficient food is essential for their life and health [
35]. Demographic projections [
36] clearly show that developing countries face the greatest food supply challenges, although developed countries also have a lot to do in this regard, as the concept of food security for the following decades has been supplemented with issues of food safety, food nutrition, and food preferences for an active and healthy life [
37]. Currently, food security has been shaken by the COVID-19 pandemic and the war in Ukraine, reviving the ongoing discussion about the future of the world and the state of the nutrition of the population [
38,
39,
40,
41]. Both showed the weaknesses of the agricultural sector, an important element of which is its dependence on the situation in international markets. During the pandemic, access to the international market was limited, resulting in logistical difficulties and price increases in supply chains. On the other hand, political instability caused by the war in Ukraine and restrictions on Russia resulted in an increase in the prices of imported agricultural inputs, i.e., fertilizers and plant protection products, which was an impulse to lower them. For high-efficiency agriculture in developed countries, this may initiate changes, e.g., limiting animal husbandry and allocating some of the cereals used for the production of feed or biofuels for human food, developing organic farms, and reducing food waste, but in developing countries, this can be an insurmountable problem due to the low technical efficiency of agriculture in these areas. It should also be emphasized that achieving food security contributes significantly and directly to achieving social and economic balance in rural areas, because lack of food is a fundamental problem that should be treated as the greatest social threat worldwide [
42,
43].
EU agriculture is important for food security, social order, and sustainable development in Europe. The development of intensive (conventional) agriculture in Europe was a reaction to food shortages that appeared in Europe after World War II. However, food shortages were eliminated relatively quickly, thanks to highly productive agriculture observed in selected EU countries. As a result, instead of a shortage of food in the European market in the 1970s, there was a real threat of its overproduction, and with it, the first restrictions on limiting its agricultural production, the promotion of fallow, began, and with it, the construction of a compensation system for farmers who lost their income. This situation was motivated by the activities carried out under the Common Agricultural Policy (CAP). The Common Agricultural Policy of the EU was established as one of the first policies of the European Union (previously the European Community). In general, its activity was based on two pillars: supporting agricultural production and the common organization of agricultural markets, and structural policy. The CAP is now focused on transforming EU agriculture towards sustainable agriculture that provides a future for current and future generations [
5,
44] i.e., further economic growth achieved, while respecting ecological standards and maintaining the socio-cultural order of rural areas [
45]. The Common Agricultural Policy of the European Union in the field of food safety includes a holistic approach to the food chain, which consists of high-quality agricultural products and feed, appropriate production technology, and safe trade [
46,
47], greening agricultural production to protect the climate, preserve biodiversity, generate renewable energy, and transform the cultural landscape [
48].
In this context, the current measurement of the technical efficiency of agriculture seems particularly important.
3. Research Methodology—Data and Data Sources
The main objective of this article is to better understand the category of technical efficiency of agriculture. For this purpose, empirical research was carried out, the subject of which was to estimate the average technical efficiency of agriculture in the European Union countries.
The results of the literature review and empirical analyses were used to verify the following research hypotheses:
H1. Agriculture in the European Union countries is characterized by a high average level of technical efficiency.
H2. Agricultural activity concentrated in the segment of large farms is characterized by higher technical efficiency.
The technical efficiency (TE) of agriculture in the European Union countries was estimated using the non-parametric Data Envelopment Analysis method (DEA method)–Charnes Cooper Rhodes Input Oriented model (CCR-IO model), using the Efficiency Measurement System program (EMS program) [
49].
Data Envelopment Analysis is a non-parametric method used to determine the efficiency of an object (object of analysis) under conditions of more than one input and more than one output. The DEA method is, therefore, a non-parametric method of assessing the technical efficiency (TE) of decision-making units (DMUs), in this case, agricultural sectors and their segments, allowing for measuring the relative efficiency of decision-making units adapted to the situation, which takes into account more than one input and more than one output [
25], and is defined as follows:
where:
j—number of the tested units from a group of n units (j = 1, …, n),
s—number of outputs (i = 1, …, s),
m—number of inputs (i = 1, …, m),
μi—weights i-output j-unit,
νi—weights i-input j-unit.
The measure of technical efficiency defined in this way is a measure based on cross-section data, i.e., the relationship between the efficiency of converting inputs into outputs of a given facility and the maximum productivity of an efficient facility that can be achieved in given technological conditions. Therefore, determining the technical efficiency of the tested DMUj object requires finding the optimal technology common to the tested set of units, which guarantees the achievement of the outputs achieved by the object with the lowest possible inputs. For this purpose, the problem of linear programming is solved. Under certain assumptions, the program determines the level of technical efficiency for each decision unit, and in the case of more than one effect and more than one input, it searches for weights that maximize its technical efficiency.
Depending on the orientation of the model, technology can be a set of achievable input vectors at a given level of economic output, in the case of input-oriented (IO) models. For output-oriented (OO) models, the production technology is the set of all possible output vectors that can be produced with the input vector.
The basic model for estimating the technical efficiency of DEA was developed by [
50] and is referred to in the literature as the CCR model. The first and most popular modification of the CCR model is the BCC model proposed by [
51], which introduces variable effects of scale to the assumptions. The introduced modification allows for the decomposition of the technical efficiency, i.e., the identification of the inefficiency of the facility, which outputs from either non-optimal use of inputs or from operating the facility in a non-optimal area of economy of scale. Work is underway on modifications and extensions of the basic DEA models. This led, among others, to rejecting the radial method of measuring the distance from the border, to creating non-oriented models, or to assuming the existence of a significant non-zero slack in efficiency assessment [
52,
53,
54,
55,
56].
Technical efficiency estimated on the basis of DEA models requires making assumptions regarding the type of economies of scale and model orientation [
46]. Depending on the type of economies of scale, technical efficiency with constant economies of scale (TE_CRS), technical efficiency with non-increasing economies of scale (TE_NIRS), and technical efficiency with variable economies of scale (variable economies of scale TE_VRS) can be calculated. The orientation of the DEA model indicates whether the input will be minimized or the output will be maximized when solving the optimization task, which is expressed by the objective function. If the goal of the adopted DMUs is to minimize inputs, then the orientation of the DEA model should be towards input-oriented (IO) inputs. On the other hand, DMUs whose goal is to maximize the outputs of operations use the result-oriented (OO) model. If it is not possible to formulate the purpose of the DMS in one of the two ways mentioned above, then a model without orientation (NO) should be used.
A mathematical presentation of the basic DEA model–CCR model is presented below. In the CCR-IO model for the studied unit, input multipliers and output multipliers are sought, such that [
50]:
with restrictions:
where:
o—number of the tested unit from a group of n units, o = 1, …, n,
xio—i-input used by o-unit, i = 1, …, m,
yro—r-output produced by o-unit, r = 1, …, s,
xo = [xio]—inputs vector xio,
yo = [yro]—output vector yro,
[xo,yo]—technology, i.e., the method of transforming m inputs into r outputs used by o unit,
X—matrix of m inputs used by n units,
Y—matrix of r outputs used by n units,
[X,Y]—matrix of technology [xo,yo] characterizing all n units,
ε—non-zero multiplier values.
In the study of the technical efficiency of agriculture in the EU countries, it was decided to use the DEA method, in accordance with the CCR-IO model presented above. Aggregate data were chosen for the analysis because they are particularly useful for measuring the overall technical performance of groups of countries forming compact, homogeneous regions [
57]. Agriculture in the European Union is carried out in a vast lowland area and is characterized by a large diversity of natural conditions. However, the European Union pursues an agricultural policy aimed at supporting biodiversity, which is why the system of subsidies, grants, and programs is aimed at unifying the conditions of food production in the EU. In this way, farmers throughout the European Union receive financial support in their efforts to promote biodiversity. In addition, the EU agricultural policy focuses its activities on a system of promotion and incentives for the use of sustainable and environmentally friendly practices that improve agricultural productivity at the national and European level. One of the objectives of environmental policies and principles of sustainable agriculture under the Common Agricultural Policy and the Green Deal is to de-intensify inputs, e.g., fertilizers and plant protection products.
The DEA method is widely used in determining technical efficiency in the agricultural sector [
58]. Among others [
59], based on individual data on 120 farms engaged in milk production in Jordan, estimated the level of technical efficiency and the efficiency of the scale of dairy farms, taking into account their size (measured by the number of cows). Data on one output (milk production in kg) and six inputs (capital [JDs], cow number, energy cost [JDs], labor cost [JDs], fodder cost [JDs], veterinary services cost [JDs]) were used for the calculations. The results revealed that the sampled farms were not operating at an optimal size. On average, the scale efficiency was estimated at approximately 0.66, indicating scale inefficiency under both constant returns to scale and variable returns to scale [
60], based on aggregated data on production (as output) and land, cows, labor, capital, variable costs, and other fixed costs (as inputs) collected for 22 EU countries, estimated the technical efficiency of dairy farms and the change in total factor productivity. The results of the research indicated a very high technical efficiency of dairy farms in the examined EU countries and little possibility of its internal improvement.
In the empirical study, technical efficiency in the EU sector and in economic size classes of EU farms was described with one output and eight inputs. The main output of the agricultural sector was defined by Total output. In turn, the group of inputs on the production of agricultural sectors included Total utilized agriculture area, Fertilizers, Crop protection, Total livestock units, Feed for grazing livestock, Labor input, Machinery and equipment, and Gross investment on fixed assets. The data included in the study are presented in
Table A1 in
Appendix A. Data were collected at the country level in general and in economic classes of farm size. The size of farms was determined by the Common Typology of Agricultural Holdings, which is presented in
Table A2 in the
Appendix A.
The source of data on effects and inputs, in the EU sector and in economic size classes of EU farms, is the FADN database. The period of empirical research covers annual data from 2004 to 2020. The year 2004 was the first year for which it was possible to obtain a complete and comparable set of data for all EU countries. However, 2020 was the last full year for which the FADN databases published data.
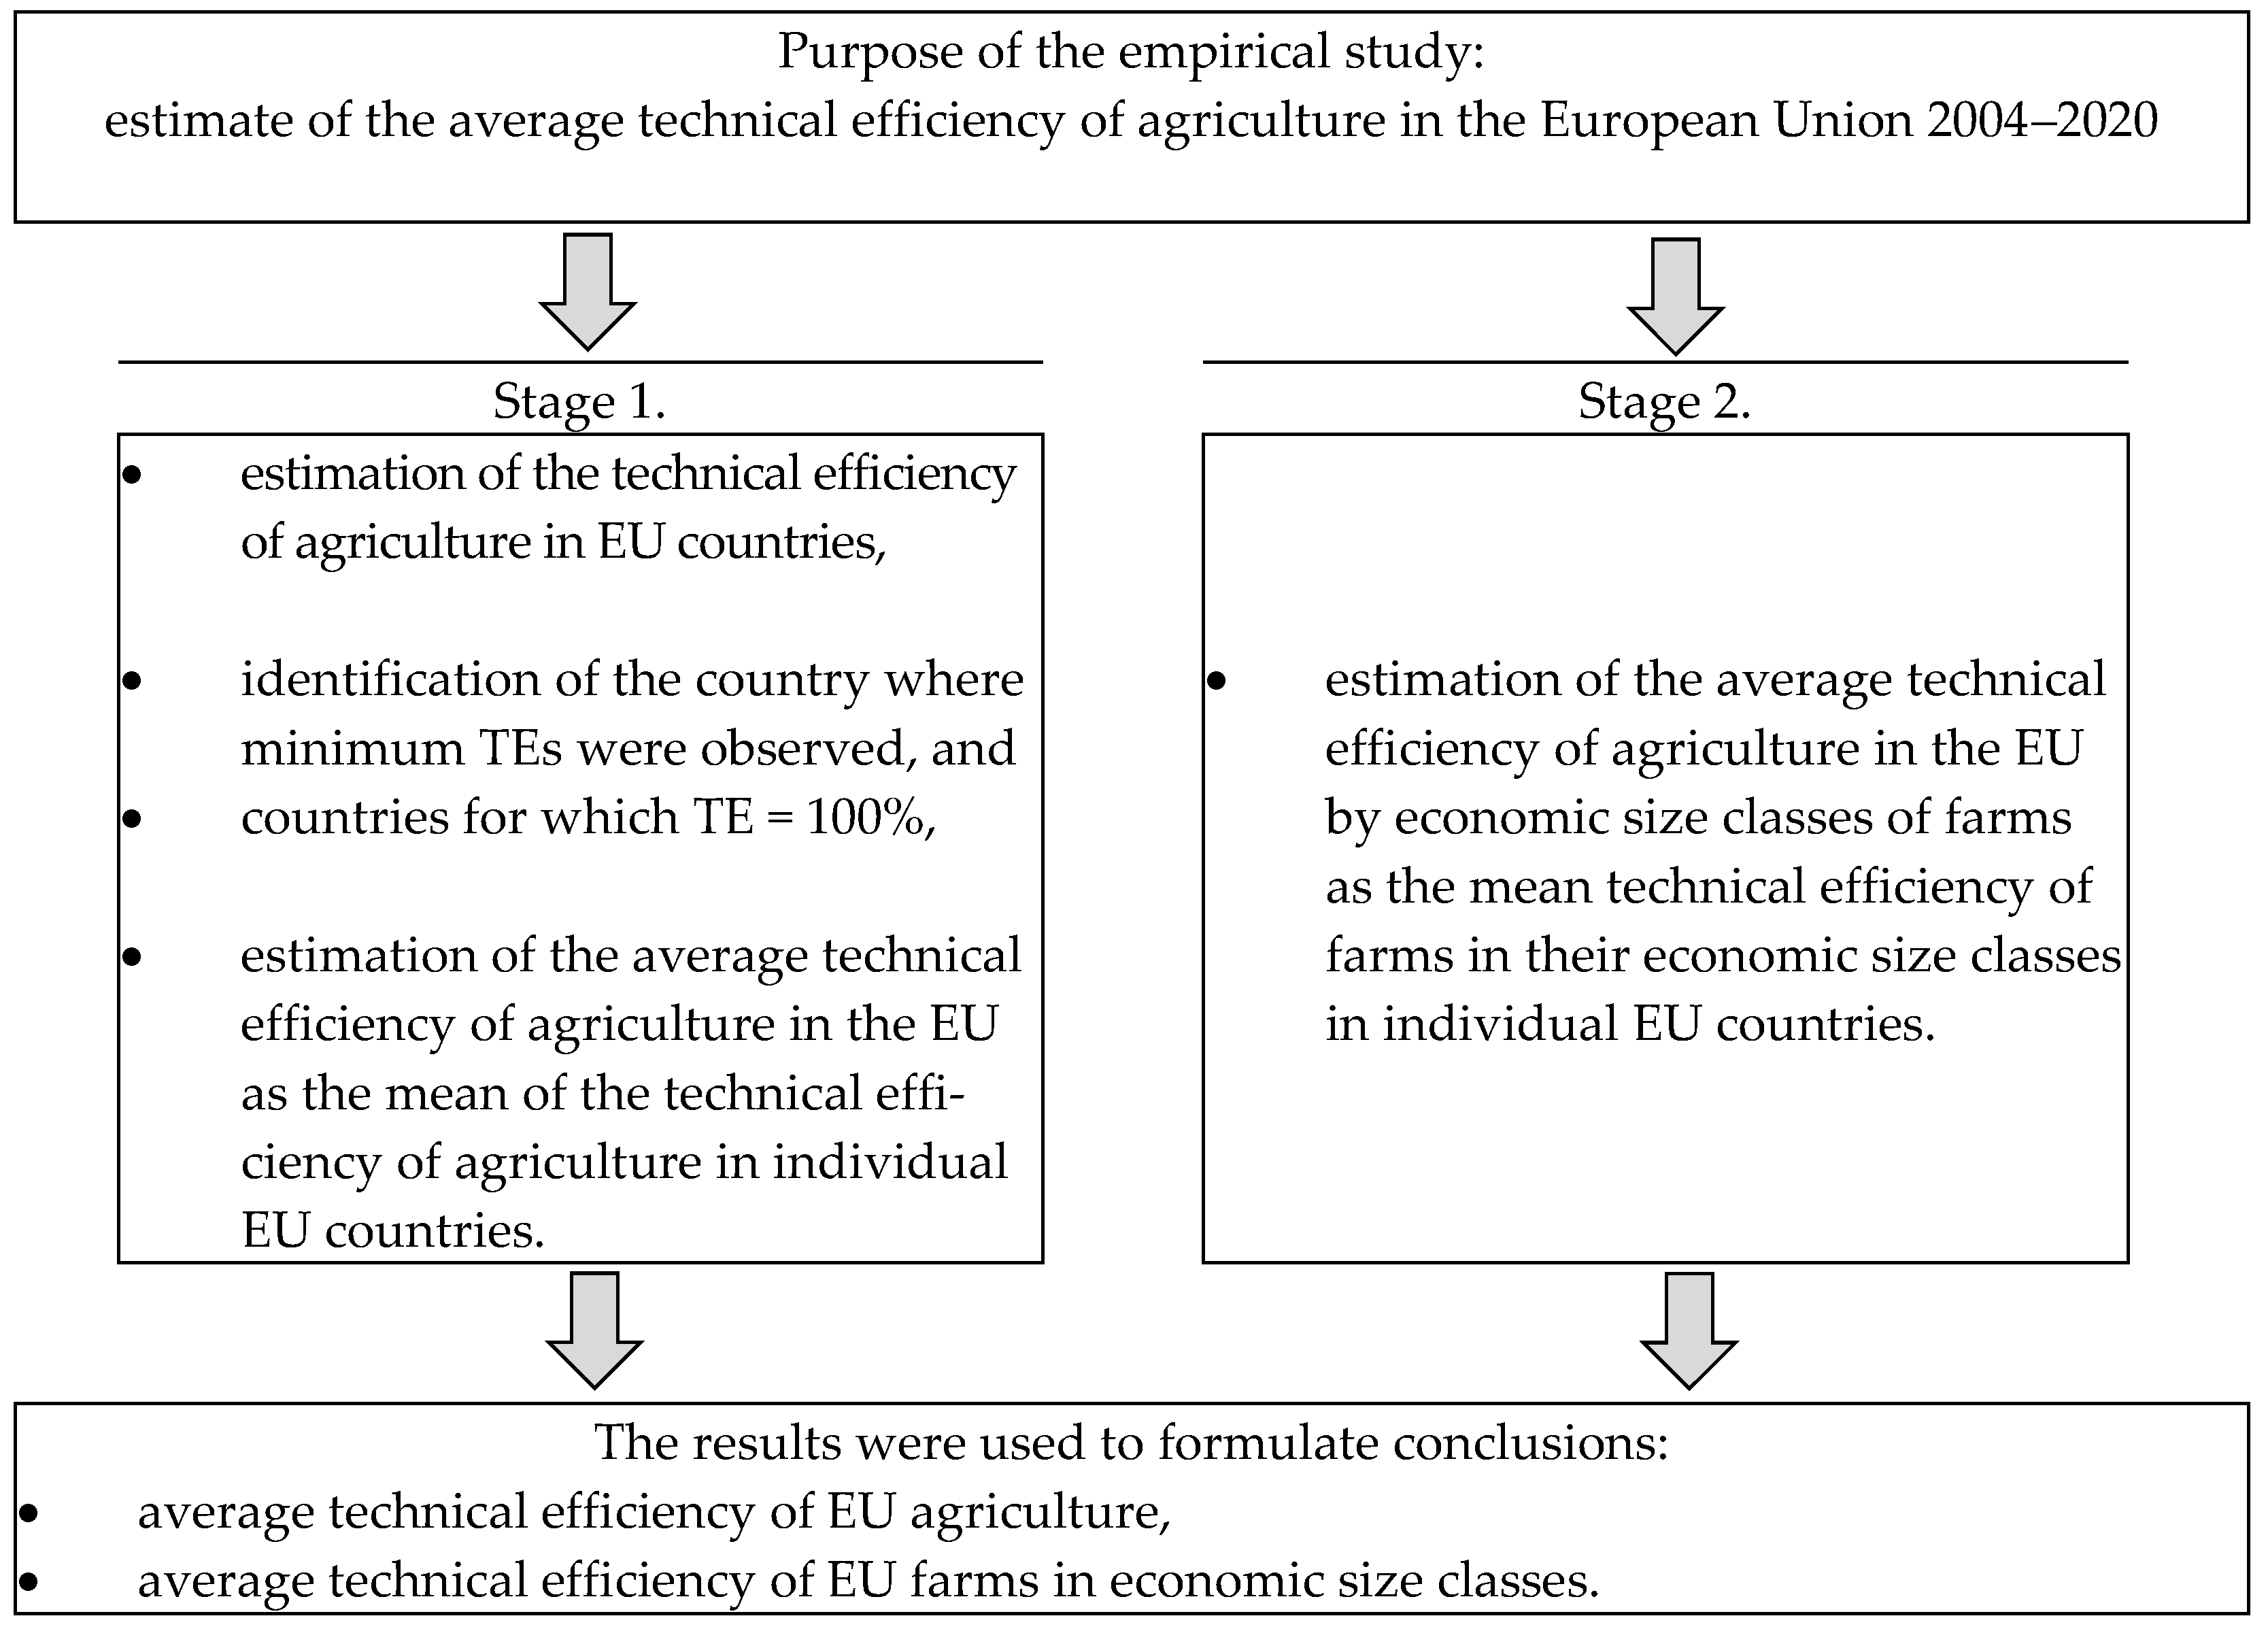
Empirical analyses were carried out according to the following research scheme (
Scheme 1).
4. Results
The analysis of average technical efficiency indicators of agriculture in EU countries showed that, since 2004, agricultural activity in EU countries has been characterized by high average technical efficiency and a relatively large and growing number of fully efficient agricultural sectors in EU countries, i.e., TE = 100%. The results of the average technical efficiency of agriculture in the EU countries in 2004–2020, together with basic statistics, are presented in
Table 1.
The average level of technical efficiency of agriculture in the EU countries in the years 2004–2020 amounted to 90.24%, with the volatility index of 13.57%, and the average number of fully efficient agricultural sectors 13. The difference between the average and minimum level of technical efficiency of agriculture in EU countries in the years 2004–2020 systematically decreased, and it was related to the increase in the level of minimum technical efficiency of agriculture. The average technical efficiency index of agriculture in the EU countries in 2020 is characterized by a slight increase in the average technical efficiency compared to 2004. There are also slight fluctuations throughout the analysis horizon, particularly visible during the global financial crisis of 2008. The year 2008 also had a negative impact on fluctuations in the minimum technical efficiency and the number of efficient agricultural sectors (TE = 100%).
In the second stage of the analysis, it was controlled how the size of farms in EU countries affects the average level of their technical efficiency. For this purpose, data were collected on output of agricultural activity, expressed as Total output and data on inputs: Total utilized agriculture area, Fertilizers, Crop protection, Total livestock units, Feed for grazing livestock, Labor input, Machinery and equipment, and Gross investment on fixed assets, and for economic size classes of farms indicated by FADN, separately for each country. The economic size of the holding is the total standard output of the holding expressed in EUR. Economic size classes were ES6: very small 2000 ≤ EUR < 8000, small 8000 ≤ EUR < 25,000, medium-small 25,000 ≤ EUR < 50,000, medium-large 50,000 ≤ EUR < 100,000, large 1,000,000 ≤ EUR < 500,000, very large EUR ≥ 500,000 [
51]. Using the CCR-IO model, the average level of technical efficiency of agriculture in the analyzed economic size classes of farms was estimated, which provided the basis for determining the average level of technical efficiency of EU farms in the analyzed size classes in the years 2004–2020.
Table 2 presents the average level of technical efficiency achieved by farms classified according to economic size classes in the EU countries.
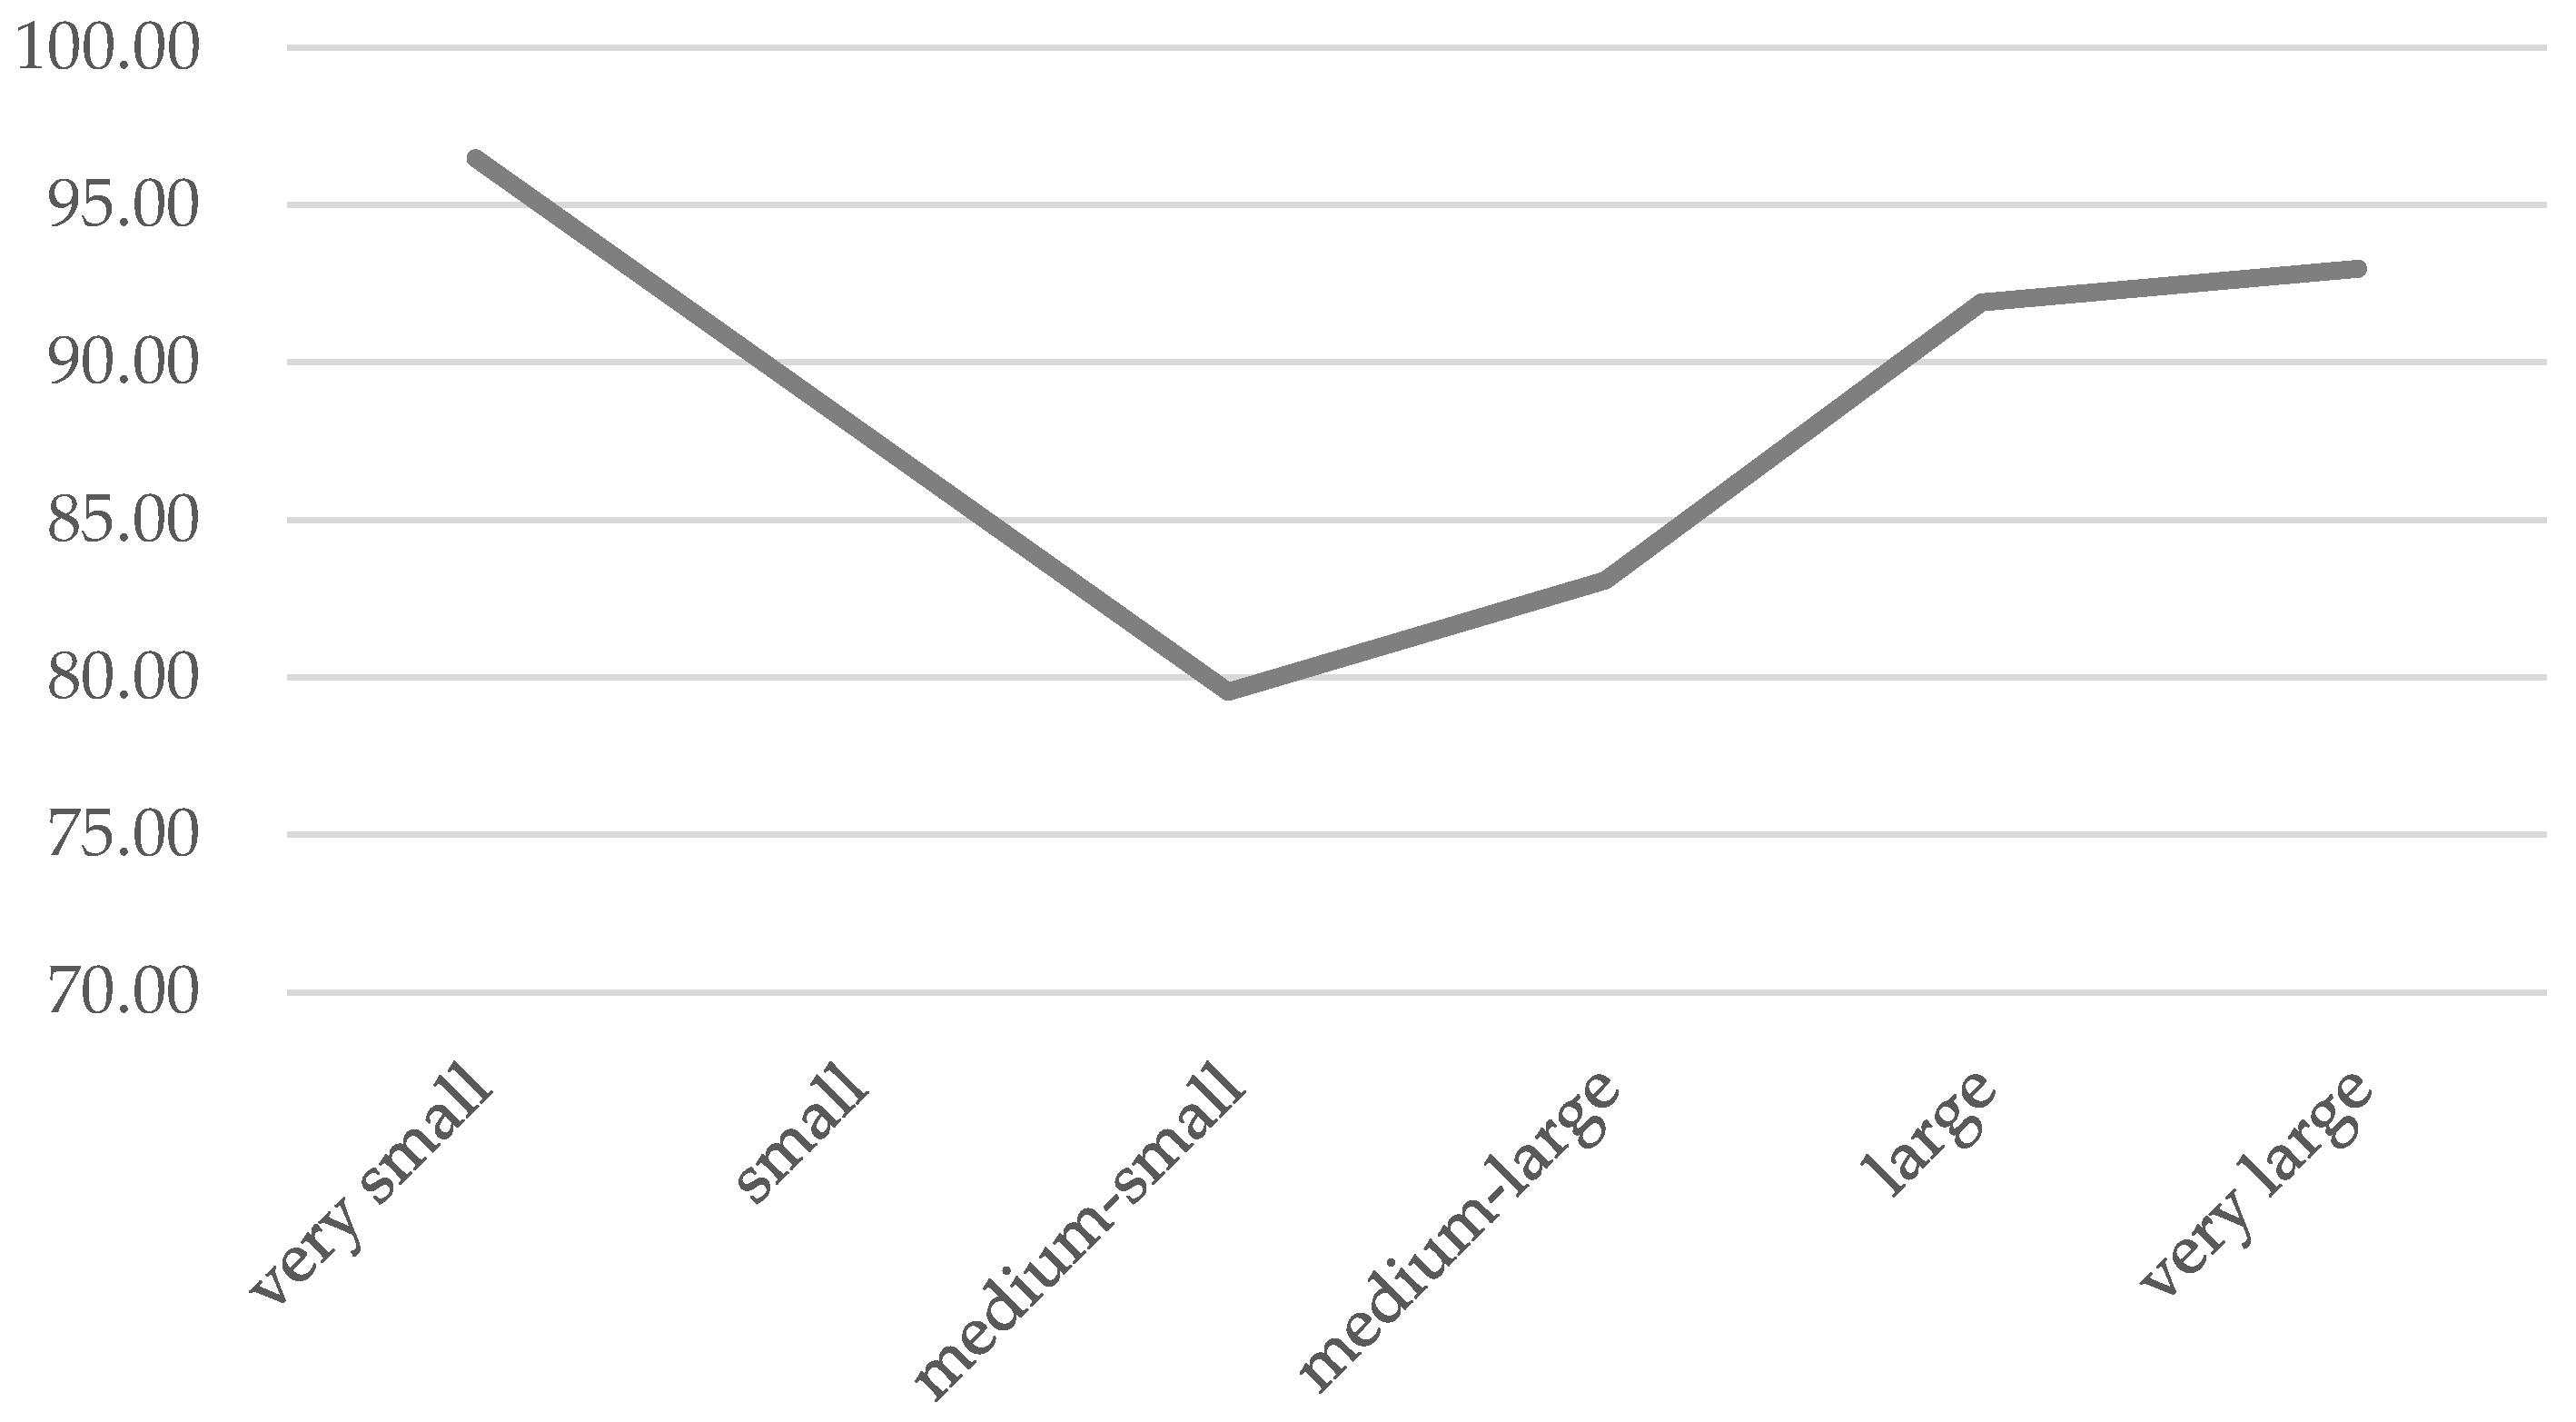
The results of the average technical efficiency by economic size classes of farms allowed the following observations to be made. The highest level of technical efficiency is characteristic of very small farms, i.e., those whose standard production is <EUR 2000; 8000) EUR, reaching an average technical efficiency of 96.49% in 2004–2020, and very large farms, i.e., those whose standard production exceeds EUR 500,000, with an average level of technical efficiency in 2004–2020 of 92.99%. The lowest level of technical efficiency was characteristic of farms in the economic size class 3, i.e., medium-small farms, whose standard production is in the range of <25,000; 50,000) EUR. It was also noticeable that the average difference between the technical efficiency of farms in the highest and the lowest size class amounted to 14.46% on average, which means that in EU countries, very small or very large farms achieve on average 14.46% higher technical efficiency than farms in other size classes. In the scale of all EU countries, this means significant losses in transforming inputs into effects in agriculture. In order to illustrate the scale of technical inefficiency in economic size classes of farms in EU countries,
Figure 2 shows the average technical efficiency of farms in EU countries in 2004–2020 in their economic size classes. The technical efficiency of EU farms indicates that the technical efficiency decreases with the increase in the scale of the economic size. Only when the farm’s standard production exceeds the level of EUR 50,000 does technical efficiency increase. Technical efficiency curves in technical efficiency classes are U-shaped, with a greater disproportion in the level of technical efficiency between economic size classes observed in the last years of the analyses. The observed relationship between the technical efficiency of EU farms and their economic size class prompts further interesting questions regarding the efficiency of the scale of agriculture in the EU, but it is not addressed in this study.
5. Discussion
Economic efficiency in economic sciences is considered in many aspects, because it consists of many factors, the most important of which is technical efficiency. Efficient conversion of inputs into outputs is of key importance in changing the approach to long-term goals, because it allows you to assess the degree of their implementation. A project, enterprise, sector, or economy is considered technically efficient when it makes full use of the available inputs, and it is not possible to achieve a higher level of output under specified technical conditions. Estimating even the simplest measures of technical efficiency makes sense because it allows you to assess the situation of an enterprise or country and is useful in making strategic decisions. In the economic literature, much attention has been devoted to the measurement of technical efficiency. Classic measures refer to average values and assess the technical efficiency of the surveyed enterprise, sector, and country in a one-dimensional way. On the other hand, measures based on cross-sectional data make it possible to assess the level of technical efficiency by placing the enterprise, sector, and country within the boundary conditions of the model. Their estimation requires the use of advanced mathematical methods. The methods based on the best practice boundary curve have gained great popularity in the multidimensional assessment of technical efficiency, and due to its advantages, the Data Envelopment Analysis (DEA) method occupies a leading place among them. The DEA method is a non-parametric method of measuring technical efficiency by solving a linear programming problem. It allows for determining the level of technical efficiency of the tested project, enterprise, or country, at the same time, indicating the possible area of inefficiency. The key issue in determining the technical efficiency using the DEA method is the selection of data describing inputs and output, because the possibility of interpreting the results depends on it. DEA procedures allow inputs and outputs that may relate to environmental or social issues, so that the estimated measure of technical efficiency can also be a measure of the achievement of these goals.
Measuring the technical efficiency of agriculture is an important and constantly up-to-date issue. Technically efficient agriculture guarantees farms the achievement of a satisfactory financial surplus, and at the same time, implements the basic objective of agricultural policy, which is to ensure food security for the population and social order in all agricultural regions of the world. Climate neutrality has directed the agricultural sector’s attention to food production in a less intensive and environmentally friendly way. Modern world agriculture, in addition to economically effective food production, must also produce food in a sustainable manner, i.e., achieve high yields with good production parameters, with the maximum reduction of the use of fertilizers and plant protection products. The measurement of the technical efficiency of agriculture based on the analysis of the boundary function allows for maintaining a balance of production and environmental goals, e.g., by entering fertilizers, plant protection products, and antibiotics into the input account.
Agriculture in the European Union is characterized by a high level of technical efficiency. Initially, the Common Agricultural Policy conducted in the European Union focused on financial support and promotion of highly efficient agriculture. However, the experience of agriculture in highly developed EU countries shows that intensive use of land for agricultural purposes, although it has contributed to the improvement of the food situation, but also resulted in unfavorable changes in the natural environment, climate change, and soil degradation and a reduction in the biodiversity of fauna and flora in the European Union. These observations lead to the general conclusion that intensive agriculture in the EU has increased technical productivity, but created unsustainable ecosystems. Therefore, the debate against climate change is currently one of the most topical challenges of the EU’s Common Agricultural Policy.
The EU’s Common Agricultural Policy is currently conducted as part of the European Green Deal, which, apart from agriculture, includes many elements, i.e., the area of energy and industry and the area of supporting research and supporting innovation. In a broader perspective, it is an integral part of the implementation of the UN Agenda for the Sustainable Development Goals. The European Green Deal in the area of agriculture obliges to develop a strategy and rules of conduct, e.g., in matters of prioritizing ecosystems that provide food, fresh water, and clean air, supporting the growth of biodiversity and increasing the area of protected areas in Europe. Its implementation is based on national strategic studies in the field of reducing the use of pesticides and fertilizers, as well as reclamation of degraded agricultural and forest areas. National strategic plans, despite considerable freedom, must implement the priority needs defined in five problem groups: environmental and climate protection; safe food and healthy consumption; social and economic activation of rural areas; financial support for agricultural income; and raising knowledge, exchange, and innovation system.
The Common Agricultural Policy of the EU has been focused on activities related to the protection of natural resources. Institutional protection includes clean water and air resources and biodiversity. It is still implemented in the classic division of funds, i.e., Pillar I (Direct payments system) and Pillar II (Support for rural areas and communes). So far, proven solutions only modify agricultural support instruments by introducing new practices beneficial for the environment and climate, which are only a supplement to the hitherto used agricultural production support instruments. It provides for institutional restrictions on some of the inputs currently used in agriculture for intensification, i.e., fertilizers, plant protection products and antibiotics. This approach has highlighted the need for their sustainable use, which also means reducing the dose with food safety in mind. Therefore, the Common Agricultural Policy imposes more stringent requirements as to the quality of agricultural products. It promotes a change in the approach to food production, assigning less importance to the appearance and taste of the food produced, and shifting the burden of assessment to the content of nutrients and residues of harmful substances in the food produced. These models are conducive to the dissemination of sustainable methods of agricultural production, i.e., effective production of high-quality food in a way that does not threaten the natural environment. Minimal use of chemicals in agriculture and animal husbandry contributes to improving the quality of food produced and to reducing the negative impact of agricultural production on the environment. All this makes the measurement and assessment of the technical efficiency of EU agriculture particularly topical, as it can be assumed that institutional actions undertaken by the Common Agricultural Policy will permanently change production patterns in the European Union.
The results of the empirical study, the subject of which was the estimation of the average technical efficiency of agriculture in the European Union countries and the answer to the question whether agriculture in the European Union countries, is characterized by an efficient transformation of inputs into outputs and whether the size of farms differentiates the technical efficiency of agriculture in the EU countries, indicated that agriculture in the European Union is characterized by a high average level of technical efficiency. The average annual level of technical efficiency in the years 2004–2020 amounted to 90.24%, and throughout the analysis horizon, its level remains at a relatively similar level, with a tendency to decrease differences of technical efficiency indicators over time. This general conclusion contributed to undertaking detailed analyses, which focused on determining the technical efficiency of farms of economic size classes. Based on the general statement that efficiency increases with the size of farms, a study of technical efficiency was carried out in economic size classes of farms. The results of this study only partially confirmed this hypothesis. It showed that agricultural activity concentrated on very small and very large farms is characterized by higher technical efficiency. This statement suggests that the structure of the agricultural sector, taking into account the economic size of farms, may affect the level of average technical efficiency of agriculture in the European Union and that by improving it, a higher level of technical efficiency can be achieved.
The results of the study are of great cognitive value, but the conclusions drawn on their basis are associated with limitations. The most important limitation is the level of aggregation. Since the main objective of the empirical research was to determine the general level of technical efficiency of agriculture in the EU countries, the analyses focused on a possibly comprehensive approach to agricultural production. Thus, it included the aggregated production of plants and plant products, livestock and animal products, and other agricultural production expressed in monetary units. The level of aggregation does not allow for the formulation of precise conclusions regarding the types of agricultural production, e.g., in the field of technical efficiency of plant production, i.e., field and permanent crops, or animal husbandry. The conclusions of the study allow for posing further interesting questions. What is the technical efficiency of specialized farms, what animals are profitable to breed, and how will the farms of the future be organized? In addition, the directions of further research are set, among others, by the possibility of modifying the DEA methodology. The DEA method allows, on the one hand, for creating rankings of the surveyed entities, which in the case of the agricultural sector of the European Union may be an important element of the assessment of activities implemented under the Common Agricultural Policy. Secondly, the DEA method makes it possible to study the economy of production scale and to search for the optimal farm size. Another equally interesting direction is the use of the DEA method to assess the technical efficiency of sustainable agriculture. In this study, on the input side, typical economic and environmental inputs were introduced, i.e., fertilizers and plant protection products, and the task of linear programming was to minimize them. An interesting direction for future analyses seems to be the inclusion of other important environmental inputs and outputs, e.g., greenhouse gas emissions, manure production, in analyses. In addition, it was indicated that the system of subsidies and incentives for farms under the EU Common Agricultural Policy enables farms to achieve and ensure an appropriate level of economic efficiency, but should not reduce technical efficiency. It seems, therefore, that taking into account subsidies is also an important factor in assessing the technical efficiency of agriculture, which should be taken into account in later analyses.


