Article

Research on the Factors Influencing CO2 Emission Reduction in High-Energy-Consumption Industries under Carbon Peak

1
School of Finance, Henan Finance University, Zhengzhou 451464, China
2
School of Artificial Intelligence, Henan Finance University, Zhengzhou 451464, China
*
Author to whom correspondence should be addressed.
Sustainability 2023, 15(18), 13437; https://doi.org/10.3390/su151813437
Submission received: 17 July 2023 / Revised: 21 August 2023 / Accepted: 28 August 2023 / Published: 7 September 2023

Abstract

:
In the context of reaching peak carbon emissions, it is crucial to develop carbon reduction strategies for high-energy-consuming industries as part of a broader societal transition from dependence on high-pollution energy sources to low-pollution alternatives. This study focuses on carbon emission reduction in the non-ferrous metal industry, which is known for its significant energy consumption. It employs the Logarithmic Mean Divisia Index (LMDI) model to conduct empirical analyses from three perspectives: carbon emission decomposition, regionalization analysis, and carbon emission prediction. The objective is to explore the carbon emission characteristics of high-energy-consuming industries in China and provide theoretical support for future policies aimed at reducing carbon emissions in these industries. The findings reveal that the economic scale of the non-ferrous metal industry has a positive correlation with carbon emissions, while carbon emission coefficients exhibit a negative correlation. Moreover, in the prediction scenarios considered, the increase in carbon emissions resulting from the economic-scale factor accounted for 75.28%, 87.46%, and 65.21% respectively, indicating that it has the most significant influence among all factors analyzed. The study further demonstrates that under stable and active emission reduction scenarios, the future potential for carbon dioxide emission reduction in the non-ferrous metal industry is estimated to reach 858.47 million tons and 1384.65 million tons, respectively. These figures represent twice and three times the emissions recorded in 2021. By analyzing the factors influencing emission reduction, targeted regulations can be implemented to develop practical and effective strategies for reducing carbon emissions in the industry. From the analysis conducted, it can be deduced that high-energy-consuming industries, particularly the non-ferrous metal industry, exhibit relatively high levels of carbon emissions. Consequently, it is imperative to implement proactive measures to reduce these emissions. Additionally, the industry’s carbon emissions are heavily influenced by changes in economic scale due to its high dependence on it. This highlights the importance of considering economic factors when devising strategies to mitigate carbon emissions. Furthermore, the potential for improvement in the non-ferrous metal industry’s energy structure and carbon emission coefficients is limited. Simply relying on technological innovation alone may not suffice to achieve significant emission reduction goals. Therefore, it becomes crucial for the government to develop tailored emission reduction targets and policies based on the industry’s specific circumstances to attain optimal results.

1. Introduction

In recent years, China’s remarkable economic growth has been accompanied by a significant increase in energy consumption and carbon dioxide emissions. It is essential for China to prioritize the development of a low-carbon economy to sustain its domestic economic growth, fulfill its international environmental obligations, and ensure long-term sustainability. Given that the industrial sector is responsible for the largest share of energy consumption and environmental pollution, it is crucial to address this sector during China’s economic development process. One of the primary reasons for this focus is that high-energy-consuming industries often incur substantial energy costs, resulting in significant energy consumption during the production process. Moreover, the production processes of these industries generate various environmental pollutants, which have adverse effects on the natural environment and residents’ health in the surrounding regions [1,2,3]. The non-ferrous metal industry, as a typical high-energy traditional industry, plays a vital role in national infrastructure construction, national economic growth, and China’s industrialization process. The industry relies heavily on coal and electricity as its main energy sources. The extensive use of non-renewable energy sources often leads to a high proportion of carbon dioxide emissions, exacerbating environmental pollution [4,5,6]. Currently, the non-ferrous metal industry encompasses copper, zinc smelting, and aluminum sub-industries. While there has been progress in emission reduction efforts within these sub-industries, overall, there are still deficiencies in reducing carbon emissions and energy consumption. Outdated environmental protection production and monitoring equipment, coupled with the continued use of traditional large-scale smelting equipment, pose challenges for non-ferrous metal enterprises to effectively transition to more sustainable practices [7,8,9]. Given these circumstances, it is imperative to investigate the factors that impact carbon dioxide emissions reduction in the non-ferrous metal industry. Analyzing these factors will facilitate a comprehensive assessment of the industry’s current status in terms of low-carbon development and provide insights for its future sustainable development.
One of the primary factors influencing carbon dioxide emissions reduction in the non-ferrous metal industry is the adoption of advanced technologies. Despite efforts to promote renewable energy use and more efficient production processes, many non-ferrous metal enterprises still heavily rely on outdated methods. These outdated practices not only contribute to increased carbon dioxide emissions, but also hinder companies’ ability to adapt to evolving market conditions. Consequently, providing financial and technical support to facilitate the transition to sustainable practices is crucial. The development of comprehensive regulations and policies aimed at reducing carbon emissions is another important factor. Although some progress has been made, there is still much to be accomplished in this regard. The government should implement stricter regulations and incentivize companies to adopt environmentally friendly practices. This could involve offering tax incentives to companies investing in renewable energy or imposing penalties on those that continue to rely on fossil fuels. Additionally, industry participants themselves play a vital role. Non-ferrous metal enterprises must take responsibility for their environmental impacts and actively promote strategies to reduce their carbon footprint. This can include investing in research and development of new technologies, implementing energy-saving production processes, and embracing a circular economy model to minimize waste and improve resource efficiency. In summary, addressing the challenge of carbon dioxide emissions reduction in the non-ferrous metal industry requires a multifaceted approach. By promoting innovation through technology investments, implementing stringent regulations and policies, and encouraging industry participants to assume responsibility for their environmental impacts, we can pave the way towards a more sustainable future. Only through collective action and cooperative efforts can we successfully tackle this challenge and ensure the long-term viability of our planet for future generations.

2. Related Works

In recent years, there has been a significant surge in research efforts focused on achieving low-carbon sustainable development. Sovacool BK’s team conducted an extensive study on carbon emissions reduction in the power industry. Using a multiple regression analysis with a dataset comprising 123 countries globally, they found that larger nuclear power plants did not have a significant impact on reducing carbon emissions compared to renewable energy sources. Furthermore, they observed a negative correlation between the adoption of nuclear energy and renewable energy, implying that these two technologies are often mutually exclusive. This highlights the importance of considering the interactions between different technologies when developing comprehensive strategies for emission reduction [10]. Another team, led by Li J, aimed to address the global energy crisis and environmental pollution through sustainable means. They conducted a life-cycle assessment of carbon emissions in wind power projects, taking into account the construction and networking phases. The empirical analysis focused on a 49.5 MW wind power project in the Xinjiang region, showing a carbon intensity of 4.429 g/kWh and a potential emission reduction of 2.0416 million tons over its lifecycle. Compared to coal-fired power plants, wind power projects demonstrated significant emission reduction potential, which could contribute to mitigating environmental pollution and global warming issues [11]. West TAP’s team tackled the controversial issue of forest carbon financing plans by comparing the pre-established credit baseline of a voluntary REDD+ project in the Amazon region of Brazil with a counterfactual scenario based on quasi-experimental comprehensive control. Their findings revealed that the deforestation rate assumed by the credit baseline consistently exceeded the counterfactual forest loss. This was attributed to a decrease in deforestation during the early implementation phase of the REDD+ project. The study emphasized the need to strike a balance in forest carbon financing to manage investment risks, ensure environmental integrity, and better coordinate project and national carbon accounting [12]. Jiang Y’s team developed a Stackelberg game model that incorporated consumers’ low carbon sensitivity and channel preferences to explore the relationship between emissions reduction and blockchain investment under a manufacturer-led dual-channel strategy. Through optimal decision-making calculations and simulation analyses, they identified variations in emissions reduction and profits across different dual-channel models. The online direct sales model yielded the highest emissions reduction for manufacturers, while the traditional dual-channel model with retailers achieved the highest profit. Emission reduction investments were primarily driven by manufacturers’ profits and influenced by the benefits and costs associated with low carbon emissions [13]. Moran D’s team combined micro-level research with a multi-regional input–output economic model to estimate the potential effects of various behaviors on the carbon footprint of the entire European Union (EU). The results indicated that the carbon footprint could be reduced by approximately 25%. Three-quarters of this reduction was achieved through emissions reductions within Europe, while one-quarter was attributed to reducing the carbon footprint of imports. The study unveiled the profound impact of consumer behavior on the supply chain and imported carbon, offering a comprehensive method for evaluating consumer energy saving and emission reduction behavior [14]. Murshed M’s team evaluated the impact of energy consumption and other macroeconomic variables on the environment in Bangladesh using the carbon footprint as a measure of environmental welfare. They discovered a positive correlation between total energy consumption, fossil fuel consumption, and natural gas consumption with an increase in carbon footprint levels. However, non-fossil fuel consumption and hydropower consumption were shown to effectively reduce carbon footprint levels. Additionally, the research revealed that economic growth and international trade were associated with an increase in the carbon footprint. These findings underscored the need for Bangladesh to undergo a transition towards clean energy sources to address its environmental challenges. Causal analysis confirmed a one-way causal relationship among total energy consumption, fossil fuel consumption, natural gas consumption, hydropower consumption, economic growth, international trade, and the carbon footprint [2]. Nyambuu U’s team proposed an energy dynamic growth model that accounted for the dynamics of fossil fuel discovery, extraction, and related costs alongside greenhouse gas emissions, incorporating damage coefficients, as well. Their research indicated that carbon-intensive fuels with negative impacts should gradually shift towards renewable energy sources to slow down the rate of emissions growth, aligning with the objectives of the Paris Agreement. It was advised not to continue mining fossil fuels, especially coal, unless their resources or contents are completely depleted [3].
The metal industry, being a traditional high-energy-consuming sector that generates significant pollution, has witnessed a growing focus on pollution control research in recent years. Wang H and their team developed a mixed input–output model to identify high-energy-consuming industries and assess the impact of industrial restructuring on greenhouse gas emissions, considering China’s escalating energy and environmental challenges. The study findings indicate that the effect of industrial structure adjustment on emission intensity is substantial and nonlinear. Moreover, the study suggests that the Chinese government should continue its efforts in promoting structural reforms in the energy supply sector to further reduce greenhouse gas emissions [15]. Ma E and their team conducted empirical research using a quasi-natural experiment stemming from the 2010 education system reform to investigate the impact of local fiscal pressure on carbon emissions. Through the continuous double difference method, the study revealed a significant increase in local carbon emissions due to fiscal pressure. To alleviate financial burdens, local governments regulated high-energy-consuming enterprises and expanded production capacity to generate more tax revenue, consequently leading to noteworthy carbon emissions. This study provides essential insights into the relationship between fiscal pressure and carbon emissions [16]. Xiao’s team employed Shanghai as a case study and utilized a system dynamics model to examine the factors influencing waste treatment, including economic development, population size, emission intensity, treatment structure, and power generation. The study determined that the utilization of landfill gas and improvement in waste classification were the most effective methods for achieving emission reductions, yielding reductions of approximately 88.07% and 85.48%, respectively. Additionally, increasing the incineration rate, reducing garbage generation, and controlling population growth could lead to emission reductions of 72.29%, 30.06%, and 0.30%, respectively. The study recommends the utilization of landfill gas, strengthening waste classification practices, and implementing green initiatives to reduce greenhouse gas emissions [17]. The Logarithmic Mean Divisia Index (LMDI) model has been increasingly applied in carbon emission analysis. Yujie Guo and their team employed the GM (1,1) model to predict total energy consumption in China and used the LMDI method to analyze carbon emissions across various industries from 2015 to 2019 based on the Intergovernmental Panel on Climate Change data. The constructed carbon emission analysis model examined the influence of energy consumption intensity, population size, urbanization level, and electricity carbon emissions on carbon emissions. The results indicated that population size, urbanization level, and electricity carbon emissions promoted the growth of carbon emissions, while energy consumption intensity, rural population share, and industrial structure played a restraining role [18]. Wu X and their team utilized LMDI and GM (1,1) methods to analyze CESEC carbon emissions from 2005 to 2009 and forecasted carbon emissions for 2030. Additionally, a two-dimensional decoupling model was employed to examine the relationship between carbon emissions and economic development. The research revealed that economic output had the main impact on carbon emissions, while the effect of energy intensity alleviated carbon emissions. The study also emphasized the challenging task of carbon reduction by 2030. Ordos achieved a high level of expansion negative decoupling conditions between 2015 and 2019, while other regions exhibited relatively low decoupling conditions. Hence, it is crucial for the region to enhance its emission reduction technologies, particularly for high-carbon-energy sources such as coal; modify its energy consumption structure; and secure government policy support in order to promote carbon reduction [19].
It is evident that there is a lack of comprehensive exploration into the low-carbon and sustainable development of traditional high-energy-consuming industries, particularly the non-ferrous metal industry, in existing research. To address this research gap, this study adopts a novel approach by analyzing the traditional non-ferrous metal industry as a representative of the high-energy-consumption industry. By doing so, it aims to shed light on these overlooked areas and contribute to filling this research void. Furthermore, recent variable analyses on the direction of low-carbon sustainable development have predominantly focused on new energy research and macro regional perspectives, with relatively limited specific analysis on traditional high-energy-consumption industries. This research gap poses a significant challenge. In response, this study utilizes the Logarithmic Mean Divisia Index (LMDI) model to investigate the factors influencing CO2 emission reduction in the non-ferrous metal industry. The application of this model not only introduces new research methods to related fields, but also significantly supplements and advances existing research efforts. This study holds great importance for researchers wishing to comprehend and explore strategies for achieving the low-carbon and sustainable transformation of traditional high-energy-consuming industries.

3. Model Construction

3.1. Theoretical Framework of Variable Analysis

The study titled “Influencing Factors of CO2 Emission Reduction in High Energy Consuming Industries during the Peak Carbon Emissions Period” aims to investigate how the non-ferrous metal industry can achieve CO2 emission reduction amidst the context of peak carbon emissions. To accomplish this objective, three quantitative analysis methods will be employed: the design of a carbon emission decomposition model for the non-ferrous metal industry, the implementation of a regional classification analysis model specific to the non-ferrous metal industry, and the development of a carbon emission prediction model for the same industry. These three methods are grounded in relevant theories and boast scientific rigor and reliability.
Firstly, the design of the carbon emission decomposition models for the non-ferrous metal industry is rooted in ecological theory. This model dissects carbon emissions into distinct components by scrutinizing the production process and energy consumption within the non-ferrous metal industry. As a result, it provides a more accurate assessment of its environmental impact. Simultaneously, this model can offer targeted suggestions for emission reduction to non-ferrous metal enterprises, thereby promoting their sustainable development. This method facilitates companies in better understanding their carbon emissions and formulating more effective measures to reduce them.
Secondly, the regional classification analysis model for the non-ferrous metal industry draws on the theory of Geographic Information Systems (GIS). This model comprehensively analyzes factors such as geographical location, industrial structure, and resource endowment of non-ferrous metal enterprises, ultimately categorizing them based on various regions. Subsequently, tailored emission reduction strategies and policies are formulated according to the unique characteristics and requirements of each region, with the aim of improving the overall environmental performance of the industry. This approach assists governments in gaining a better understanding of the environmental protection scenario in different regions, facilitating the formulation of targeted environmental policies.
Finally, the carbon emission prediction model for the non-ferrous metal industry relies on time series analysis theory. This model leverages historical data analysis and forecasting techniques to predict carbon emissions over a future time span. This feature is pivotal for non-ferrous metal enterprises in developing long-term emission reduction plans and strategies, while also aiding governments in formulating more scientifically grounded environmental policies. Additionally, this method enables the provision of future market opportunities and risk warnings to enterprises, fostering informed business decision making.
In summary, this study employs multiple quantitative analysis methods that intertwine with relevant theories to provide scientific foundations and effective solutions for CO2 emission reduction in the non-ferrous metal industry. These approaches not only enhance companies’ understanding of their carbon emissions, but also support governmental efforts in formulating environmental policies. Future research should further explore effective practices concerning carbon emission reduction in other industries, with the aim of applying these experiences to the non-ferrous metal industry, thereby propelling societal development towards a more sustainable trajectory. Simultaneously, it is imperative to strengthen the promotion and education of environmental awareness, encouraging more individuals to recognize the significance of environmental protection and actively engage in related actions.

3.2. Carbon Emission Decomposition Model Design for the Non-Ferrous Metals Industry

The study selected 2011 to 2022 as the main analysis interval, within which carbon dioxide emissions showed a stable upward trend, as shown in Figure 1.
The research utilizes the LMDI model to develop a decomposition analysis model for assessing CO2 emissions in the non-ferrous metal industry. The LMDI model is a widely used method for decomposing energy consumption, allowing for the analysis of trends in energy consumption changes by breaking it down into various contributing factors. Specifically, the LMDI model can decompose energy consumption based on its structural, intensity, and combinatorial effects [20,21,22]. In the context of this study, the decomposition of CO2 emissions is categorized into four primary factors: carbon emissions, energy intensity, energy structure, and economic scale. The decomposition model obtained by applying four factors to the non-ferrous metal industry for variable refinement is shown in Formula (1).
C = i C i = i C i E i E i E E P P = i C I i E S i E I P
In Formula (1), i represents the type of energy, and C represents the CO2 emissions associated with the total energy output. C i represents the CO2 emissions of a single application energy type. E is the total energy consumption, and E i represents i ’s energy consumption. P represents the total industrial output value. C I i , E S i , and E I , respectively, represent the carbon emission coefficient corresponding to energy consumption, the proportion of single energy in total energy, and energy intensity. The CO2 emissions between the reference year and year T during the research period are shown in Formula (2).
Δ C T = C T C 0 = Δ C I e f f e c t T + Δ E S e f f e c t T + Δ E I e f f e c t T + Δ P e f f e c t T
In Formula (2), C I e f f e c t T represents the role of the carbon emission coefficient from the base year to year T , E S e f f e c t T represents the role of energy structure from the base year to year T , E I e f f e c t T represents the role of energy intensity from the base year to year T , and P e f f e c t T represents the role of economic scale from the base year to year T . The single annual CO2 emissions are shown in Formula (3).
Δ C = C T + 1 C T = Δ C I e f f e c t + Δ E S e f f e c t + Δ E I e f f e c t + Δ P e f f e c t
In Formula (3), C I e f f e c t represents the role of the carbon emission coefficient in a single year, E S e f f e c t represents the role of the energy structure in a single year, E I e f f e c t represents the role of energy intensity in a single year, and P e f f e c t represents the role of economic scale in a single year. The variation of carbon emission coefficient factors in the model is shown in Formula (4).
Δ C I e f f e c t T = [ ( C i T C i 0 ) / ( ln C i T ln C i 0 ) ] ln ( C I i T / C I i 0 )
The changes in energy structure factors in the model are shown in Formula (5).
Δ E S e f f e c t T = [ ( C i T C i 0 ) / ( ln C i T ln C i 0 ) ] ln ( E S i T / E S i 0 )
The changes in energy structure factors in the model are shown in Formula (6).
Δ E I e f f e c t T = [ ( C i T C i 0 ) / ( ln C i T ln C i 0 ) ] ln ( E I i T / E I i 0 )
The changes in energy structure factors in the model are shown in Formula (7).
Δ P e f f e c t T = [ ( C i T C i 0 ) / ( ln C i T ln C i 0 ) ] ln ( P i T / P i 0 )

3.3. Regional Classification Analysis Model for the Non-Ferrous Metal Industry

Using a single LMDI model alone is insufficient for accurately analyzing CO2 emissions in the non-ferrous metal industry at the provincial level, and it becomes even more challenging to compare emissions differences between different regions. Additionally, there is currently no universal standard for assessing CO2 emission reduction performance across different regions [23,24,25]. Due to variations in regional distribution and promotion strategies, a single aggregate measure of total carbon emissions cannot be used to gauge the carbon reduction status of different regions effectively. To comprehensively and precisely evaluate changes in CO2 emissions, it is necessary to thoroughly consider the factors that influence these changes [26,27]. Therefore, a regionalized classification analysis model is proposed to classify the carbon dioxide emissions of the non-ferrous metal industry in various provinces based on the number of positive influencing factors and their respective changes. This model includes four factors that contribute to emissions, with the number of positive influencing factors serving as the vertical axis, ranging from 0 to 4. The change in CO2 emissions is represented on the horizontal axis, with positive values indicating an increase and negative values indicating a decrease. Figure 2 illustrates this model and its graphical representation.
Furthermore, it is important to emphasize that positive factors primarily contribute to an increase in total emissions. If all influencing factors are positive, the total carbon dioxide emissions will inevitably be in an upward trajectory. Conversely, when the positive factor is 0, it indicates that carbon dioxide emissions cannot be increasing. Similarly, when the positive factor is 4, it signifies that carbon dioxide emissions cannot be decreasing. As a result, different regions can be classified into eight distinct types, as illustrated below.
In Figure 3, Δ c represents the emission changes during the study period. If Δ c is greater than 0, emissions tend to grow. If Δ c is greater than 0, emissions tend to decrease. n represents the number of positive influencing factors. The study mainly distinguishes eight types. The higher the classification type of a province, the more severe the emissions change, and the more positive influencing factors there are. Among them, the province with type A showed the best performance in reducing carbon dioxide emissions, including 0 positive influencing factors. The carbon dioxide emissions of type D show a downward trend, but the number of positive influencing factors has increased to three. The increase in carbon dioxide emissions of type E includes one positive influencing factor. Type H has the worst performance, with an increase in carbon dioxide emissions, including four positive influencing factors.

3.4. Carbon Emission Prediction Model for the Non-Ferrous Metal Industry

The study used scenario prediction analysis to predict carbon emissions in the non-ferrous metal industry by the LMDI. The emission prediction formula is shown in Formula (8).
C t = C 0 + Δ P e f f e c t + Δ E I e f f e c t + Δ E S e f f e c t + Δ C I e f f e c t
In Formula (8), C 0 is the emission value of year 0, i.e., the base year; Δ P e f f e c t is the emission change of economic scale; Δ E I e f f e c t refers to the carbon emission change of energy intensity; Δ E S e f f e c t refers to the carbon emission change of energy structure; and Δ C I e f f e c t refers to the carbon emission change of the carbon emission coefficient. Assuming that the target year is t , the growth rate of economic scale from the base year to the target year is α , the growth rate of energy intensity is β , the proportion of the i energy is γ i , and the carbon dioxide emission coefficient of the i energy is δ i . The economic scale of the target year can be calculated as:
P t = P 0 ( 1 + α )
The energy intensity can be calculated by Formula (10).
E I t = E I 0 ( 1 + β )
The proportion of a single energy source can be calculated using Formula (11).
E S t = E S 0 ( 1 + γ i )
The proportion of the carbon emission coefficient can be calculated using Formula (12).
C I t = C I 0 ( 1 + δ i )
On this basis, the carbon emission changes of economic scale can be obtained as shown in Formula (13).
Δ P e f f e c t = C i [ ( 1 + α ) ( 1 + β ) ( 1 + γ i ) ( 1 + δ i ) 1 ] L n [ ( 1 + α ) ( 1 + β ) ( 1 + γ i ) ( 1 + δ i ) ] L N ( 1 + α )
The carbon emission change of energy intensity is shown in Formula (14).
Δ E I e f f e c t = C i [ ( 1 + α ) ( 1 + β ) ( 1 + γ i ) ( 1 + δ i ) 1 ] L n [ ( 1 + α ) ( 1 + β ) ( 1 + γ i ) ( 1 + δ i ) ] L N ( 1 + β )
The carbon emission changes in the energy structure are shown in Formula (15).
Δ E S e f f e c t = C i [ ( 1 + α ) ( 1 + β ) ( 1 + γ i ) ( 1 + δ i ) 1 ] L n [ ( 1 + α ) ( 1 + β ) ( 1 + γ i ) ( 1 + δ i ) ] L N ( 1 + γ i )
The change in carbon emissions of the emission coefficient is shown in Formula (16).
Δ C I e f f e c t = C i [ ( 1 + α ) ( 1 + β ) ( 1 + γ i ) ( 1 + δ i ) 1 ] L n [ ( 1 + α ) ( 1 + β ) ( 1 + γ i ) ( 1 + δ i ) ] L N ( 1 + δ i )
Using this model, researchers can make predictions about the future levels of carbon dioxide emissions at specific target time points. Furthermore, the model allows for quantifying the contributions of various influencing factors during the prediction process. In this study, three distinct scenarios were established to conduct a comprehensive comparative analysis. The factors of carbon emission, energy intensity, energy structure, and economic scale in each scenario were set based on the existing annual average growth rate. Figure 4 illustrates the three scenarios.
In Figure 4, the study focuses on three main scenarios: the baseline scenario, high-emission scenario, and low-emission scenario. These scenarios are hypothetical representations that aim to predict future trends in energy development. They provide valuable reference points for government and business entities when formulating sustainable energy plans. The prediction period for these scenarios is based on the year 2033, ten years from now. The baseline scenario serves as the foundation for future predictions, assuming that various influencing factors will follow historical trends. Specifically, when calculating the energy structure, the annual growth rate of energy consumption for different sources is determined based on past trends. This allows for the estimation of the proportion of energy consumption by 2033. Similarly, carbon emission coefficients for electricity and other energy sources are adjusted according to corresponding annual growth rates. The baseline scenario provides a relatively basic framework for the subsequent high-emission and low-emission scenarios. The high-emission scenario builds upon the baseline scenario and assumes that China’s non-ferrous metal industry will have significantly higher carbon dioxide emissions by 2033. In this scenario, both energy scale and energy intensity are projected to grow at a 2% annual rate above the baseline scenario. Additionally, it is assumed that the carbon emission coefficient of electricity will increase by 2% annually, while the growth rate of other energy sources remains unchanged. Consequently, the high-emission scenario reflects a future where energy extraction and usage are more frequent and extensive compared to the baseline scenario, resulting in increased pressure on carbon emissions. Conversely, the low-emission scenario also starts from the baseline scenario, but predicts lower carbon dioxide emissions in China’s non-ferrous metal industry by 2033. This particular scenario assumes that the annual growth rate of energy scale and energy intensity is 2 percentage points below the baseline, and the annual growth rate of the carbon emission coefficient of electricity is also 2 percentage points lower than the baseline. The annual growth rate of other energy sources remains unchanged. As a result, the low-emission scenario indicates a future where energy consumption and carbon emissions decrease, contributing to improved environmental quality. In summary, these three scenarios offer distinct estimations in different directions for future energy development. They provide valuable insights into future energy market and environmental trends, while also serving as a scientific basis for formulating sustainable energy plans in the future.

4. Empirical Analysis

4.1. Carbon Emissions Decomposition Analysis

The study selected the period from 2012 to 2022 as the main data decomposition period, and the specific decomposition results for the period from 2012 to 2016 are shown in Table 1.
In Table 1, the change value of carbon emissions shows a gradual upward trend. Under this trend, the contribution rate of energy intensity shows an upward trend, while the contribution rate of economic scale shows a downward trend. The specific decomposition results for the period from 2017 to 2022 are shown in Table 2.
In Table 2, it is observed that an increase in economic scale leads to higher emissions, while a decrease in economic scale results in reduced carbon emissions. Specifically, the expansion of the non-ferrous metal industry has a significant impact on emissions. The proportion of this impact on the economic scale is the highest among all the years analyzed. Notably, in 2018, the carbon emissions attributed to the economic scale experienced the most substantial change, reaching 66,087,600 tons. On average, from 2012 to 2022, CO2 emissions caused by the economic scale accounted for 63% of the total changes. Table 3 presents the results of provincial regional decomposition from 2012 to 2016.
According to the data in Table 3, changes in the economic scale are the key factor leading emissions increasing in most provinces of the country, and this situation exists in all provinces. The decomposition results of provincial-level regions from 2017 to 2022 are shown in Table 4.
Table 3 and Table 4 provide insights into the impact of economic scale and energy structure changes on carbon dioxide (CO2) emissions across different years. When considering economic scale, the expansion in Henan province had the most significant effect on CO
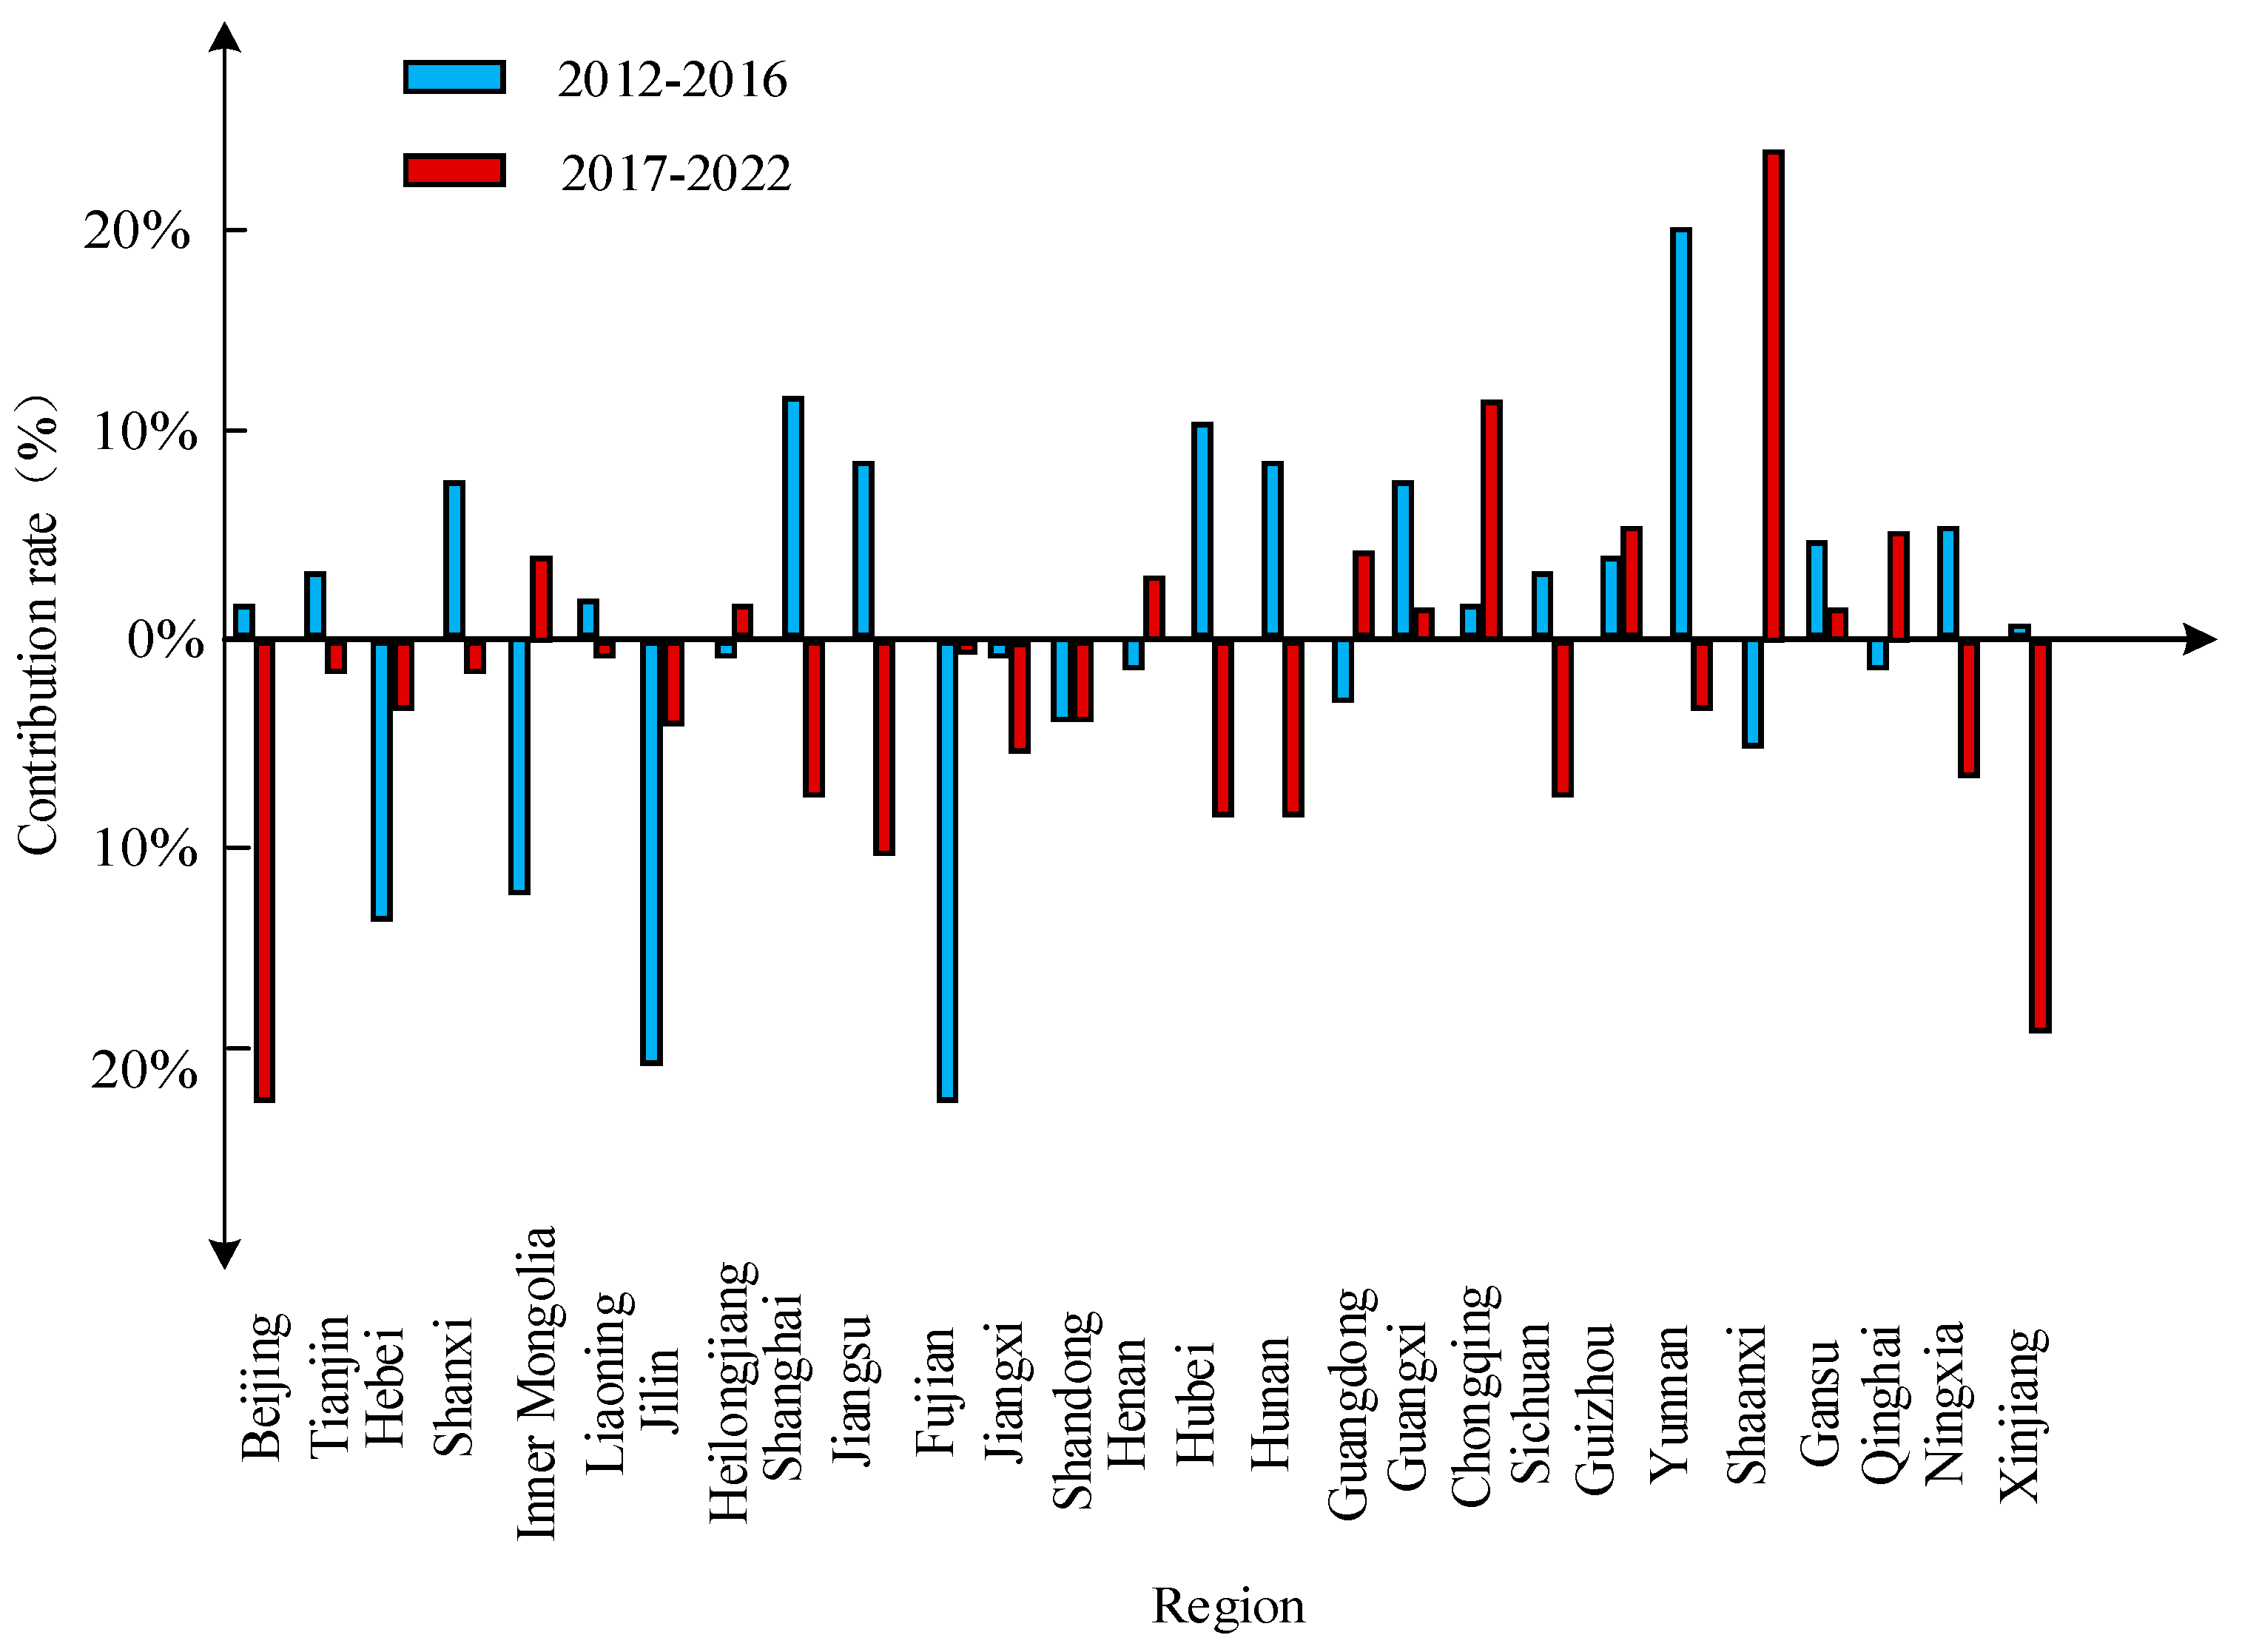
2 emissions. Specifically, the industry’s expansion contributed to 260,836 tons and 43.8477 million tons of emissions, accounting for 75% and 69% of the total emission changes, respectively. The analysis also reveals substantial differences in the influence of changes in energy structure on carbon dioxide emissions among various provinces. Enhancing energy intensity plays a crucial role in reducing emissions and is one of the factors with the most substantial negative impact on carbon dioxide emissions. Additionally, the reduction of the carbon dioxide emission coefficient is another critical factor contributing to the decrease in carbon dioxide emissions. Figure 5 visually represents the contribution rates of changes in carbon dioxide emissions across different regions in the non-ferrous metal industry.

4.2. Regionalization Classification of the Non-Ferrous Metals Industry

The regional classification analysis results of the non-ferrous metal industry from 2012 to 2016 are shown in Table 5.
All provinces have been categorized into five types: B, C, E, F, and G. Throughout the research period, approximately half of the provinces fell under type F, which is higher than any other category. This indicates that the prospects for reducing carbon emissions are not optimistic in these regions. The regional classification analysis results from 2017 to 2022 are presented in Table 6.
In addition, the number of provinces belonging to types B and G increased during the second stage, while the number of provinces performing best and worst also increased, indicating a differentiation in carbon emissions among provinces during the second research stage.

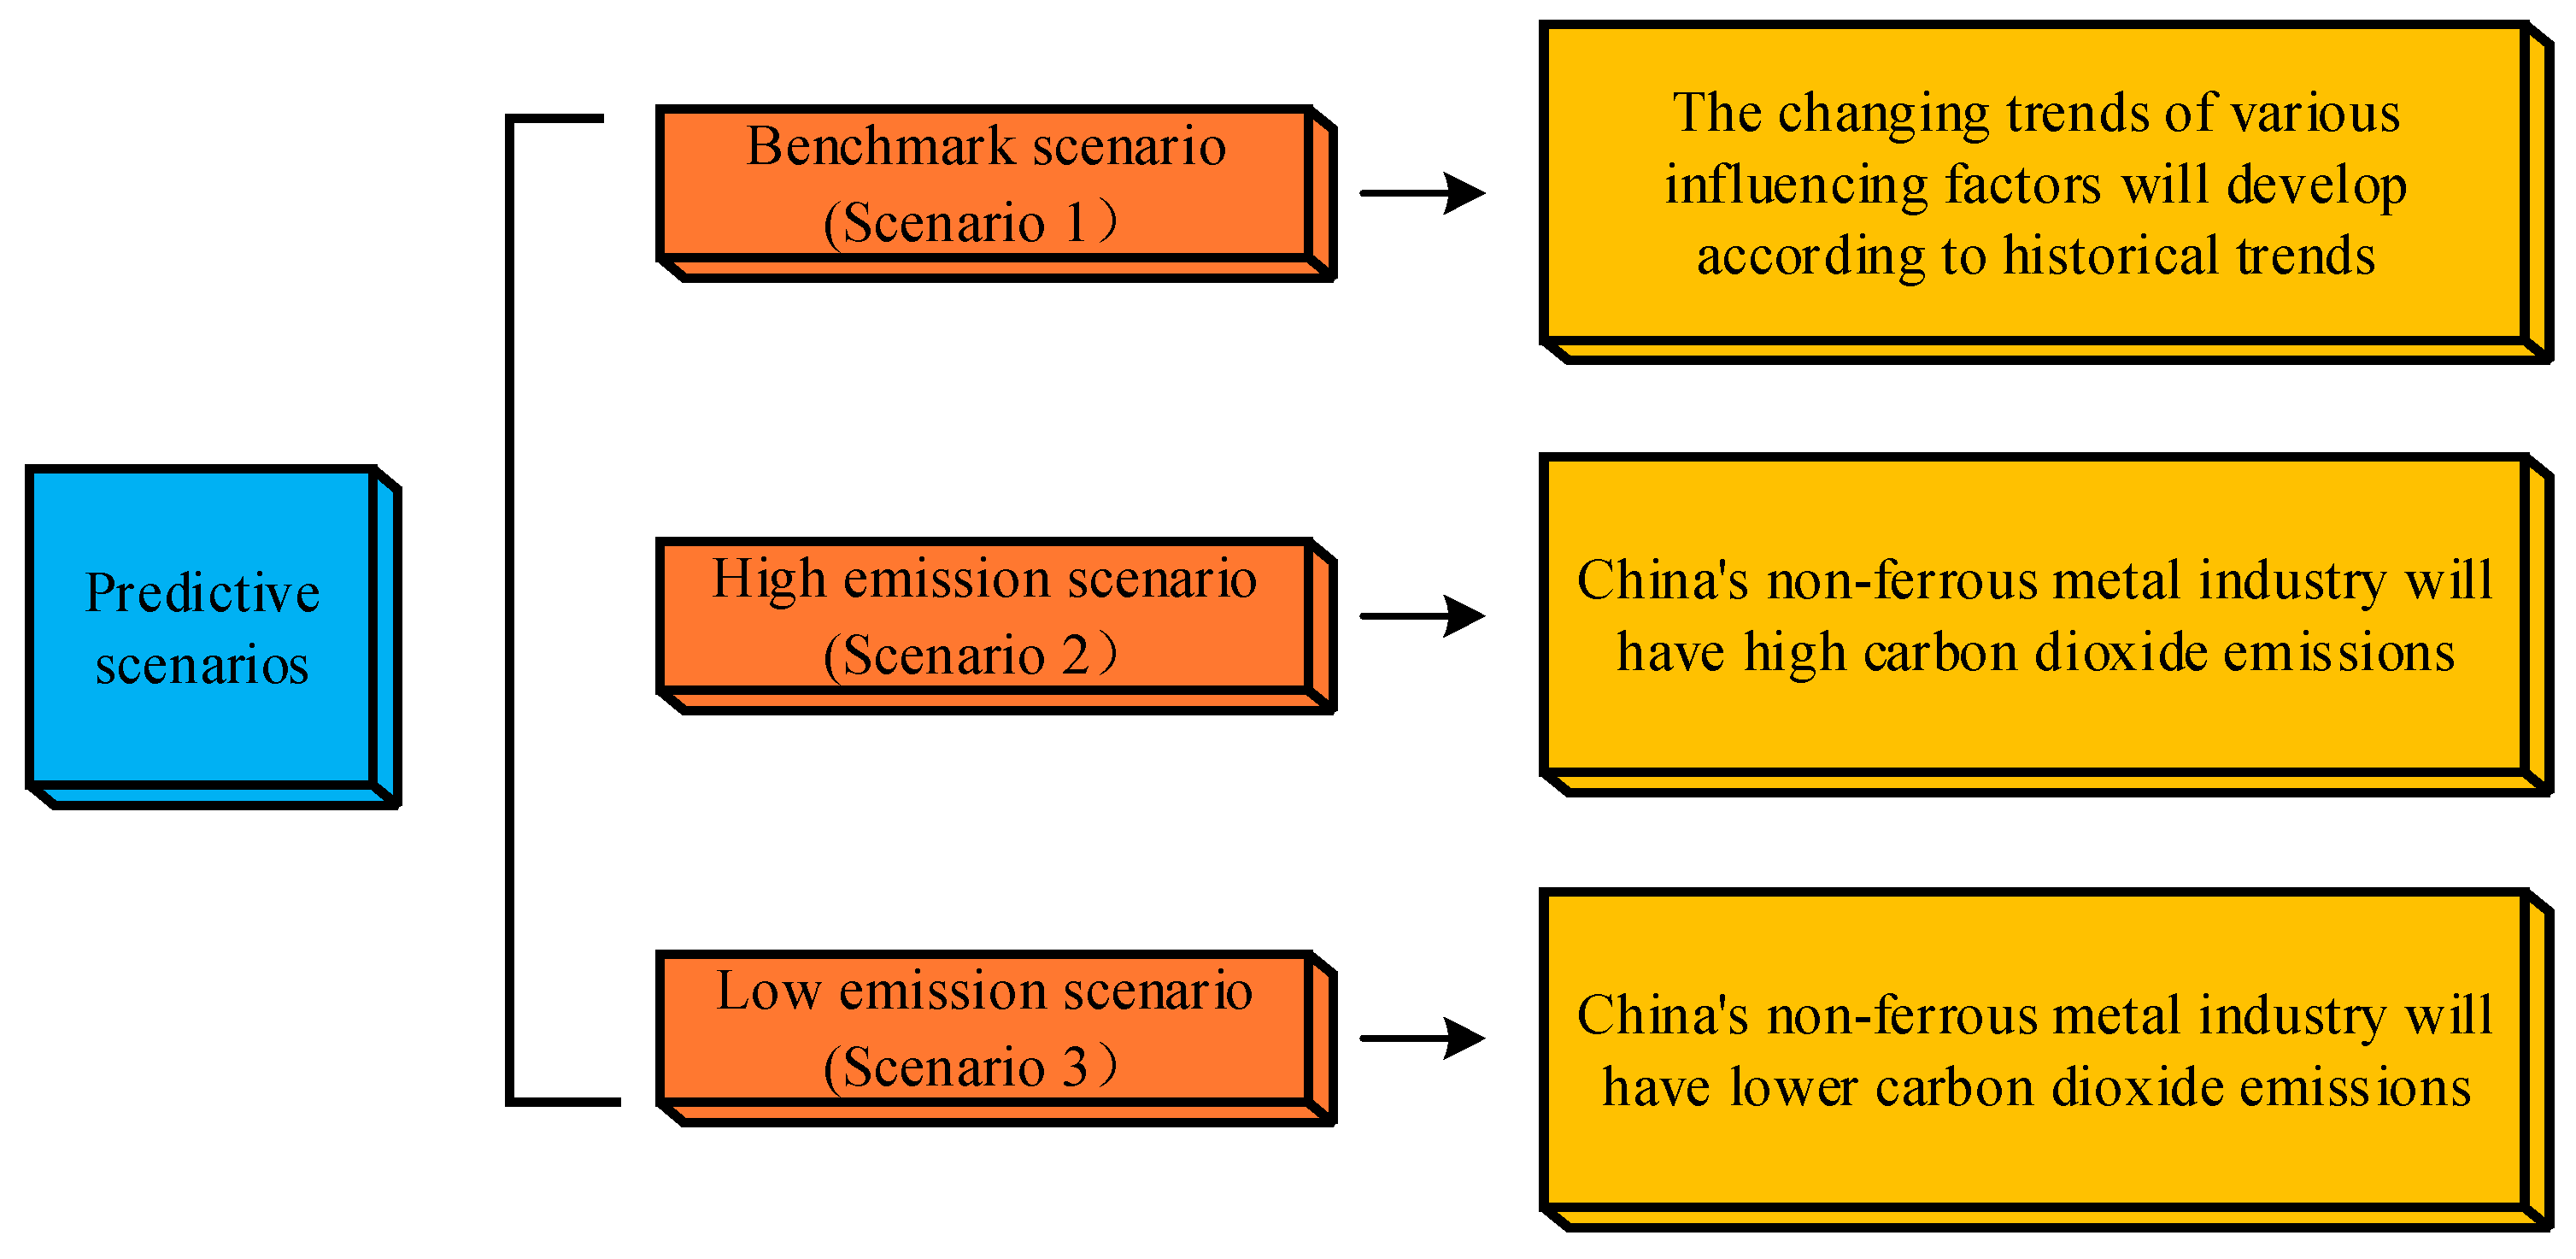
4.3. Carbon Emissions Prediction and Analysis in the Non-Ferrous Metal Industry

The carbon emission prediction analysis results under the first and second scenarios are shown in Figure 6.
In the first scenario, based on the model’s prediction, carbon emissions are projected to increase by 1028.23 million tons by 2033 compared to the levels in 2022. This represents a significant growth rate of up to 245%. In the second scenario, assuming a two-percentage-point increase in the economic scale, energy intensity, power growth rate, and power emission coefficient of the non-ferrous metals industry compared to the original situation, the model calculates a considerable increase in carbon emissions. By 2033, carbon emissions are estimated to have risen by 1886.88 million tons compared to the growth observed in 2011, reflecting a growth rate of 449%. Conversely, if the economic scale, energy intensity, power growth rate, and power emission coefficient of the non-ferrous metals industry are two percentage points lower than the original situation, the model predicts a comparatively smaller increase in carbon emissions. By 2033, the carbon emissions are projected to rise by 502.08 million tons, or 119%, compared to the levels in 2022. A detailed comparison of the influence and variation values of each factor is provided in Table 7.
Among the three scenarios, the expansion of the economic scale primarily drives the increase in carbon emissions. In Scenario 1, the contribution of the economic scale to the carbon emissions increase accounts for 75.28% of all factors. In Scenario 2 and Scenario 3, although the impact of the economic scale has increased and decreased, respectively, its contribution proportion among all factors remains significant at 87.46% and 65.21%, respectively. Both the energy structure and carbon emission coefficient have a modest, but positive, effect on reducing carbon dioxide emissions. However, their impact is relatively small. In all three scenarios, their contribution to total carbon emissions does not exceed 8%. To assess the feasibility of reducing carbon dioxide emissions in China’s non-ferrous metal industry, two scenarios have been formulated: a stable emission reduction scenario and a positive emission reduction scenario. The implementation of the stable emission reduction scenario would result in a shift from Scenario 2 to Scenario 1 in terms of carbon dioxide emissions in the non-ferrous metal industry. On the other hand, adopting the positive emission reduction scenario would lead to a shift from Scenario 2 to Scenario 3 in terms of emissions changes. Table 8 presents the potential for emissions reduction in both scenarios.
As the carbon dioxide emission factor increases, the predicted carbon dioxide emissions by the model will also increase accordingly; this indicates that the model has a certain sensitivity to changes in carbon dioxide emission factors. As the energy intensity factor increases, the carbon dioxide emissions predicted by the model will also increase accordingly; this indicates that the model also has a certain sensitivity to changes in energy intensity factors. As the energy structure factor increases, the carbon dioxide emissions predicted by the model will decrease; this indicates that the model has a certain sensitivity to changes in energy structure factors. As the economic scale factor increases, the carbon dioxide emissions predicted by the model will increase; this indicates that the model has a certain sensitivity to changes in economic scale factors.
In Table 9, the potential to reduce CO
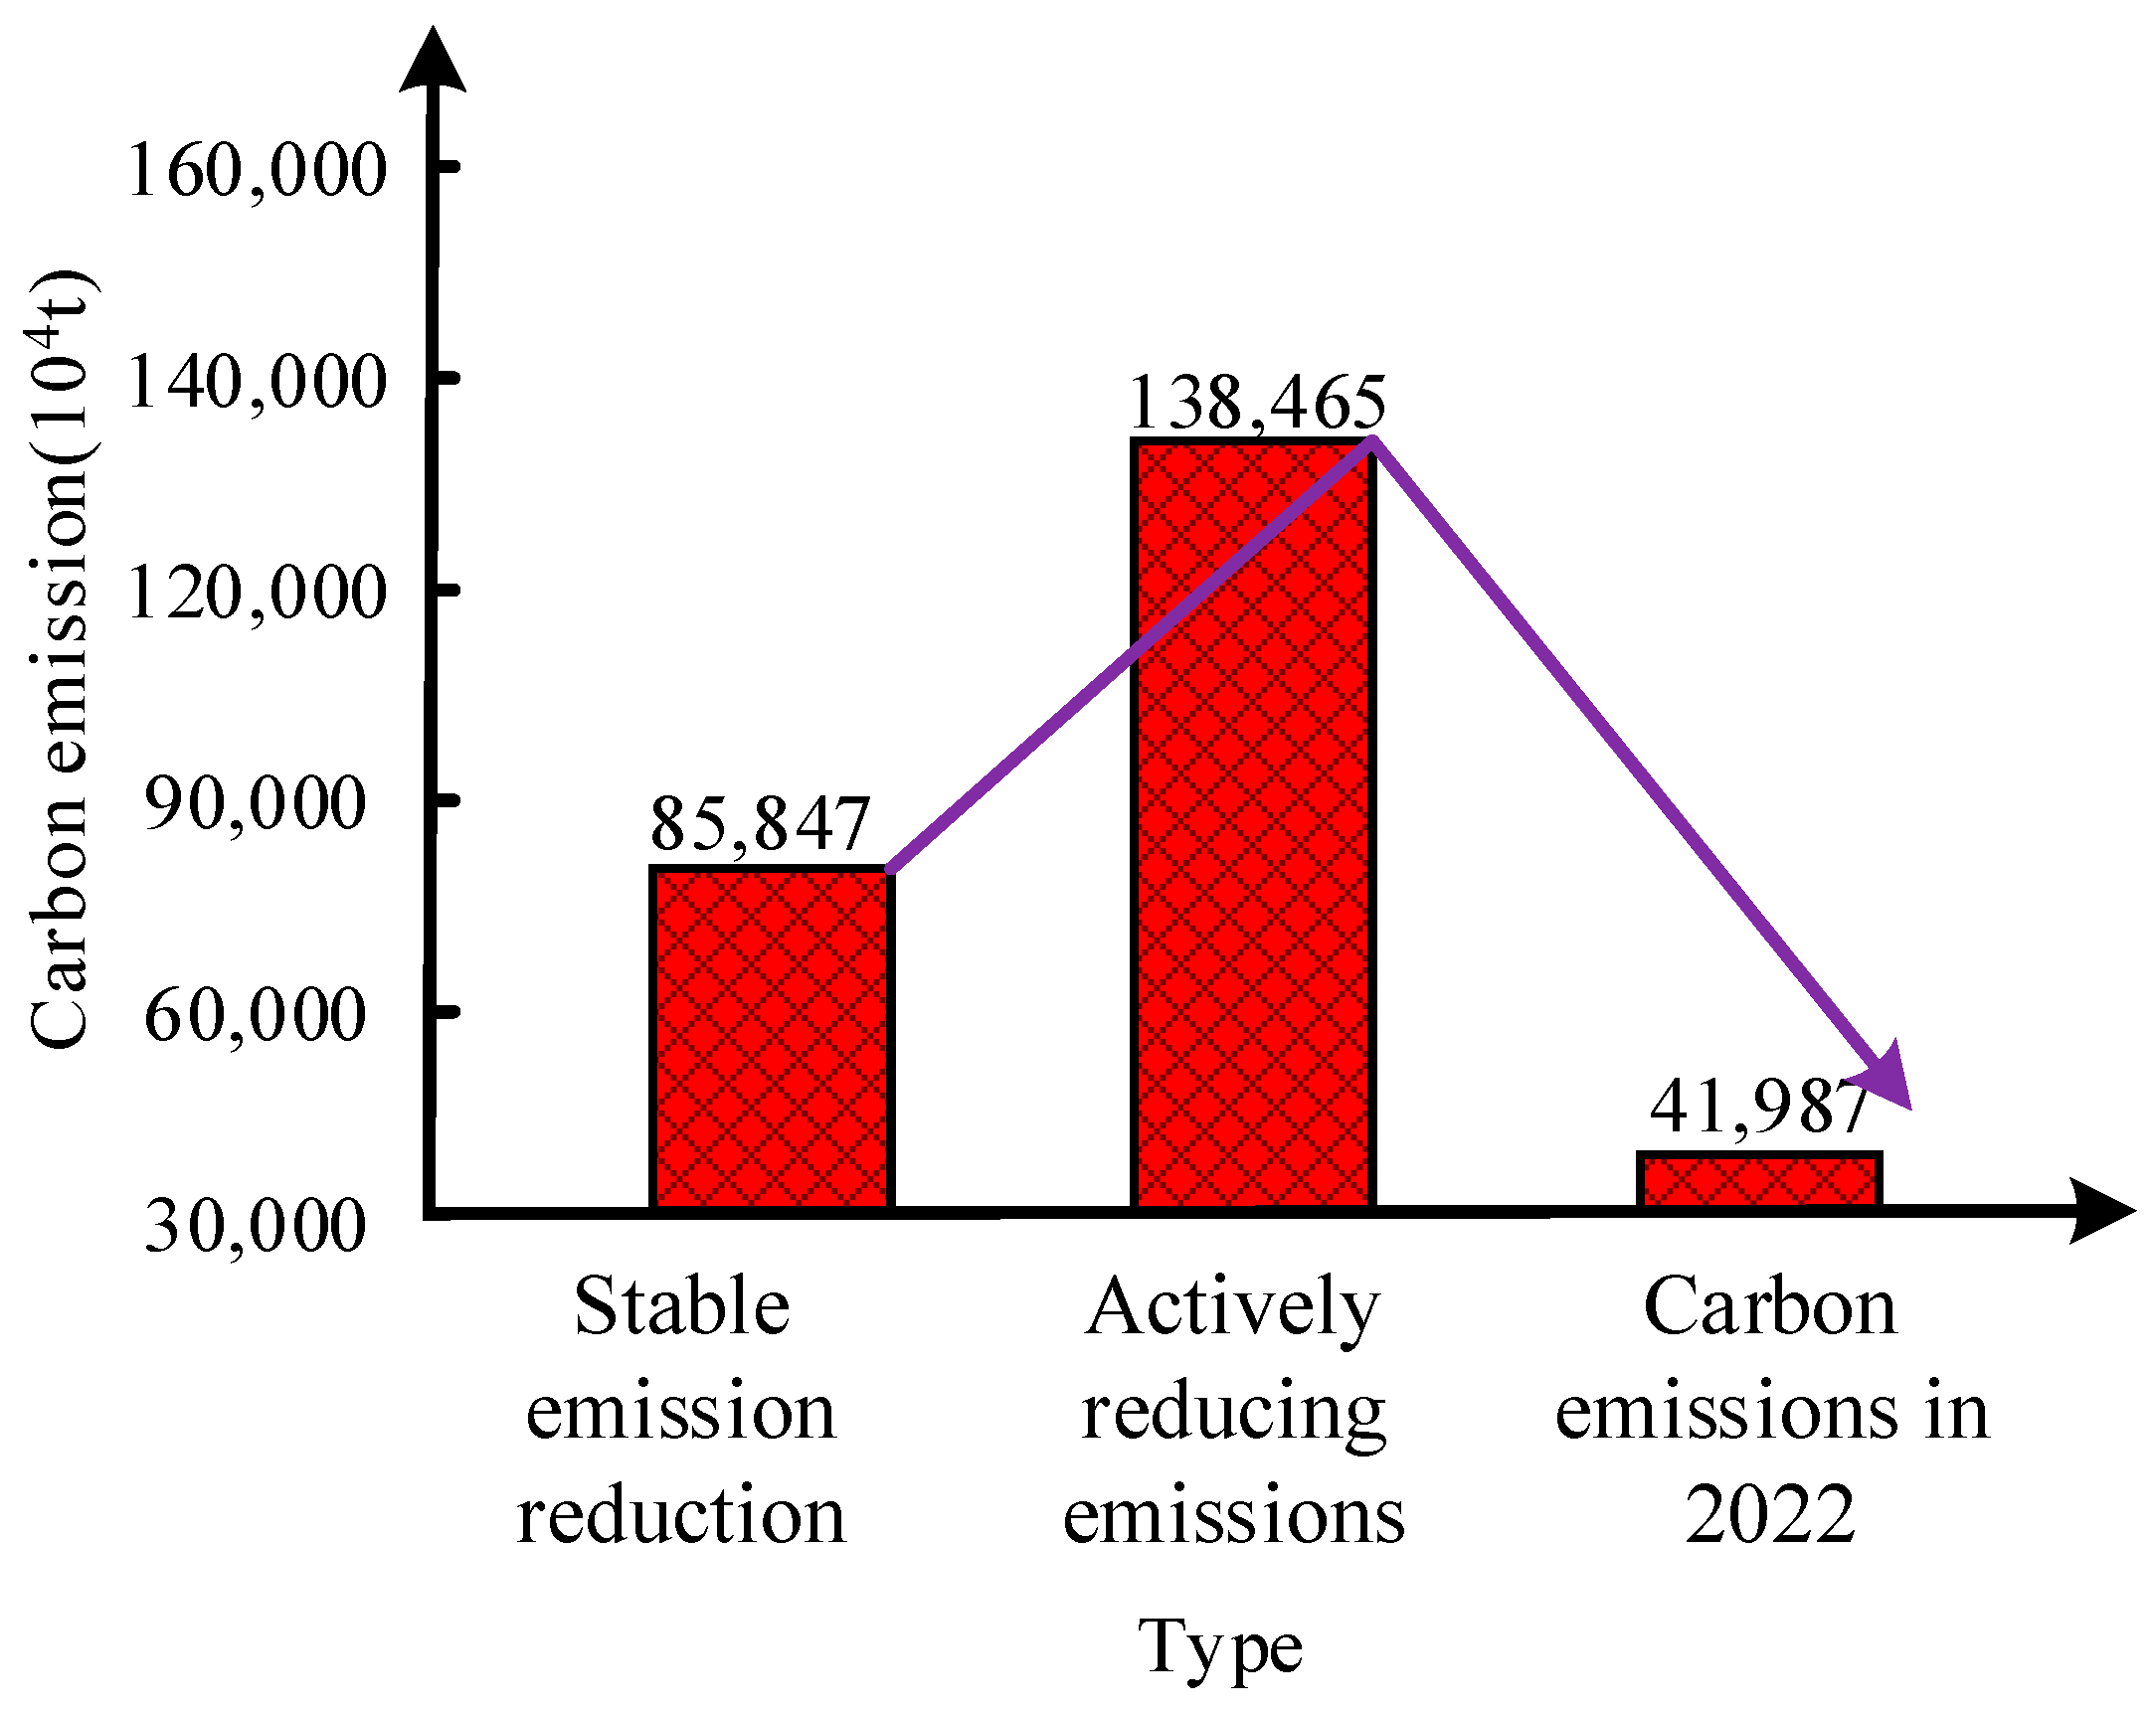
2 emissions in the future is very great. In the scenario of stable emission reduction, the industry’s emission reduction potential by 2033 is 858.47 million tons of standard coal, accounting for 59.29% of the total emissions that year. In the active emission reduction scenario, its potential will reach 1384.65 million tons of standard coal by 2033, which is 150.19% of the total emissions that year. The comparison between carbon emissions and predicted results in 2022 is shown in Figure 7.
In the scenario of stable emission reduction, its future potential reaches 858.47 million tons, nearly twice the carbon dioxide emissions of 419.87 million tons in 2011. Under the active emission reduction scenario, its potential will reach 1384.65 million tons, nearly three times the emissions in 2011.
Based on the above research results, the following policy recommendations are proposed:
Optimize industrial structure. Encourage the upgrading of high-energy-consuming non-metallic industries and develop low-carbon, green, and circular economy industries. Through policy guidance, promote enterprises to transform and upgrade towards high-end, intelligent, and green directions; increase industrial added value; and reduce energy consumption and emission intensity.
Strengthen regional coordinated development. Based on the resource endowment, industrial foundation, and development potential of each region, formulate differentiated industrial policies to guide the concentration of funds, technology, and talent in advantageous regions. At the same time, strengthen cross-regional cooperation, achieve complementary advantages and share resources, and improve overall industrial competitiveness.
Improve energy efficiency. Promote advanced energy-saving technologies and equipment to reduce enterprise energy consumption. Implement an energy management system, strengthen energy supervision and assessment of enterprises, and ensure that they meet national and industry energy consumption standards. In addition, encourage enterprises to replace traditional energy with clean energy to reduce carbon emissions.
Establish a carbon emission trading market. By establishing a carbon emission trading market, companies are incentivized to reduce carbon emissions. The government can limit and manage emissions, and trade the remaining emission rights in the market. This can not only regulate the carbon emission behavior of enterprises, but also provide effective carbon reduction mechanisms for the market.
Strengthen the enforcement of environmental regulations. Strengthen environmental supervision of high-energy-consuming non-metallic industries and strictly implement environmental protection regulations. For enterprises that violate environmental regulations, their legal responsibilities should be pursued in accordance with the law, forming an effective deterrent effect. At the same time, encourage enterprises to take proactive environmental protection measures to reduce pollution emissions.
In summary, in order to achieve the sustainable development goal of China’s high-energy-consuming non-metallic industry, we need to start from optimizing industrial structure, strengthening regional coordinated development, improving energy utilization efficiency, establishing a carbon emission trading market, strengthening the enforcement of environmental regulations, etc., to formulate practical and feasible policies and measures to achieve emission reduction goals and promote the healthy development of the industry.
The Jiang T team pointed out that climate change will bring more uncertainty and risks to China’s agriculture. Therefore, a series of measures need to be taken to address climate change, including optimizing planting structures and developing adaptive crop varieties. This study focuses more on developing targeted emission reduction policies in the high-energy-consuming industry [28]. The Yang C team studied the impact of urbanization on the environment in China and proposed a sustainable urbanization model, pointing out the need to establish a sustainable urbanization model, including promoting low-carbon city construction, strengthening garbage classification and treatment, and improving energy utilization efficiency. This study focuses on the specific development of industries in the process of urbanization, focusing on high-energy-consuming industries, and conducting targeted analysis [29]. Hart S L proposed strategies to promote balanced development of international trade, pointing out the need to adopt a series of strategies, including strengthening intellectual property protection, promoting the construction of free trade zones, and strengthening regional economic cooperation [30]. This study mainly focuses on the direction of industrial development, with a greater emphasis on formulating targeted emission reduction policies in high-energy-consuming industries. In summary, the advantages of this study compared to the above three literature studies are as follows: firstly, in-depth research was conducted on the special situation of the high-energy-consumption industry; secondly, the Logarithmic Mean Divisia Index model was used for empirical analysis, providing more accurate data support; finally, suggestions were put forward to formulate different emission reduction goals and policies for different situations, which have strong practicality and operability.

5. Conclusions

This study focuses on the non-ferrous metal industry, which is a high-energy-consuming sector. The research investigates three main aspects: carbon emission decomposition, regionalization analysis, and carbon emission prediction. Using the LMDI model, corresponding models were developed and validated. The findings of this research indicate that the economic scale factor had the greatest impact throughout the study period. Specifically, in 2018, the economic scale factor led to a significant increase in carbon emissions, reaching 66.0876 million tons. Additionally, improvements in energy intensity and reductions in the carbon dioxide emission coefficient contributed to the decrease in carbon dioxide emissions. During the research period, approximately half of the provinces were classified as type F, indicating a less optimistic outlook for carbon emission reduction. Type F provinces exhibited higher carbon emissions compared to other types. In the prediction analysis, under three different scenarios, carbon emissions were projected to increase compared to 2022. The increases were estimated to be 1028.23 million tons, 1886.88 million tons, and 50.208 million tons under the first, second, and third scenarios, respectively. Among the three scenarios, the economic scale factor accounted for 75.28%, 87.46%, and 65.21%, respectively, of the total factors contributing to the increase in carbon emissions. The impact of the energy structure and carbon emission coefficient on reducing carbon emissions was relatively small. Finally, under a stable emission reduction scenario, the non-ferrous metal industry was estimated to have a potential reduction of 858.47 million tons in future carbon dioxide emissions. Under an active emission reduction scenario, the potential reduction was even greater, reaching 1384.65 million tons, two to three times higher than that of 2021. This indicates that the non-ferrous metal industry has significant potential for reducing carbon emissions in the future.
This study focuses on the non-ferrous metal industry within the high-energy-consumption sector, and it explores three key aspects: carbon emission decomposition, regional analysis, and carbon emission prediction. By employing the Logarithmic Mean Divisia Index (LMDI) model and conducting empirical analysis, this research provides a comprehensive understanding of carbon emission characteristics in China’s high-energy-consumption industry. The findings offer valuable theoretical support for the formulation of future carbon emission reduction policies in this industry.
One of the innovative aspects of this study lies in its examination of the non-ferrous metal industry within the high-energy-consumption sector, expanding the research scope in related fields. The utilization of the LMDI model as an analytical tool to investigate carbon emission characteristics in high-energy-consuming industries represents a novel contribution. Furthermore, this study analyzes the factors influencing carbon emissions in high-energy-consuming industries from three perspectives: economic scale, energy intensity, and carbon emission coefficient. This analysis sheds light on the extent to which each factor impacts carbon emissions. Another significant contribution of this study is the classification and prediction of carbon emissions in various provinces, under different emission reduction goals and policies. These predictions identify the potential for future carbon emissions, providing a basis for the government to formulate targeted emission reduction strategies.
Building on the aforementioned research results, future studies can be pursued in the following three directions. Firstly, with regards to regional analysis, in-depth investigations into the carbon emission characteristics and influencing factors of non-ferrous metal industries in different regions should be conducted. This will facilitate the development of emission reduction strategies tailored to local conditions. Additionally, factors such as the energy structure, economic development level, and policy environment in different regions should be considered, enabling the identification of more targeted solutions. Secondly, interdisciplinary research cooperation should be strengthened by integrating knowledge from various disciplines, such as climate economics and systems engineering, into carbon emissions research in the non-ferrous metal industry. This interdisciplinary approach will help uncover the complex relationships among carbon emissions and various factors, providing theoretical support for the formulation of more effective policies and measures.

Author Contributions

H.Z. and S.L. collected the samples. H.Z. analysed the data. H.Z. conducted the experiments and analysed the results. All authors discussed the results and wrote the manuscript. All authors have read and agreed to the published version of the manuscript.

Funding

This work was supported in part by the Henan Science and Technology Development Plan Project under the grant “Research on road and 3D object detection algorithm based on pure vision in driverless scene” (No. 222102210101).

Institutional Review Board Statement

Not applicable.

Informed Consent Statement

Not applicable.

Data Availability Statement

All data generated or analysed during this study are included in this published article.

Conflicts of Interest

The authors declare no conflict of interest.

References

  1. Lugo-Morin, D.R. Global future: Low-carbon economy or high-carbon economy? World 2021, 2, 175–193. [Google Scholar] [CrossRef]
  2. Murshed, M.; Ahmed, Z.; Alam, S.; Mahmood, H.; Rehman, A.; Dagar, V. Reinvigorating the role of clean energy transition for achieving a low-carbon economy: Evidence from Bangladesh. Environ. Sci. Pollut. Res. 2021, 28, 67689–67710. [Google Scholar] [CrossRef] [PubMed]
  3. Nyambuu, U.; Semmler, W. Climate change and the transition to a low carbon economy–Carbon targets and the carbon budget. Econ. Model. 2020, 84, 367–376. [Google Scholar] [CrossRef]
  4. Kolesnikov, A.S.; Serikbaev, B.E.; Zolkin, A.L.; Kenzhibaeva, G.S.; Isaev, G.I.; Botabaev, N.E.; Shapalov, S.K.; Kolesnikova, O.G.; Iztleuov, G.M.; Suigenbayeva, A.Z.; et al. Processing of non-ferrous metallurgy waste slag for its complex recovery as a secondary mineral raw material. Refract. Ind. Ceram. 2021, 62, 375–380. [Google Scholar] [CrossRef]
  5. Umar, Z.; Jareño, F.; Escribano, A. Analysis of the dynamic return and volatility connectedness for non-ferrous industrial metals during the COVID-19 pandemic crisis. Stud. Econ. Financ. 2023, 40, 313–333. [Google Scholar] [CrossRef]
  6. Djurayevich, K.K.; Kxudoynazar O’g’li, E.U.; Sirozhevich, A.T.; Abdurashidovich, U.A. Complex Processing of Lead-Containing Technogenic Waste From Mining And Metallurgical Industries In The Urals. Am. J. Eng. Technol. 2020, 2, 102–108. [Google Scholar]
  7. Liu, W.; Xu, H.; Liao, Y.; Wang, Y.; Yan, N.; Qu, Z. Co-doped ZnS with large adsorption capacity for recovering Hg 0 from non-ferrous metal smelting gas as a co-benefit of electrostatic demisters. Environ. Sci. Pollut. Res. 2020, 27, 20469–20477. [Google Scholar] [CrossRef]
  8. Kolesnikov, A.S.; Zhakipbaev, B.Y.; Zhanikulov, N.N. Review of technogenic waste and methods of its processing for the purpose of complex utilization of tailings from the enrichment of non-ferrous metal ores as a component of the raw material mixture in the production of cement clinker. RasayanJ. Chem. 2021, 14, 997–1005. [Google Scholar] [CrossRef]
  9. Barma, M.; Modibbo, U.M. Multiobjective mathematical optimization model for municipal solid waste management with economic analysis of reuse/recycling recovered waste materials. J. Comput. Cogn. Eng. 2022, 1, 122–137. [Google Scholar] [CrossRef]
  10. Sovacool, B.K.; Schmid, P.; Stirling, A.; Walter, G.; MacKerron, G. Differences in carbon emissions reduction between countries pursuing renewable electricity versus nuclear power. Nat. Energy 2020, 5, 928–935. [Google Scholar] [CrossRef]
  11. Li, J.; Li, S.; Wu, F. Research on carbon emission reduction benefit of wind power project based on life cycle assessment theory. Renew. Energy 2020, 155, 456–468. [Google Scholar] [CrossRef]
  12. West, T.A.P.; Börner, J.; Sills, E.O.; Kontoleon, A. Overstated carbon emission reductions from voluntary REDD+ projects in the Brazilian Amazon. Proc. Natl. Acad. Sci. USA 2020, 117, 24188–24194. [Google Scholar] [CrossRef] [PubMed]
  13. Jiang, Y.; Liu, C. Research on carbon emission reduction and blockchain investment under different dual-channel supply chains. Environ. Sci. Pollut. Res. 2022, 29, 65304–65321. [Google Scholar] [CrossRef]
  14. Moran, D.; Wood, R.; Hertwich, E.; Mattson, K.; Rodriguez, J.F.; Schanes, K.; Barrett, J. Quantifying the potential for consumer-oriented policy to reduce European and foreign carbon emissions. Clim. Policy 2020, 20, S28–S38. [Google Scholar] [CrossRef]
  15. Wang, H.; Luo, J. Study of the impact of industrial restructuring on the intensity of air pollutant and greenhouse gas emissions from high-energy-consuming sectors: Empirical data from China. Environ. Sci. Pollut. Res. 2023, 30, 7801–7812. [Google Scholar] [CrossRef] [PubMed]
  16. Ma, E.; Yang, X. Financial Pressure, Energy Consumption and Carbon Emissions: A Quasi-Natural Experiment Based on the Educational Authority Reform. China Financ. Econ. Rev. 2022, 11, 44–65. [Google Scholar] [CrossRef]
  17. Xiao, S.; Dong, H.; Geng, Y.; Fujii, M.; Pan, H. Greenhouse gas emission mitigation potential from municipal solid waste treatment: A combined SD-LMDI model. Waste Manag. 2021, 120, 725–733. [Google Scholar] [CrossRef] [PubMed]
  18. Guo, Y.; Zhang, Y.; Yang, F.; Tian, X.; Wang, H. Analysis of Factors Influencing Carbon Emissions of Energy Systems Based on LMDI Model. Distrib. Energy Resour. 2022, 7, 30–36. [Google Scholar] [CrossRef]
  19. Wu, X.; Zhang, K.; Wang, Q.; Wang, D.; Ku, G. Analysis of carbon emission drivers of secondary industries in Energy “Golden Triangle” area based on LMDI and two-dimensional decoupling model. Environ. Sci. Pollut. Res. 2023, 30, 8154–8169. [Google Scholar] [CrossRef]
  20. He, H.; Myers, R.J. Log Mean Divisia Index decomposition analysis of the demand for building materials: Application to concrete, dwellings, and the UK. Environ. Sci. Technol. 2021, 55, 2767–2778. [Google Scholar] [CrossRef] [PubMed]
  21. Xu, S.C.; Zhou, Y.F.; Feng, C.; Wang, Y.; Li, Y.F. What factors influence PM 2.5 emissions in China? An analysis of regional differences using a combined method of data envelopment analysis and logarithmic mean Divisia index. Environ. Sci. Pollut. Res. 2020, 27, 34234–34249. [Google Scholar] [CrossRef]
  22. Golpe, A.A.; Martín-Álvarez, J.M.; Galiano, A.; Zhong, C.; Wu, B. Effect of IQOS introduction on Philip Morris International cigarette sales in Spain: A Logarithmic Mean Divisa Index decomposition approach. Gac. Sanit. 2022, 36, 293–300. [Google Scholar] [CrossRef] [PubMed]
  23. Wu, L.; Wang, M.; Cheng, J.; Zhong, C.; Wu, B. Embodied carbon emission of building materials in Southwest China: Analysisbased on tapio decoupling and logarithmic mean divisia index decomposition. Clean Technol. Environ. Policy 2023, 25, 921–935. [Google Scholar] [CrossRef]
  24. Lyu, W.; Chen, Y.; Yu, Z.; Yao, W.; Liu, H. Decomposing drivers of changes in productive and domestic water use based on the logarithmic mean Divisia index method: A regional comparison in Northern China. Water Policy 2021, 23, 310–326. [Google Scholar] [CrossRef]
  25. Ghazi Mir, S.M.; Faridzad, A.; Khorsandi, M. Decomposition Analysis of Debt’s Impact on Energy Consumption of Iranian Economic Sectors with Using the Logarithmic Mean Divisia Index. J. Econom. Model. 2022, 7, 9–41. [Google Scholar] [CrossRef]
  26. Le Quéré, C.; Jackson, R.B.; Jones, M.W.; Smith, A.J.P.; Abernethy, S.; Andrew, R.M.; De-Gol, A.J.; Willis, D.R.; Shan, Y.; Canadell, J.G.; et al. Temporary reduction in daily global CO2 emissions during the COVID-19 forced confinement. Nat. Clim. Chang. 2020, 10, 647–653. [Google Scholar] [CrossRef]
  27. Rehman, A.; Ma, H.; Ozturk, I.; Murshed, M.; Dagar, V. The dynamic impacts of CO2 emissions from different sources on Pakistan’s economic progress: A roadmap to sustainable development. Environ. Dev. Sustain. 2021, 23, 17857–17880. [Google Scholar] [CrossRef]
  28. Jiang, T.; Yu, Y.; Jahanger, A.; Lorente, D.B. Structural emissions reduction of China’s power and heating industry under the goal of “double carbon”: A perspective from input-output analysis. Sustain. Prod. Consum. 2022, 31, 346–356. [Google Scholar] [CrossRef]
  29. Yang, C.; Hao, Y.; Irfan, M. Energy consumption structural adjustment and carbon neutrality in the post-COVID-19 era. Struct. Chang. Econ. Dyn. 2021, 59, 442–453. [Google Scholar] [CrossRef]
  30. Hart, S.L.; Ahuja, G. Does it pay to be green? An empirical examination of the relationship between emission reduction and firm performance. Bus. Strategy Environ. 1996, 5, 30–37. [Google Scholar] [CrossRef]
Figure 1. Trends in carbon dioxide emissions.
Sustainability 15 13437 g001
Figure 2. Regionalized classification analysis model.
Sustainability 15 13437 g002
Figure 3. Area type.
Sustainability 15 13437 g003
Figure 4. Three scenarios.
Sustainability 15 13437 g004
Figure 5. Contribution rate of carbon dioxide emissions changes in the non-ferrous metal industry in different regions.
Sustainability 15 13437 g005
Figure 6. Carbon emission prediction for the non-ferrous metal industry.
Sustainability 15 13437 g006
Figure 7. Comparison of carbon emissions and predicted results in 2022.
Sustainability 15 13437 g007
Table 1. Decomposition results from 2012 to 2016.
YearsEnergy IntensityEnergy-Resource StructureEconomic ScaleCarbon Emission CoefficientCarbon Emission
Change in Emission (104 t)Contribution Rate (%)Change in Emission (104 t)Contribution Rate (%)Change in Emission (104 t)Contribution Rate (%)Change in Emission (104 t)Contribution Rate (%)Change in Emission (104 t)
2012−108.417.26−48.213.241144.6176.61−193.0612.93794.93
2013−319.0713.52496.2621.041525.2964.56−21.650.931682.83
2014−715.2219.26−8.090.222974.4480.08−17.180.472233.95
2015−2070.8234.48311.465.183330.7355.48−291.514.861279.86
2016−1900.4529.81−168.112.654250.6666.65−58.980.932123.12
Table 2. Decomposition results from 2017 to 2022.
YearsEnergy IntensityEnergy-Resource StructureEconomic ScaleCarbon Emission CoefficientCarbon Emission
Change in Emission (104 t)Contribution Rate (%)Change in Emission (104 t)Contribution Rate (%)Change in Emission (104 t)Contribution Rate (%)Change in Emission (104 t)Contribution Rate (%)Change in Emission (104 t)
2017−1136.4416.9814.380.225355.2880.05−184.402.774048.82
2018−256.273.09−873.9310.536608.7679.53−572.096.894906.42
2019−3501.1839.73224.192.554592.7852.07−498.235.66816.96
2020−2077.7829.04−609.228.524166.8758.25−300.724.231179.15
20218007.5256.34−506.213.555035.1335.43−666.614.6811,869.84
2022−2969.4648.76307.142.316227.6246.84−279.742.112923.28
Table 3. Results of provincial regional decomposition from 2012 to 2016.
Provincial Region2012–2016
Economic ScaleEnergy IntensityEnergy-Resource StructureCarbon Emission CoefficientCarbon Emission
Beijing4.48−7.340.23−0.08−2.72
Tianjin5.16−6.560.44−0.21−1.18
Hebei46.64−64.15−17.28−1.98−36.86
Shanxi830.04−128.5284.19−24.96760.66
Inner Mongolia712.42250.67−139.68−62.74760.69
Liaoning320.09−270.8313.65−4.9757.93
Jilin42.67−18.27−15.410.189.18
Heilongjiang24.36−26.72−0.29−1.53−3.26
Shanghai26.48−17.675.88−0.4814.22
Jiangsu67.62−63.8513.27−4.1212.93
Zhejiang190.53−117.27−0.32−3.8968.87
Anhui162.56−167.95−1.38−3.41−9.19
Fujian87.45−19.87−4.27−3.8859.43
Jiangxi411.39−259.32−10.48−16.59126.48
Shandong1484.05−726.73256.36−21.88992.77
Henan2608.36−475.51286.52−79.482239.94
Hubei189.043−59.03−7.27−17.36105.38
Hunan438.18−305.1960.78−24.81167.97
Guangdong206.43−200.147.88−2.3111.87
Guangxi188.29−91.7712.18−71.8936.81
Chongqing111.37−43.096.65−3.3471.92
Sichuan379.8285.06120.58−18.85566.53
Guizhou444.09−58.67−26.51−29.51318.42
Yunnan725.96−375.4360.28−60.65350.18
Shaanxi307.73−145.73−6.56−14.31141.14
Gansu718.51−397.1670.92−47.73344.03
Qinghai511.25−11.085.98−112.52393.27
Ningxia215.77276.54−47.51−11.79433.04
Xinjiang103.2741.77−18.12−2.63124.32
Table 4. Results of provincial-level regional decomposition from 2017 to 2022.
Provincial Region2017–2022
Economic ScaleEnergy IntensityEnergy-Resource StructureCarbon Emission CoefficientCarbon Emission
Beijing0.18−0.11−0.12−0.08−0.12
Tianjin5.27−7.23−0.16−0.07−2.18
Hebei31.69−32.18−2.64−1.96−5.08
Shanxi225.47461.47−9.51−61.11616.34
Inner Mongolia3054.45−1633.05198.49−32.981586.91
Liaoning527.95−512.074.82−22.44−11.37
Jilin101.55−103.96−8.27−6.97−19.63
Heilongjiang6.67−30.480.78−2.65−25.67
Shanghai8.03−2.55−0.89−1.822.78
Jiangsu146.89101.08−29.18−9.45215.93
Zhejiang115.93−157.21−84.22−19.18169.76
Anhui163.63−76.25−14.41−11.2361.78
Fujian154.14−91.34−9.66−13.6839.47
Jiangxi489.55−468.0625.81−24.7822.56
Shandong2110.39−828.94−287.84−45.83947.81
Henan4384.77−1079.77−548.06−383.022373.97
Hubei376.48−200.2627.43−29.84162.83
Hunan652.85−393.4312.17−41.94229.66
Guangdong276.18−55.4845.17−8.14257.75
Guangxi743.41−170.91−75.08−45.74450.91
Chongqing193.3341.6515.73−24.77225.94
Sichuan672.05−465.76−45.22−119.5540.55
Guizhou168.57590.12259.08−65.84951.92
Yunnan541.82−204.5214.57−103.67247.38
Shaanxi352.45−148.3128.47−28.23203.26
Gansu992.33305.55−95.85−45.581155.35
Qinghai848.25437.68−335.66−143.96805.34
Ningxia453.68−264.3756.58−30.43214.47
Xinjiang88.02−46.87−0.15−8.8332.18
Table 5. Analysis results of regionalization classification of the non-ferrous metal industry from 2012 to 2016.
Carbon Emission2012–2016
Δ c Type
Beijing2<0C
Tianjin2<0C
Hebei1<0B
Shanxi2>0F
Inner Mongolia2>0F
Liaoning2>0F
Jilin2>0F
Heilongjiang1<0B
Shanghai2>0F
Jiangsu2>0F
Zhejiang1>0E
Anhui1<0B
Fujian1>0E
Jiangxi1>0E
Shandong2>0F
Henan2>0F
Hubei1>0E
Hunan2>0F
Guangdong2>0F
Guangxi2>0F
Chongqing2>0F
Sichuan3>0G
Guizhou1>0E
Yunnan2>0F
Shaanxi1>0E
Gansu2>0F
Qinghai2>0F
Ningxia2>0F
Xinjiang2>0F
Table 6. Analysis results of regionalization classification of the non-ferrous metal industry from 2017 to 2022.
Carbon Emission2017–2022
n CType
Beijing1<0B
Tianjin1<0B
Hebei1<0B
Shanxi2>0F
Inner Mongolia2>0F
Liaoning1<0B
Jilin1<0B
Heilongjiang2<0C
Shanghai1>0E
Jiangsu2>0F
Zhejiang2>0F
Anhui1>0E
Fujian1>0E
Jiangxi2>0F
Shandong1>0E
Henan1>0E
Hubei2>0F
Hunan2>0F
Guangdong2>0F
Guangxi1>0E
Chongqing3>0G
Sichuan1>0E
Guizhou3>0G
Yunnan2>0F
Shaanxi2>0F
Gansu2>0F
Qinghai2>0F
Ningxia2>0F
Xinjiang1>0E
Table 7. The impact value and variation value of each factor.
Scenario CategoryScenario ParametersVariable ValueContribution Rate (%)
Scenario 1Total changes in carbon dioxide102,824100
Economic scale impact153,06475.28
Energy intensity impact−31,695−15.58
Energy structure impact−9826−4.82
Impact of carbon emission coefficient−8722−4.28
Scenario 2Total changes in carbon dioxide188,669100
Economic scale impact220,29787.46
Energy intensity impact−21,748−8.64
Energy structure impact−9291−3.68
Impact of carbon emission coefficient−589−0.24
Scenario 3Total changes in carbon dioxide502,207100
Economic scale impact107,66865.21
Energy intensity impact−36,248−21.96
Energy structure impact−9153−5.55
Impact of carbon emission coefficient−12,058−7.31
Table 8. Sensitivity analysis.
ParameterBaseline Scenario ValueHigh-Emission Scenario ValuesLow-Emission Scenario Value
Carbon dioxide emission factor1.01.11.2
Energy intensity factor1.01.11.2
Energy structure factor1.01.11.2
Economic scale factor1.01.11.2
Table 9. Emission reduction potential.
Time2033
Stable carbon dioxide emission scenarioEmission reduction85,847 million tons
Proportion in total emissions59.29%
Positive CO2 emission scenariosEmission reduction138,465 million tons
Proportion in total emissions150.19%
Disclaimer/Publisher’s Note: The statements, opinions and data contained in all publications are solely those of the individual author(s) and contributor(s) and not of MDPI and/or the editor(s). MDPI and/or the editor(s) disclaim responsibility for any injury to people or property resulting from any ideas, methods, instructions or products referred to in the content.

