You are currently viewing a new version of our website. To view the old version click .
Sustainability
  • Article
  • Open Access

4 September 2023

Quantifying Sustainability and Landscape Performance: A Smart Devices Assisted Alternative Framework

,
,
and
1
School of Architecture and Design, Virginia Polytechnic Institute and State University, Blacksburg, VA 24060, USA
2
School of Business, Virginia Polytechnic Institute and State University, Blacksburg, VA 24060, USA
*
Authors to whom correspondence should be addressed.
This article belongs to the Section Air, Climate Change and Sustainability

Abstract

This research investigates gaps in current methods and tools in landscape performance research and presents a smart device-assisted alternative framework for performance assessment. Against the background of increasing attention to sustainability, landscape performance has emerged as a novel research focus on sustainability, with the objective of precisely quantifying sustainable performance. However, certain shortcomings persist within this field. This research conducts a comprehensive review of pertinent literature and analyzes deeply the performance metrics and case studies cataloged by the Landscape Performance Series (LPS). Additionally, an examination of quantitative tools is undertaken by surveys. The study finds several issues in current landscape performance research: imbalance development, inconsistent methods, one-time measurement, insufficient tools, and inaccurate and unreliable quantified results. Based on the advantages of smart devices in gathering sustainable data and previous research results, this research presents an alternate framework for conducting landscape performance research, which incorporates smart devices. In addition, it presents a set of recommendations for advancing research on landscape performance. This study could contribute to improving the diversity and accuracy of landscape performance quantification and contribute to future performance research. It assists in the refinement of landscape performance research and the achievement of sustainable development goals.

1. Introduction

In recent years, there has been increasing attention towards issues related to flooding disasters, environmental pollution, public health concerns, and the migration and transformation of toxic substances. Researchers and professionals in design and planning fields, including landscape architecture, have been actively exploring effective solutions to address these issues [1,2]. They seek to assess the impacts of relevant measures using appropriate quantification methods. With the rapid global urbanization and the escalating severity of sustainable environmental problems, landscape performance has become a prominent and widely discussed research topic [3].
Landscape architects face numerous challenges, including providing resilient landscapes for climate change adaptation, dealing with growing urbanization, planning for natural disaster adaptation, restoring ecologies in degraded urban areas, and protecting limited water resources and stormwater management [4,5,6]. To successfully address these challenges, landscape architects currently tend to rely on experience-based approaches to make decisions [7,8]. However, a new challenge arises, which is how to get the trust of clients, designers, and the public in the development results and expected effects of these landscape projects [5].
This new challenge can be addressed via landscape performance research. Regardless of how sustainability is defined—whether it is carbon neutrality, net-zero water, biodiversity, or quality of life—achieving sustainable development is not possible without considering the landscape [9]. Landscape performance plays an indispensable role in this regard. It can be defined as “a measure of the effectiveness with which landscape solutions fulfill their intended purpose and contribute to sustainability” [9]. It involves assessing progress toward measurable environmental, social, and economic objectives [9]. It requires all the performance values to be measurable and precise [10].
Various institutions and organizations have conducted exploratory research in this field, including the Leadership in Energy and Environmental Design (LEED), Leadership in Energy and Environmental Design for Neighborhood Development Rating System (LEED-ND), Sustainable Sites Initiative (SITES), and the recently emerged Landscape Performance Series (LPS). These institutions and organizations are dedicated to developing assessment systems for the sustainable characteristics of the built architectural and landscape architectural projects. LPS represents a significant advancement in evaluation systems, building upon previous methodologies to offer a deeper understanding of post-construction performance and the subsequent benefits [11]. Currently, LPS as a standard assessment system for landscape performance has been widely accepted in landscape architecture field [12]. Therefore, in this study, we will focus on LPS as the research subject for landscape performance assessment.
Although the research of smart devices in landscape performance is a relatively new direction, some research results have been achieved. Smart devices have the potential to support researchers in remotely collecting data. This allows for timely identification and resolution of any issues related to landscape projects [13]. Dealing with landscape performance challenges within a project can be extensive [14]. Smart devices equipped with various sensors offer an exploration of the connections between different variables that influence landscape performance. These sensors can measure indicators like temperature, humidity, light intensity, air quality, and sound levels [15]. By analyzing the gathered data, researchers can gain insights into how different variables interrelate and impact landscape performance. Moreover, smart devices can longitudinally track landscape performance variables without requiring intervention. Longitudinal tracking addresses issues such as inaccurate data and insufficient spatial resolution that could arise from one-time measurements [16].
This study first explores gaps in current landscape performance research. These gaps are mainly reflected in imbalanced development, inconsistent methods, one-time measurement, insufficient tools, and inaccurate and unreliable quantitative results. These deficiencies are elaborated in the following sections. This study then provides an analysis of the potential of smart devices for data collection and conducts a series of case studies exploring their use in improving landscape performance research. Ultimately, this paper proposes an alternative landscape performance research framework aimed at bridging existing gaps and providing new thoughts and methodologies for future landscape assessments.

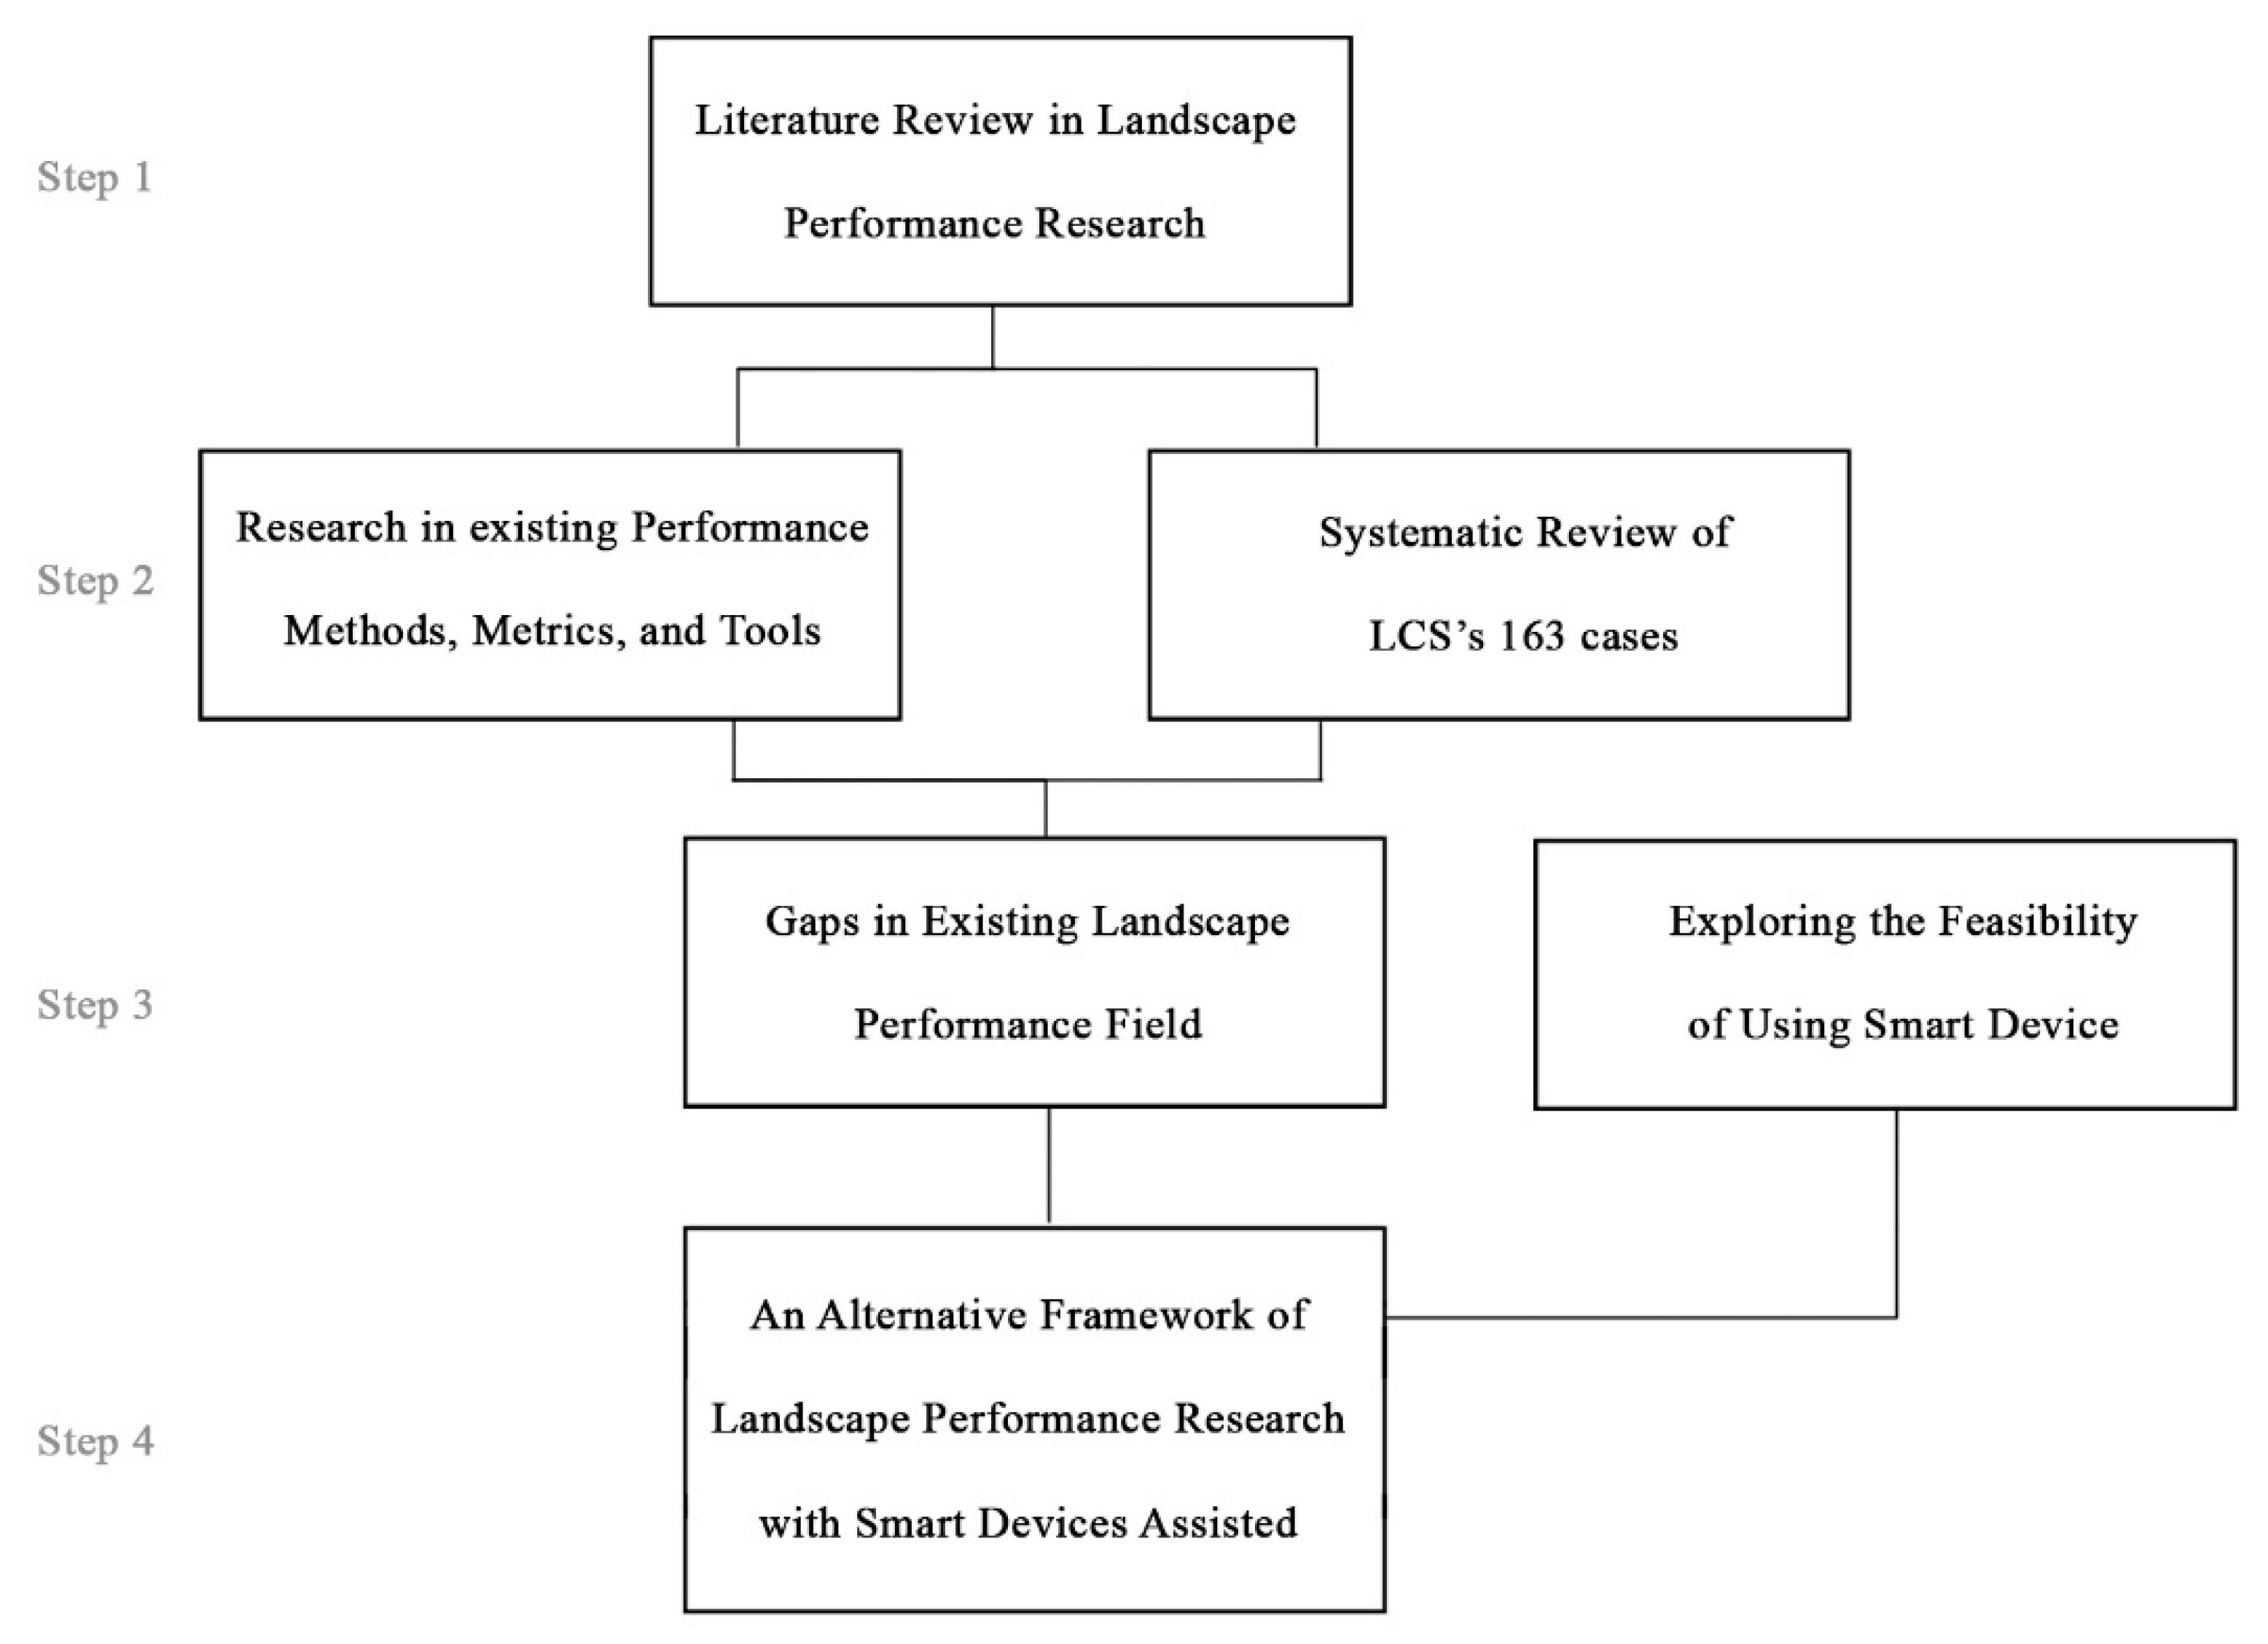
2. Research Framework and Research Questions

The previous review helps to establish the study’s theoretical framework and clarifies its goals. Further research is both appropriate and essential, given that research has shown landscape performance to be a crucial indication of sustainability. With a focus on quantifiability and accuracy, research on tools for measuring landscape performance is essential. Due to the advantages of smart devices shown in the data collection in other fields, it is feasible and reasonable to collaborate with smart devices in landscape performance research.
As a result, the main objectives of this research are as follows: first, analyze and study the gaps in current landscape performance quantification methods and tools; second, explore the feasibility of using smart devices as alternative quantification tools; and third, explore an alternative framework for landscape performance research that takes smart devices into account. In Figure 1, the research framework is shown. Three research questions are posed and addressed in this study. (1) What are the limitations of the present approaches for measuring landscape performance? (2) How might smart devices help researchers to conduct landscape performance research? Can the current quantification framework accommodate the use of smart devices? (3) How does this study contribute to sustainability and landscape performance?
Figure 1. Research Framework.

3. Existing Landscape Performance Research Method

In 2010, the Landscape Architecture Foundation (LAF) introduced LPS. LPS is a platform that provides techniques, materials, and tools for measuring landscape performance and showcasing sustainable design approaches [11]. With the advent of LPS, the public has become increasingly aware of landscape performance and its potential contributions to the theme of sustainable development. According to LPS’s description, landscape performance characteristics of landscape projects are categorized into three aspects: social, economic, and environmental, each complementing the others. Figure 2 illustrates the three aspects of landscape performance assessment. The significance of landscape performance assessment lies in the recognition of the value of the evaluated objects [17].
Figure 2. Three aspects of landscape performance evaluation.

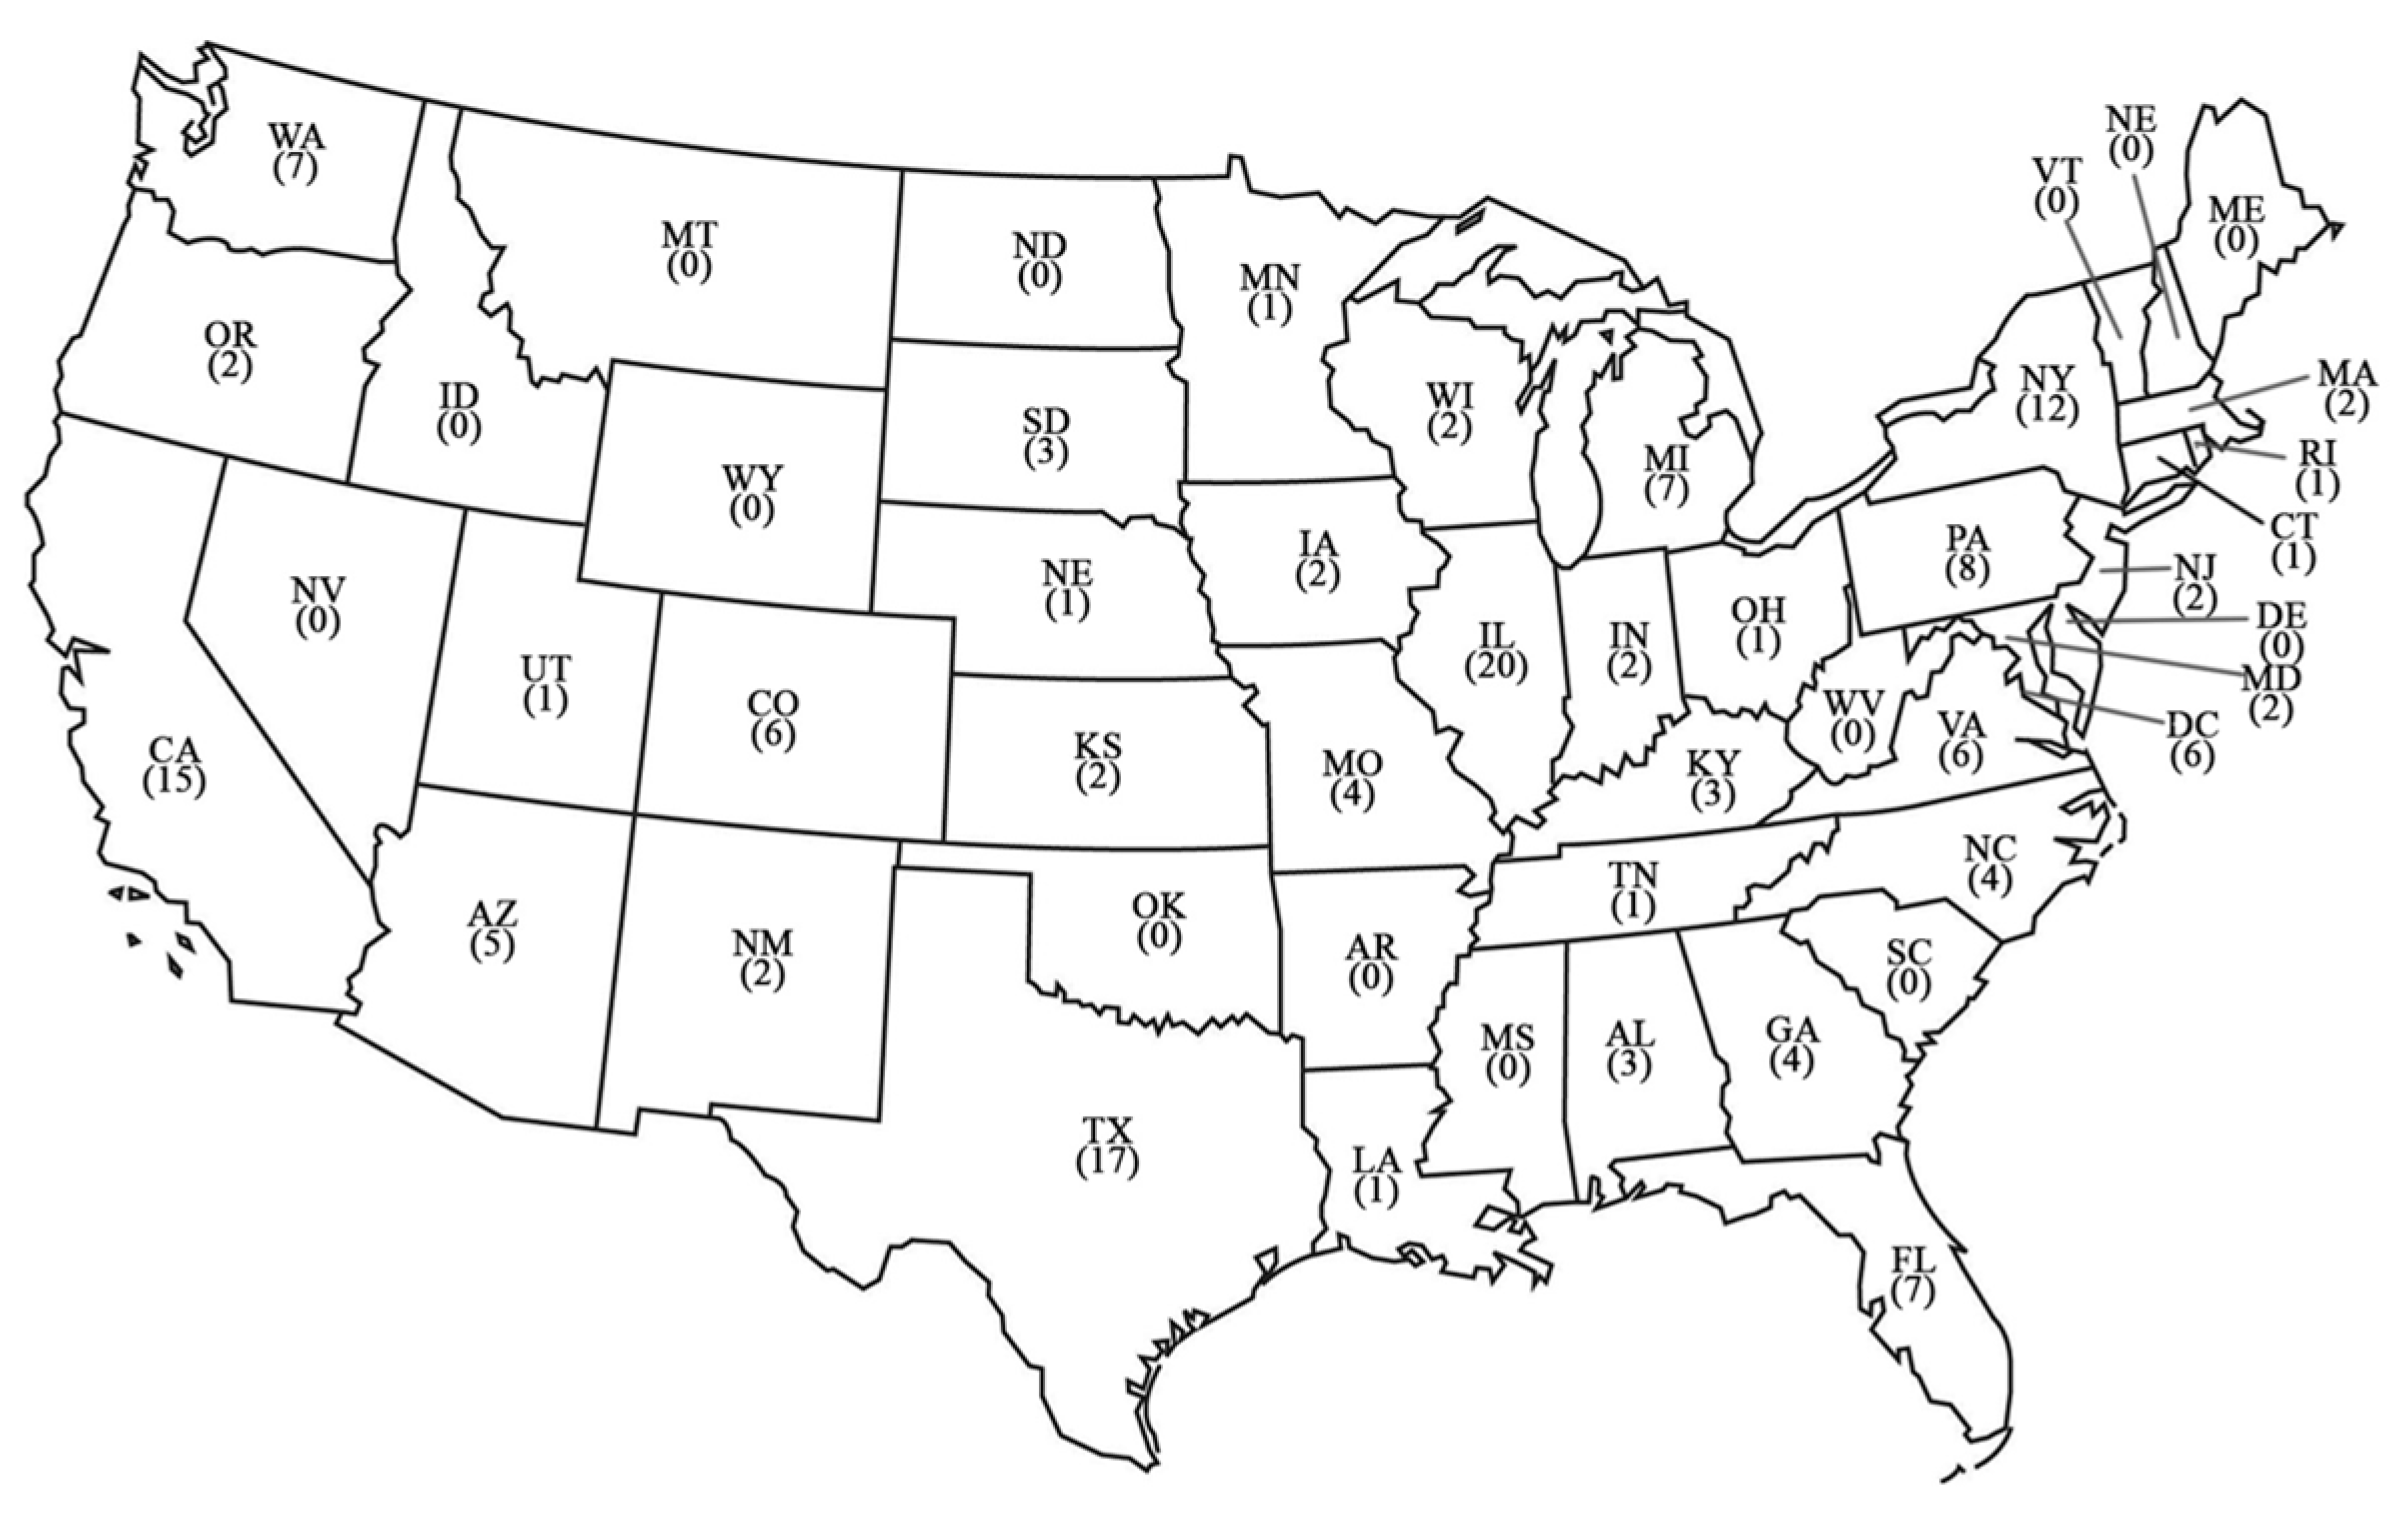
3.1. Case Study Investigation

Since its introduction, LPS has continuously advanced landscape performance research through Case Study Investigation (CSI). CSI’s research findings are made available to the public through free case briefs. These briefs typically include the following elements: basic project information and relevant details, performance evaluation conclusions, performance evaluation methods, as well as project drawings, images, and other materials. Since 2010, LAF has worked in collaboration with several research teams and academic institutions to examine various landscape situations and identify landscape projects that exhibit high levels of environmental, social, and economic performance [18]. In addition, all metrics and techniques utilized in the 58 projects that were featured in LPS between 2013 and 2014 were coded and examined [18]. A guidebook for the selection of metrics and methods was created by LAF at the end of 2014 based on prior research and titled “Evaluating Landscape Performance, A Guidebook for Metrics and Methods Selection” [18]. Its final version was released in 2018. The guideline describes various metrics in detail. This study is based on its three aspects, seven categories, and thirty-three metrics for exploration and analysis (Table 1).
Table 1. The classification and benefit metrics of the three categories: environment, economy, and society.

3.2. Gaps in Frameworks, Metrics, and Methodologies

As landscape performance is a relatively new concept, there may be gaps in its existing frameworks, metrics, and methodologies [19]. (1) First, the landscape is an interactive and complex ecosystem, in which one indicator may interact with another or more performance indicators, making it difficult to quantify performance and evaluate it completely. (2) The current classification of LPS on sustainability performance is not comprehensive enough. Existing classifications show benefit metrics overlapping phenomena [17]. (3) Landscape is a dynamic and ever-changing process. The variables of landscape performance alter with time, making landscape performance an ever-changing momentum [20]. Current quantitative research on landscape performance frequently depends on one-time measurements to assess project performance, calling into question the reliability and effectiveness of quantified performance indicators [16]. (4) There are no consistent assessment standards in the present cases [16]. Different projects use various assessment methodologies and tools, making it difficult to conduct cross-regional and cross-project comparison analyses [17]. (5) Current performance evaluations usually focus on a single area of landscape performance, such as environmental sustainability, while ignoring essential dimensions such as economic and social sustainability [21]. (6) In certain aspects of performance measurement, there is a lack of objectivity. According to Terkenli et al. [22], due to the lack of appropriate evaluation tools, landscape researchers often rely on subjective and qualitative approaches to analyze certain aspects of performance (especially evident in social and economic sustainability). As a result, outcomes may be impacted by subjective preferences [23].

3.3. CSI Gap Analysis through Existing Cases

The research team conducted a detailed analysis of the 163 landscape performance research cases (in the United States) listed on the LPS website (Figure 3). It can be found that there is an imbalance in the regional distribution of cases. Texas (TX) has 17 cases but some states have none. The research team then investigated the distribution of these cases across 33 sustainability benefit indicators. Building upon Table 1, Table 2 correlates each benefit metric with these cases. The data was then visualized in a bar chart for clarity (Figure 4). Upon analyzing Table 2 and Figure 4, the findings align with the shortcomings of the current LCS assessment framework outlined in Section 3.2 First, while LPS has subdivided environmental sustainability into five categories, there is a lack of such subdivisions for social and economic sustainability. Second, the cases prominently emphasize exploration in the environmental domain. Out of the 163 cases, 153 quantified landscape performance in the environmental sphere, followed by 143 cases in social sustainability, and the fewest cases, 105, in the economic domain. This result appears to somewhat contradict the prior mention of neglecting social and economic aspects. However, when analyzing each benefit metric and its related cases, it becomes evident that the current performance assessment projects are limited to a single or a few dimensions of discourse. The distribution of case numbers across the metrics with 33 benefits is highly uneven. Environmental metrics garner widespread attention, such as stormwater management (107 cases), while some metrics in social and economic sections have only single-digit cases. Even within the environmental sustainability category, more cases are distributed toward water management and air quality, with a scarcity of cases focusing on land categories. Within the water category, the distribution is also uneven, as 107 cases explore stormwater management, in contrast to merely 7 cases related to water body/groundwater recharge. Upon a comprehensive exploration of all 163 cases, more issues arise. Quantitative approaches to describing different benefit directions differ; for environmental aspects, quantitative scientific figures and units are typically employed for description, whereas in the realms of social and economic fields, indirect measurement and description are more common. Survey and self-calculation methods are commonly employed for quantitative analysis in these domains. These disparities may stem from measurement tool constraints, prompting further analysis and elucidation of existing performance assessment tools in the subsequent sections.
Figure 3. Spatial distribution of the 163 landscape performance research cases listed on the LPS website.
Table 2. Cases in each benefit metric.
Figure 4. Comparison of LPS benefits with cases.

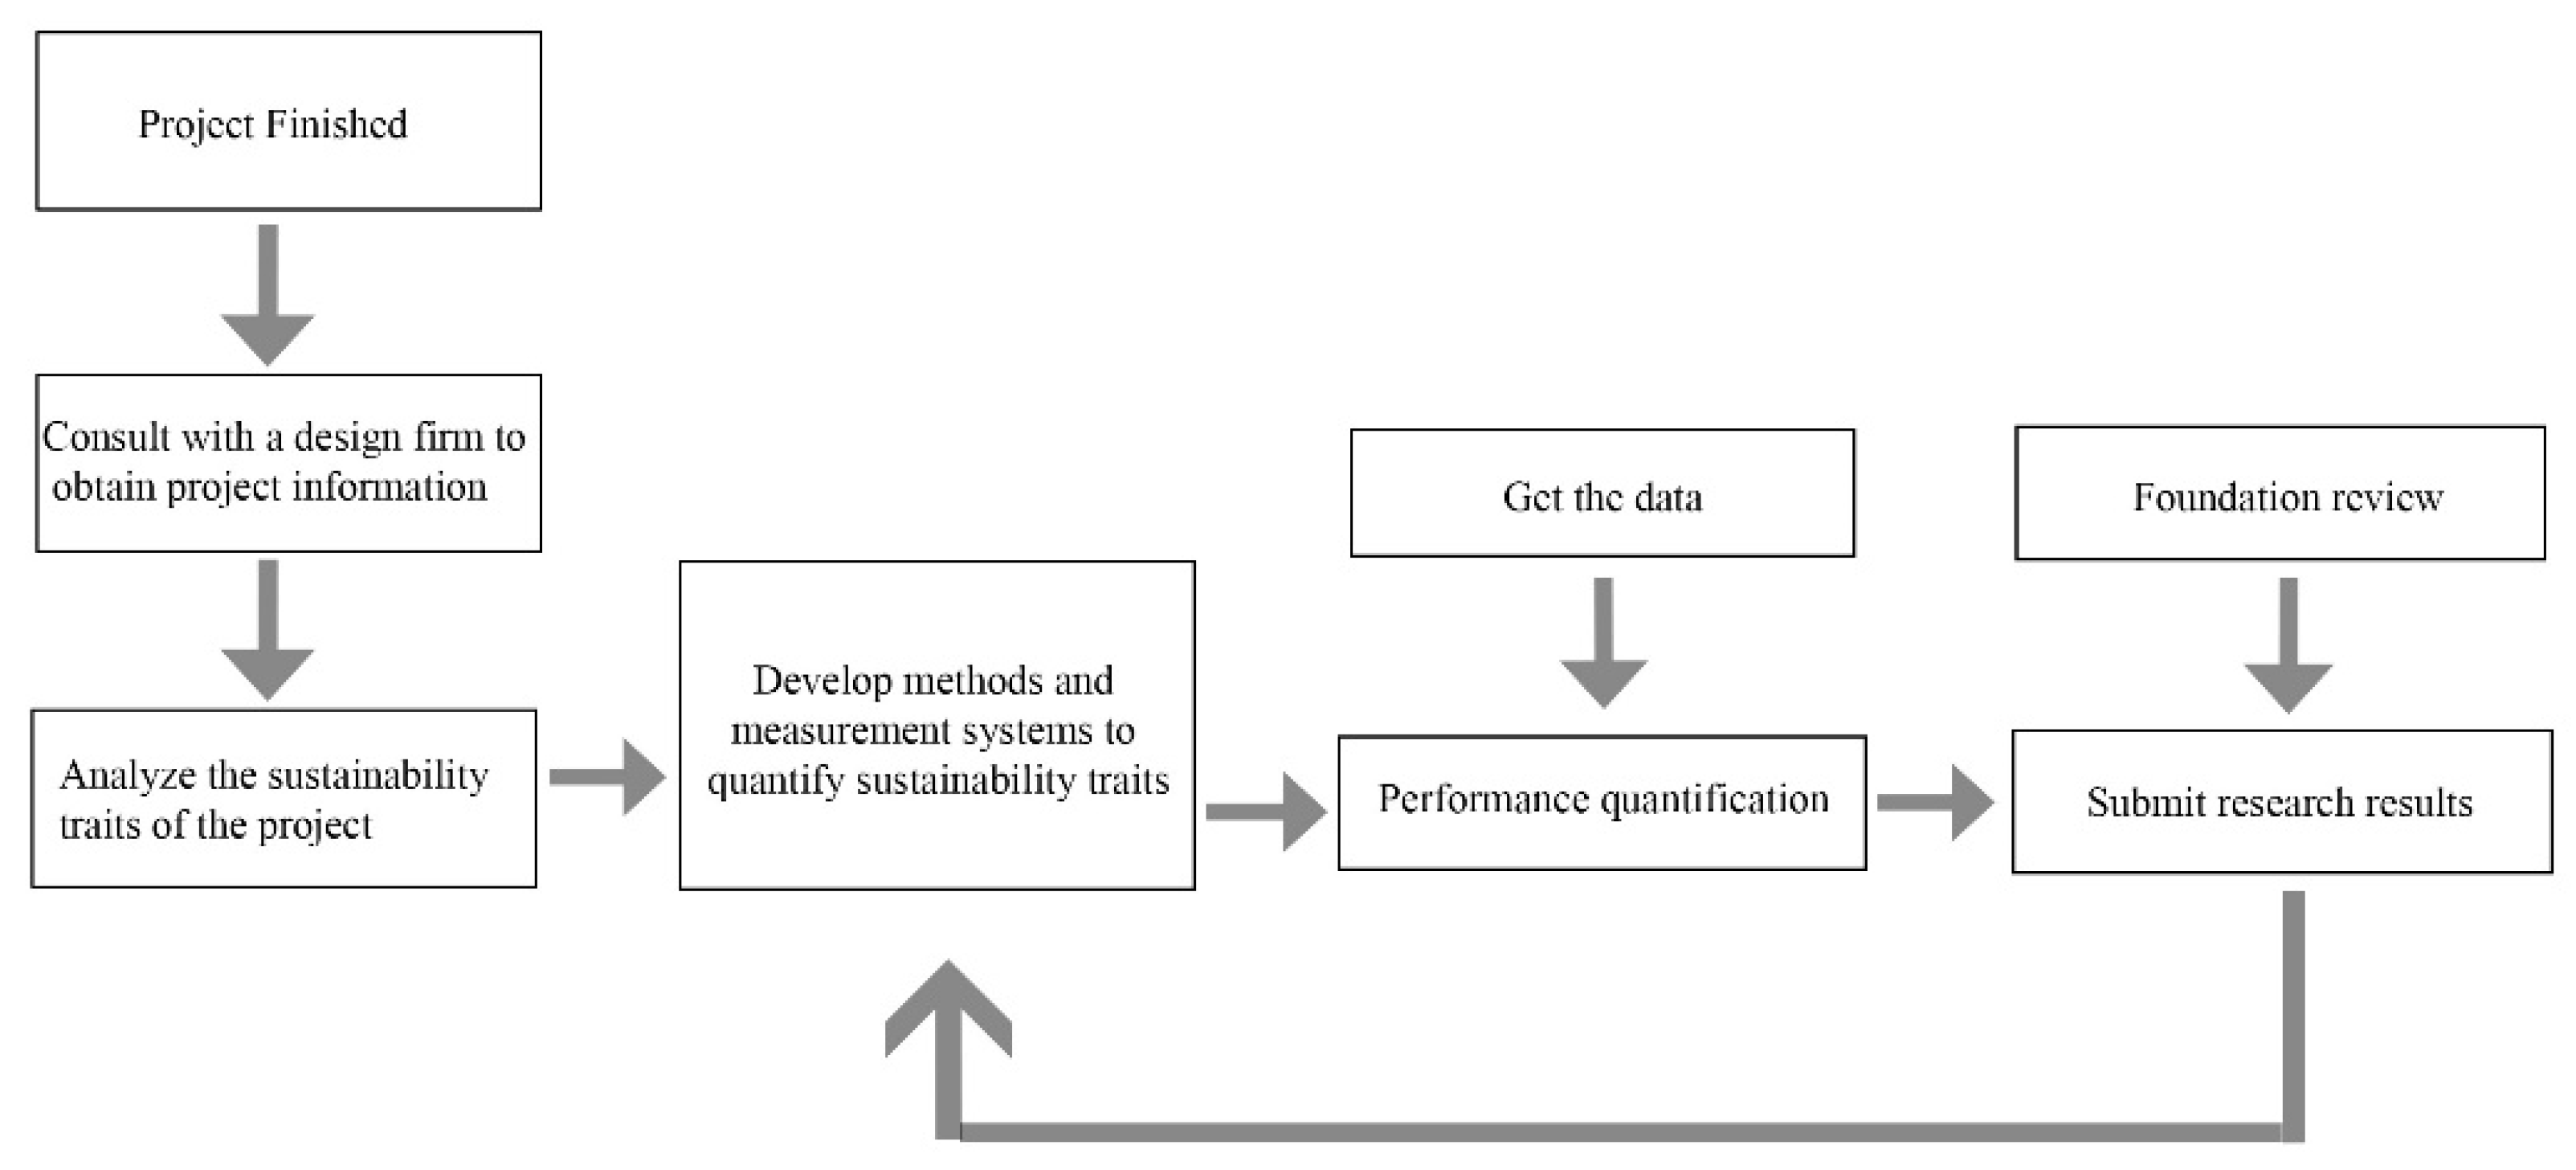
3.4. One-Time Measurement

Another issue that deserves attention is the assessment method of “One-Time Measurement”. Through the study of 163 case reports, it was found that 93 cases utilized a performance assessment conducted only once. It is reasonable to hypothesize that this number could be even greater, as some reports do not allow for an analysis of how many measurements were taken.
One-time measurement could offer information about the landscape performance characteristics of a particular project at a specific moment. The validity and reliability of these one-time measurement data need to be carefully considered if the research aims to fully satisfy an accurate quantification of landscape performance as required by LPS [16]. Merely based on the evaluation of landscape performance solely on one-time measures, researchers may miss out on numerous crucial factors and dynamic changes, which could have an impact on the results. Several disadvantages of one-time measurement are as follows.
(1) Lacking comprehensiveness: One-time measurement can only collect data at a certain point or moment. It can hardly represent the environmental performance value because the landscape is a dynamic process [23].
(2) Seasons and weather influence: Seasons and weather frequently influence aspects of landscape performance, which cannot be fully examined in one-time measurement.
(3) Inability to accurately record short-term fluctuations: Landscape performance can fluctuate due to short-term natural variations or brief disruptions. One-time measurement may not capture these instantaneous changes [16].
(4) Ignoring long-term effects: Landscape performance is frequently the consequence of long-term accumulation and evolution, which can be easily neglected in one-time measurement [18].
(5) Incomplete data: Because certain metrics are difficult to gather or measure, a one-time measurement may not capture all critical landscape performance indicators [18].
(6) Subjective influence: The planning and execution of a one-time measurement might be influenced by the subjective variables of researchers or measurers, thus leading to less objective and accurate results [16]. For example, based on accessibility and weather conditions, the researchers subjectively select measurement locations and times.

4. Landscape Performance Quantification Tools

Researchers commonly employ online measurement evaluation tools provided by LPS or handheld measurement devices to assess these 33 metrics. Quantification is a key characteristic of landscape performance research [17]. This necessitates that the performance results must be precise, measurable, and significant, rather than ambiguous or vague [24]. However, these landscape performance measurement tools and their outcomes may encounter certain limitations and challenges [16]. For instance, difficulties in data acquisition and analysis, inflexibility of tools, and a lack of real-time monitoring may be prevalent issues.

4.1. Gaps in LPS Online Tools

The LPS website presents 32 open-source performance assessment tools that integrate online calculators for landscape performance estimation [25]. Practitioners and researchers can utilize these tools to calculate the performance value. These tools could assist researchers in estimating the landscape benefits of completed projects when actual measurement results are unavailable. Alternatively, during the design stage, they can be used to compare the anticipated benefits of various design options.
All online calculation tools are provided by third parties, with some necessitating program purchases and others providing free usage options [17]. A number of these tools utilize model-based estimating techniques, rendering them particularly appropriate for implementation during the design stage or for the computation of performance elements that are subject to estimation, such as carbon sequestration [17]. According to Luo and Li [16], there are specialized instruments, such as Davey Tree Expert and the National Tree Benefit Calculator, that necessitate a significant emphasis on prior knowledge. Users are required to possess knowledge about several aspects of trees, including tree species, diameter at breast height, and terrain features, to effectively utilize these tools. Furthermore, effective quantification needs the provision of precise position data. Additionally, it should be mentioned that due to differences in software developers, some calculating tools may only be applicable in certain geographical areas [26]. Furthermore, due to the independent nature of each CSI project conducted by various research and design teams, there are inherent variations in the documentation, measurement methodologies, and quantitative approaches utilized, leading to distinct performance outcomes [16]. Also, the present methodology employed for conducting CSI necessitates substantial commitments of both time and resources on the part of researchers [17]. The feasibility of conducting a thorough assessment of a project’s performance while adhering to restricted financial resources and time limitations may be challenging.

4.2. Survey in LPS Online Tools

According to the description in Section 4.1, it is necessary and reasonable to further explore these online tools, and it is necessary to focus on their cost, usability, and data accuracy. Therefore, the research team used survey methods to investigate each tool. The research team randomly recruited 15 undergraduate students and 15 graduate students from Virginia Tech as participants to assess all 32 evaluation tools provided by LPS websites. All participants were asked to try to use each online tool and to rate the software (using a Likert scale ranging from 1 to 3) in terms of cost, usability, and result accuracy, according to the user experiences. The collected survey data were then entered into SPSS (a professional and general statistical software) to conduct the data analysis. The summarized results are presented in Table 3. Although the study did not analyze the participants’ professions, ages, and genders, it ensured diversity among them to enhance the reliability of the survey results. The survey questionnaire was conducted anonymously.
Table 3. Presenting the categorization and organization of quantification tools for Landscape Performance Score (LPS) and their associated metrics. The use of solid and hollow circles indicates whether a pay-to-use option is available, with ⚫️ symbolizing “Yes” and ⚪ symbolizing “No”, and N/A symbolizing that this tool cannot be reached anymore. The level of difficulty is assessed using a Likert scale ranging from 1 to 3, where 1 represents easy to use, 2 represents a little hard to use, and 3 indicates high difficulty. In terms of result accuracy, solid circles indicate that the investigators consider the calculations to be accurate for landscape performance (⚫️: Accurate Result), whereas hollow circles suggest that the results are estimated performance (⚪: Estimated Result).
We discovered that these calculation tools were all provided by third-party organizations, and users must familiarize themselves with the tools before selecting them. Additionally, some of the software’s website links were inaccessible or no longer in use, so we used the “N/A” symbol listed in Table 3. For these inaccessible tools, participants assessed the difficulty of using and accuracy aspects based on only the descriptions on LPS websites. Except for those tools that cannot be accessed, the rest of the tools are free to use. This is contrary to the previous survey results of Dai and Li [17], who reported that some software requires payment. The research team did not investigate this phenomenon in depth, but the reason cannot be ruled out that these softwares became free versions after 2015. Participants believed that more than half of the software was somewhat difficult or difficult to use. The time cost associated with being familiar with the software has contributed to the difficulty in acquiring landscape performance data [27]. Also, the research team found that these softwares generally have the problem of insufficient transparency, so users cannot understand the principle of the result generation due to the lack of background knowledge. This runs counter to the critique of new knowledge generated by the direct adoption of knowledge from other disciplines in the field of landscape architecture. Criticism has arisen recently regarding the direct adoption of tools from other disciplines to generate new knowledge in landscape design [28,29,30]. Moreover, since many of these calculation tools rely on model construction for estimation, the calculated results can only offer estimated performance results. Participants believed that only six of the software results were accurate rather than estimated. Such ambiguity and vagueness in the performance result, which contradict LPS’s requirement for clarity and measurability, pose a primary challenge in landscape performance evaluation. The goal of landscape performance assessment is to guide future design decisions. Incorrect performance evaluation could lead to misleading outcomes and erroneous decisions [16].

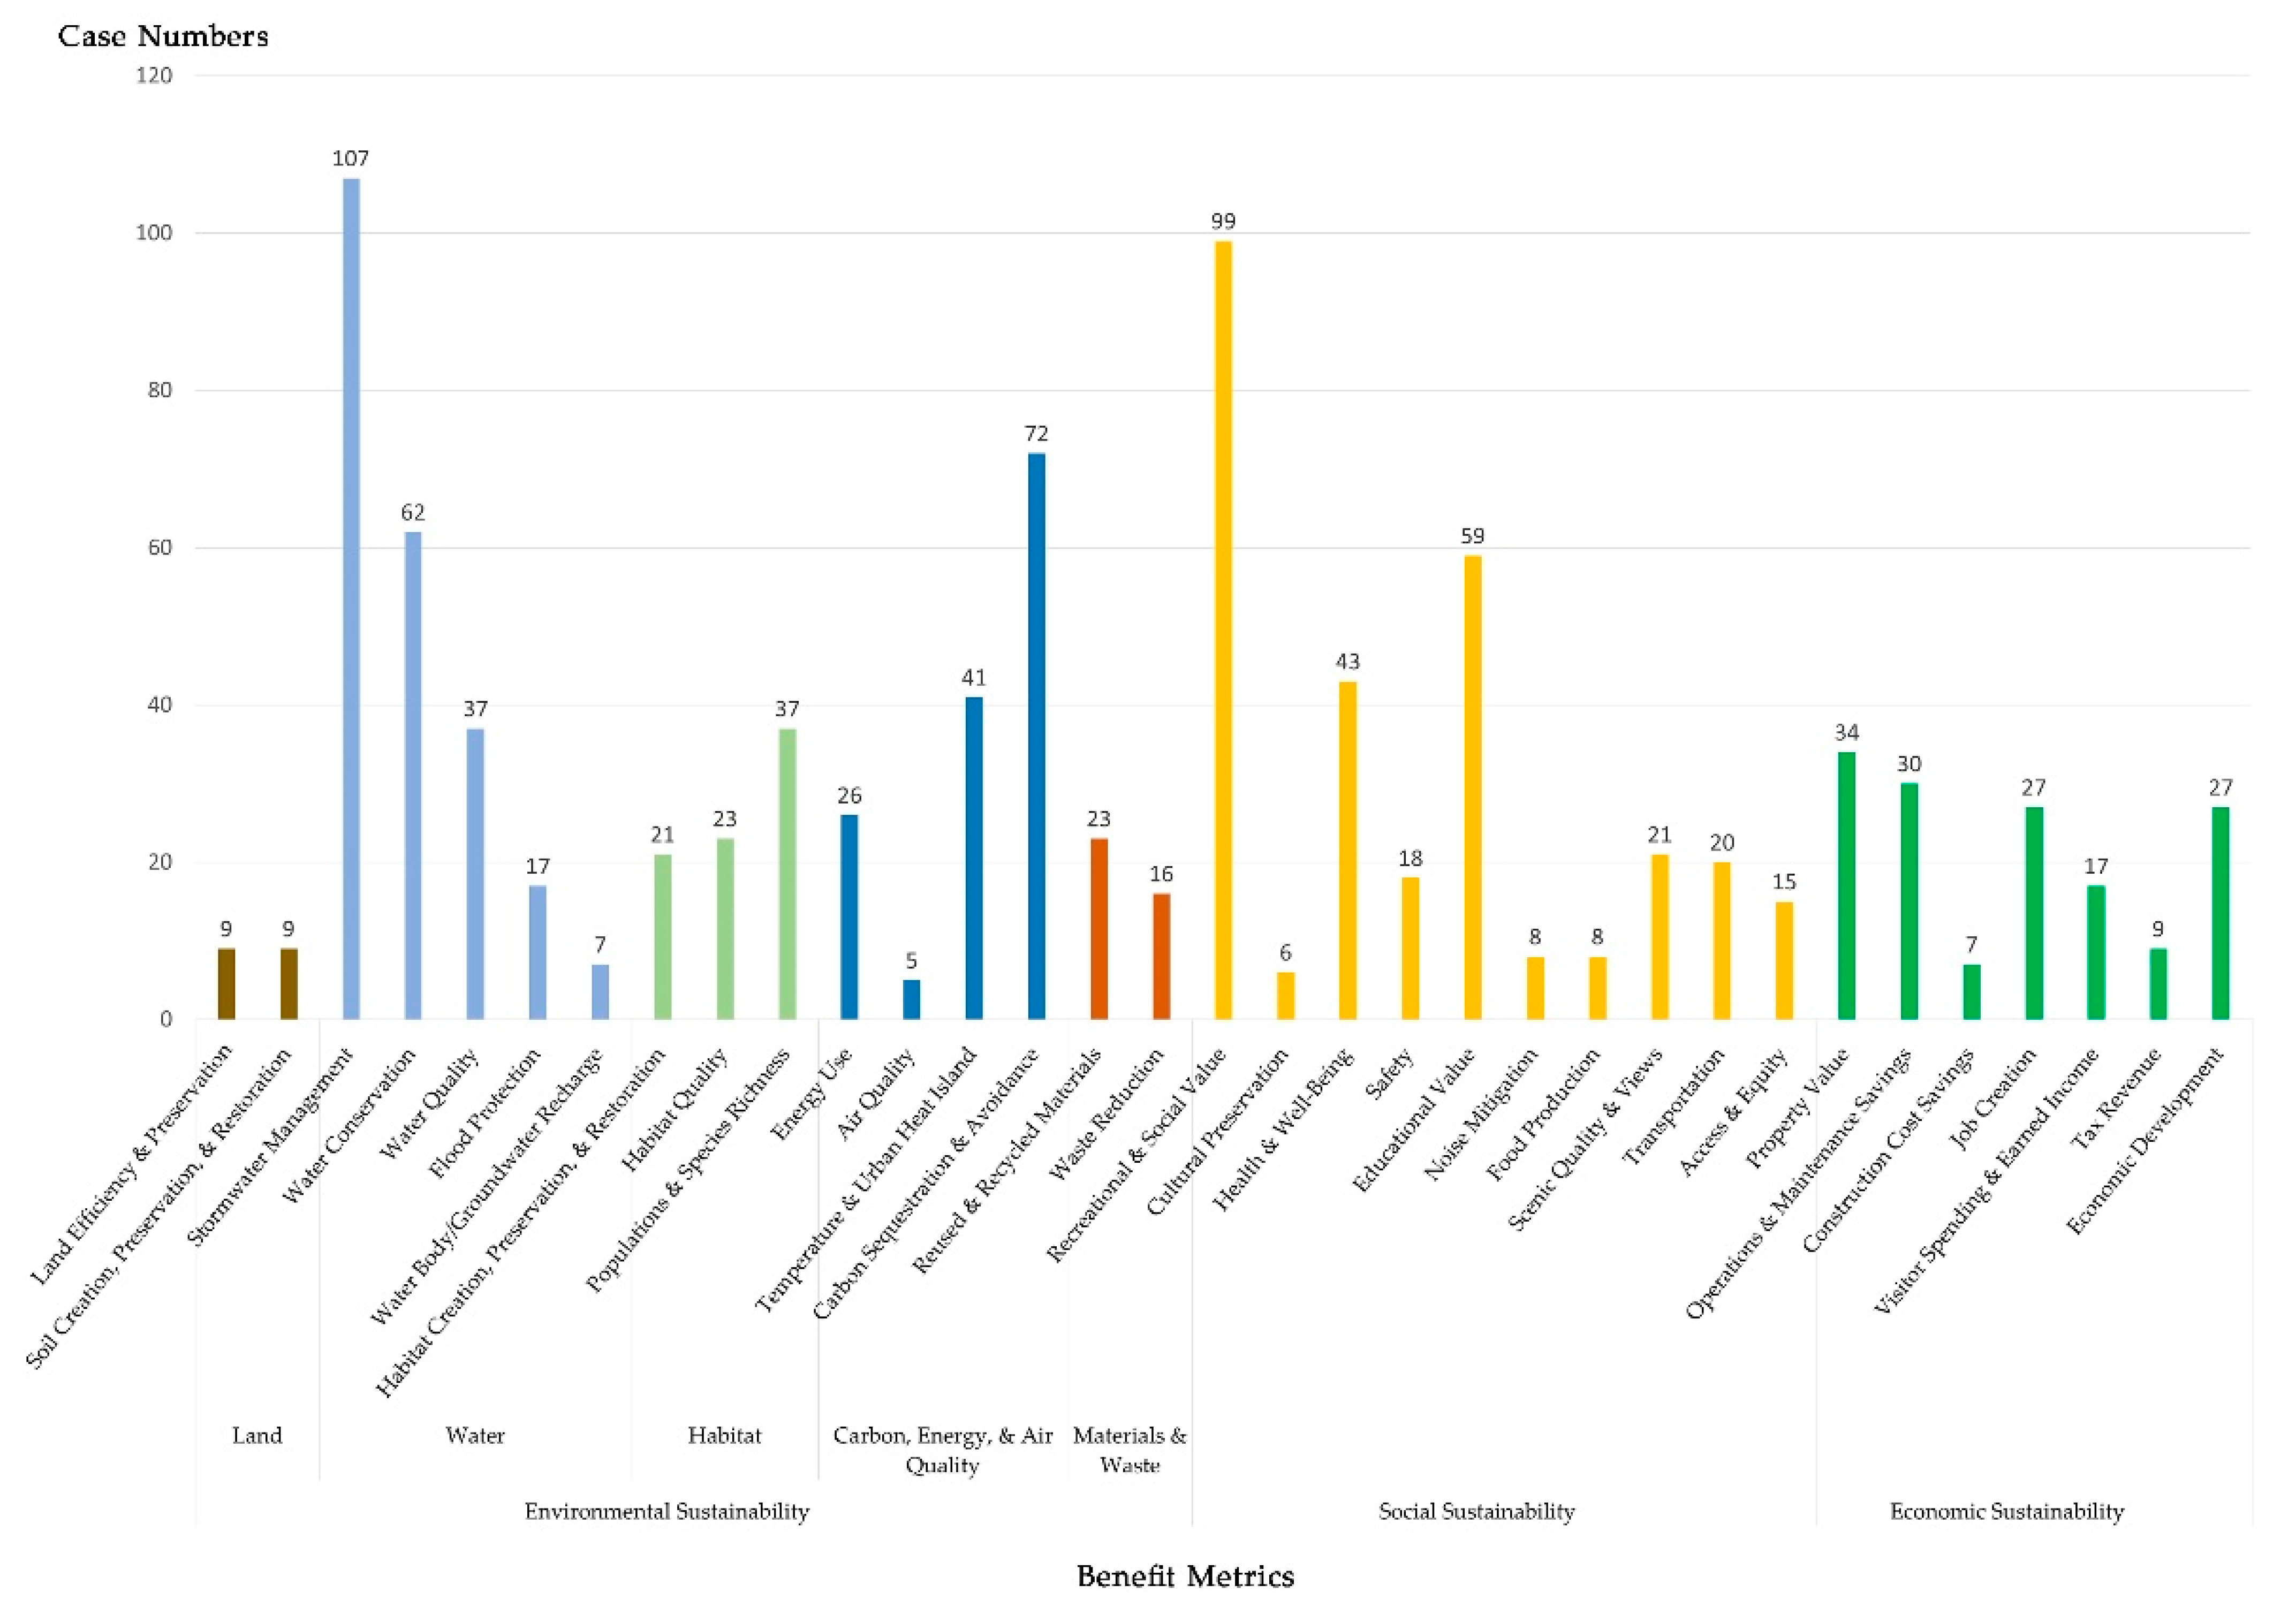
4.3. Tools in Each Benefit Metric

Depending on survey-based information, the study team conducted an analysis of tool utilization in all 163 cases. This analysis involved aligning 32 online tools with the metrics including 33 benefits, as depicted in Table 4. The findings suggest that although certain tools have the capability to assess several dimensions of performance, most online tools primarily focus on analyzing environmental performance. The ability to measure different environmental indicators is available in 23 tools. Contrarily, it is important to point out that few tools can assess social and economic performance. Only 11 tools can deal with the social component, and just 7 tools involve the economic component. The inadequacy of the tools is a potentially important factor contributing to the current imbalance in performance evaluation. In the context of biodiversity, numerous programs depend on referencing existing research findings as analytical foundations. For instance, in the Old Collier Golf Club project, the process of quantifying numerical data only relies on study results from the Audubon International project. Utilizing data from existing research to examine a specific instance creates apprehensions regarding its dependability and the extent to which it accurately represents the intended material. When a project’s biological performance is based on previous research findings from other projects, concerns arise regarding its dependability and content validity [16]. Out of the 37 studies on population and species richness, a significant proportion primarily documented an observed rise in avian population, without conducting a detailed examination of other creatures. While an increase in bird populations is reported, it is also reasonable to suspect that other wildlife and plant species are in decline at the same time. Flow meters and rain gauges are used as tools for measuring precipitation in a sizable number of the 107 stormwater control projects. This methodology entails significant expenses and requires an extended period of data collecting, resulting in a time-consuming and labor-intensive process due to the large study sites involved.
Table 4. A list of performance measurement tools used in 163 cases.

5. Smart Devices to Assess Landscape Performance

Compared to one-time measurements, smart devices can provide a more accurate, real-time, and thorough analysis of landscape performance [31]. This approach will enable researchers to comprehend the variables affecting landscape performance at a deeper level. With the assistance of smart sensor networks, technological improvements have increased the capacity to record sustainable information [31].
Multiple environmental performance measures can be longitudinally monitored by a smart device with sensors [32]. The evaluation of landscape performance and the development of new data sources are made possible by this type of monitoring. For instance, researchers can gather important data on wild animals, such as their size, appearance, and behavioral aspects, using cameras carried on smart devices [33]. The study of biodiversity and the identification of species benefit from this research. Photos and videos collected by smart devices can identify and monitor the distribution and existence of different species [34]. Therefore, smart devices can help to study current deficiencies in habitat, flora and fauna conservation, and biodiversity. By using smart devices to collect and examine real-time data, researchers can gain a more comprehensive and in-depth understanding of landscape performance [35]. Smart devices also help remove the limitations of one-time measurements and provide a more accurate assessment of the current state of the environment. Having the necessary data also helps researchers and policymakers make informed decisions. This approach in turn helps create more effective enhancement and management strategies. It allows a timely assessment of the impact and condition of the landscape. Additionally, the use of smart devices can minimize human error and interference, thereby increasing the reliability and accuracy of collected data [36]. Researchers can instantly assess and collect data using smart devices, gaining insight into environmental landscape performance and resources, and providing them with precise and updated information, enabling them to make more informed choices [37].
In social sustainability, the data collected by smart devices can be used to analyze existing programs and develop new strategies [35]. Researchers can collect information about the interactions of users on mobile and social media platforms. Changing the way researchers collect data, such as depending on the survey, can improve the accuracy and reliability of quantified social performance value. This data can be used to analyze social activity and social trends, providing insights into social engagement and sustainable social performance [38].
In the study of economic sustainability, smart devices with sensors can be quite useful. Researchers can assess the economic success indicators of ongoing projects and forecast development patterns by thoroughly analyzing the data collected on resource consumption and economic activities, etc. [39]. These tools could also monitor pedestrian activity and land use [40]. Doing so can provide researchers with the necessary support to develop economically sustainable practices and strategies [41]. This approach balances the protection of the environment and economic growth, which can lead to long-term success [35].

5.1. Cases for Quantifying Performance of Smart Devices

5.1.1. Applications in the Field of Architecture

In the design field, especially in the realm of architecture, smart devices are widely employed for the longitudinal tracking of building performance data to enhance sustainability and residential comfort. The detailed information collected from various sensors aids in analyzing and improving certain building characteristics, such as safety control, energy management, HVAC system control and monitoring, water management, lighting systems, elderly health systems, and fire detection [42]. Ateeq et al. [43] discussed the use of sensors, Wi-Fi, and microcontrollers for monitoring and managing IoT-based homes, showcasing how intelligent data collection can predict and reduce building energy consumption. Li, Hong, and Wang [44] utilized smart devices to monitor and predict indoor temperatures, and the experimental data they received contributed to enhancing the performance and energy efficiency of smart buildings. The accuracy of their results exceeded 90% [45].
In the Netherlands, the Zaanstad town hall employed an HVAC smart system for real-time monitoring and simulation of indoor temperature and humidity, successfully reducing the electricity consumption of the municipal hall by 14% [46] Research on 82 peer-reviewed articles related to smart building water management revealed that the sensors can provide information about rainfall, groundwater levels, and harvesting details. All this detailed information can be collected, transmitted, and stored in cloud systems through wireless communication, followed by data analysis. They found that smart devices can help researchers enhance awareness and provide better solutions for water resource recovery.

5.1.2. Applications in the Field of Landscape Performance

One relevant project is the Lausanne Urban Canopy Experiment conducted by the Swiss Federal Institute of Technology Lausanne, which focuses on research and teaching in hydrology and environmental fluid mechanics. This project employs sensors to collect landscape performance data and seeks to better understand climate change by answering questions such as: Why and how to measure precipitation, wind, temperature, and solar radiation? What is the relationship between temperature, elevation, and vegetation [47]? Similarly, the UScan project in Japan deployed low-cost sensors in Tokyo to detect temperature changes. The UScan system comprises three core components: a dedicated server responsible for collecting temperature data, wireless bridges for seamless connectivity, and uParts, which complete the essential ensemble [48]. According to Ono [49], smart devices can detect various environmental factors in real time and efficiently collect landscape performance data without the need for highly complex algorithms.
Other experiments also support the use of smart devices for accurate quantification of landscape performance. In a groundbreaking study conducted in Blacksburg, VA, Shen and Kim [13] successfully demonstrated the feasibility of obtaining real-time, dense, accurate, and frequent quantified landscape performance data over an extended period. The experiment meticulously quantified the relationship between various urban and suburban settings and their microclimate performances, particularly focusing on eCO2 and PM2.5 changes. Building on their previous success, Shen and Kim’s research team conducted another significant experiment in 2023. This study specifically aimed to quantify the water purification capacity of retention ponds utilizing smart devices. The preliminary quantitative estimates from this investigation revealed impressive results. It showed that retention ponds can effectively purify water, leading to a remarkable reduction in TDS concentration “by approximately 5.5 ppm and EC concentration by about 0.08 mS/cm in nearly 6 h for every 10,000 m3 of retention water” [50].
Smart devices can assist researchers in obtaining quantitative landscape performance characteristics of projects. These two experiments partially confirm that smart devices can gather longitudinal landscape performance data, and the landscape performance data obtained through longitudinal tracking with smart devices are more real-time, accurate, and spatially dense compared to data obtained through one-time measurements. The application of smart devices in the field of landscape performance enables landscape design professionals to access environmental data in a dense, accurate, and frequent manner, thereby better understanding the microclimate conditions of the site and making corresponding decisions to promote the development of landscape performance [13].

5.2. Utilized Smart Devices

Both the Uscan projects and Shen and Kim’s research utilized Arduino-based electronic boards, sensors, and other components. Therefore, the research team explores these components taking Arduino-based smart devices as examples. “Arduino is an open-source electronics platform based on easy-to-use hardware and software” [51]. The investigation finds that this type of device has the following characteristics: (1) low price, the original price of each device is usually between USD 10 and 30 [13,48]; (2) small size, for example, Shen and Kim’s smart device is 15 cm × 15 cm × 5 cm; (3) long lifetime and low energy requirements, e.g., the sensor modules all have a lifetime of several years [13], and the overall energy cost of the experimental node is about 1 to 5 Wh; (4) easy to learn, as its own developer community and online library provide programming code, video, or text tutorials that can help landscape architecture researchers who have no programming experience to quickly learn and use the device [52].

5.3. Potential Limitations of Solely Using Smart Devices

Admittedly, there are some potential limitations to data collection by solely using smart devices. For example, when funds are limited, it may lead to insufficient installation space density of smart devices. There may be situations where smart devices cannot cover the entire environment, resulting in data limitations that make it difficult to fully understand the complete performance. Second, although smart devices have the advantage of low maintenance, there may also be data distortion caused by extreme weather effects or equipment calibration problems. In addition, data privacy and security issues need to be fully considered. While collecting some performance data involves privacy, it needs to be ensured that it will not cause privacy leakage, especially in the processing and storage of data. Additionally, smart devices sometimes exhibit data inaccuracies. Moreover, smart devices sometimes exhibit data inaccuracies. The cause often involves two factors: first, smart devices may not adapt well to the environment in which they are first placed; second, there may be a slight variation in the equipment of different batches [53,54]. Hence the need for one-time and periodic device calibration is also a potential drawback of smart devices. The necessity of adjustment needs to be fully considered when using smart devices to ensure data comparability [54]. While smart devices can track a variety of complex performance indicators longitudinally, they also generate large amounts of data at the same time. Appropriate data processing methods need to be used to avoid data overload and loss of valuable information. To better understand landscape performance, the use of a combination of assessment methods can help to avoid the above potential limitations.

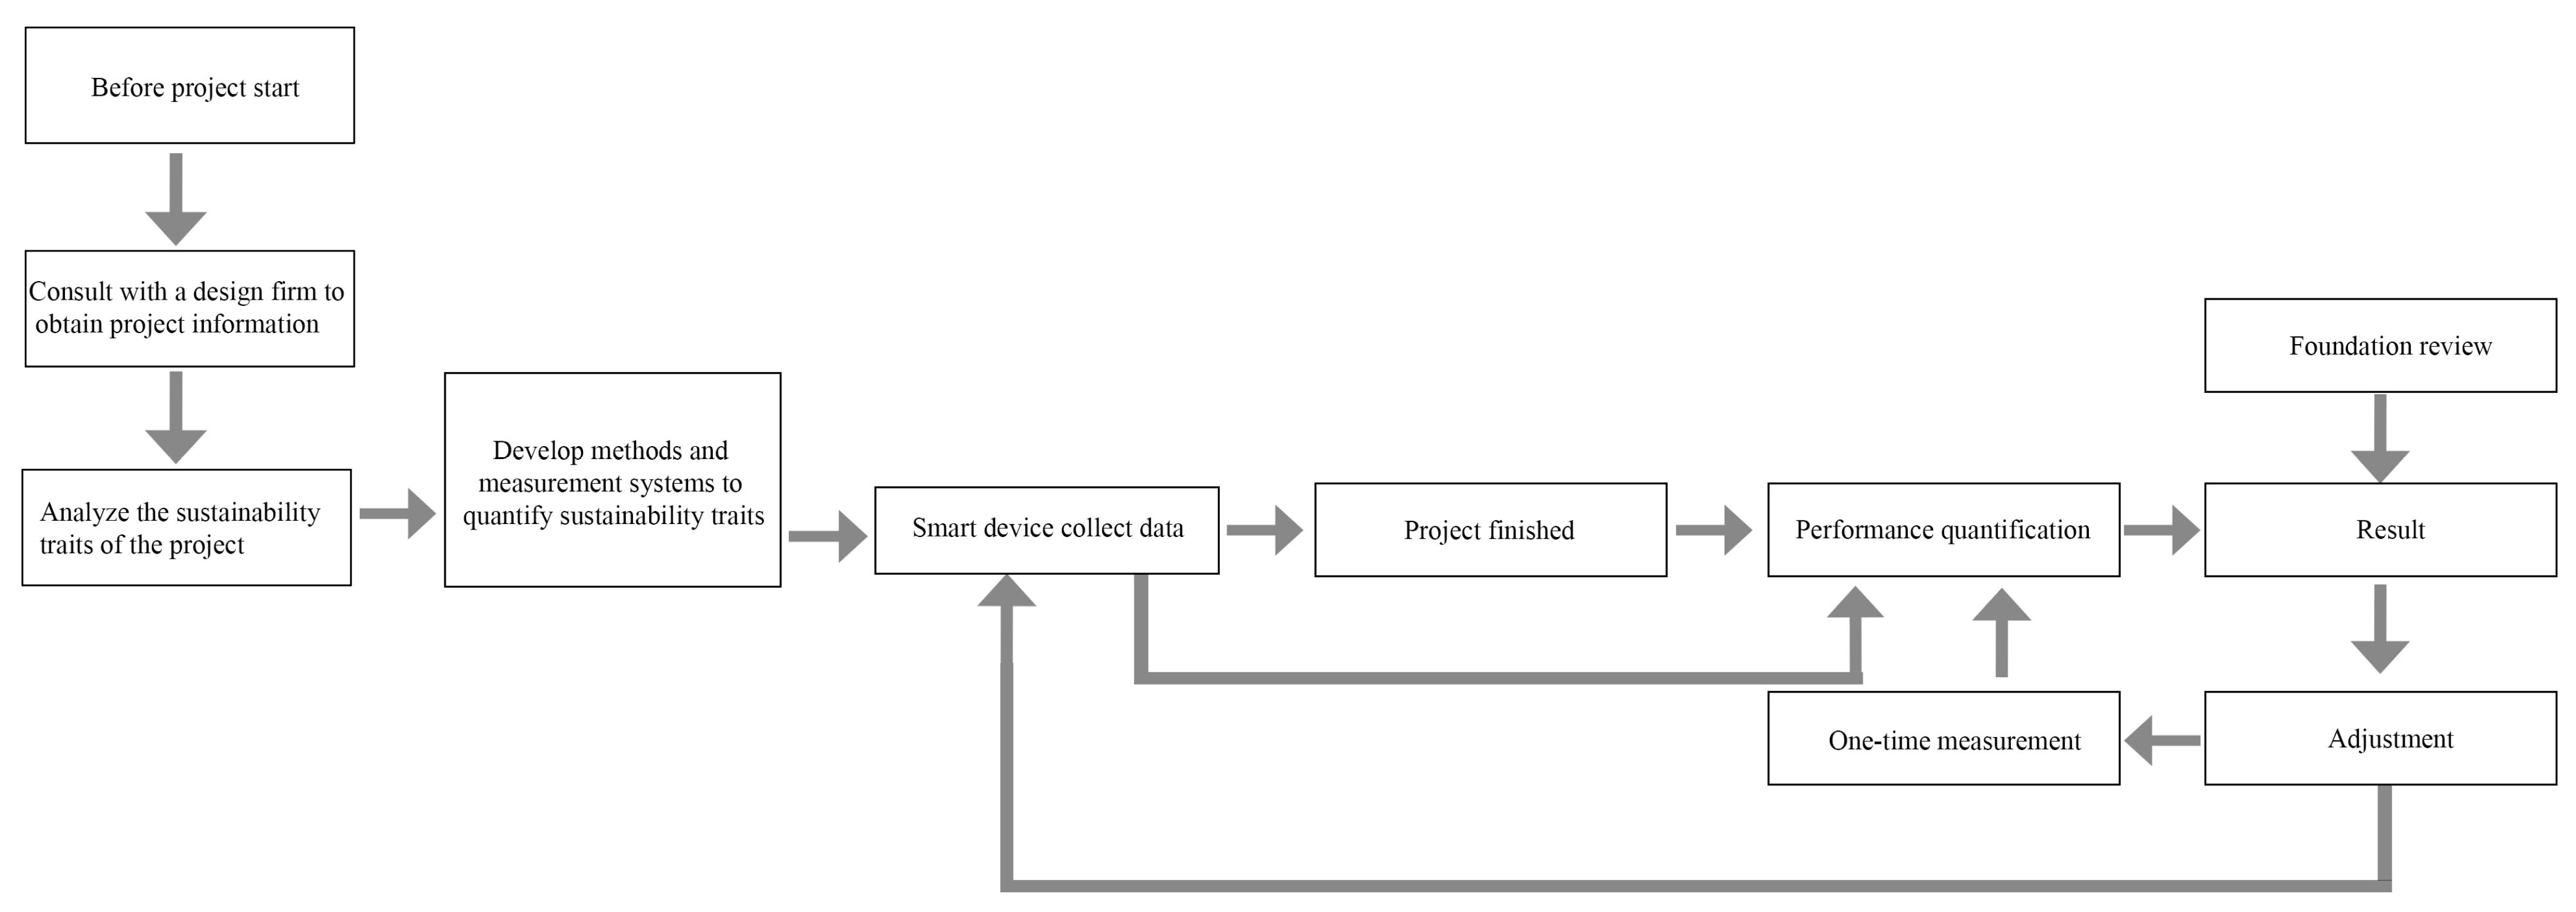
6. An Alternative Landscape Performance Measuring Framework

To address the challenges faced by current landscape performance evaluation methods and tools and based on the advantages demonstrated by smart devices, the research team proposes an alternative framework for measuring landscape performance. This framework involves the integration of pre-installed smart devices with traditional one-time measurements, considering them from the project’s design stage.
The traditional CSI research process begins after the completion of the project. Based on the information provided by the design company and the elucidation of the design objectives, the sustainable features of the project can be analyzed. Then, evaluation methods and metrics are developed for these features. After collecting the necessary data, landscape performance is quantified. The preliminary results are submitted for foundation review. Based on the feedback received, the evaluation methods and metrics are modified, data is updated, recalculations are performed, and the research report is revised before being resubmitted to the foundation. Upon obtaining approval from the foundation, the final research results are submitted [17]. Figure 5 illustrates this evaluation process.
Figure 5. Current landscape performance measurement framework.
The research team incorporated the use of smart devices into this process and introduced an alternative measurement framework (Figure 6). In contrast to the current evaluation step, smart devices are installed and configured during the project initiation phase based on the performance characteristics and goals of the project. The measurement of relevant performance data begins during the construction phase and continues after project completion, incorporating one-time measurements. After the results are audited by LAF, the methodology, and tools for smart devices and one-time measurements will be adjusted based on previous results.
Figure 6. An alternative landscape performance measurement framework with smart devices.
Pre-installing smart devices in the early stages of the project leads to real-time monitoring of various stages, including construction, planting, and operational phases. Ensuring instant data review becomes possible. This helps identify potential defects and problems in a timely manner, streamlines the construction process, and ensures smooth project implementation. Pre-installed smart devices record construction and operational data throughout the landscape project, providing the basis for subsequent performance evaluations. This helps to understand the long-term impact of the project and identify areas for improvement.
According to the above sections, both frameworks have their strengths and limitations (Table 5). The current framework allows landscape performance data to be gathered in a reasonably short amount of time because the existing framework uses online tools and manual field measurements. Professionals and researchers can quickly make decisions. However, the variety and dependability of performance statistics are constrained by labor and time expenses. Due to the researchers’ subjectivity and sampling bias, the reliability of the data was called into question. To measure various data manually, researchers must invest a significant amount of time and labor costs. The amount of data that can be gathered is constrained by factors, including time, funding, and the tools at hand. Additionally, the current framework may result in data limitation and a lack of dynamism in data because the landscape is a dynamic process. For instance, it is unable to account for performance variations throughout different time periods, which leads to erroneous and unreliable performance data.
Table 5. Strengths and limitations of both frameworks.
Alternative frameworks can help fill out current frameworks, although they might have some limits. In order to more accurately reflect changes in the landscapes and their performance, smart devices can collect performance data from a number of different sensors. Smart devices can reduce the effects of human error and judgment bias. Smart devices have the ability to longitudinally and in real time track landscape changes, documenting dynamic performance patterns. It can also assist in lowering labor and time costs concurrently during the whole data collection process. However, there are also some drawbacks. The usage of smart devices can necessitate additional technology, equipment, and knowledge, which could raise the difficulty and cost of implementation in the early stage of the research. Additionally, efficient data processing and analysis techniques are needed due to the potential size and complexity of the data it collects. Meanwhile, while the basic principles of using this framework remain the same across contexts, different project types can affect its application. For example, factors such as different challenges, data availability, and stakeholder dynamics in urban and rural settings may affect the applicability of the framework. In an urban environment, the density of smart devices may be higher due to the presence of infrastructure, buildings, and large populations [55]. The patterns of rural landscapes are relatively simple, and data are easy to obtain. However, urban landscape projects involve complex interactions among architectural structures, green spaces, transportation networks, and social dynamics, resulting in certain difficulties in obtaining data [56]. Urban projects usually involve more stakeholders than rural projects, such as urban planners, architects, community members, local authorities, etc. [57]. Using the framework in an urban setting should facilitate the integration of different perspectives and priorities in the assessment process.

7. Discussion

Under the background of increasing climate and environmental issues in order to achieve sustainable development, landscape architecture is a core field, as it provides important environmental, social, and economic benefits with built landscape projects. Landscape performance is the key to ensuring those benefits. The promotion of the development of landscape performance research will allow professionals and researchers to establish more sustainable practices.
The landscape performance evaluation framework in the US has several issues that need to be resolved. This study investigates the various aspects of the LPS system, including its online tools and case studies. There is also an imbalance in the performance research on the economy, environment, and society, which is related to sustainable development. Most studies tend to focus on environmental performance while neglecting the economic and social aspects. The economy, society, and environment are interrelated, and any changes in one pillar may affect others. A comprehensive analysis of these factors is required for a more accurate understanding of sustainable development. The lack of tools is one of the main reasons. Its insufficiency is mainly manifested in two aspects: data availability and insufficient measurement metrics. There is more quantifiable data in the environmental field because environmental impacts can usually be measured and monitored. However, quantitative research on social and economic benefits may be limited by quantitative tools, making it difficult to conduct a comprehensive assessment. Quantifying social and economic benefits may require more complex methodologies and measurement metrics, which may make it relatively difficult to develop measurement tools. A lack of appropriate tools may lead researchers to favor more readily available environmental data. The lack of a comprehensive framework and conceptualization for research is another one of the factors that contribute to the issue of under-representation of the environment, society, and economy in the studies. In addition, the lack of data due to inadequate tools, varying stakeholder focus, and obstacles in interdisciplinary research also contribute to this issue. Various disciplines and stakeholders must work together to address this issue. Adopting a unified approach to conducting comprehensive studies that incorporate the economy, society, and environment within a framework is vital. Interdisciplinary collaborations can be beneficial, as they allow experts from varying disciplines to come together and provide a more holistic analysis. Exploiting the availability of reliable information, especially in disadvantaged areas, is essential. Collaboration among businesses, governments, and research institutions can help produce dependable data that can support intricate studies. Involving diverse groups in the research process fosters a more inclusive study and precludes the overuse of a single pillar. To ensure comprehensiveness and balance, it is important to establish mechanisms that regularly appraise and monitor research findings across various perspectives.
Using smart devices in landscape performance research is a relatively new topic. Smart devices assist landscape professionals and researchers to easily auto-collect and analyze longitudinal and more sustainable performance data, including some current data gathered with difficulty. Smart devices can collect data on almost every aspect of the landscape, both micro and macro. Traditional methods of assessing performance may involve manual sampling or measurement, which is prone to human error. Using smart devices for data collection can enhance the reliability and objectivity of data and reduce human intervention. With the assistance of smart devices, environmental, social, and economic data can be integrated to provide a more comprehensive view of landscape sustainability.
In order to ensure the reliability of the data, it is necessary to establish a smart device-assisted longitudinal measurement framework. The continuous collaboration between one-time measurements and longitudinal tracking using smart devices, following project completion, complements each other and maximizes the representation of all dimensions of landscape performance. One-time measurements provide rapid initial data collection, facilitating a quick understanding of the current state and issues of the landscape. At the same time, longitudinal tracking using smart devices enables continuous data collection, providing long-term observations that delve into the evolving trends and long-term effects of landscape performance. This helps researchers to adjust strategies and measures in a timely manner to optimize landscape performance. By combining data from both approaches, a more comprehensive and multidimensional landscape performance evaluation system can be achieved. Additionally, by comparing different observation data over an extended period, the effectiveness of landscape improvement measures can be verified, ensuring the reliability and accuracy of the evaluation results. In summary, the synergistic research of one-time measurements and longitudinal tracking using smart devices contributes to enhancing the depth and breadth of landscape performance evaluation. This new framework will eventually help to promote sustainable development of the landscape.

8. Conclusions

This study examines various issues and challenges encountered in landscape performance research and presents an alternative research framework centered on smart devices. The research team conducted comprehensive investigations on the three fundamental components of sustainable development, as outlined by LPS: the environment, social, and economic sustainability. Additionally, researchers examined the metrics with 33 benefits associated with the three pillars. The findings of the study revealed the presence of an imbalance in the present landscape performance studies, indicating a need for further research and rectification. The existing body of research on landscape performance has exhibited a disproportionate emphasis on environmental sustainability but overlooks the equally important dimensions of social and economic sustainability. A comprehensive examination of 163 instances of performance in the United States has brought some deeper issues. The lack of standardization in methods and tools utilized across various research teams conducting performance assessment projects causes the inconsistency of the results, hence impeding the implementation of cross-case comparisons and casting doubt on the validity of measurement outcomes. Moreover, a significant proportion of cases employed one-time measurements. Due to the dynamic nature of landscapes, one-time measurements may not adequately capture the continuous performance or fluctuations in landscape performance. A comprehensive understanding of the interplay between various landscape elements and their temporal impact on performance cannot be fully achieved using one-time measurements. Furthermore, the landscape performance study suffers from an insufficient of available tools. The 32 software programs provided by LCS websites commonly encounter challenges in terms of usability and exhibit problems related to the accuracy and reliability of the results they provide. This study presents an alternative framework for evaluating landscape performance by utilizing smart devices. The research team also highlights the benefits of employing smart devices in sustainable research and provides examples of their application in the realms of environmental, social, and economic sustainability. Additionally, the research team offers recommendations for the future advancement of landscape performance. Future landscape performance research needs to comprehensively consider environmental, economic, and social sustainability; a unified approach is needed to measure landscape performance; both one-time measurements and long-term longitudinal tracking are needed to quantify landscape performance; more research is needed to enrich landscape performance measurement tools; multidisciplinary comprehensive research is necessary.
Nevertheless, it is important to acknowledge that this study does possess certain limitations, hence necessitating the need for subsequent studies. The sample size for evaluating performance tools was limited due to cost and time constraints. A greater volume of diverse samples is likely to result in more precise and reliable analysis outcomes. Furthermore, by using additional variables beyond cost, ease of use, and accuracy, it is possible to anticipate improved and comprehensive results when assessing performance evaluation tools. Also, the research team exclusively examined cases that occurred within the United States, as most of the LPS listed tools are based on U.S. information and data. Although the findings of the study acknowledge the potential global feasibility and present an alternative framework, variations in economic, cultural, policy, and other aspects across different areas may have impacted this study’s findings or influenced the framework’s establishment. Hence, it is vital to conduct further investigations on landscape performance research across various countries and locations. Simultaneously, it should be noted that the framework proposed by the present study is merely a prototype, necessitating additional research to facilitate further enhancements. The alternative framework proposed in this study also needs further exploration. It is necessary to further consider the challenges in practical implementation, such as considering the impact of different geographical locations or environmental backgrounds on this framework and the limitations of applying this framework. At the same time, in order to fully analyze the effectiveness of this framework, the research team will implement comparative experiments in subsequent studies to provide a balanced discussion that considers both the strengths and limitations of both the current and the alternative framework.
Overall, this study contributes to the development of landscape performance. By analyzing the gaps in the current landscape performance field and proposing an alternative framework, a more complete landscape performance evaluation model and more comprehensive and accurate performance quantification results can be expected. This research helps to promote the development of the landscape architecture discipline and achieve the goal of sustainable development.

Author Contributions

Conceptualization, Z.S., M.K., X.P. and C.D.; Formal analysis, Z.S. and X.P.; Investigation, Z.S., X.P. and C.D.; Methodology, Z.S. and M.K.; Project administration, Z.S. and M.K.; Software X.P. and C.D.; Resources, Z.S. and M.K.; Supervision, M.K.; Validation, Z.S. and X.P.; Writing, Z.S. and X.P. All authors have read and agreed to the published version of the manuscript.

Funding

This research received no external funding.

Institutional Review Board Statement

Institutional Review Board of Virginia Tech, Exempt.

Data Availability Statement

Part of the data presented in this study are available on request from the corresponding author.

Conflicts of Interest

The authors declare no conflict of interest.

References

  1. Shafique, M.; Kim, R.; Rafiq, M. Green roof benefits, opportunities and challenges—A review. Renew. Sustain. Energy Rev. 2018, 90, 757–773. [Google Scholar] [CrossRef]
  2. Hanna, E.; Comín, F.A. Urban green infrastructure and sustainable development: A review. Sustainability 2021, 13, 11498. [Google Scholar] [CrossRef]
  3. Mohajerani, A.; Bakaric, J.; Jeffrey-Bailey, T. The urban heat island effect, its causes, and mitigation, with reference to the thermal properties of asphalt concrete. J. Environ. Manag. 2017, 197, 522–538. [Google Scholar] [CrossRef] [PubMed]
  4. Johnson, B.R.; Hill, K. (Eds.) Ecology and Design: Frameworks for Learning; Island Press: Washington, DC, USA, 2002; Volume 1. [Google Scholar]
  5. Jorgensen, A. Looking backwards, looking forwards. Landsc. Res. 2014, 39, 1–6. [Google Scholar] [CrossRef]
  6. Steiner, F. Frontiers in urban ecological design and planning research. Landsc. Urban Plan. 2014, 125, 304–311. [Google Scholar] [CrossRef]
  7. Brown, R.D.; Corry, R.C. Evidence-based landscape architecture: The maturing of a profession. Landsc. Urban Plan. 2011, 100, 327–329. [Google Scholar] [CrossRef]
  8. Jost, J.T.; Amodio, D.M. Political ideology as motivated social cognition: Behavioral and neuroscientific evidence. Motiv. Emot. 2012, 36, 55–64. [Google Scholar] [CrossRef]
  9. Landscape Performance Series. 2023. Available online: https://www.landscapeperformance.org/about-landscape-performance (accessed on 7 July 2023).
  10. Canfield, J.; Yang, B. Reflections on developing landscape performance case studies. Landsc. Res. Rec. 2014, 1, 310–317. [Google Scholar]
  11. Yang, B.; Li, S.; Binder, C. A research frontier in landscape architecture: Landscape performance and assessment of social benefits. Landsc. Res. 2016, 41, 314–329. [Google Scholar] [CrossRef]
  12. Yang, B. Landscape performance evaluation in socio-ecological practice: Current status and prospects. Socio-Ecol. Pract. Res. 2020, 2, 91–104. [Google Scholar] [CrossRef]
  13. Shen, Z.; Kim, M. Improving Landscape Performance Measurement: Using Smart Sensors for Longitudinal Air Quality Data Tracking. J. Digit. Landsc. Archit. 2022, 164–173. [Google Scholar] [CrossRef]
  14. Kusters, K.; Buck, L.; de Graaf, M.; Minang, P.; van Oosten, C.; Zagt, R. Participatory planning, monitoring and evaluation of multi-stakeholder platforms in integrated landscape initiatives. Environ. Manag. 2018, 62, 170–181. [Google Scholar] [CrossRef]
  15. Tiele, A.; Esfahani, S.; Covington, J. Design and development of a low-cost, portable monitoring device for indoor environment quality. J. Sens. 2018, 2018, 5353816. [Google Scholar] [CrossRef]
  16. Luo, Y.; Li, M.H. Landscape Performance of Built Projects: Comparing Landscape Architecture Foundation’s Published Metrics and Methods. Landsc. Archit. 2014. [Google Scholar]
  17. Dai, D.X.; Li, M.H. Research development of landscape performance assessment in America. Landsc. Archit. 2015, 1, 25–31. [Google Scholar]
  18. Canfield, J.; Yang, B.; Whitlow, H. Evaluating Landscape Performance—A Guidebook for Metrics and Methods Selection; Landscape Architecture Foundation: Washington, DC, USA, 2018. [Google Scholar]
  19. Luo, Y. Enhancing Quantification of a Landscape Project’s Environmental, Economic and Social Benefits: A Study of Landscape Architecture Foundation’s Landscape Performance Series. Doctoral Dissertation, Texas A&M University. Texas A&M University, College Station, TX, USA, 2014. [Google Scholar]
  20. Haines-Young, R. Sustainable development and sustainable landscapes: Defining a new paradigm for landscape ecology. Fennia 2000, 178, 7–14. [Google Scholar]
  21. Ozdil, T.R. Social value of urban landscapes: Performance study lessons from two iconic Texas projects. Landsc. Archit. Front. 2016, 4, 12–30. [Google Scholar]
  22. Terkenli, T.S.; Gkoltsiou, A.; Kavroudakis, D. The interplay of objectivity and subjectivity in landscape character assessment: Qualitative and quantitative approaches and challenges. Land 2021, 10, 53. [Google Scholar] [CrossRef]
  23. Wu, J. Landscape sustainability science: Ecosystem services and human well-being in changing landscapes. Landsc. Ecol. 2013, 28, 999–1023. [Google Scholar] [CrossRef]
  24. Kostrubiec, V.; Zanone, P.G.; Fuchs, A.; Kelso, J.S. Beyond the blank slate: Routes to learning new coordination patterns depend on the intrinsic dynamics of the learner\textemdashexperimental evidence and theoretical model. Front. Hum. Neurosci. 2012, 6, 222. [Google Scholar] [CrossRef]
  25. Landscape Performance Series. 2023. Available online: https://www.landscapeperformance.org/benefits-toolkit (accessed on 7 July 2023).
  26. Modi, S.K. Perspectives on Environmental Landscape Performance Indicators and Methods: Learning from Landscape Architecture Foundation’s Case Study Investigation Program; The University of Texas at Arlington: Arlington, USA, 2014. [Google Scholar]
  27. Bixler, R.P.; Johnson, S.; Emerson, K.; Nabatchi, T.; Reuling, M.; Curtin, C.; Romolini, M.; Grove, J.M. Networks and landscapes: A framework for setting goals and evaluating performance at the large landscape scale. Front. Ecol. Environ. 2016, 14, 145–153. [Google Scholar] [CrossRef]
  28. Deming, M.E.; Swaffield, S. Landscape Architectural Research: Inquiry, Strategy, Design; John Wiley Sons: Hoboken, NJ, USA, 2011. [Google Scholar]
  29. Francis, M. A case study method for landscape architecture. Landsc. J. 2001, 20, 15–29. [Google Scholar] [CrossRef]
  30. Murphy, M.D. Landscape Architecture Theory: An Evolving Body of Thought; Waveland Press: Long Grove, IL, USA,, 2005. [Google Scholar]
  31. Lan, S.; Qilong, M.; Du, J. Architecture of wireless sensor networks for environmental monitoring. In Proceedings of the 2008 International Workshop on Education Technology and Training 2008 International Workshop on Geoscience and Remote Sensing, Shanghai, China, 21–22 December 2008; Volume 1, pp. 579–582. [Google Scholar]
  32. Schieweck, A.; Uhde, E.; Salthammer, T.; Salthammer, L.C.; Morawska, L.; Mazaheri, M.; Kumar, P. Smart homes and the control of indoor air quality. Renew. Sustain. Energy Rev. 2018, 94, 705–718. [Google Scholar] [CrossRef]
  33. Norouzzadeh, M.S.; Nguyen, A.; Kosmala, M.; Swanson, A.; Palmer, M.S.; Packer, C.; Clune, J. Automatically identifying, counting, and describing wild animals in camera-trap images with deep learning. Proc. Natl. Acad. Sci. USA 2018, 115, E5716–E5725. [Google Scholar] [CrossRef] [PubMed]
  34. Kays, R.; Tilak, S.; Kranstauber, B.; Jansen, P.A.; Carbone, C.; Rowcliffe, M.J.; Fountain, T.; Eggert, J.; He, Z. Monitoring wild animal communities with arrays of motion sensitive camera traps. arXiv 2010, arXiv:1009.5718. [Google Scholar]
  35. Bibri, S.E.; Krogstie, J. Environmentally data-driven smart sustainable cities: Applied innovative solutions for energy efficiency, pollution reduction, and urban metabolism. Energy Inform. 2020, 3, 1–59. [Google Scholar]
  36. Low, K.S.; Win, W.N.N.; Er, M.J. Wireless sensor networks for industrial environments. In Proceedings of the International Conference on Computational Intelligence for Modelling, Control and Automation and International Conference on Intelligent Agents, Web Technologies and Internet Commerce (CIMCA-IAWTIC’06), Vienna, Austria, 28–30 November 2005; Volume 2, pp. 271–276. [Google Scholar]
  37. Firouzi, F.; Farahani, B.; Marinšek, A. The convergence and interplay of edge, fog, and cloud in the AI-driven Internet of Things (IoT). Inf. Syst. 2022, 107, 101840. [Google Scholar] [CrossRef]
  38. Manzira, F.M.; Bankole, F. Application of Social Media Analytics in the banking sector to drive growth and sustainability: A proposed integrated framework. In Proceedings of the 2018 Open Innovations Conference (OI), Johannesburg, South Africa, 3–5 October 2018; pp. 223–233. [Google Scholar]
  39. Almalki, F.A.; Alsamhi, S.H.; Sahal, R.; Hassan, J.; Hawbani, A.; Rajput, N.S.; Saif, A.; Morgan, J.; Breslin, J. Green Iot for Eco-Friendly and Sustainable Smart Cities: Future Directions and Opportunities. Mob. Netw. Appl. 2021, 1–25. [Google Scholar] [CrossRef]
  40. Stoop, G. Using Land-Use Data to Improve Automatic Classification Accuracy of Machine Learning Models for Classifying Outdoor Sport Activities in GNSS-Tracks. Master’s Thesis, Utrecht University, Utrecht, The Netherlands, 2022. [Google Scholar]
  41. Angelidou, M.; Psaltoglou, A.; Komninos, N.; Kakderi, C.; Tsarchopoulos, P.; Panori, A. Enhancing sustainable urban development through smart city applications. J. Sci. Technol. Policy Manag. 2018, 9, 146–169. [Google Scholar] [CrossRef]
  42. Vijayan, D.S.; Rose, A.L.; Arvindan, S.; Revathy, J.; Amuthadevi, C. Automation systems in smart buildings: A review. J. Ambient Intell. Human Comput, 2020. [Google Scholar] [CrossRef]
  43. Ateeq, M.; Ishmanov, F.; Afzal, M.K.; Naeem, M. Multi-parametric analysis of reliability and energy consumption in IoT: A deep learning approach. Sensors 2019, 19, 309. [Google Scholar] [CrossRef]
  44. Li, S.; Hong, D.; Wang, H. Relation inference among sensor time series in smart buildings with metric learning. Proc. AAAI Conf. Artif. Intell. 2020, 34, 4683–4690. [Google Scholar] [CrossRef]
  45. Capozzoli, A.; Piscitelli, M.S.; Gorrino, A.; Ballarini, I.; Corrado, V. Data analytics for occupancy pattern learning to reduce the energy consumption of HVAC systems in office buildings. Sustain. Cities Soc. 2017, 35, 191–208. [Google Scholar]
  46. Vázquez-Canteli, J.R.; Ulyanin, S.; Kämpf, J.; Nagy, Z. Fusing TensorFlow with building energy simulation for intelligent energy management in smart cities. Sustain. Cities Soc. 2019, 45, 243–257. [Google Scholar]
  47. Liens D’accessibilité. EPFL. (22 October 2015). Available online: https://archiveweb.epfl.ch/eflum.epfl.ch/ (accessed on 13 July 2023).
  48. Beigl, M.; Krohn, A.; Riedel, T.; Zimmer, T.; Decker, C.; Isomura, M. The uPart Experience: Building a Wireless Sensor Network. In Proceedings of the 5th International Symposium on Information Processing in Sensor Networks (IPSN 2006), Poster Session of SPOT Track, Nashville, TN, USA, 19–21 April 2006; pp. 366–373. [Google Scholar]
  49. Ono, T.; Ishizuka, H.; Ito, K.; Ishida, Y.; Miyazaki, S.; Mihirogi, O.; Tobe, Y. Uscan: Towards Fine-Grained Urban Sensing. In Proceedings of the International Workshop on Real Field Identification (RFId2007), Tokyo, Japan. Available online: https://citeseerx.ist.psu.edu/document?repid=rep1&type=pdf&doi=f5533cb93e0a62f43ad3ec22bfdd3f68ada1cdb4 (accessed on 13 July 2023).
  50. Shen, Z.; Kim, M. Longitudinal Water Pollution Monitoring and Retention Pond Capacity Assessment Using Smart Devices. 2023; J. Digit. Landsc. Archit. 57–64. [Google Scholar] [CrossRef]
  51. Jain, A.; Sarkar, A.; Ather, D.; Raj, D. Temperature Based Automatic Fan Speed Control System using Arduino. SSRN, 2022; SSRN 4159188. [Google Scholar]
  52. Arduino, S.A. Arduino; Arduino LLC.: Boston, MA, USA, 2015; p. 372. Available online: https://search.iczhiku.com/paper/TFzDJhGhd6VMaDsI.pdf (accessed on 18 July 2023).
  53. Perera, C.; Qin, Y.; Estrella, J.C.; Reiff-Marganiec, S.; Vasilakos, A.V. Fog computing for sustainable smart cities: A survey. ACM Comput. Surv. (CSUR) 2017, 50, 1–43. [Google Scholar]
  54. Hyder, K.; Rossberg, A.G.; Allen, J.I.; Austen, M.C.; Barciela, R.M.; Bannister, H.J.; Blackwell, P.G.; Blanchard, J.L.; Burrows, M.T.; Defriez, E.; et al. Making modelling count-increasing the contribution of shelf-seas community and ecosystem models to policy development and management. Mar. Policy 2015, 61, 291–302. [Google Scholar]
  55. Napolitano, R.; Reinhart, W.; Gevaudan, J.P. Smart cities built with smart materials. Science 2021, 371, 1200–1201. [Google Scholar] [PubMed]
  56. Puskás, N.; Abunnasr, Y.; Naalbandian, S. Assessing deeper levels of participation in nature-based solutions in urban landscapes–A literature review of real-world cases. Landsc. Urban Plan. 2021, 210, 104065. [Google Scholar]
  57. Jayasena, N.S.; Mallawaarachchi, H.; Waidyasekara, K.G.A.S. Stakeholder analysis for smart city development project: An extensive literature review. MATEC Web Conf. 2019, 266, 06012. [Google Scholar]
Disclaimer/Publisher’s Note: The statements, opinions and data contained in all publications are solely those of the individual author(s) and contributor(s) and not of MDPI and/or the editor(s). MDPI and/or the editor(s) disclaim responsibility for any injury to people or property resulting from any ideas, methods, instructions or products referred to in the content.

Article Metrics

Citations

Article Access Statistics

Multiple requests from the same IP address are counted as one view.