1. Introduction
Apple foliar diseases constitute a significant concern for apple farmers and orchard managers worldwide. These diseases can affect the health and productivity of apple trees, resulting in significant economic losses. Apple foliar diseases are produced by various pathogens, such as fungi and viruses, which infect the leaves of apple trees. Symptoms of these diseases can include leaf spots, wilting, discolouration, and a premature leaf drop. Prevention and control measures for apple foliar diseases include maintaining good sanitation practices, using fungicides, planting resistant apple cultivars, and practising crop rotation. Early detection and timely management of these diseases are crucial for preventing significant crop losses and ensuring the health of apple trees. Preventive measures are essential for managing apple diseases. Some standard preventive measures for apple diseases include using plant disease-resistant varieties, orchard sanitation, timely application of fungicides and insecticides, proper irrigation and drainage, proper nutrition and soil management, and regular monitoring and scouting of the orchard. This can help prevent the spread of diseases and reduce the need for more aggressive disease management practices [
1].
Apple foliar disease classification is significant because it helps growers and researchers accurately identify and diagnose the disease affecting their apple trees. By accurately identifying the disease, growers can implement targeted and effective management strategies to control and prevent the spread of the disease, thereby minimizing the impact on tree health, fruit quality, and yield. Accurate classification also helps develop effective disease management strategies by providing information on the prevalence and severity of different diseases in different regions, allowing growers to make informed decisions regarding disease prevention and management [
2].
There are several challenges in apple foliar disease classification, including variability in disease symptoms, making it difficult to identify the specific disease affecting the tree accurately. Some diseases can have overlapping symptoms, making distinguishing between them challenging. Environmental factors such as weather conditions can impact the development and severity of diseases, making it difficult to classify them [
3] accurately. More data on specific diseases may be available, making it easier to develop accurate classification models. Additionally, accurate disease classification can facilitate research efforts to better understand the causes and mechanisms of different diseases, which can help develop more effective and sustainable disease management practices. Overall, the significance of apple foliar disease classification lies in its ability to improve disease management, prevent crop losses, and enhance the sustainability and profitability of apple production. Virus and viroid contamination of propagating material is pervasive and dangerous to sustainable orchard management. Therefore, an automated system is required to classify apple foliar diseases early because apple orchards are a mega-dollar industry, and foliar diseases threaten a large portion of their revenue.
However, traditional methods of plant disease surveillance include manual scouting and an analysis of plant leaf characteristics, texture, colour, and form, leading to delays in diagnoses and inaccurate assessments. Recently, automated methods for image categorization have gained popularity due to their usefulness in the agricultural industry. The various methods that researchers develop are given in the next section. Here is the structure of the rest of the article: related work is given in
Section 2,
Section 3 gives the information about the dataset used, the proposed methodology is shown in
Section 4, the results and discussion are given in
Section 5, and
Section 6 follows with a conclusion.
2. Related Work
Several CNN-based methods have been developed and deployed with positive results in disease prediction for various crops. Such techniques were trained and evaluated across multiple disease-specific datasets. Classifying these diseases manually can be tedious, time-consuming, and expensive. There are financial and time-saving benefits to accelerating this process. Many plant disease categorization systems are available to aid in the automatic differentiation of plant diseases for users who are neither experts nor botanists. The ability to quickly and correctly identify an item can significantly impact both time and money. Liu et al. [
4] designed a deep convolutional neural network based on AlexNet to detect apple leaf diseases. They used a dataset of 13,689 images with four different classes. They achieved an overall accuracy of 97.62%.
Rothe et al. [
5] developed a pattern recognition system for detecting and categorising three cotton leaf diseases. To train an adaptive neuro-fuzzy inference system on the collected dataset of actual images, we first employed an active contour model for image segmentation and then retrieved Hu’s moments as features. In general, the pattern recognition algorithm was 85% accurate. Li et al. [
6] used four categories of apple disease to classify apple leaf disease. They worked using ResNet-18 and ResNet-34 and found out that ResNet-18 was performing best with a lesser loss rate. To categorize apple infections, Yu et al. [
7] suggested a deep convolutional neural network (DCNN) based on Region of Interest (ROI) perception. Before using VGG to classify diseases, leaf regions were first separated using a specially developed ROI sub-network, and the resulting overall accuracy was 84.3%. Khan et al. [
8] in 2022 used 9000 apple leaf disease images. They designed a system with two stages that include classification in stage 1, and localization of each disease is shown in stage 2. They obtained results with a classification accuracy of 88%.
Gargade et al. [
9] devised a parameter-measuring system using the k-NN algorithm to diagnose apple leaf faults. Prediction of apple leaves was accomplished with the help of a Multilayered Perceptron (MLP) pattern classifier that used 11 features extracted from images of apple leaves [
10]. With the advent of deep learning, Liu et al. [
4] created a neural network convolutional architecture with AlexNet for detecting leaf blotches. Later, the XDNet model outperformed the others by a wide margin with an illness diagnosis [
11]. In addition, evaluations of leaf symptom severity have been performed successfully using deep learning [
12]. Sharma et al. [
13] proposed an integrated approach for leaf disease detection. They performed the classification of two potato leaves. Models trained with machine learning can autonomously learn, identify patterns, and make judgments [
14,
15].
Machines would boost precision and productivity in a perfect world while eradicating faults [
16]. With the help of AI, farmers can learn more about their crops and utilize that knowledge to boost yields. Many computer vision methods can be used to obtain the answers [
17,
18]. The widespread availability of cell phones has made mass-training deep learning models the most apparent option for diagnosing crops at scale. Foliar illnesses strike farmers annually all over the world.
Zhong and Zhao et al. [
19] did not take images in their natural environment but instead used a consistent background. All symptom pictures were scaled down to 128 × 128. The dataset had 2462 images after duplication; 85% were utilized for training, while 15% were used for validation. From all the related work, it can be concluded that various authors had worked on apple foliar disease classification with different disease classes on different techniques. In this research, classification was performed using two transfer learning models including InceptionResNetV2 and EfficientNetB3, by fine-tuning with different layers.
The main contributions of the research are the following:
Five transfer learning models, i.e., InceptionResNetV2, EfficientNetB3, ResNet50, AlexNet, and VGG16 were fine-tuned for the multi-class classification of apple foliar disease. For this, eleven classes of apple foliar diseases were considered, having 23,187 images.
The fine-tuning of pre-trained models was performed by adding a global average pooling layer, flatten layer, dropout layer, and dense layer to enable the model to focus on the unique features and improve its performance by adjusting the weights to better represent the data distribution.
The best transfer learning model was further optimized with the help of three optimizers, i.e., Adam, SGD, and Adagrad, with 32 batch sizes and 10 epochs.
The performance of the best model was compared with state-of-the-art techniques based on the precision, recall, accuracy, and F1-score in which fine-tuned EfficientNetB3 outperformed.
3. Input Dataset
The dataset used for this research work was taken from the Plant Pathology Dataset [
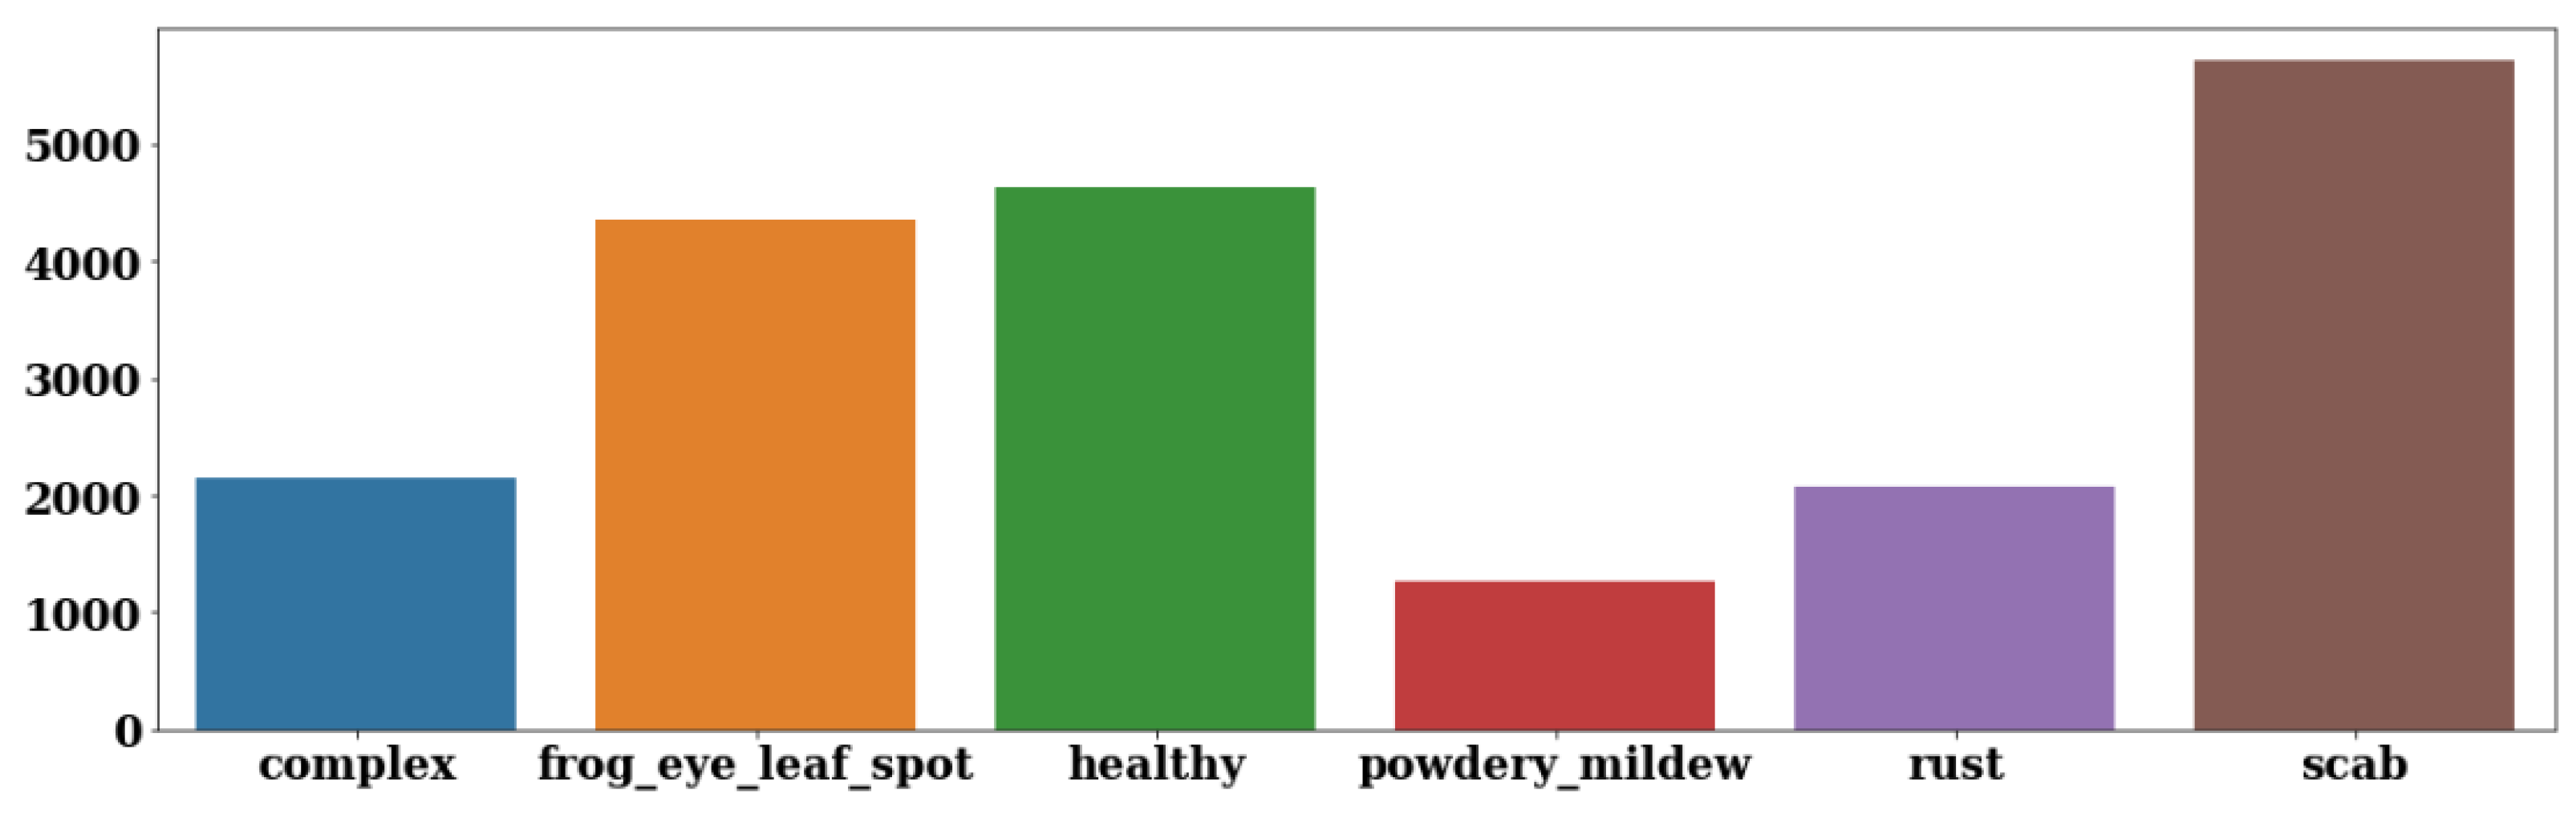
20]. In this dataset, high-resolution RGB images of apple foliar diseases, as well as sizable expert-annotated data, are used. It consists of apple foliar diseases with eleven different classes, namely complex, frog_eye_leaf_spot, frog_eye_leaf_spot complex, healthy, powdery_mildew, powdery_mildew complex, rust, rust complex, scab, scab frog_eye_leaf_spot, and scab frog_eye_leaf_spot complex. The description of all the diseases is as follows:
Apple Scab: It is a fungal disease that causes black, circular spots on the leaves of apple trees. The spots may also be velvety on the underside of the leaves. Apple scabs can severely reduce the yield of apple trees and can also make the fruit unmarketable. It is caused by the fungus Venturia inaequalis. The first symptoms of apple scabs usually appear in the spring as small, olive-green to black lesions on the leaves. These lesions gradually enlarge and become more visible as the season progresses. They may have a velvety appearance and are often bordered by yellowish or brown margins. Infected leaves may become distorted, curled, and drop prematurely, leading to defoliation.
Powdery Mildew: It is a fungal disease that causes a white, powdery growth on the leaves of apple trees. The growth can also be found on the fruit and stems of apple trees. The disease is caused by different species of the Erysiphales family, with Podosphaera leucotricha being a common culprit in apple powdery mildew infections. The first signs of apple powdery mildew usually appear in early to mid-summer. Infected leaves, young shoots, and fruit are covered with a white to light grey, powdery, talc-like substance, which gives the disease its name. This powdery growth is a mass of fungal spores and mycelium, and it may be most prominent on the upper surface of the leaves and the fruit.
Frog_eye_leaf_spot: It is a common fungal disease caused by the pathogen Cercospora spp. and is characterized by circular to oval spots on the leaves, which resemble the eyes of a frog. The spots often have a dark brown to purple border and a lighter greyish centre. As the disease progresses, the centres of the spots may become tan or white. Severe infections can cause premature defoliation, which can lead to reduced plant health and fruit production.
Rust: Apple foliar rust disease, commonly known as cedar-apple rust or apple cedar rust, is a fungal disease that affects apple trees (Malus domestica) and certain juniper or cedar species. The disease is caused by the fungus Gymnosporangium juniperi-virginianae. In the spring, small, yellow-orange spots appear on the upper surface of apple tree leaves. As the disease progresses, these spots enlarge and develop raised, powdery, orange spore-producing structures called “aecia.” These aecia give the disease its characteristic rust-like appearance.
The total number of images used in this research work is 23,187. Images of leaves at various phases of development and times of day, captured with varying depths of field, were included in this dataset to simulate real-world conditions.
Figure 1 shows the class-wise count of apple foliar disease images.
The images of different apple foliar diseases were taken from the apple orchard at Cornell AgriTech, Geneva, NY, USA. Images were taken using a Canon Rebel T5i DSLR. The T5i DSLR features an APS-C-sized CMOS sensor with 18 megapixels. Different times for capturing images, different lighting conditions, viewing angles, backgrounds, and noise levels were used to capture these images.
An expert plant pathologist validated the annotations, especially for images with overlapping symptoms such as the Alternaria leaf spot and frog_eye_leaf_spot and images with complex disease symptoms caused by multiple diseases.
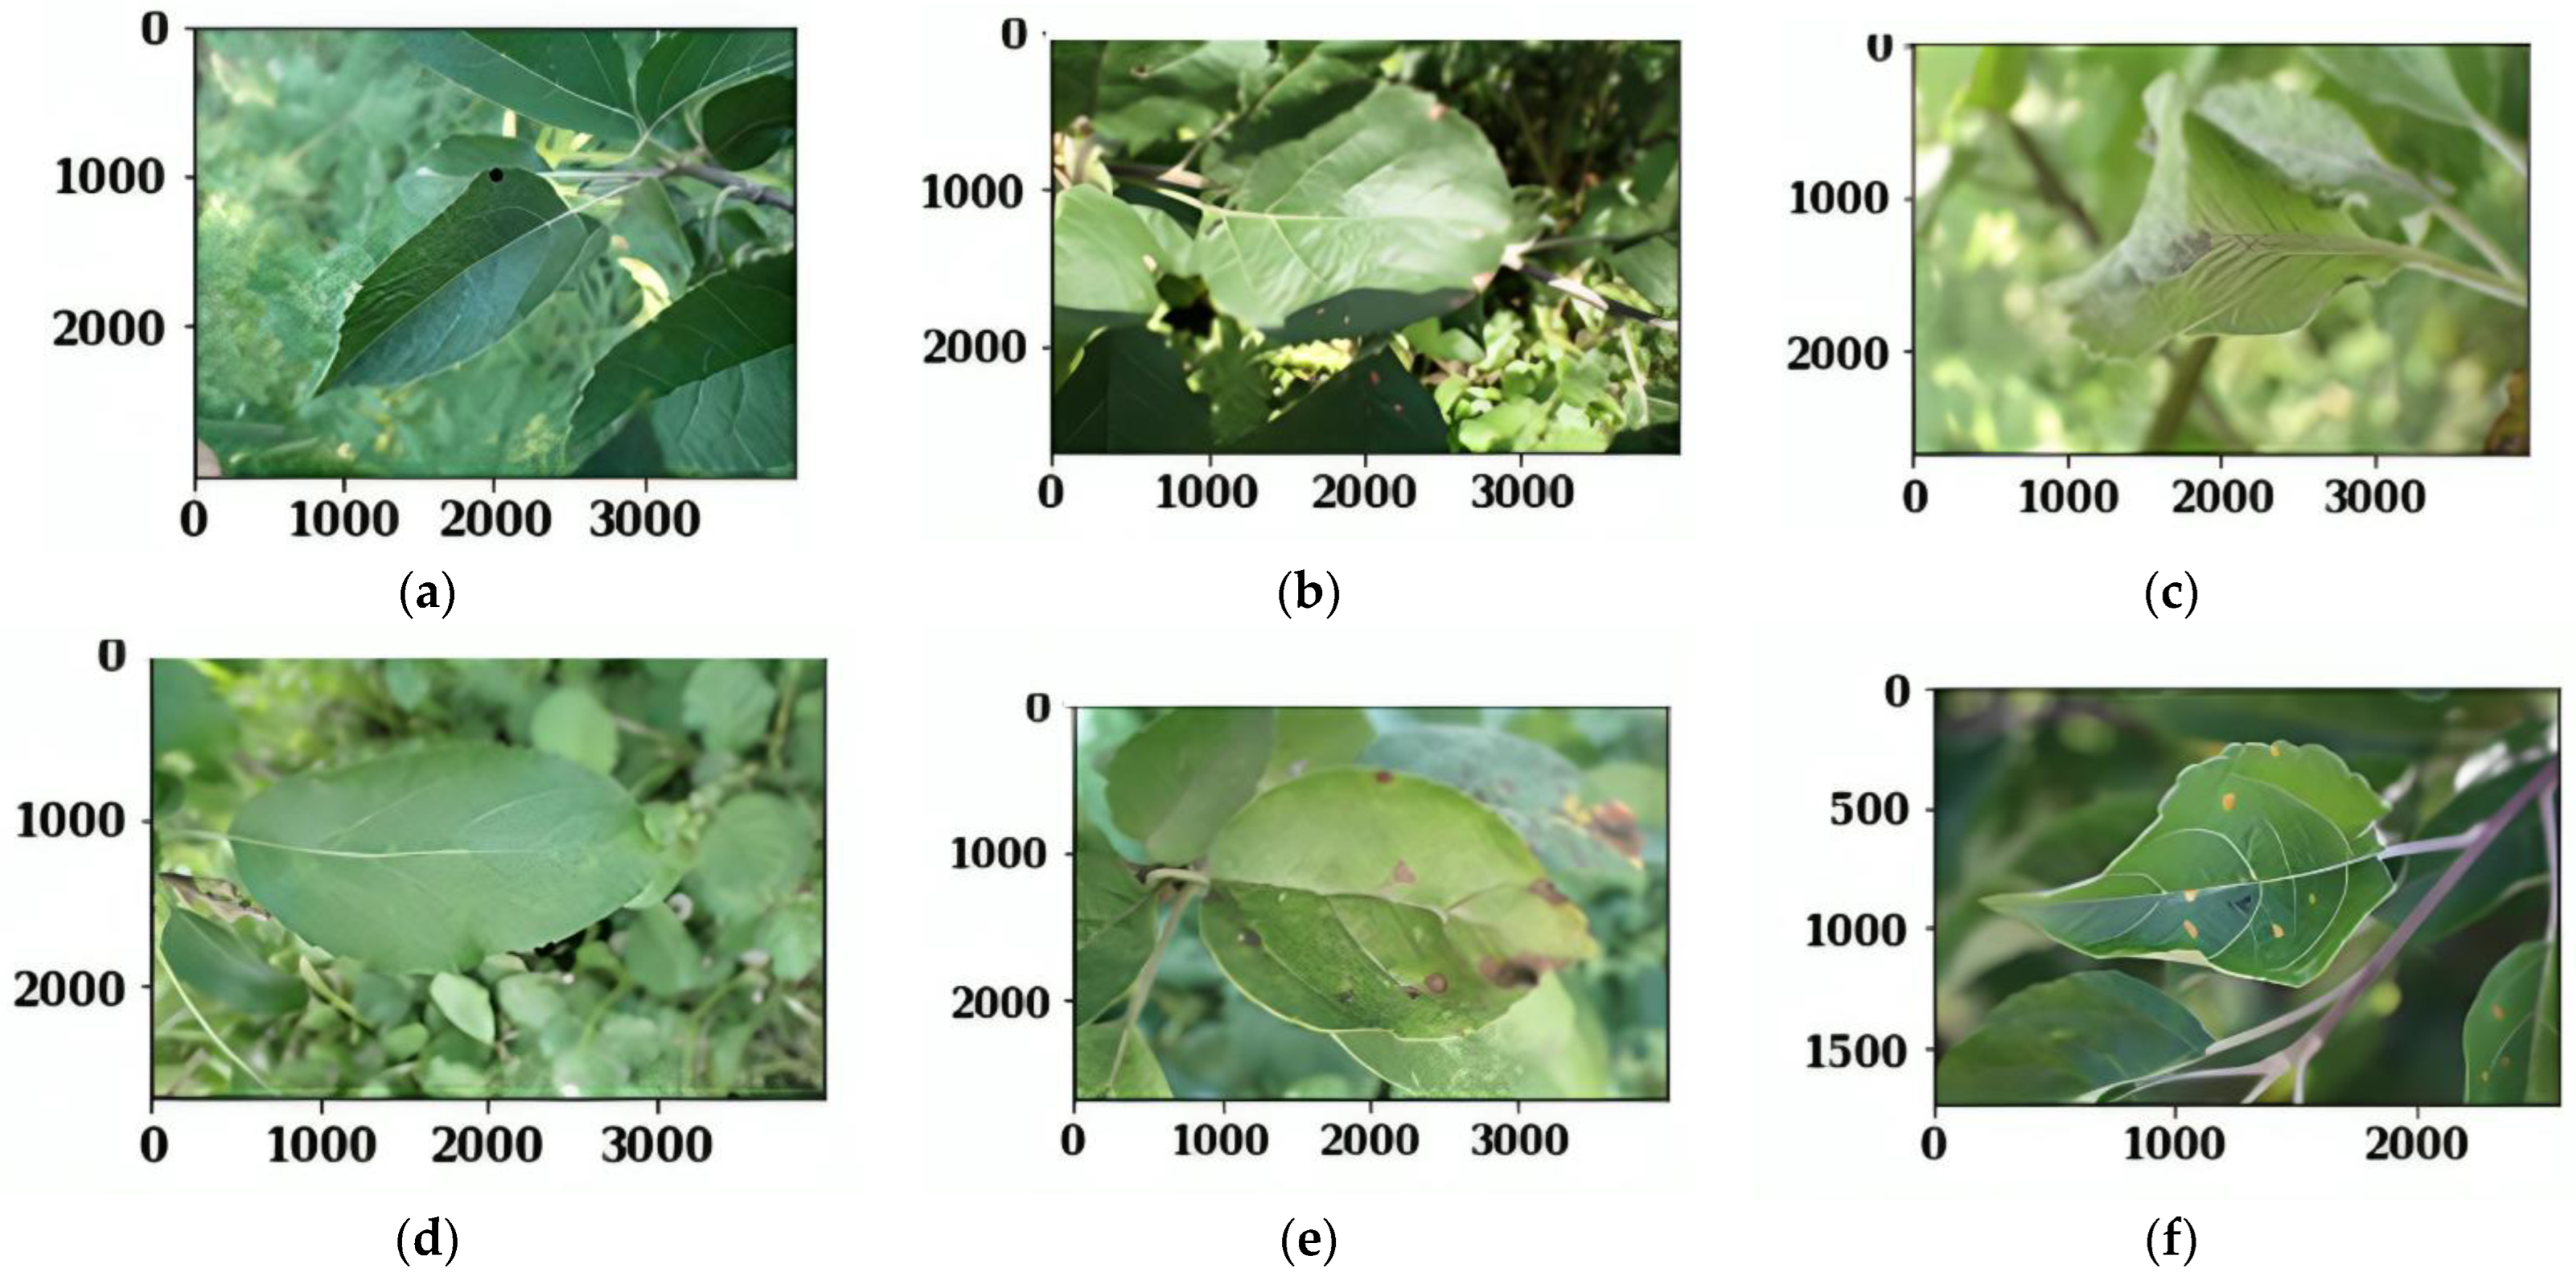
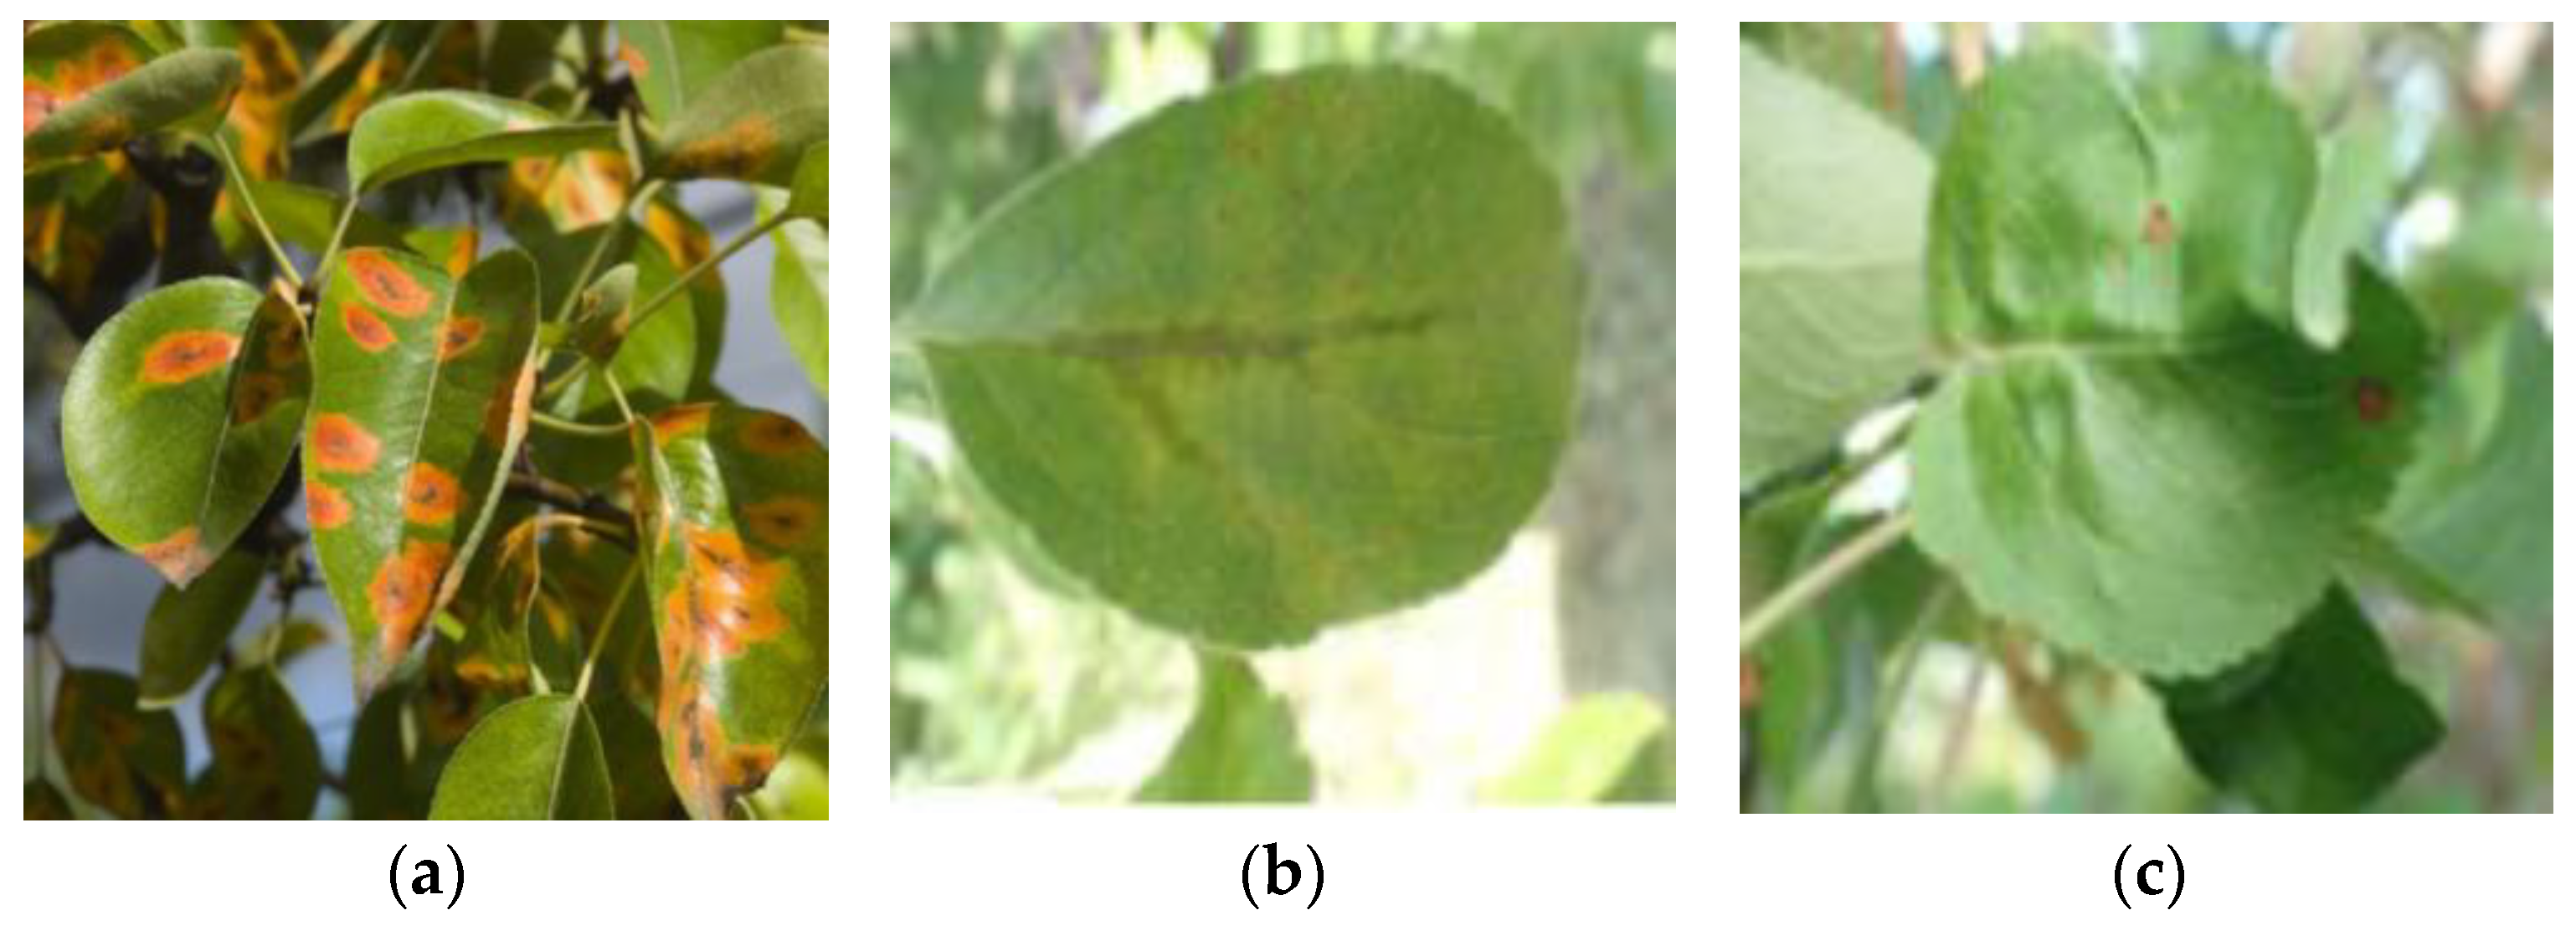
Figure 2 shows the sample images of different apple foliar diseases.
Figure 2a shows the healthy apple foliar disease class, and
Figure 2b shows the frog_eye_leaf_spot, followed by other different apple foliar disease classes.
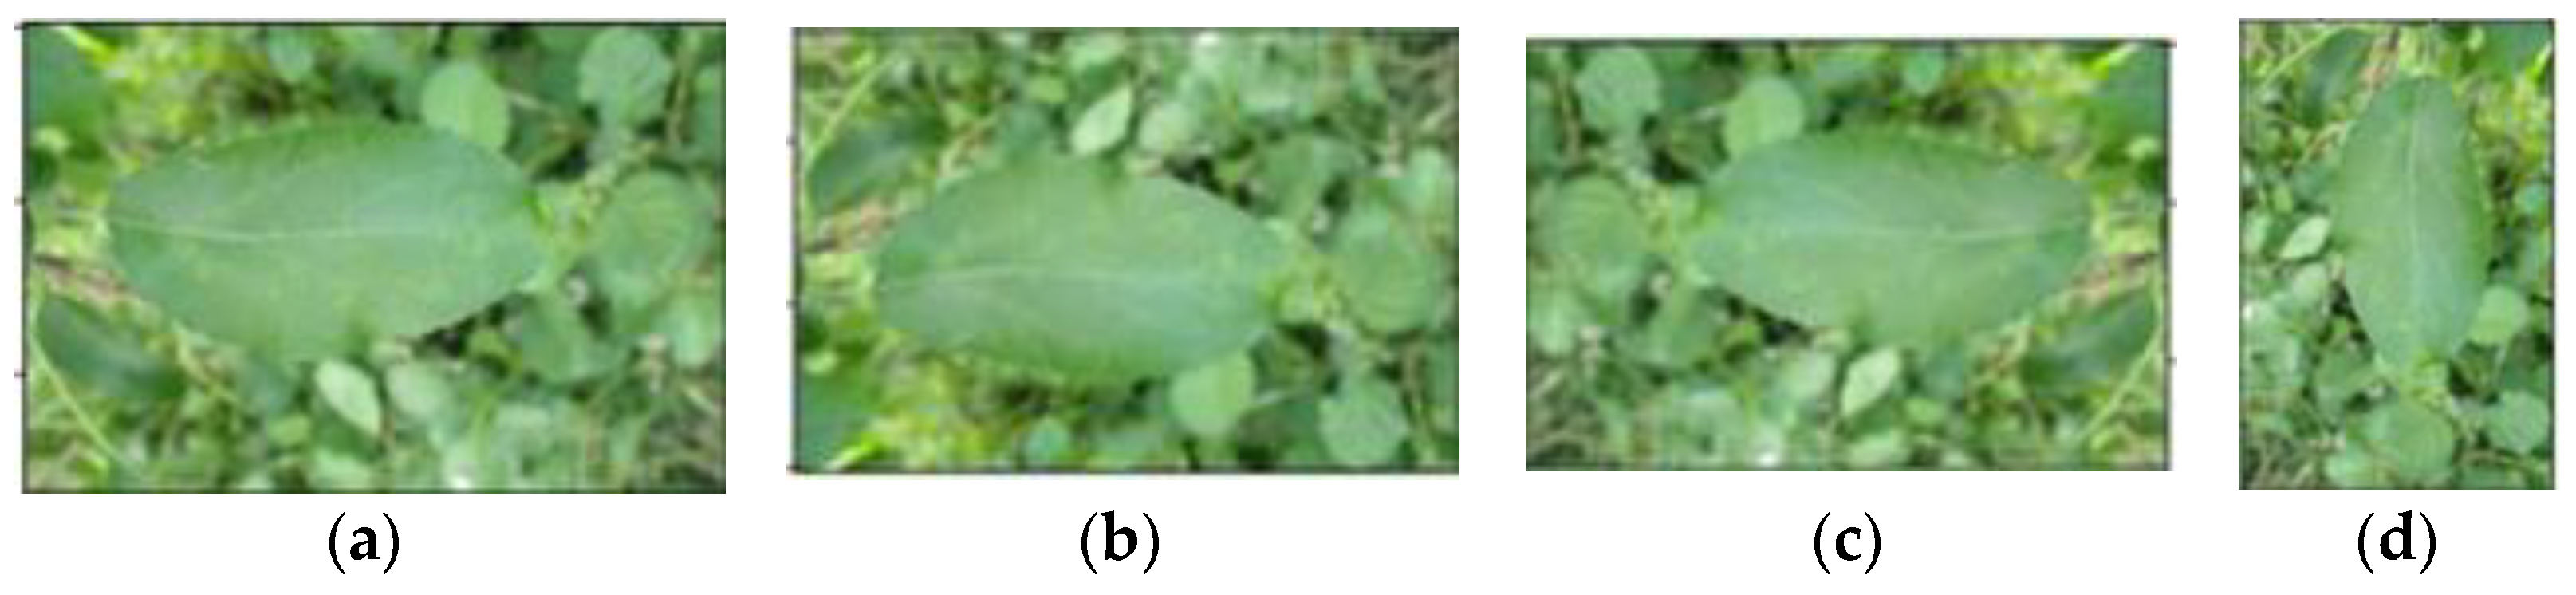
The images of apple leaf disease taken from the Plant Pathology Dataset are in jpg format. The images are of a random size (4000, 2672). Therefore, the images were downsampled to 224 ∗ 224 so that different transfer learning models could be applied on the uniform data size. The data augmentation techniques such as vertical flipping, horizontal flipping, and rotation were applied to obtain various images. The dataset was split into a training and testing ratio of 80:20, meaning that 80% of the data were used for training and 20% for testing.
Figure 3a shows the original images of apple foliar disease named “scab”;
Figure 3b,c shows the flipping operation with vertically and horizontally flipped images, respectively.
Figure 3d shows the 90-degree rotated image of apple foliar disease.
Apple foliar diseases have economic and agricultural importance due to their potential impact on apple production and overall orchard health. Foliar diseases like apple scabs, powdery mildew, and rust can cause significant damage to apple trees, leading to reduced fruit yield. Infected leaves may drop prematurely, reducing the tree’s ability to photosynthesize and produce energy for fruit development. Blemishes, discolourations, and surface deformations caused by foliar diseases can render the fruit less appealing to consumers and lead to economic losses. To manage foliar diseases effectively, apple growers must invest in fungicides and other control measures. Frequent applications of fungicides to prevent or manage diseases can add to the production costs. Excessive use of fungicides to control foliar diseases can have environmental implications, including the risk of chemical residues in soil, water, and surrounding ecosystems. Managing foliar diseases in apple orchards is essential for sustainable apple production, maintaining orchard health, and ensuring economic viability for apple growers.
4. Proposed Methodology
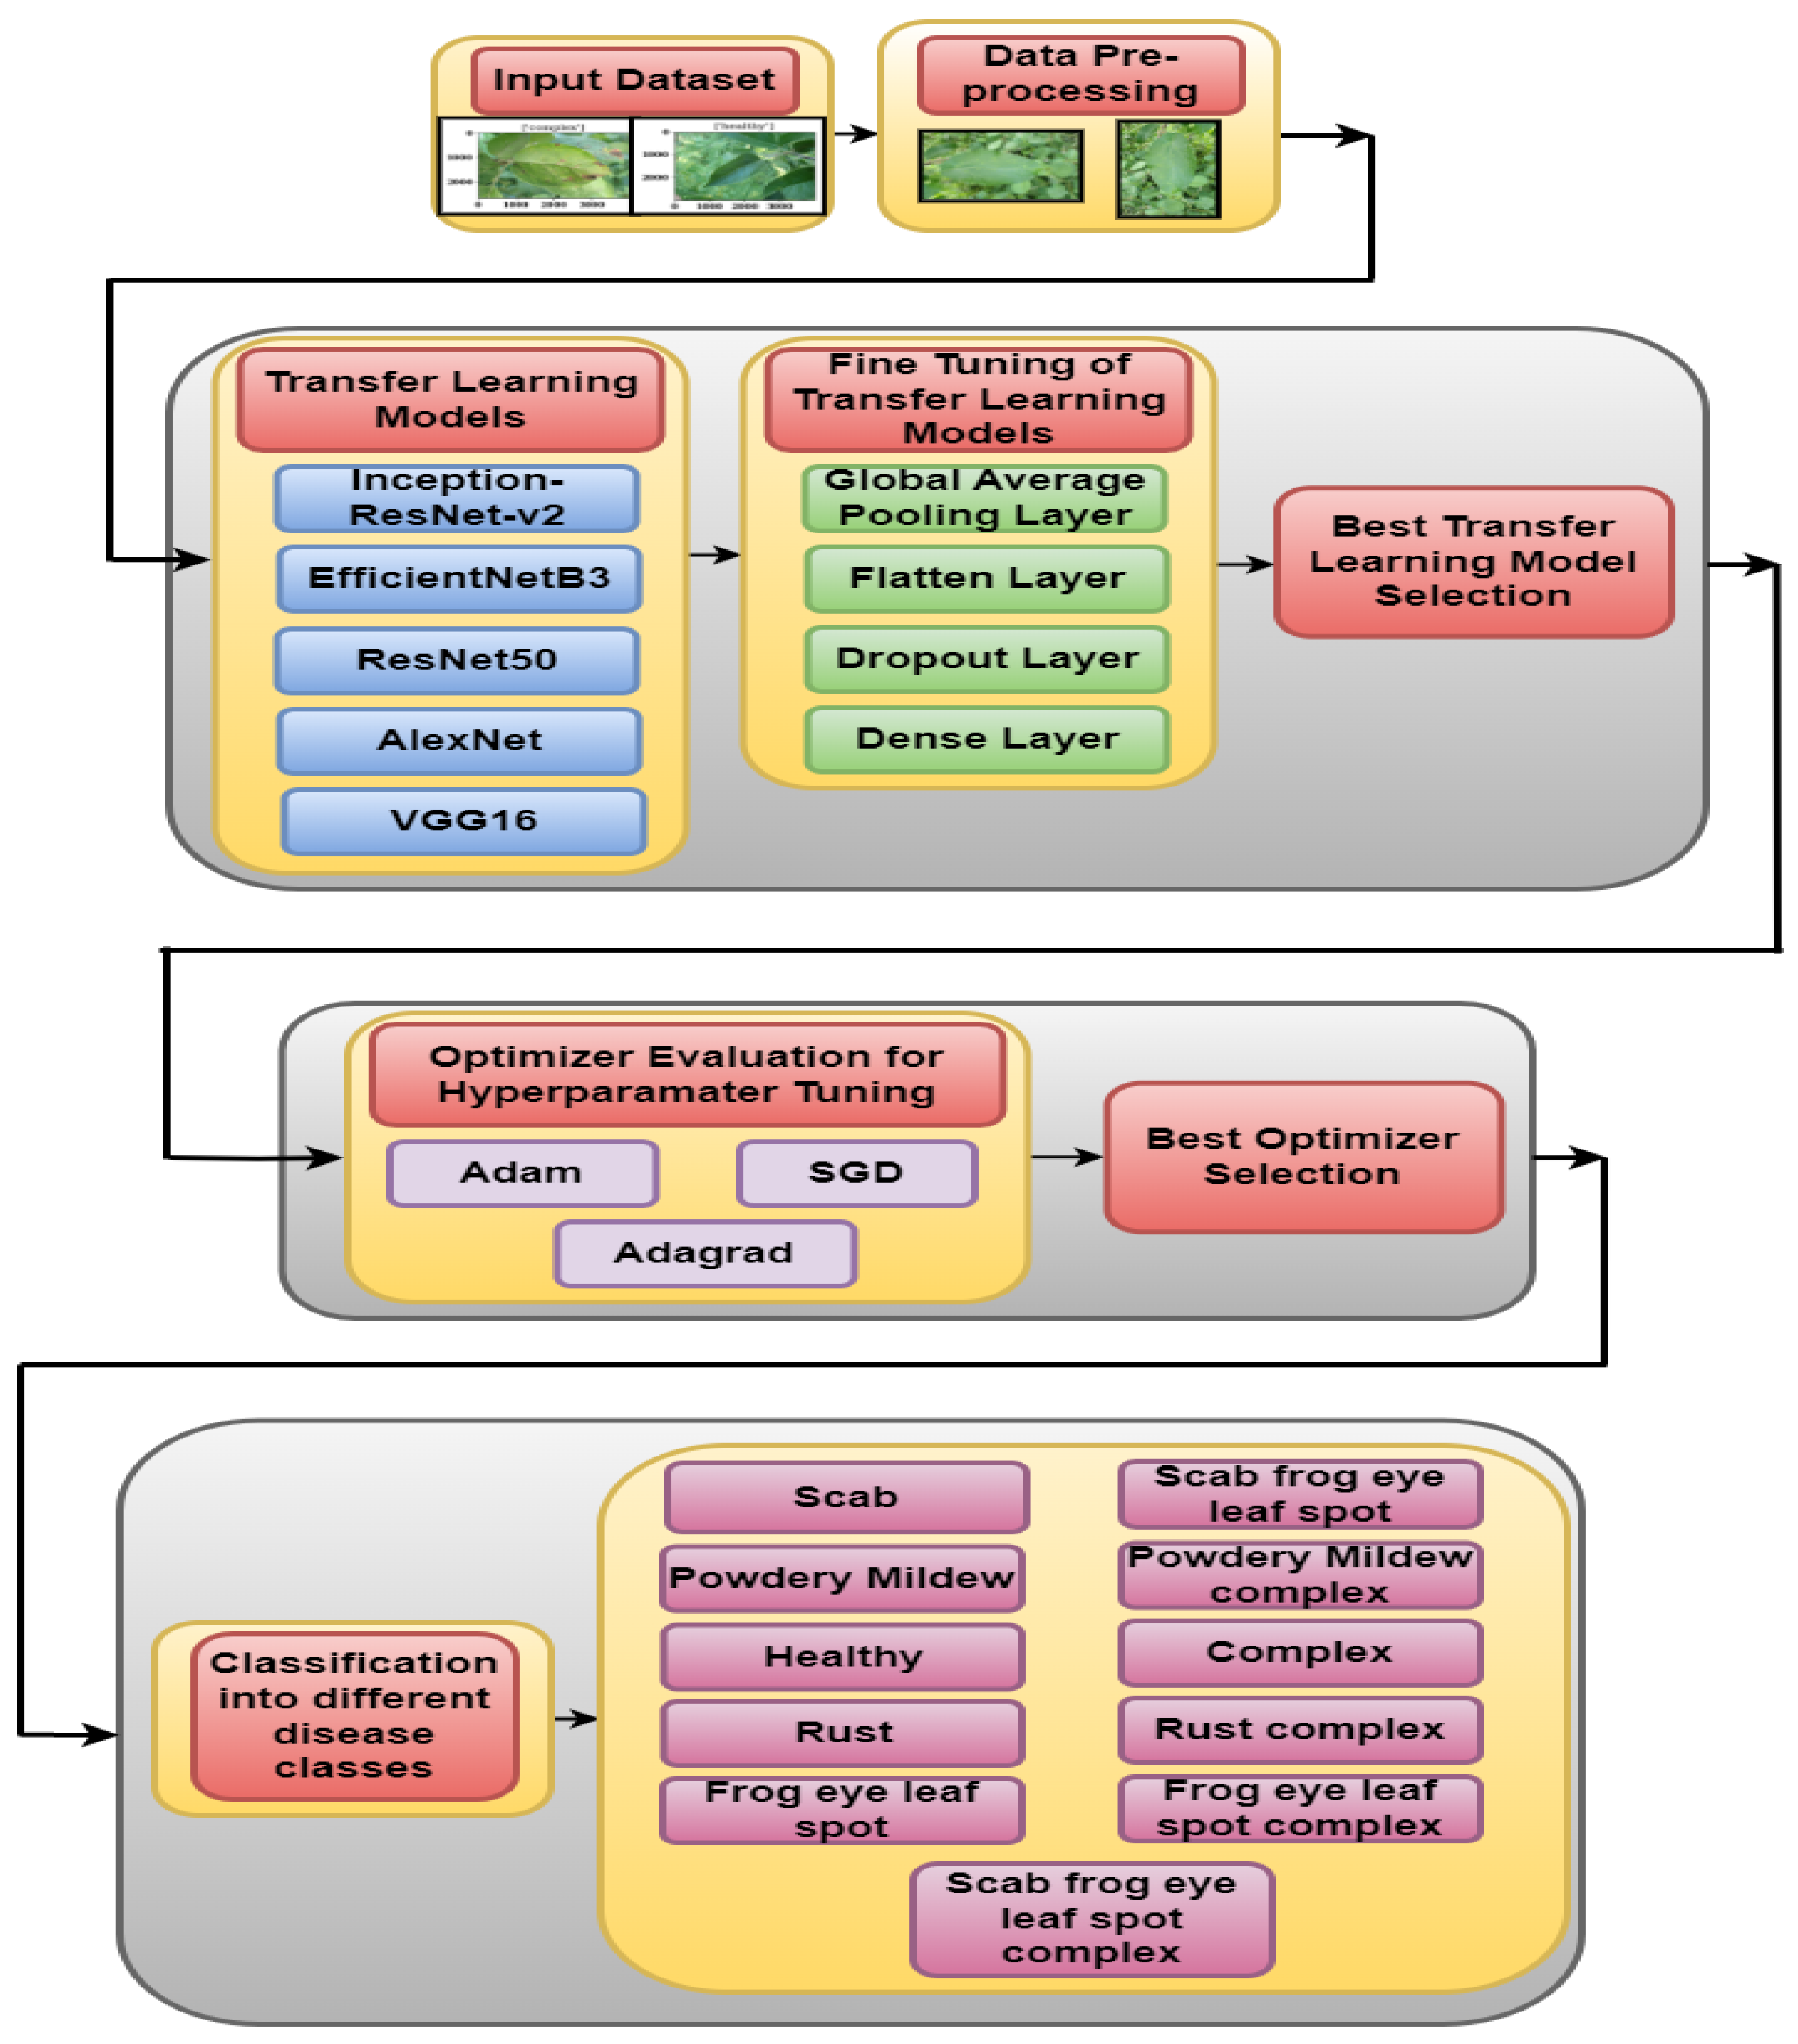
Figure 4 illustrates the proposed methodology for the classification of apple foliar disease. The samples of apple foliar disease taken from the Plant Pathology Dataset were augmented with different augmentation techniques.
4.1. Pre-Trained Models
The augmented images were then given as input to the five transfer learning models. The classification was performed using five fine-tuned transfer learning models, i.e., InceptionResNetV2, EfficientNetB3, Resnet50, AlexNet, and VGG16. Pre-trained models have learned a wide range of features from large datasets, and fine-tuning them on a new task can help improve generalization performance. Transfer learning requires less training time and data with fewer computational resources resulting in faster deployment, as the model has already learned many features and only needs to learn the new task. Overall, a pre-trained model can save time and resources and improve the model’s performance. Further, fine-tuning of the transfer learning model is a crucial step, enabling it to adapt, specialize, and excel in new tasks while leveraging the knowledge gained from pre-training. It strikes a balance between generalization and specialization, making transfer learning models highly effective for a wide range of applications. Hence, here, fine-tuning was performed on the transfer learning models to make them more effective and accurate.
4.2. Fine Tuning of Pre-Trained Models
The apple foliar image dataset was fed to different transfer learning models, namely InceptionResNetV2, EfficientNetB3, Resnet50, AlexNet, and VGG16. Feature space obtained from these models was fed to a fine-tuned block. The fine-tuned block was made up of different layers: a pooling, flattening, dropout, and dense layer.
Pooling layers reduce the number of sampled points in the input feature maps. The network’s computational complexity is reduced through the pooling process while its essential properties are preserved. To better recognize patterns in the input, regardless of their order, pooling aids in making the network translation invariant.
Feature maps obtained with many dimensions are flattened down to a single dimension with the flattening procedure. By flattening the output of the previous convolutional layer, the network can handle the spatial information as a single long input vector for the subsequent layers.
After flattening the layer, the dropout layer is used to avoid overfitting. The dropout layer drops out neurons by setting their outputs to zero at random during each update. As a result, the network is forced to acquire more stable and generalizable properties due to the dropout, which minimizes the interdependencies between the neurons. By spreading the weights among more neurons, the network becomes more robust against noise and can better generalize to new input.
After the dropout layer, a dense, fully connected layer is used to classify apple foliar disease from leave images. To facilitate complex interactions and the acquisition of high-level representations, each neuron in a thick layer is linked to each in the layer beneath it. At the very end of the network, dense layers take the pooled or flattened outputs and change them into the desired output shape.
The classification performed using all five fine-tuned transfer learning models was analysed on the basis of confusion matrix parameters.
4.3. Best Pre-Trained Model Selection
After the fine-tuning of models, the best transfer learning model selection was evaluated based on confusion matrix parameters: the accuracy, precision, recall, and F1-score. The results of all transfer learning models are given as the results of
Section 5.1. From the results, it is analysed that EfficientNetB3 has the highest accuracy, precision, recall, and F1-score compared to the other four models. ResNet50 fares similarly well, excelling in the precision and F1-score in particular. Compared to the other models, Inception-ResNet-v2 fares poorly in the accuracy, precision, recall, and F1-score. Both AlexNet and VGG16 perform around average by most measures. Finally, the fine-tuned EfficientNetB3 model was taken for classifying eleven classes of apple foliar disease. The results for each apple foliar disease class are shown as the results of
Section 5.2.
4.4. Optimizer Evaluation for EfficientNetB3
Now, the optimizer evaluation for the best transfer learning model, i.e., the EfficientNetB3 model, was performed using different optimizers. For this, the EfficientNetB3 model was implemented using three optimizers, namely Adam, SGD, and Adagrad, for 32 batch sizes and 10 epochs. The results for all optimizers are shown as the results of
Section 5.3. From the results, it is analysed that Adam consistently achieves better results in comparison to SGD and Adagrad optimizers. Adam achieves the highest accuracy, precision, and recall rates in correctly classifying occurrences and detecting affirmative examples. Adagrad consistently performs worse than the other algorithms, whereas SGD follows Adam but is behind in recall.
5. Results and Discussion
5.1. Transfer Learning Model Analysis
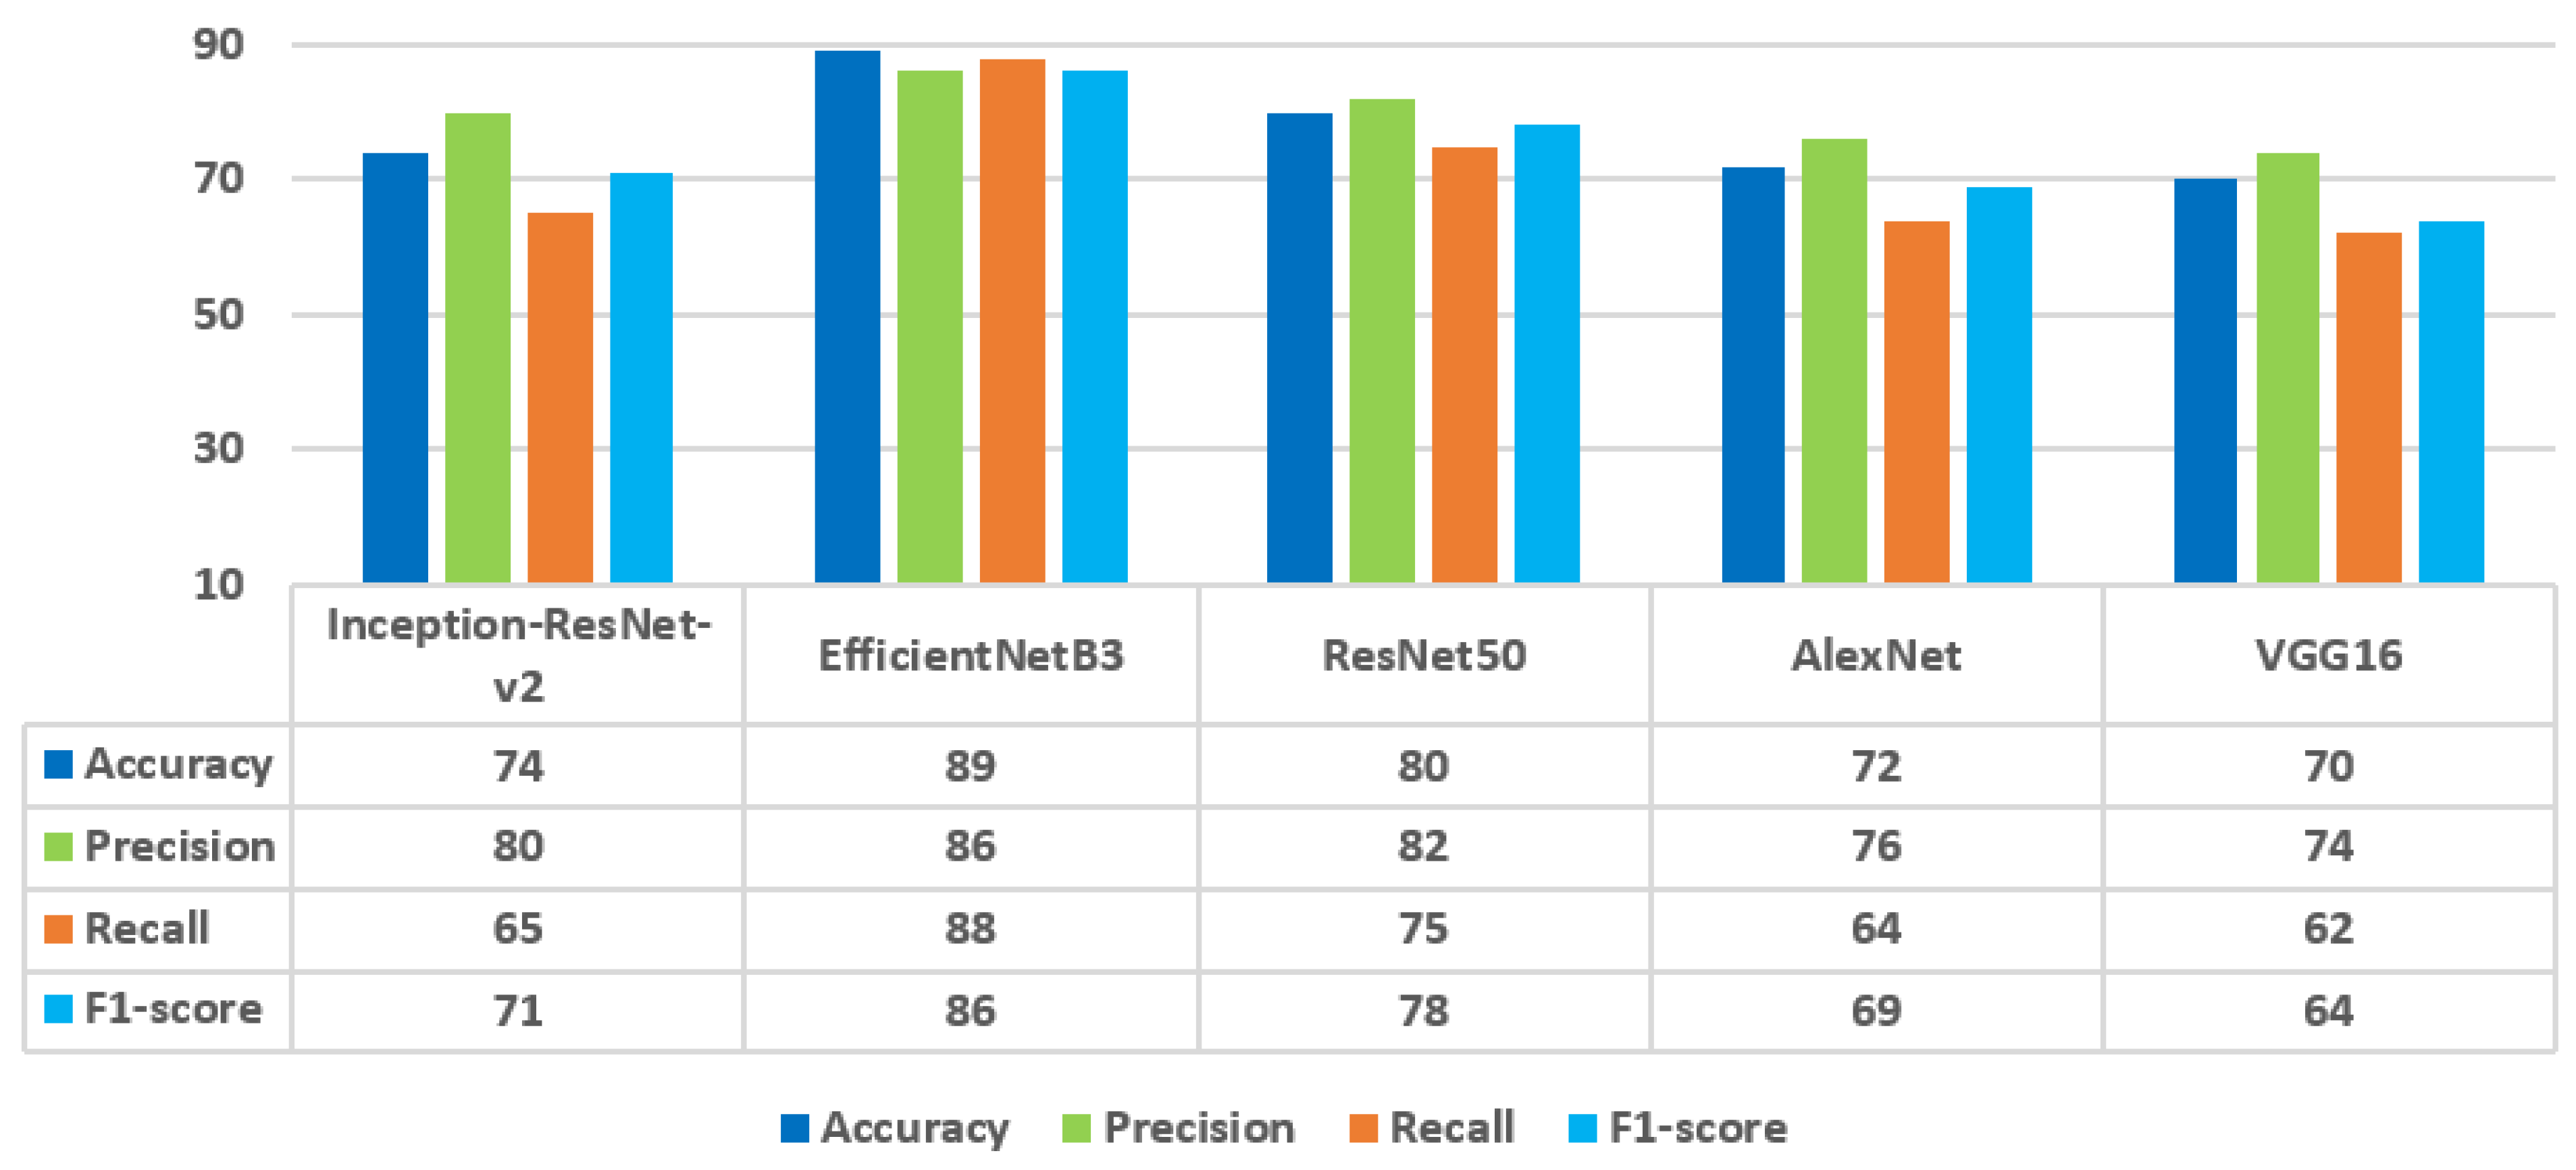
Here, the confusion matrix parameter analysis for the five transfer learning models is performed. The results of different transfer learning models, including InceptionResNetV2, EfficientNetB3, ResNet50, AlexNet, and VGG16, are represented by their performance metrics in
Figure 5.
The accuracy of the models is between 70% and 89%. The best accuracy is achieved with EfficientNetB3, at 89%, followed by ResNet50, at 80%. The lowest accuracy is achieved with InceptionResNetV2, at 74%.
The models demonstrate robust positive instance detection with 86% and 82% precision values for EfficientNetB3 and ResNet50, respectively. Precision values for AlexNet and VGG16 are 76% and 74%, respectively, whereas the lowest value is 80% for Inception-ResNet-v2.
EfficientNetB3 has the maximum recall value of 88% to capture positive cases well. There is a 15% difference in recall between ResNet50 and Inception-ResNet-v2. Recall percentages for AlexNet and VGG16 are 64% and 62%, respectively, which are very low compared to other models.
With an F1-score of 86%, EfficientNetB3 outperforms ResNet50, which only manages a 78% value. F1-scores for AlexNet are 69%, while for VGG16, they are 64%. The Inception-ResNet-v2 model has the worst F1-score of all the models.
In conclusion, EfficientNetB3 has the highest accuracy, precision, recall, and F1-score of all the methods. ResNet50 fares similarly well, excelling in the precision and F1-score in particular. Compared to the other models, Inception-ResNet-v2 fares poorly in the accuracy, precision, recall, and F1-score. Both AlexNet and VGG16 perform around average by most measures.
5.2. Best Transfer Learning Model—EfficientNetB3 Analysis
In the last section,
Section 5.1, five transfer learning models, i.e., InceptionResNetV2, EfficientNetB3, ResNet50, AlexNet, and VGG16, are compared in terms of the accuracy, precision, recall, and F1-score. From the analysis, it is concluded that the EfficientNetB3 model has outperformed in comparison to the other four transfer learning models in terms of all performance parameters. Hence, the EfficientNetB3 model is considered for further optimizer evaluation for hyperparameter tuning. Therefore, training and validation accuracy, loss, and confusion matrix results are shown only for the best fine-tuned EfficientNetB3 model.
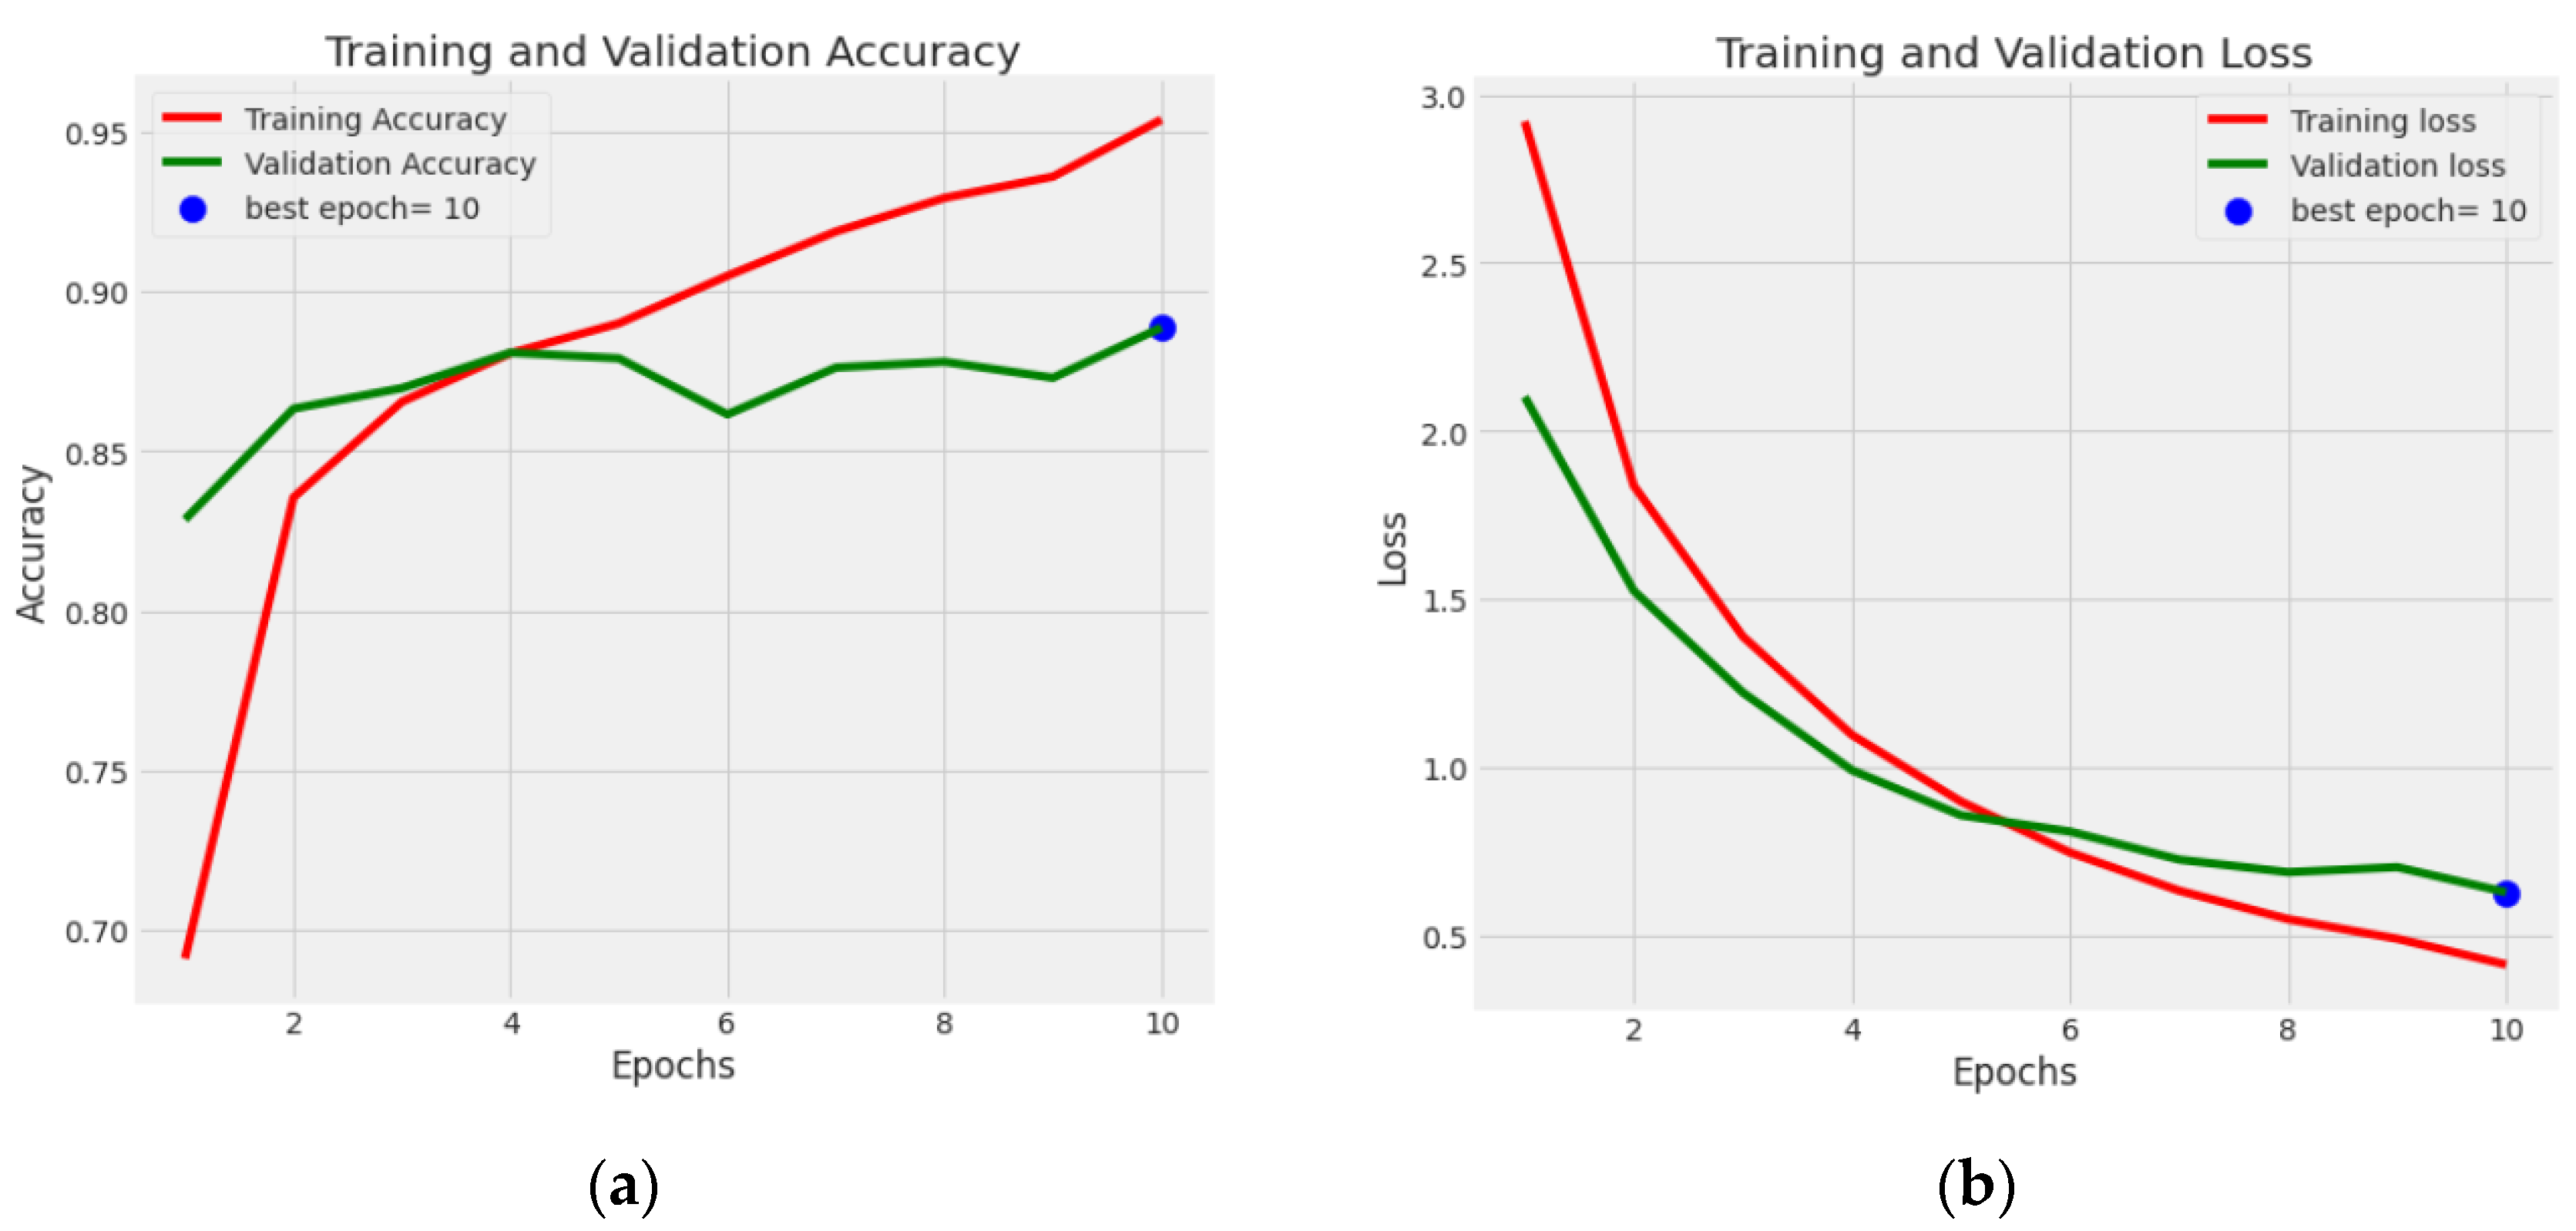
Figure 6 illustrates the training and validation curves for the EfficientNetB3 model.
Figure 6a shows the accuracy curve on 10 epochs. It can be seen from the figure that the value of training accuracy on the 2nd epoch is 0.83 and is increasing drastically, and at the 10th epoch, the value of accuracy is 0.95.
Figure 6b illustrates the values of training and validation loss on 10 epochs. The value of training loss on the 10th epoch is 0.4. Therefore, with the increase in the value of the epoch, the value of accuracy is increasing and the value of loss is decreasing.
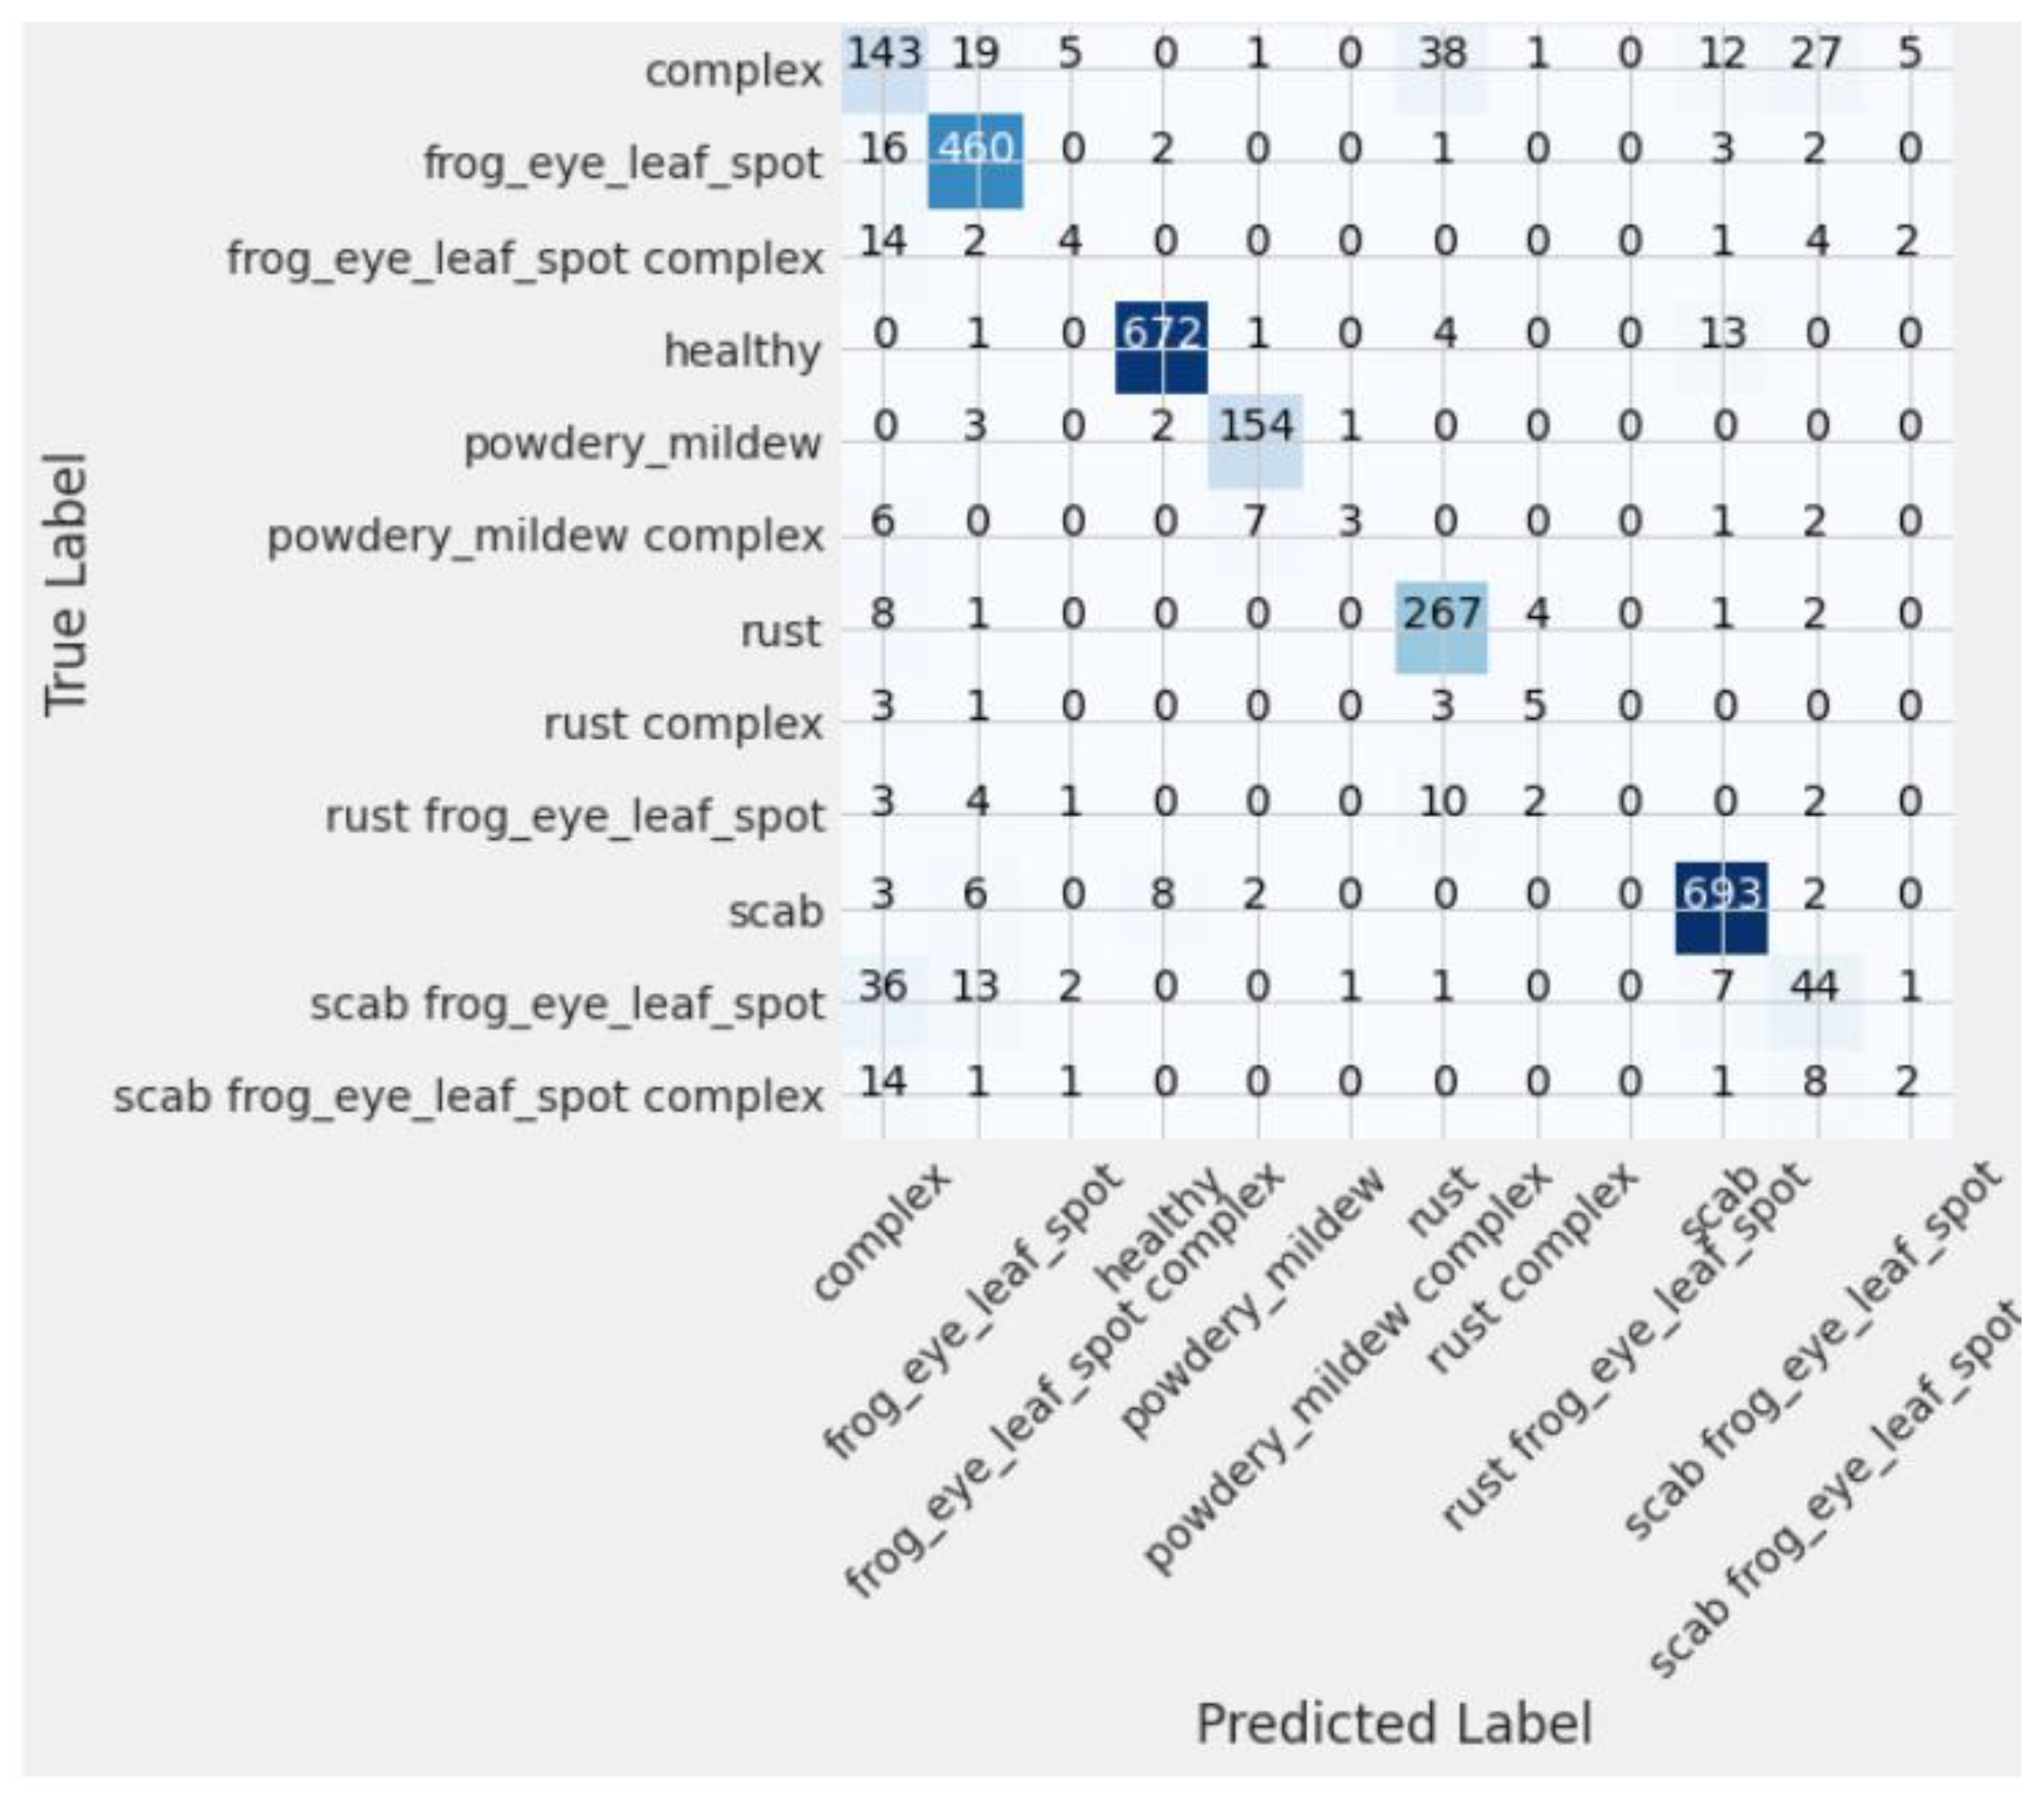
Figure 7 shows the confusion matrix on eleven apple foliar disease classes. It can be seen from the confusion matrix that the model has performed best on the frog_eye_leaf_spot disease class, rust disease class, and scab disease class.
Table 1 shows the evaluation metrics for a classification model trained on a dataset of images of plants with different types of apple foliar diseases. The model predicted the presence of 11 different classes. The table provides the precision, recall, and F1-score metrics for each class.
Based on these metrics, the proposed model appears to perform well in some classes, such as “healthy” and “scab,” where it achieves high precision, recall, and F1-scores. However, the model performs poorly in other classes, such as the “frog_eye_leaf_spot complex” and “scab frog_eye_leaf_spot complex,” where it has low precision, recall, and F1-scores.
It is also worth noting that some classes have higher precision than recall, while others have higher recall than precision. For example, the “frog_eye_leaf_spot” class has high precision and recall, while the “powdery_mildew complex” class has higher recall than precision. This indicates that the model may better identify specific diseases than others and that the balance between precision and recall can vary depending on the class.
5.3. Optimizer Analysis for Hyperparameter Tuning
Now, the optimizer evaluation for the best transfer learning model, i.e., the Efficient-NetB3 model, is performed using different optimizers. For this, the EfficientNetB3 model is implemented using three optimizers, namely Adam, SGD, and Adagrad, for 32 batch sizes and 10 epochs. The accuracy, precision, recall, and F1-score are evaluated for each optimizer with the proposed model.
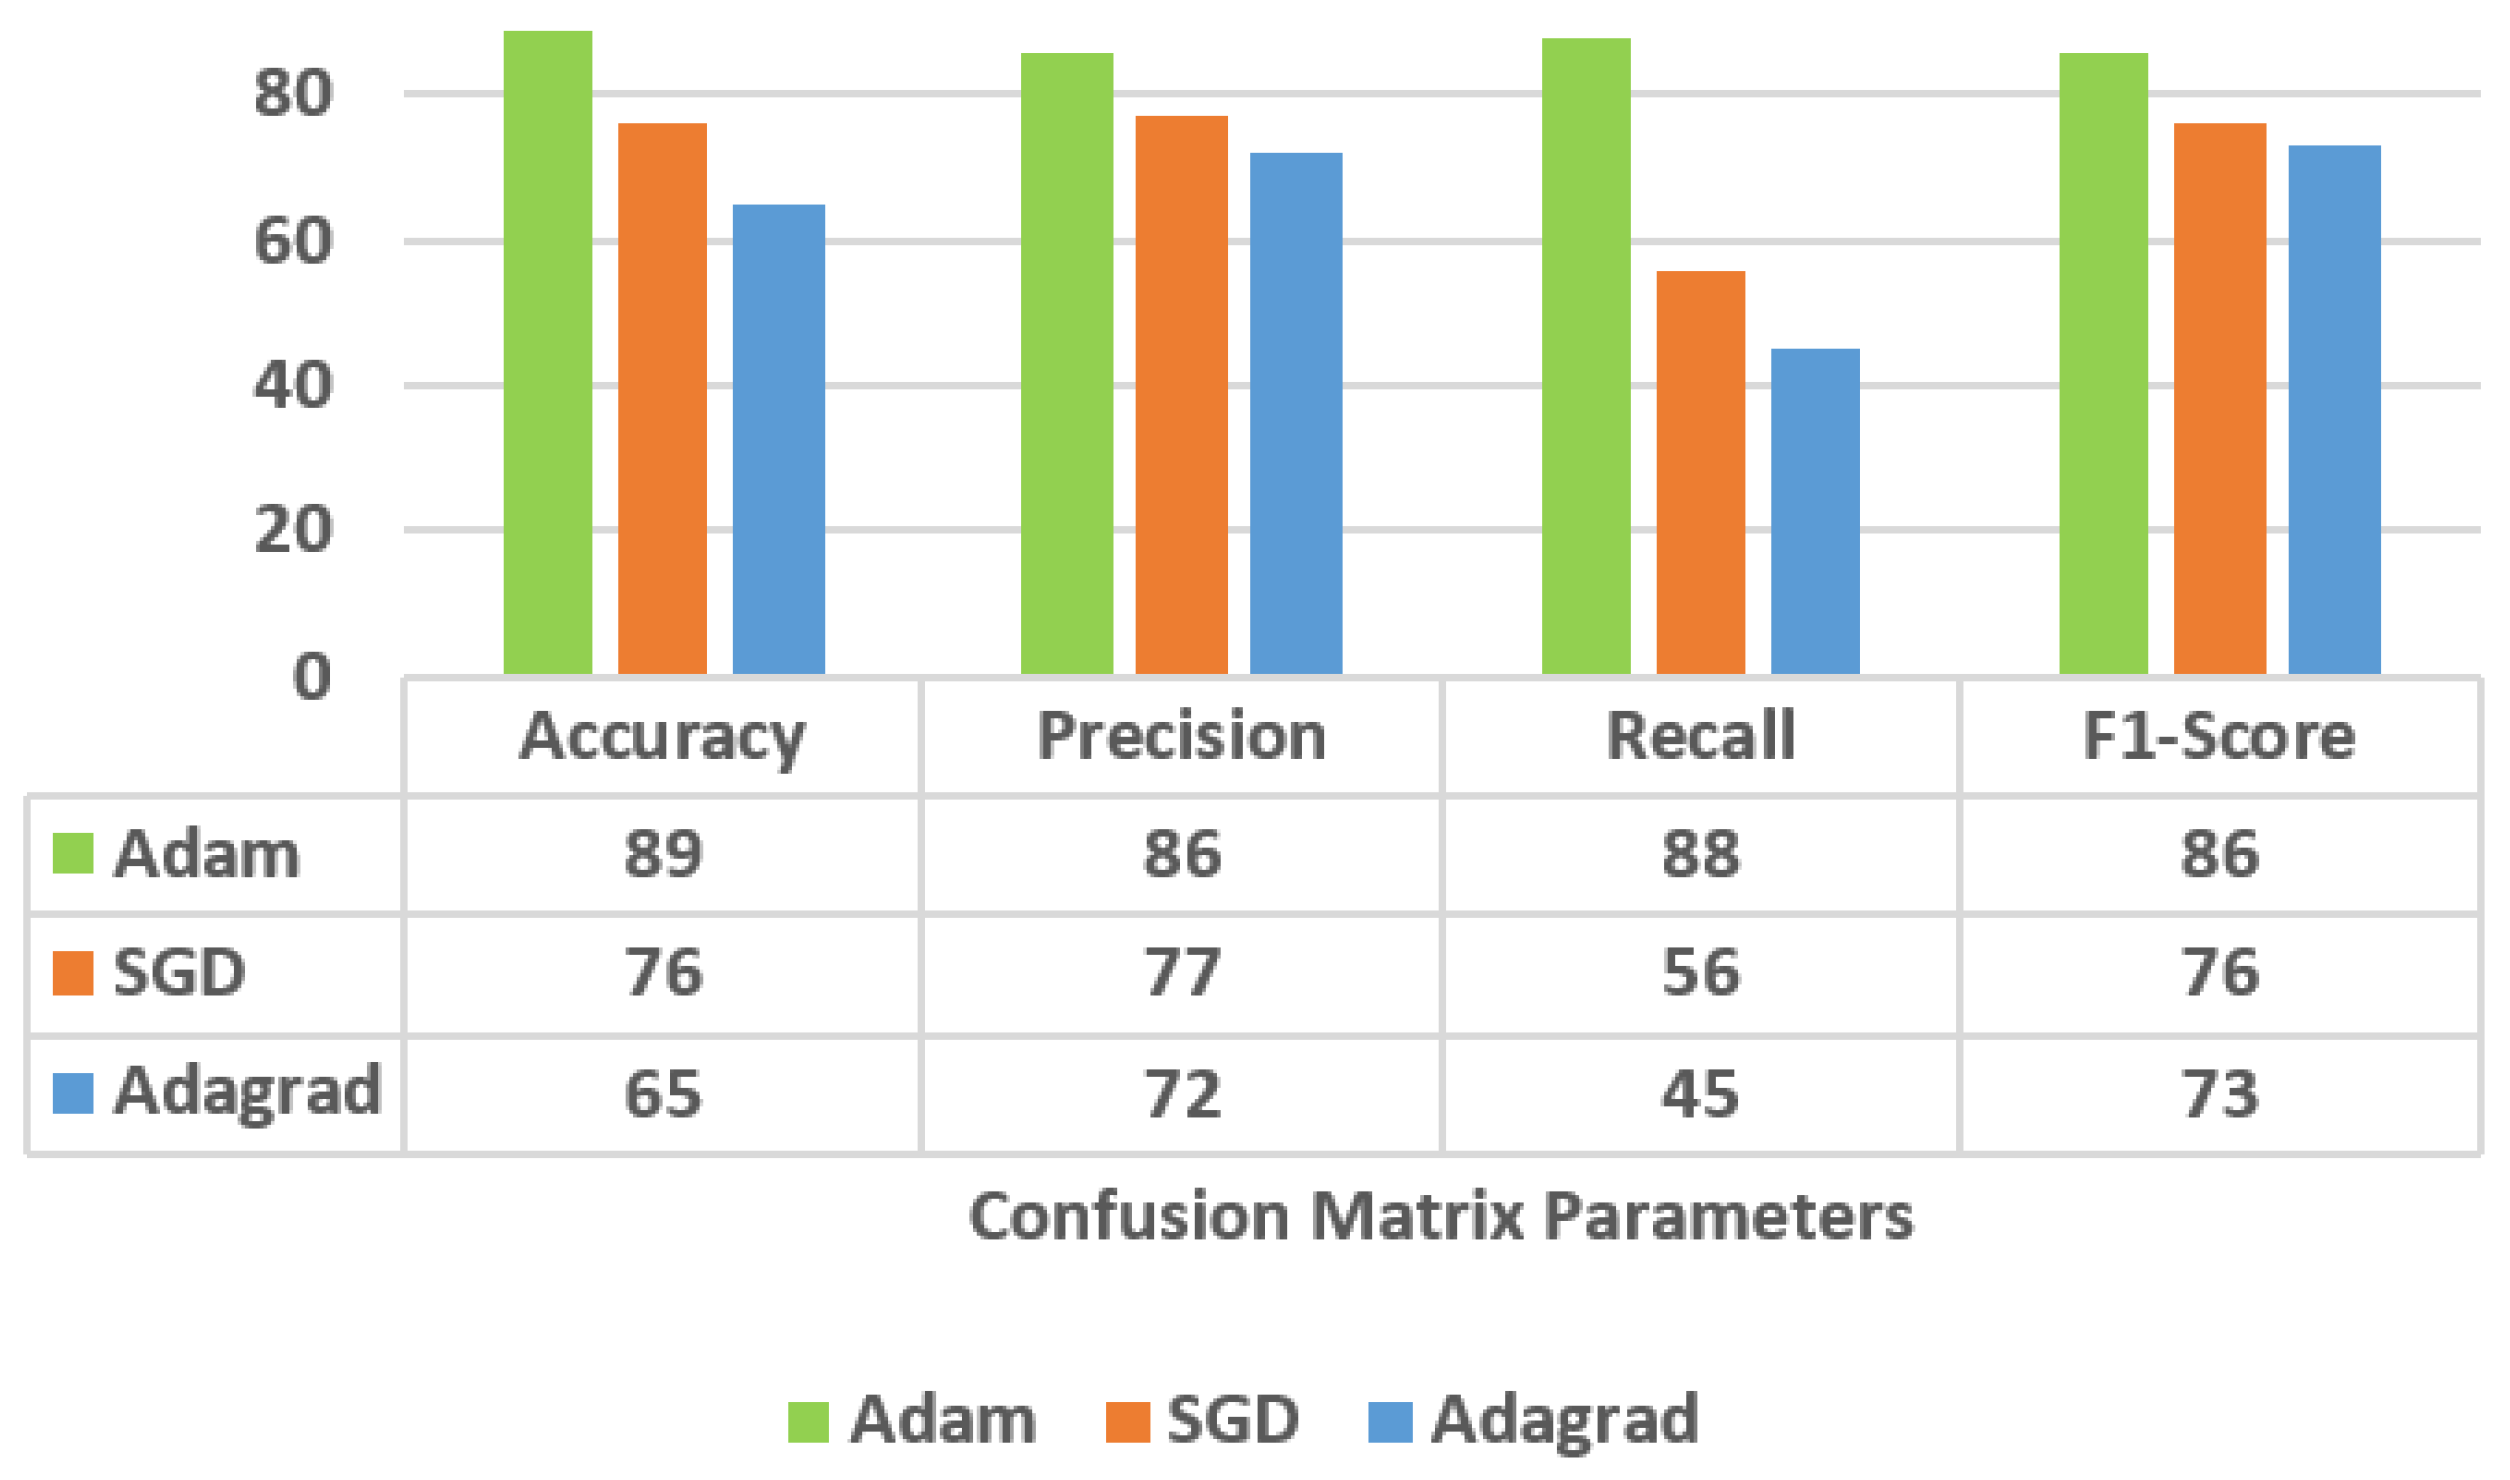
The presented
Figure 8 sheds light on how certain optimization strategies fared when applied to an apple foliar image dataset. These metrics are frequently employed for model and method evaluation in machine learning and a statistical analysis. From
Figure 8, it is analysed that Adam’s 89% accuracy is the greatest of any model in the dataset, suggesting that it correctly identified 89% of all cases. The accuracy of SGD is 76%, while Adagrad’s is just 65%. Adam looks to perform better than the other two algorithms when compared in this way. SGD has the highest accuracy, with a value of 77%, out of the three algorithms. Adam comes in second with 86% accuracy, just ahead of Adagrad’s 72% value. The algorithms’ ability to reliably recognize positive examples improves as precision increases. So, compared to the other two algorithms, Adam has a higher accuracy rate.
Adam’s 88% recall rate is the greatest, indicating it detected many good situations correctly. Next in line is SGD, with a recall rate of 56%, indicating a somewhat diminished capacity to recognize true positives. Adagrad’s 45% recall rate was the lowest, indicating it had the most trouble spotting true positives. Adam is far superior to the other algorithms in terms of recall. Adam’s F1-score of 86% shows that its precision and recall levels are satisfactory. The F1-scores that SGD and Adagrad achieved are 76% and 73%, respectively. Adam continues to be the most efficient algorithm because it strikes a good compromise between precision and recall, as measured using F1-scores.
When compared to the other two algorithms, Adam consistently achieves better results. In terms of correctly classifying occurrences and detecting affirmative examples, it achieves the highest accuracy, precision, and recall rates. Adagrad consistently performs worse than the other algorithms, whereas SGD follows Adam but is behind in recall. Overall, the proposed EfficientNetB3 model with an Adam optimizer at 10 epochs and 32 batch sizes achieved the highest accuracy of 89% on a dataset with 11 classes.
5.4. Visualization of Results
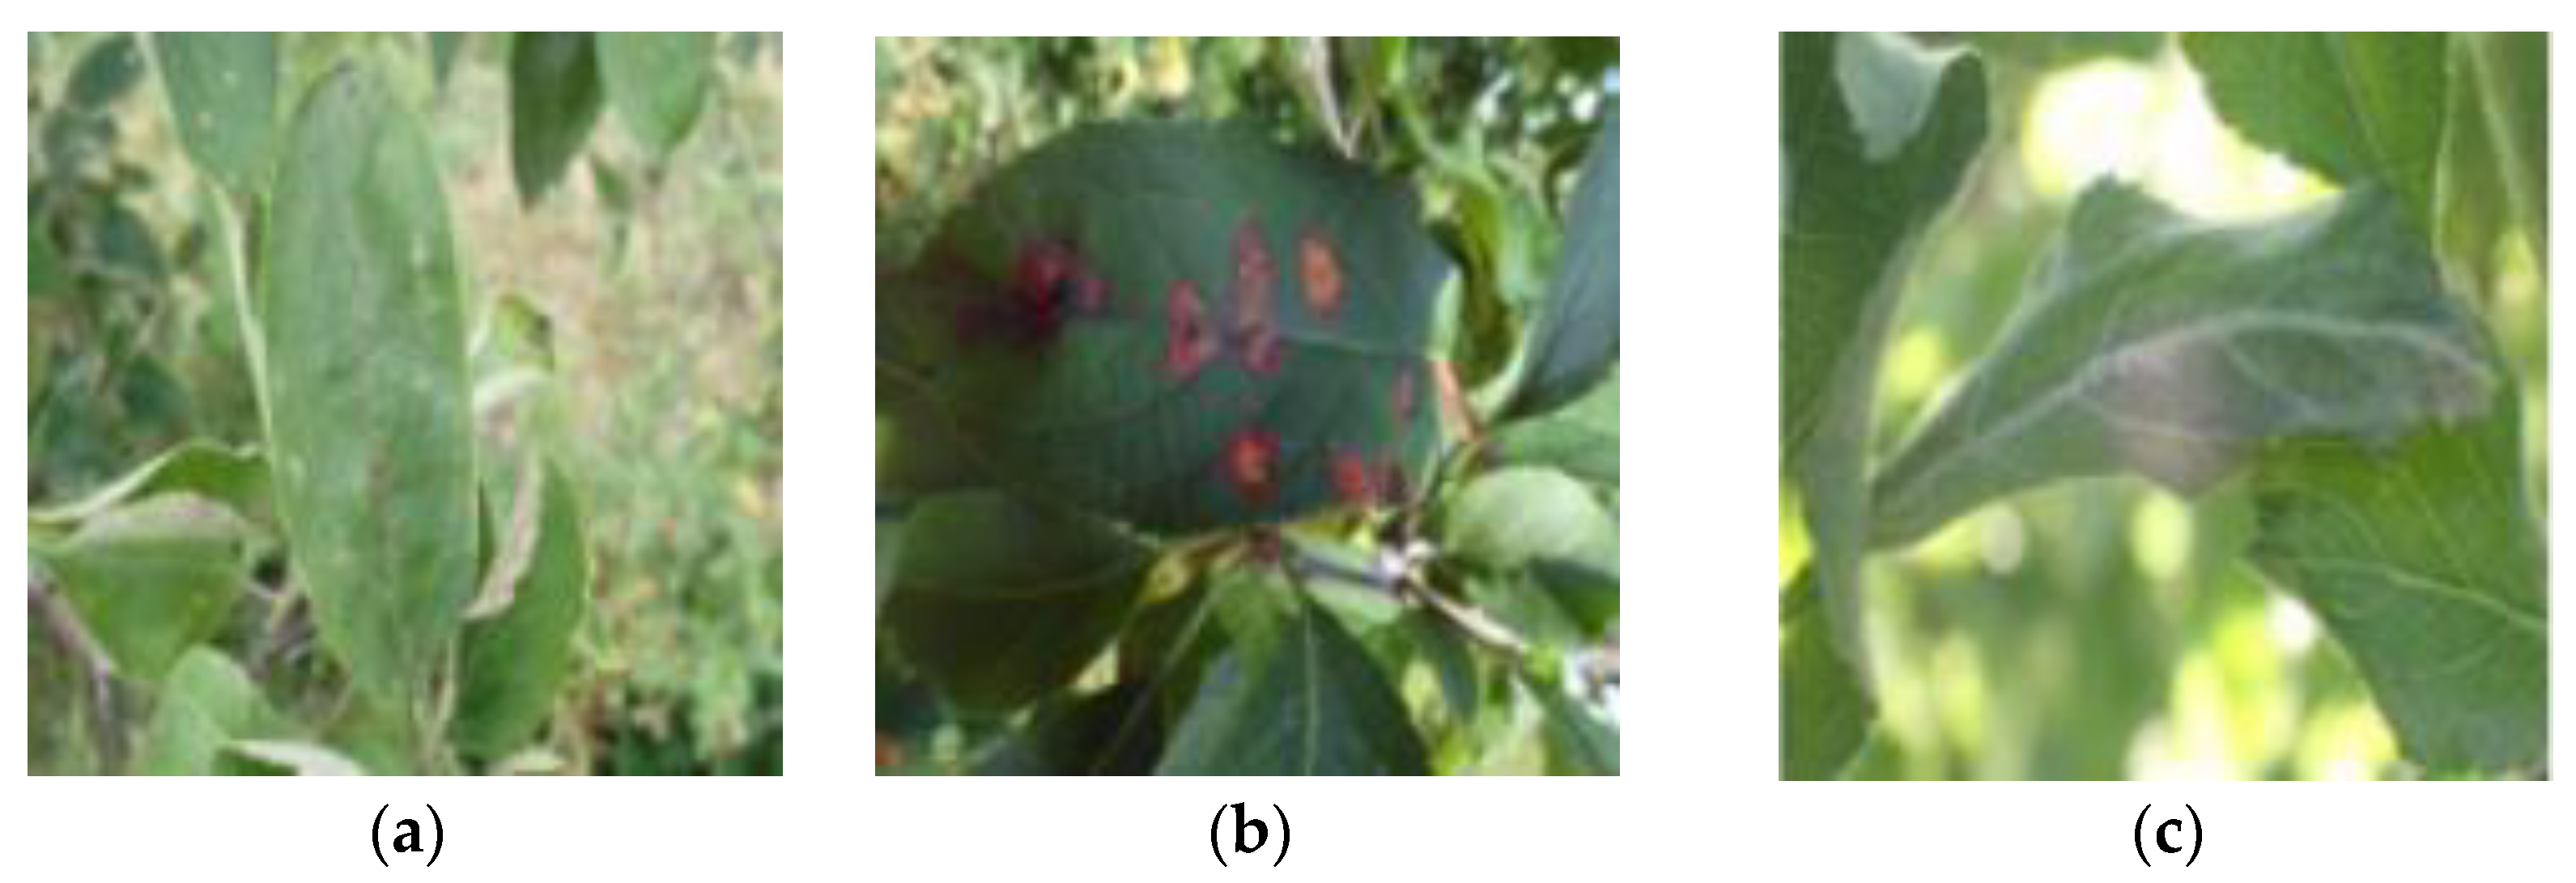
Figure 9 shows the classification results of different apple foliar disease classes. It can be seen from
Figure 9a that the Actual and Predicted classes are “rust”;
Figure 9b shows the Actual and Predicted class as “scab”, and
Figure 9c shows the Actual and Predicted class as “frog_eye_leaf_spot”.
Figure 10 shows the misclassification results on different apple foliar disease classes. It can be seen from
Figure 10a that the Actual class is “complex” and the Predicted class is “scab”;
Figure 10b shows the Actual class as “rust” and the Predicted class as “scab” and
Figure 10c shows the Actual class as “powdery_mildew” and the Predicted class as “frog_eye_leaf_spot”. The proper management of pomace complements the concept of sustainable agriculture as a means of reducing environmental damage.
5.5. Comparison with State-of-the-Art Techniques
Table 2 shows the comparison of the proposed model with other state-of-the-art models. The table highlights various techniques and models used for apple foliar disease classification, providing insights into their dataset sizes, class complexities, and performance achievements. The techniques are AlexNet, Deep CNN, the deep learning-based classification and localization method, DenseNet-121, ResNet, and the proposed model (EfficientNetB3). The table shows that the proposed model (EfficientNetB3) has an accuracy of 89.00%, which is lower than the accuracy of AlexNet (97.62%) and ResNet (94.23%). However, the proposed model has a higher precision (86.00%) and recall (88.00%) than AlexNet and ResNet. This means that the proposed model is better at correctly identifying the correct class and at not missing any of the classes.
6. Conclusions and Future Scope
In conclusion, apple foliar diseases are a significant challenge for apple growers worldwide. These diseases can cause a reduction in fruit quality and yield, leading to economic losses. Effective management strategies for these diseases include resistant cultivars, good orchard management practices, and fungicide sprays. Sustainable agriculture includes the careful handling of pomace as a means of reducing environmental damage. Early detection, monitoring, and integrated pest management strategies are also essential to minimize the risk of disease outbreaks and antibiotic resistance. Overall, continued research and development are necessary to address the challenges of apple foliar diseases and ensure sustainable apple production. Here, five transfer learning models, i.e., Inception-ResNet-v2, Efficient-NetB3, ResNet50, AlexNet, and VGG16, are fine-tuned and implemented on the Plant Pathology Dataset, having 23,187 apple foliar disease images. These models are compared in terms of the accuracy, precision, recall, and F1-score. From the analysis, it is concluded that the EfficientNetB3 model outperformed in comparison to the other four transfer learning models in terms of all performance parameters. Hence, the EfficientNetB3 model will be considered for further optimizer evaluation for hyperparameter tuning.
An area of future research is using precision agriculture techniques such as remote sensing and machine learning to identify disease hotspots and predict disease outbreaks in advance. This can enable growers to implement targeted management strategies, reducing the use of fungicides. Overall, the future scope of apple foliar disease management lies in developing sustainable, cost-effective, and environmentally friendly approaches that promote apple orchards’ long-term health and productivity.


 ,
, 


