Article

Response and Adaptation of Farmers’ Livelihood Transformation under the Background of Rural Transformation: Evidence from the Qinling Mountains, China

1
College of Management, Xi’an University of Finance and Economics, Xi’an 710100, China
2
College of Urban and Environmental Sciences, Northwest University, Xi’an 710127, China
*
Author to whom correspondence should be addressed.
Sustainability 2023, 15(17), 13004; https://doi.org/10.3390/su151713004
Submission received: 15 July 2023 / Revised: 22 August 2023 / Accepted: 23 August 2023 / Published: 29 August 2023
(This article belongs to the Special Issue Farmers’ Adaptation to Climate Change and Sustainable Development)

Abstract

:
Adaptation provides a new perspective for the study of farmers’ livelihood transformation and sustainability. This research aimed to explore the influencing factors of different types and adaptation of farmers’ livelihood transformation during rural transformation. Based on summarizing the response of farmers’ livelihood transformation during the rural transformation process in the Qinling Mountains of China from 1990 to 2018, this research constructed an evaluation index system for the adaptation of farmers’ livelihood transformation. Through questionnaires and interview surveys and based on the classification of farmers’ adaptive behavior, the research measured the adaptation index of different types of farmers’ livelihood transformation during different rural transformation periods and analyzed the factors affecting the types and the adaptation of farmers’ livelihood transformation. The results showed that: ① From 1990 to 2018, the livelihood transformation of farmers in Shangzhou District of Qinling Mountains mainly experienced changes from the farming + the working oriented to the synthetic type + the working oriented. ② From 1990 to 2018, the adaptation index of farmers’ livelihood transformation increased significantly in growth. From 1990 to 2009, the adaptation index of farmers’ livelihood transformation of working oriented and synthetic type was relatively high and concentrated. The distribution of the adaptation index of farmers’ livelihood transformation in 2010–2018 was relatively scattered. ③ Farmers with richer social networks tended to choose comprehensive and diversified livelihoods. Farmers with richer financial and natural capital were more likely to choose non-agricultural livelihoods. Leadership potential and social network, livestock, income status, and actual cultivated area were the key variables that have been influencing the adaptation of farmers’ livelihood transformation in Shangzhou District since 1990. The research results contribute to the optimization of sustainable livelihood strategies for farmers in the Qinling Mountains of China and provide case references for the study of livelihood transformation of farmers in underdeveloped mountainous areas worldwide.

1. Introduction

Since China’s reform and opening, massive deforestation and land reclamation have led to intensified soil erosion and damage to the ecological environment in mountainous rural areas [1]. Since 2000, China has implemented measures such as Grain for Green and migration, especially the poverty reduction and rural revitalization policies since 2018, which have posed challenges to the transformation and development of traditional agriculture and rural areas in mountainous areas [2]. As an important ecological protection area in Qinling Mountains, Shangzhou District, Shaanxi Province, China, presents the basic characteristics of a vulnerable ecological environment, a large population, and little land [2,3]. In the process of transformation and development of China’s Qinling mountain villages, represented by Shangzhou District, the discussion on the response and adaptation of farmers’ livelihood transformation is beneficial for clarifying the sustainability of farmers’ livelihoods in the context of rural transformation in mountainous areas of China.
With the widespread application of the concept of adaptation in the field of sustainability science, adaptation research has gradually become one of the important research contents in the field of regional sustainable development [4]. Previous research took farmers’ livelihood capital as the core based on the theory of sustainable livelihoods [5] and constructed a framework for analyzing the adaptation of farmers’ livelihoods [6]. This framework combined livelihood issues with the concept of adaptation, emphasizing the importance of livelihood adaptive capacity in risk response under different livelihood strategies [6]. Livelihood adaptation was an important aspect of adaptive micro-research. Exploring the farmers’ livelihood adaptation to cope with climate change, such as adaptation to disasters, was the basis for decision-makers to choose adaptation strategies [7,8]. The livelihood adaptation strategies of farmers were the main content of livelihood adaptation discussions, especially addressing livelihood risks, such as climate change and disasters, which were the focus of scholars’ attention. For example, to address climate change, researchers explored the impact of livelihood capital on livelihood adaptation strategies [9,10,11], as well as the relationship between livelihood risks, farmers’ perceptions of climate change, and livelihood adaptation strategies [12,13]. Some studies clarified the adaptation level of farmers’ livelihoods under different management or response strategies or new technologies [14,15,16], which was conducive to developing long-term adaptive plans to improve livelihood adaptation [17]. Farmers successfully coped with climate change by adopting different adaptation strategies and providing important ways to address climate uncertainty through livelihood cascade adaptation performance [18]. In adaptation evaluation methods, it was common to obtain an adaptation index through mathematical and model calculations [19,20,21,22]. The indicator system was the foundation of adaptation assessment, and most adaptation assessment studies involved two aspects: indicator system and factor identification analysis [23]. Researchers constructed an indicator system for farmers’ livelihood adaptation based on buffering capacity, learning capacity, and self-organization, but essentially still centered around farmers’ livelihood capital [5,6]. The analysis of influencing factors and mechanisms of adaptation provided support for enhancing the formulation of effective adaptive policies or measures. Among the numerous methods for identifying factors affecting adaptation, scholars used common mathematical models or modified existing models to meet the analysis of multi-influencing factors of adaptation [24,25]. At present, there is a lack of attention to dynamic processes and their characteristic laws in adaptation research, especially lacking in adaptive dynamic research from a micro perspective.
Rural transformation was a process of reshaping the rural economy and social structure, constantly evolving the functions of natural regions, and mainly manifested in the transformation of agricultural production and living, and spatial organizational structure [26,27]. At present, studies on rural transformation mainly focus on characteristics, transformation processes, influencing factors, and driving mechanisms. For example, from a macro perspective, the research explored the dynamic mechanism of spatial–temporal differentiation and evolution in rural transformation and development [28]. Some researchers discussed the driving forces of rural transformation and development from the perspectives of land use change and agricultural transformation [29,30]. In addition, sustainable livelihoods for farmers are a new direction for the dynamic transformation and development of rural areas. From a micro perspective, the existing research characterized the process and characteristics of rural transformation through changes in farmers’ livelihoods, linking rural transformation with sustainable farmers’ livelihoods [31,32], and summarizing the effects, and mechanisms of farmers’ livelihood transformation [33]. Research on livelihood transformation was receiving increasing attention. By analyzing changes in land use, it promoted the policy formulation of sustainable livelihoods, livelihood transformation, and rural development transformation for farmers [34,35]. Some scholars explored the transformation of livelihoods from the perspectives of farmers’ livelihood patterns, livelihood methods, and livelihood security. In rural areas near cities, the livelihood mode of households shifted from agriculture to non-agriculture, and the transformation of livelihood methods had a significant impact on the labor cost of food production. At the same time, the diversification of livelihood activities was an important response strategy to overcome resource shortages [36,37,38]. In response to extreme weather related to climate change, farmers’ livelihood activities had changed, and adaptation was the result of farmers’ livelihood survival strategies [39]. At present, research on livelihood transformation focuses on the transformation process, lacking exploration of the transformation results, especially the quantitative evaluation of the transformation results. However, adaptation research provides new ideas for rural transformation, especially from the micro-perspective of farmers, exploring the response and adaptation of farmers’ livelihood transformation in the process of rural transformation, which is still lacking in traditional rural transformation research.
Therefore, this research aimed to explore the influencing factors of different types and the adaptation of farmers’ livelihood transformation during rural transformation in the Qinling Mountains, which focused on the outcome of livelihood transformation. Ultimately, the policy implications were provided for farmers’ sustainable livelihoods of rural transformation in the Qinling Mountains. This research selected Shangzhou District in the Qinling Mountains of China as a case study, combining socio-economic statistics and survey data, and from the micro perspective of farmers, analyzed the response of farmers’ livelihood transformation in the process of rural transformation from 1990 to 2018. Based on quantitatively measuring the adaptation index of farmers’ livelihood transformation in different rural transformation periods, the research analyzed the evolutionary characteristics of adaptation of different types of farmers’ livelihood transformation. At the same time, the obstacle model and multiple logistic regression were used to identify the influencing factors of farmers’ adaptation and types of livelihood transformation, which contributed to the optimization of sustainable livelihoods for farmers in the Qinling Mountains of China, and provided case references for the study of livelihood transformation of farmers in underdeveloped mountainous areas worldwide.
The chapter arrangement of this research is as follows: the materials and methods are explained in Section 2, including the study area, data collection, indicators, and quantitative analysis. The results and discussion are presented in Section 3, which consists of the rural transformation process, the adaptation of farmers’ livelihood transformation, analysis of influencing factors, and policy implications. The conclusion is summarized in Section 4.

2. Materials and Methods
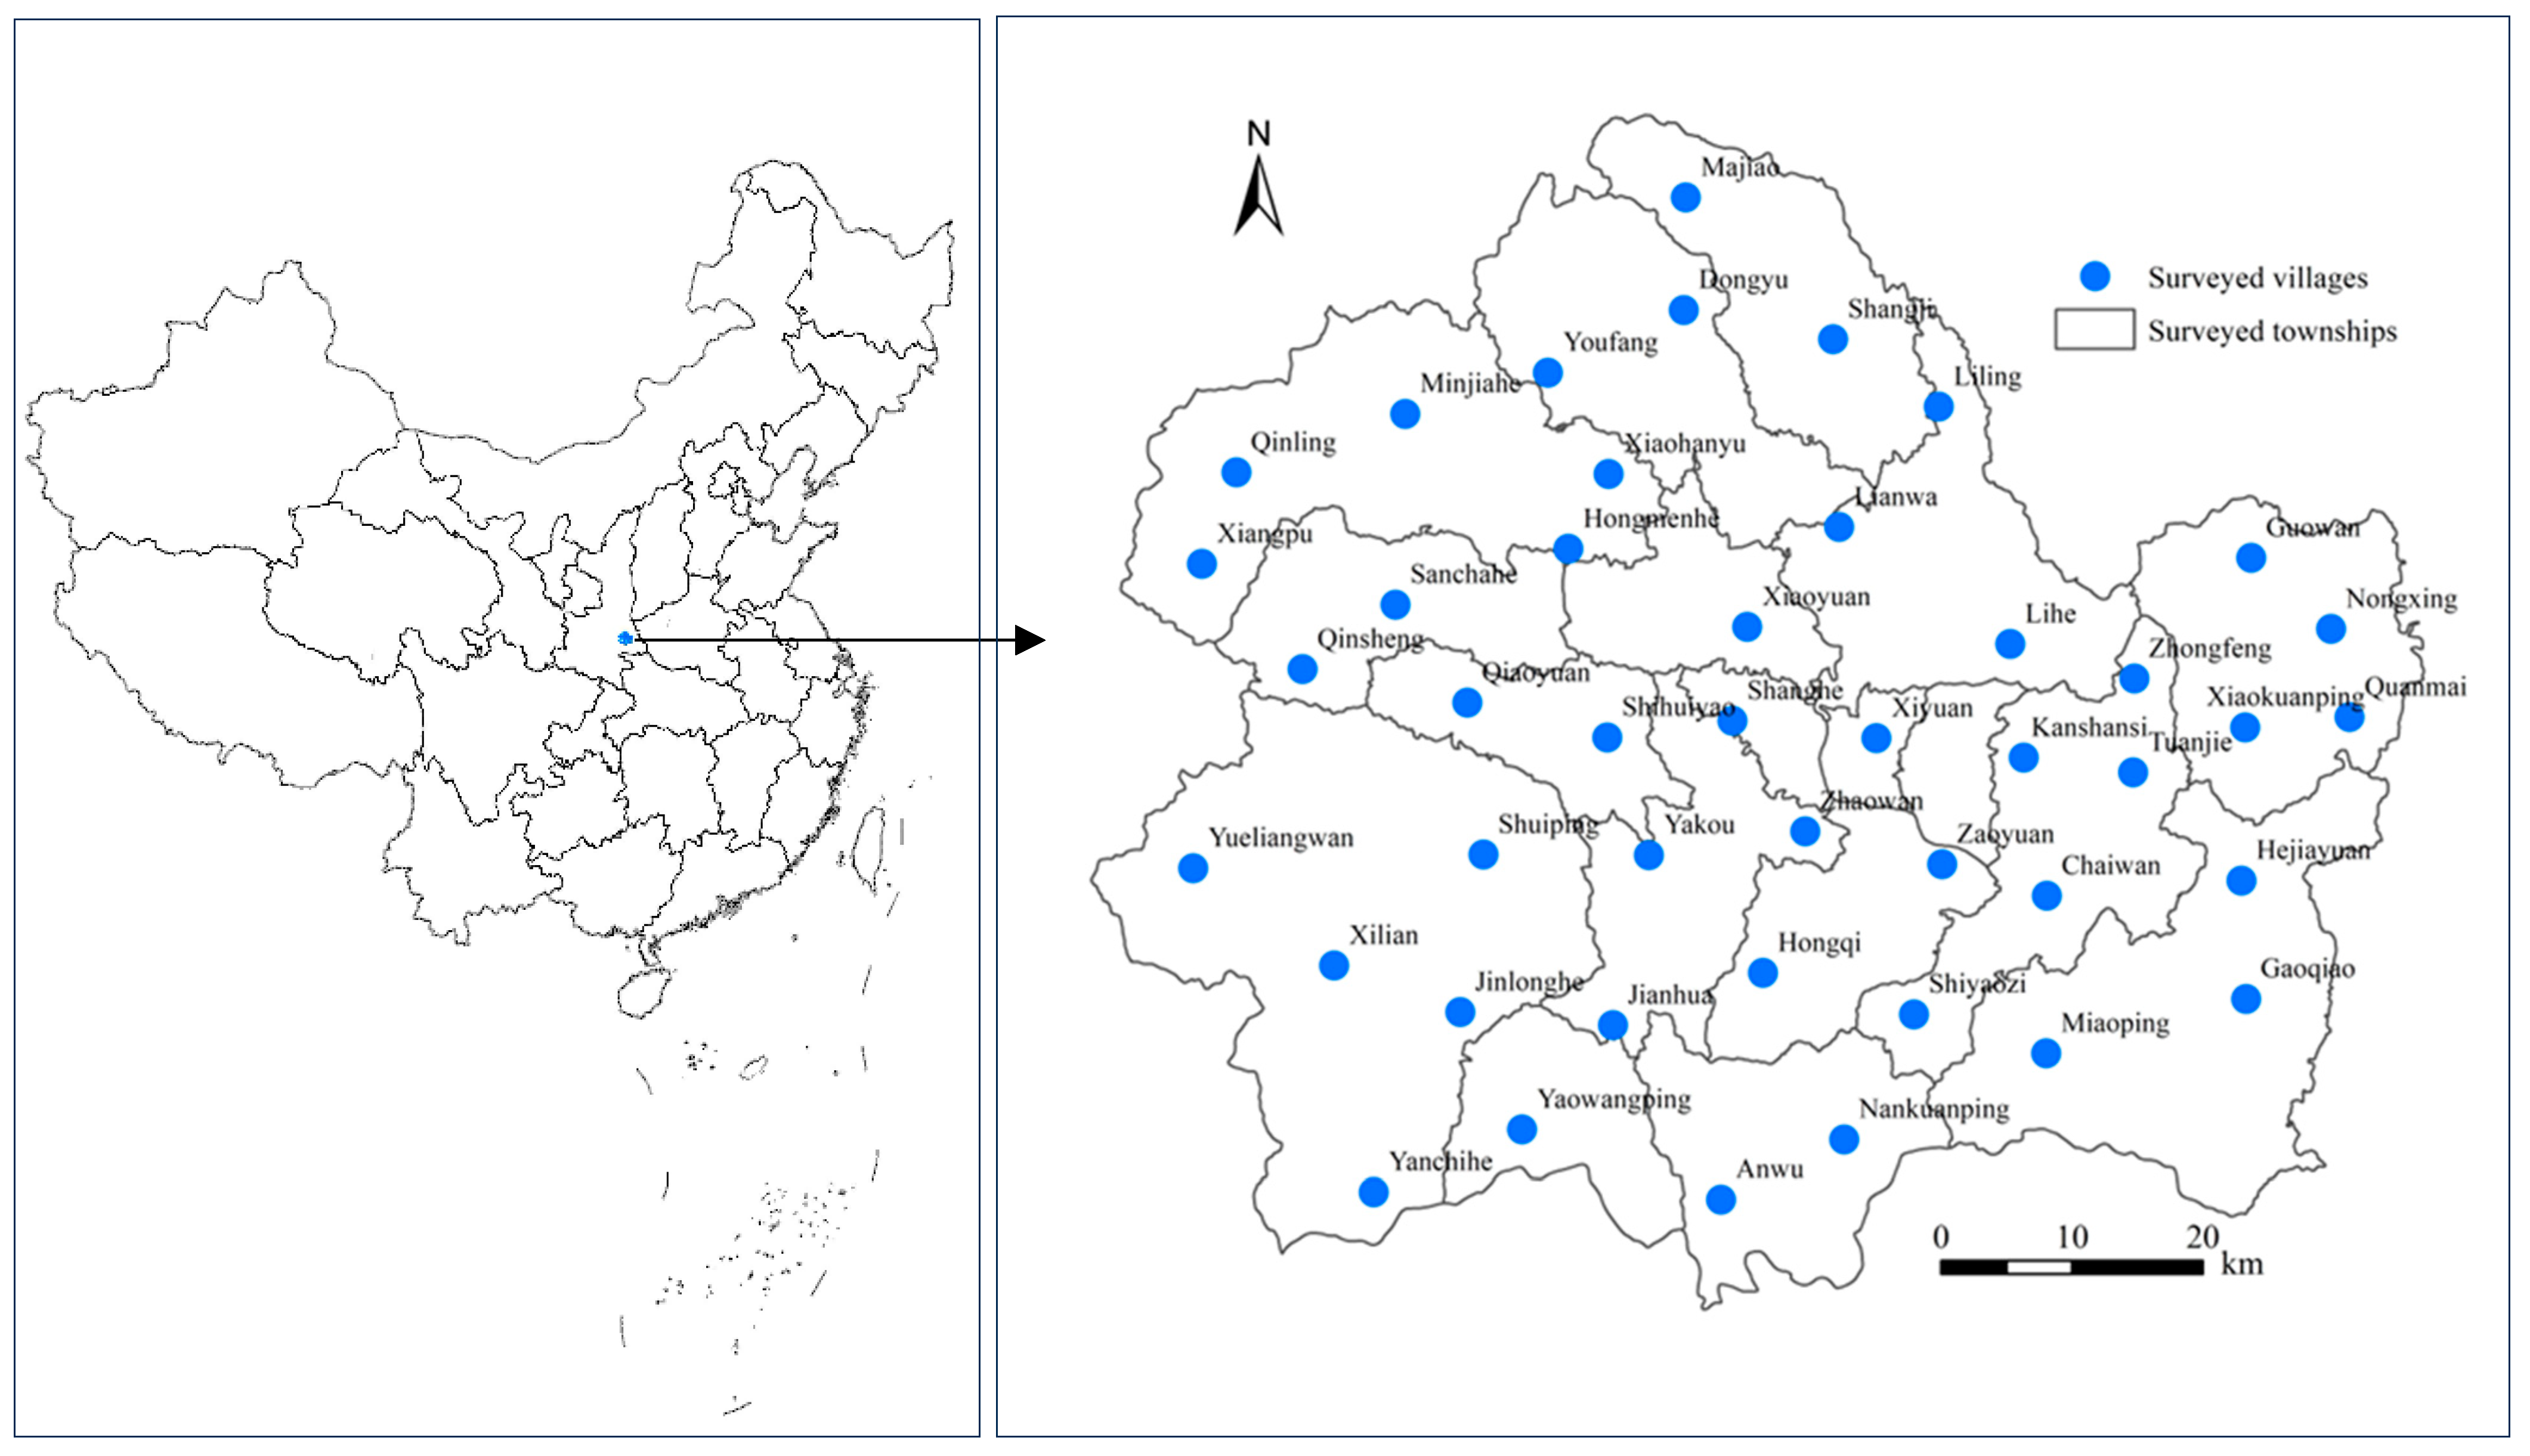
2.1. Study Area

Shangzhou District is located between 109°30′~110°14′ E and 33°38′~34°11′ N, in the southeast of Shaanxi Province, China, at the southern foot of the eastern section of the Qinling Mountains, with a total area of 2645.62 km2. Shangzhou District has 4 subdistricts and 14 townships. Survey villages are shown in Figure 1.
The Qinling Mountains in the northwest of Shangzhou District have effectively blocked the invasion of cold air. The mountains and rivers opening to the southeast are conducive to the flow of warm moisture, forming a monsoon and semi-humid mountain climate in the southern transitional zone of the warm temperate zone. The four seasons are distinct, with no severe cold in winter and no intense heat in summer. The rain and heat are the same period, and the temperature and precipitation vary greatly from year to year. The climate is characterized by high temperatures and excessive precipitation. The average annual temperature is 12.8 °C, with a frost-free period of 204 days and precipitation of 740 mm. The terrain of the entire Shangzhou District is an important component of the East Qinling Mountains, with a complex structure. It is a rocky mountain area mainly composed of medium and low mountains, with a terrain high in the northwest and low in the southeast. Its geomorphic features are divided into middle to high mountain areas, low mountain and hilly areas, and river valley and plateau areas.
Shangzhou District is a key ecological protection area in Shaanxi Province, China, and its ecology is extremely vulnerable to damage, making it representative of the fragile environment in the Qinling Mountains. More people and less land are the basic characteristics of Shangzhou District. In 2022, the total population of Shangzhou District was 556,000, including 346,400 agricultural people, accounting for 62.30% of the total population. The per capita arable land area was only 0.0386 hectares. The proportion of the three industries was 12.6:26.8:60.6. The per capita disposable income of rural residents was 13,700 yuan (approximately 1908 USD). Because most areas belong to restricted development zones, the per capita arable land area in Shangzhou District is relatively small, the agricultural economic foundation is poor, and rural social development is relatively backward.

2.2. Data Collection

The Statistics Bureau of Shangzhou District provided the socio-economic statistics. The main data include the compilation of national economic statistics and social statistics of Shangzhou District from 1990 to 2018, Shangzhou City Chronicle, Shangzhou Yearbook (2005–2007), Shangzhou Yearbook (2012–2017), and Shangzhou Yearbook (2018).
The questionnaire was distributed from 3 September 2019 to 10 September 2019. The basic situation of rural development was known through the pre-survey. Considering the principles of comprehensiveness and spatial balance of sample points, the surveyed villages were determined by using the methods of systematic sampling and stratified sampling. A total of 44 administrative villages were selected in the case area. The selected sample villages were based on the density of administrative villages in different towns, considering the natural characteristics of each administrative village, the proportion of permanent residents, and whether it was a “hollow village”, to ensure the smooth distribution of questionnaires and interviews. The surveyed farmers were determined by random sampling method, and the questionnaire survey was mainly conducted on middle-aged and elderly household heads who were familiar with rural development and family status. A total of 170 questionnaires were distributed in Shangzhou District, and 167 valid questionnaires were recovered, with a recovery efficiency of 98.24%. The distributed questionnaire was designed based on pre-survey and interview and was modified in the experimental questionnaire distribution. The questionnaire was filled in by question-and-answer method, which ensured the quality and recovery rate of the questionnaire. At the same time, to deeply understand rural development and farmers’ livelihood, in-depth interviews were conducted in the surveyed villages. The interviewees were village cadres or old farmers who knew more about the development of the village. The interview time was 1–1.5 h. The main content of the questionnaire covers three parts: the basic situation of farmers’ families, farmers’ livelihood capital, and farmers’ livelihood adaptive behavior in the three periods of 1990–1999, 2000–2009, and 2010–2018.

2.3. Indicators and Quantitative Analysis

2.3.1. Evaluation System of Livelihood Transformation Adaptation

According to the analysis framework of sustainable livelihoods and existing studies [6,40], this research argued that the adaptation of farmers’ livelihood transformation covered livelihood capital and livelihood output, which is specifically reflected in the three aspects of farmers’ livelihood capital index, living standard index, and livelihood stability index. According to the existing research [6], household income balance and income diversity were used to characterize the living standard index and livelihood stability index, respectively. Concerning existing studies [41,42,43,44], this research constructed the evaluation index system of farmers’ livelihood capital (see Table 1).
Natural capital reflects the dependence of farmers on natural resources, selecting factors that reflect the natural habitat of the study area, including the ecological governance and actual cultivation area. Material capital represents the consumption or production equipment status of farmers’ households, including the household physical assets, housing, livestock, etc. Financial capital reflects the accumulation and flow of money by farmers in production and consumption, including the income status and gap between the rich and the poor. Human capital represents the labor resources of farmers themselves, including factors such as the household workforce, health status, and policy awareness. Social capital reflects the social resources (relationships) of rural households, and its role is to help enhance the family’s capital, including the social network, leadership potential, and assistance opportunities.

2.3.2. Quantitative Analysis Methods

To eliminate the influence of the original data dimension, the original data were standardized. Considering the difference in the impact of positive and negative indicators on farmers’ livelihood capital, the entropy method was used to calculate the indicator weight of farmers’ livelihood capital. The entropy method reflects the information entropy of data based on their degree of dispersion, thereby determining the weight of indicators, and effectively solving the problem of information overlap between multiple indicator variables. The specific calculation steps of the entropy method are as follows:
(1)
Due to the use of logarithmic operations in the entropy method, standardized values cannot be directly calculated. To address the impact of negative or zero numbers on operations, the standardized numerical translation processing is
Z i j = X i j + A
(2)
Quantify each indicator equally and calculate the proportion of the i-th sample to the j-th indicator:
S i j = X i j / i = 1 n X i j
(3)
Calculate the entropy of indicator information:
e j = 1 / ln n × i = 1 n S i j ln S i j
(4)
Calculate the coefficient of difference for indicators:
g j = 1 e j
(5)
Normalize the difference coefficient and calculate the indicator weight:
w j = g j / j 1 m g j
where Zij is the value after translation. A is the translation amplitude. Sij represents the specific gravity value of Xij. Ej represents the entropy value of the j-th indicator. Gj represents the coefficient of difference for the j-th indicator. Wj represents the weight of the j-th indicator.
This research calculated the adaptation of farmers’ livelihood transformation using the comprehensive index method and functional model method. The comprehensive index method utilizes the construction of an indicator system to quantify the adaptation of farmers’ livelihood transformation, indicating the level of the adaptation, which is easy to understand and operate, but neglects the interaction relationship between system elements. The function model method overcomes this disadvantage, but the system elements are difficult to quantify and express [45]. The calculation formula of the functional model method is as follows:
L A = f { L C , L L , L S } = L C + L L + L S
where LA is the adaptation index of farmers’ livelihood transformation. LC is the farmers’ livelihood capital index. LL is the living standard index. LS is the livelihood stability index. According to existing research [6], LL and LS are characterized by household income balance and income diversity, respectively. LC is calculated using the composite index method. The calculation formula is as follows:
L C = j = 1 S W l j X l j
where LC is the livelihood capital index of farmers, with values ranging from (0 to 1). Wlj is the indicator weight of farmers’ livelihood capital. Xlj is the standardized value of farmers’ livelihood capital indicators.
To further analyze the key variables affecting the adaptation of farmers’ livelihood transformation and identify the obstacle factors for improving the adaptation of farmers’ livelihood transformation, existing studies have identified obstacle factors using concepts such as “factor contribution degree”, “indicator deviation degree”, and “obstacle degree” [46,47,48]. This research used an obstacle degree model to explore the obstacle factors of farmers’ livelihood transformation adaptation. The calculation formula is as follows:
Y j = 1 X j
B j = ( T j × Y j ) / j = 1 n ( T j × Y j ) × 100 %
where Yj is the deviation degree of the indicator, which is the difference between the j-th indicator and the optimal target value. Xj is the standardized value of each indicator. Tj is the factor contribution degree, which is the comprehensive weight of the j-th indicator on the adaptation of farmers’ livelihood transformation, indicating the degree of impact of the j-th indicator on the adaptation of farmers’ livelihood transformation. Bj is the degree of the obstacle, indicating the degree of the obstacle to the j-th indicator of the adaptation of farmers’ livelihood transformation.
Taking the type of livelihood transformation of farmers as the dependent variable, this research used multiple logistic regression analysis to analyze the important factors affecting the type of livelihood transformation of farmers [43]. The types of livelihood transformation for farmers, such as “Farming”, “Working”, “Farming oriented”, “Working oriented”, and “Synthetical type”, were used as dependent variables, and the value of the dependent variable is limited to [0, 4], that is, “Farming”, “Working”, “Farming oriented”, “Working oriented”, and “Synthetical type” are defined as multiple disordered variables y = (y0, y1, y2, y3, y4), k = [0, 4]. And y4 is the reference level for the model. This research used the livelihood capital index of farmers as the independent variable, with the independent variable x = (x1, x2,, xp). Natural capital reflects the dependence of farmers on natural resources and may have an impact on the selection of agricultural-related livelihood transformation types that rely on resources. Material capital and financial capital reflect the accumulation and flow of means of production and consumption money in rural households. Human capital is the embodiment of rural household labor resources. These indicators may have an impact on all types of livelihood transformation. Social capital reflects the social relationship resources of farmers and families, which may affect the types of non-agricultural livelihood transformation.
The conditional probability of y is
P y = k x = k = 0 4 e x p y k 1 + k = 0 4 e x p y k
The corresponding logistic regression model is
y k = In P 1 P = β 0 k + β 1 k x 1 + β 2 k x 2 + + β p k x 1 p
where P is the probability of the event occurring. x1, x2,, xp are the independent variables. Parameters β0k, β1k,…, βpk are the undetermined coefficients of regression.

3. Results and Discussion

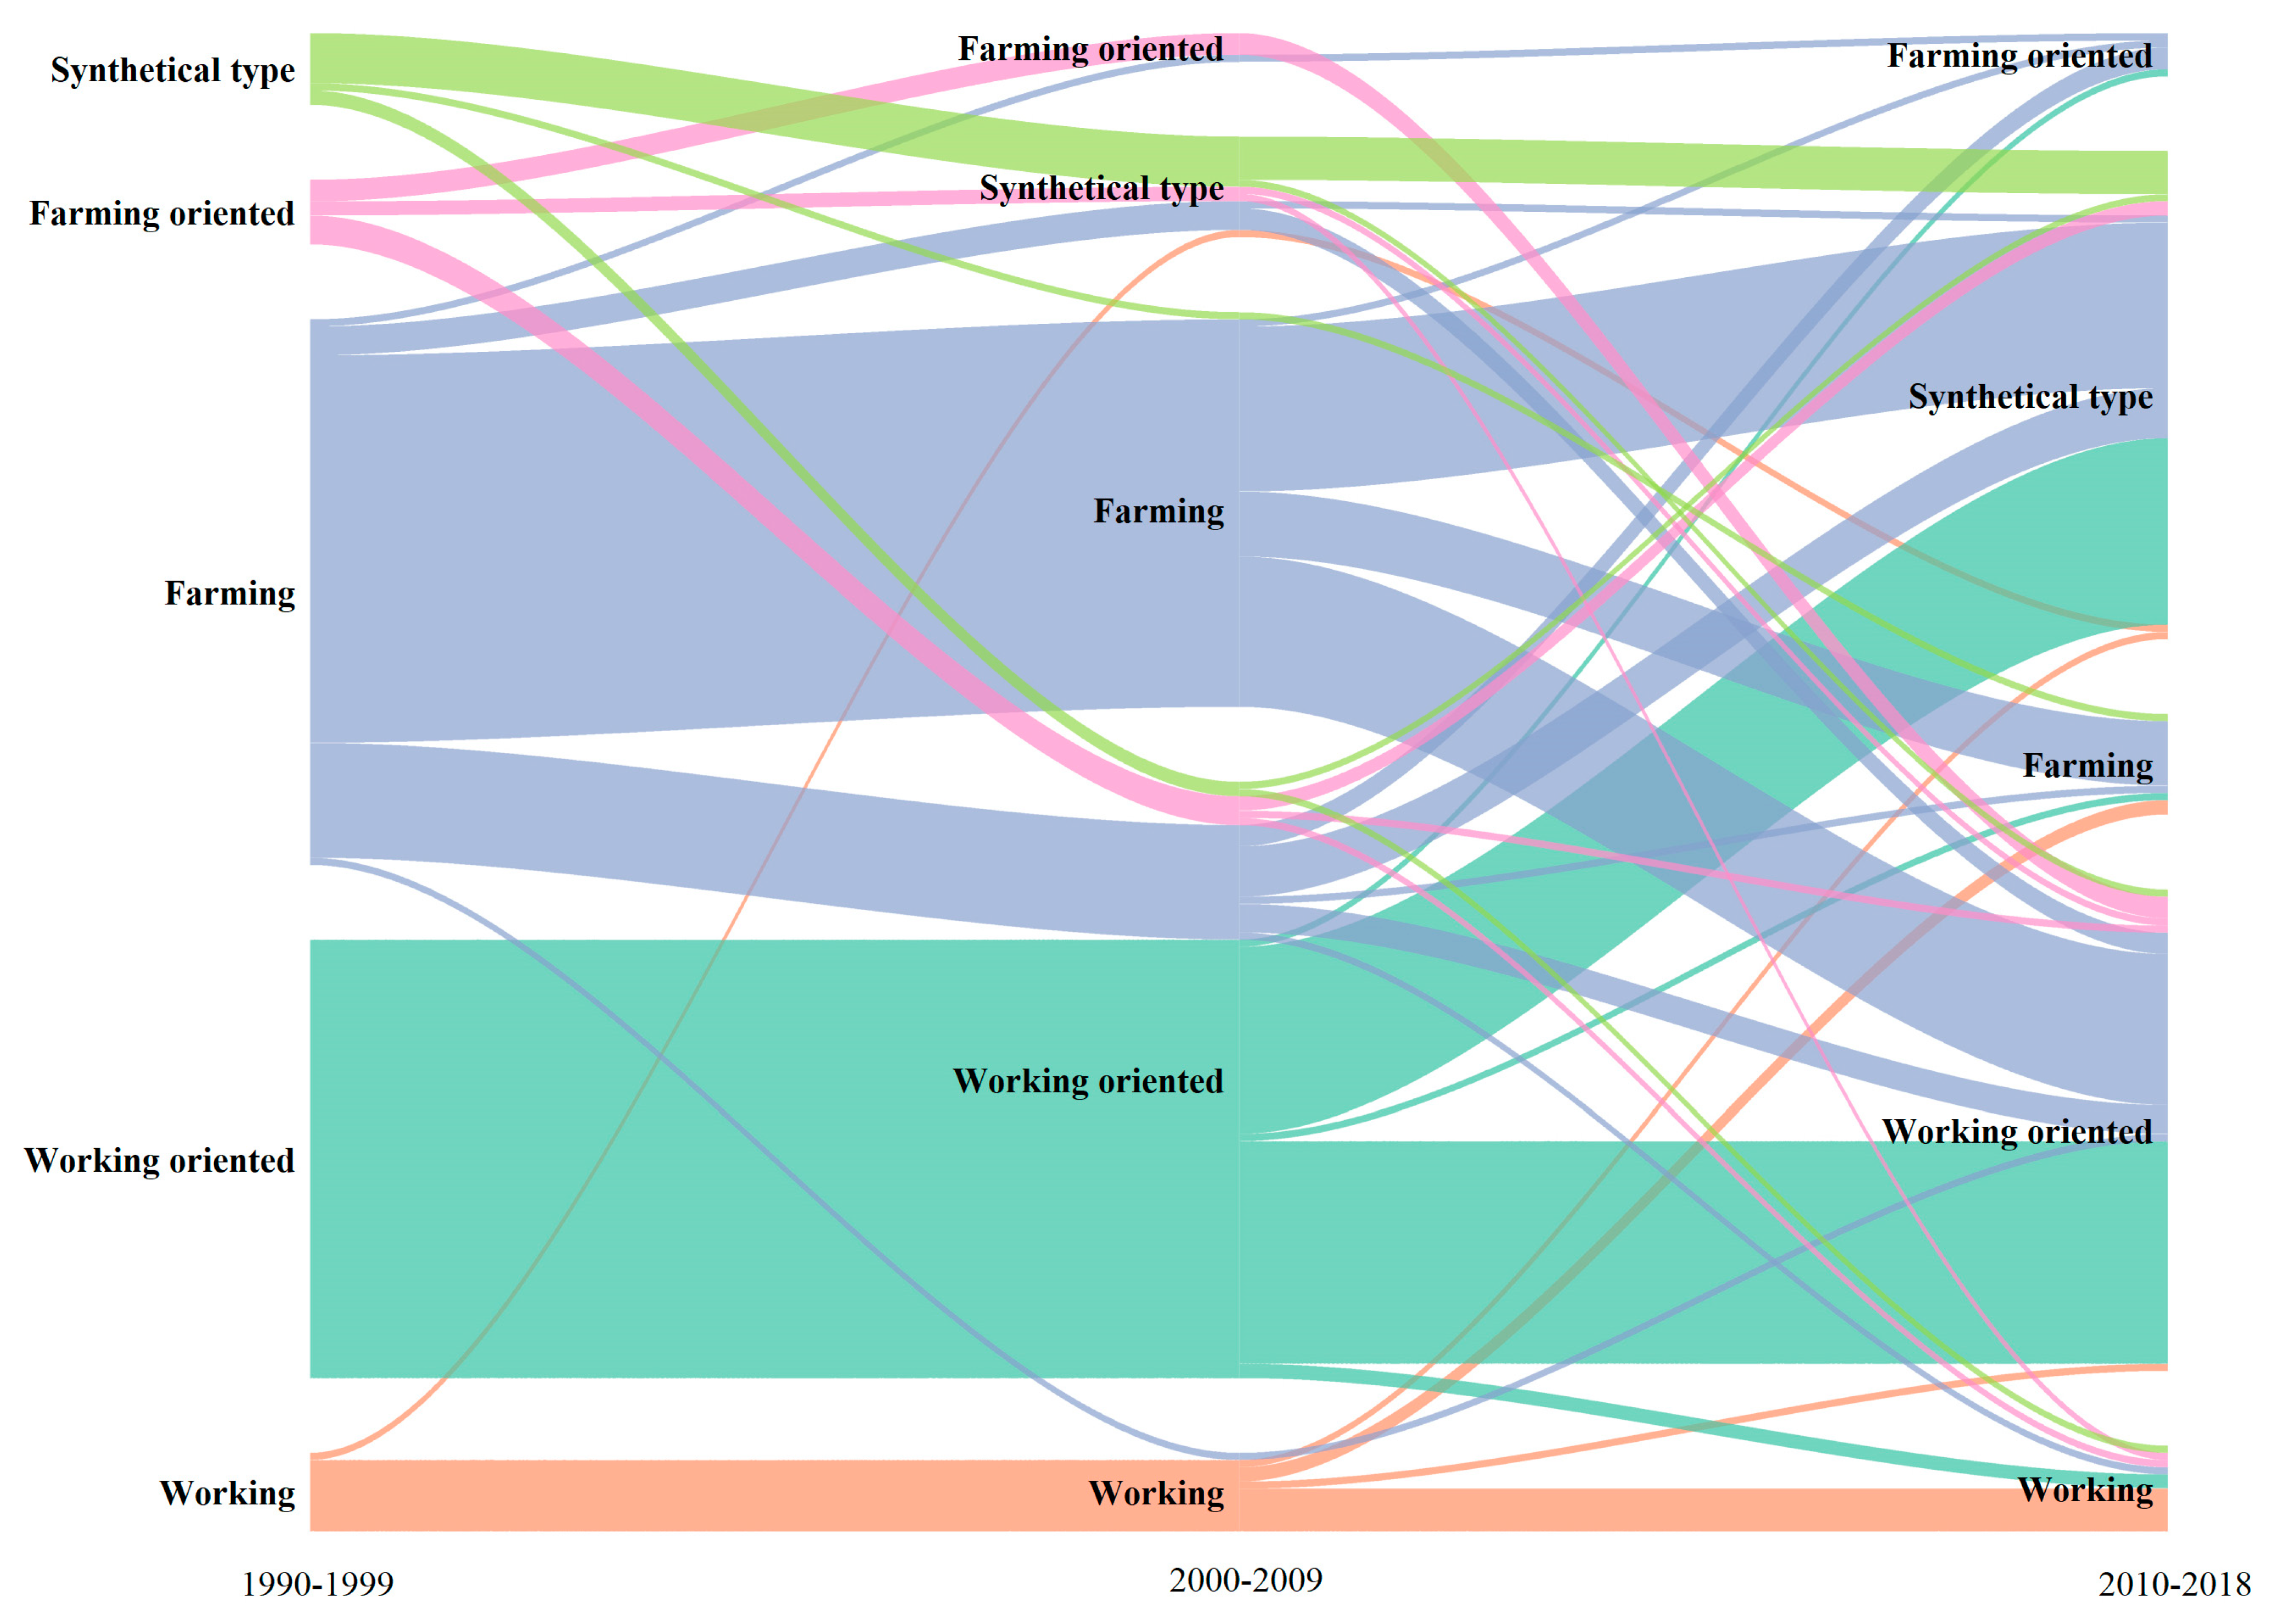
3.1. Rural Transformation and Farmers’ Livelihood Response

Ecological, social, and economic changes in rural transition directly affect the livelihood choices of farmers. This research analyzed the rural transformation process in Shangzhou District from three aspects: ecology, economy, and society. In the process of rural transformation, five types of farmers’ livelihood transformation were summarized according to the way of farmers’ livelihood choice (Table 2). From 1990 to 2018, the proportion of the farming and the farming oriented in the types of farmers’ livelihoods transformation decreased, especially the farming, while the proportion of the synthetic type significantly increased, indicating that fewer and fewer farmers rely on single farming as their livelihood, and their livelihood methods are gradually diversified. Compared with existing research on static analysis of farmers’ livelihood behavior [6,49], although the results showed that farmers’ livelihoods were diversified, this study highlighted the process and trends of farmers’ livelihood transformation.
Since agricultural production had an important impact on the evolutionary process of rural development, at the same time, the livelihood status of farmers was also directly affected by changes in agricultural production. Therefore, we characterized the period of rural transformation and development through the period of agricultural development, and summarized the process of rural transformation and development in Shangzhou District from 1990 to 2018 into three periods: traditional agricultural planting, restricted agricultural development, and agricultural development transformation, while the transformation of farmers’ livelihoods has experienced the change from the farming + the working oriented to the synthetical type + the working oriented dominated (Figure 2).
(1)
Traditional agricultural planting: 1990–1999
The farming and working oriented were the main types of livelihood transformations during this period (Table 2 and Figure 2). From 1990 to 1999, the per arable land area in the Shangzhou District was less than 1 mu (0.1647 acres). Due to the small area of arable land, agricultural planting in the 1990s was dominated by food crops to solve the problem of subsistence. Because of the thin soil layer and weak fertility in rocky mountainous areas, it has low yields of arable land in the Shangzhou District. In addition, due to the lack of arable land resources and limited means of livelihood, the financial capital of farmers was low. The consumption level of farmers was relatively low, which cannot promote social and economic development in rural areas. Because of their location in the mountainous areas of the north–south transition zone, the climate was temperate and humid, with high forest and vegetation cover, and the ecological environment of the rural area remained in good condition. As a result of the extremely low income from farming, most of the farmers could hardly satisfy the annual food ration of their families by relying only on their arable land, and by the end of the 1990s, some of the farmers who had abundant social networks and labor conditions began to go out to take part-time jobs to subsidize the family’s subsistence. Therefore, working-oriented livelihoods were an important choice of livelihoods for farmers during this period.
(2)
Restricted agricultural development: 2000–2009
Working oriented was the main type of livelihood transformation during this period (Table 2 and Figure 2). As a result of the pilot implementation of the Grain to Green Program in 1999, the area of Grain to Green in Shangzhou District began to increase significantly in 2000, which further led to a decrease in the cultivated area of the countryside. The Grain to Green Program in Shangzhou District was dominated by the planting of walnut trees, but the market benefits of walnut planting by farmers were limited, and the agricultural income of farmers remained low. Agricultural development was limited by the Grain to Green. Although the rural ecological environment had been protected, the rural economic and social development was still lagging. Due to the small per capita arable land in Shangzhou District, the crops planted were still mainly food crops. Even if farming did not require much labor, and working income was higher than farming income, the rural labor force was more and more shifting to work outside. Some farmers of the farming transformed into working oriented (Figure 2). Through the interview, it could be seen that: “In the first few years of the 2000s, more people went out to work than before, because the income from working was higher than from farming. If we went out to work, we could save a little bit and still had some money left over in a year, but it was impossible to farm.” (Interviewee: Cadre of XX village, XX township).
(3)
Agricultural development transformation: 2010–2018
The working oriented and the synthetical type were the main types of livelihood transformation during this period (Table 2 and Figure 2). During this period, the ecological effect of Grain for Green was emphasized, and the development trend of the rural ecological environment was good. In 2011, Shangzhou District began to implement poverty alleviation development and resettlement projects, which played an important role in protecting the existing ecological environment, and had a vital impact on farmers’ livelihoods, while farmers’ livelihoods gradually diversified. Although farmers continued to work outside for a long time, the rural agricultural planting structure had undergone significant adjustments with the support of the government’s poverty alleviation policies and industrial technologies. Some farmers no longer planted single food crops and began to plant cash crops led by vegetables, Chinese herbal medicines, and edible fungi, while the economic benefits affected by the market and sales channels were unstable, and the transformation of agricultural development was obvious. During this period, some farmers chose a new type of farming based on facility-based agriculture, but the higher livelihood income still came from long-term work outside, and most farmers preferred to go out to work for a long time. Although there are differences between the current case studies and this study [6,49], the results are consistent with this study, indicating that long-term migrant work by farmers is common throughout China. As a result, a large number of the farming and the working oriented farmers shifted to a combination of traditional farming, facility-based agriculture, and working livelihoods from 2000 to 2009, while farming farmers shifted to working livelihoods in the previous period (Figure 2).

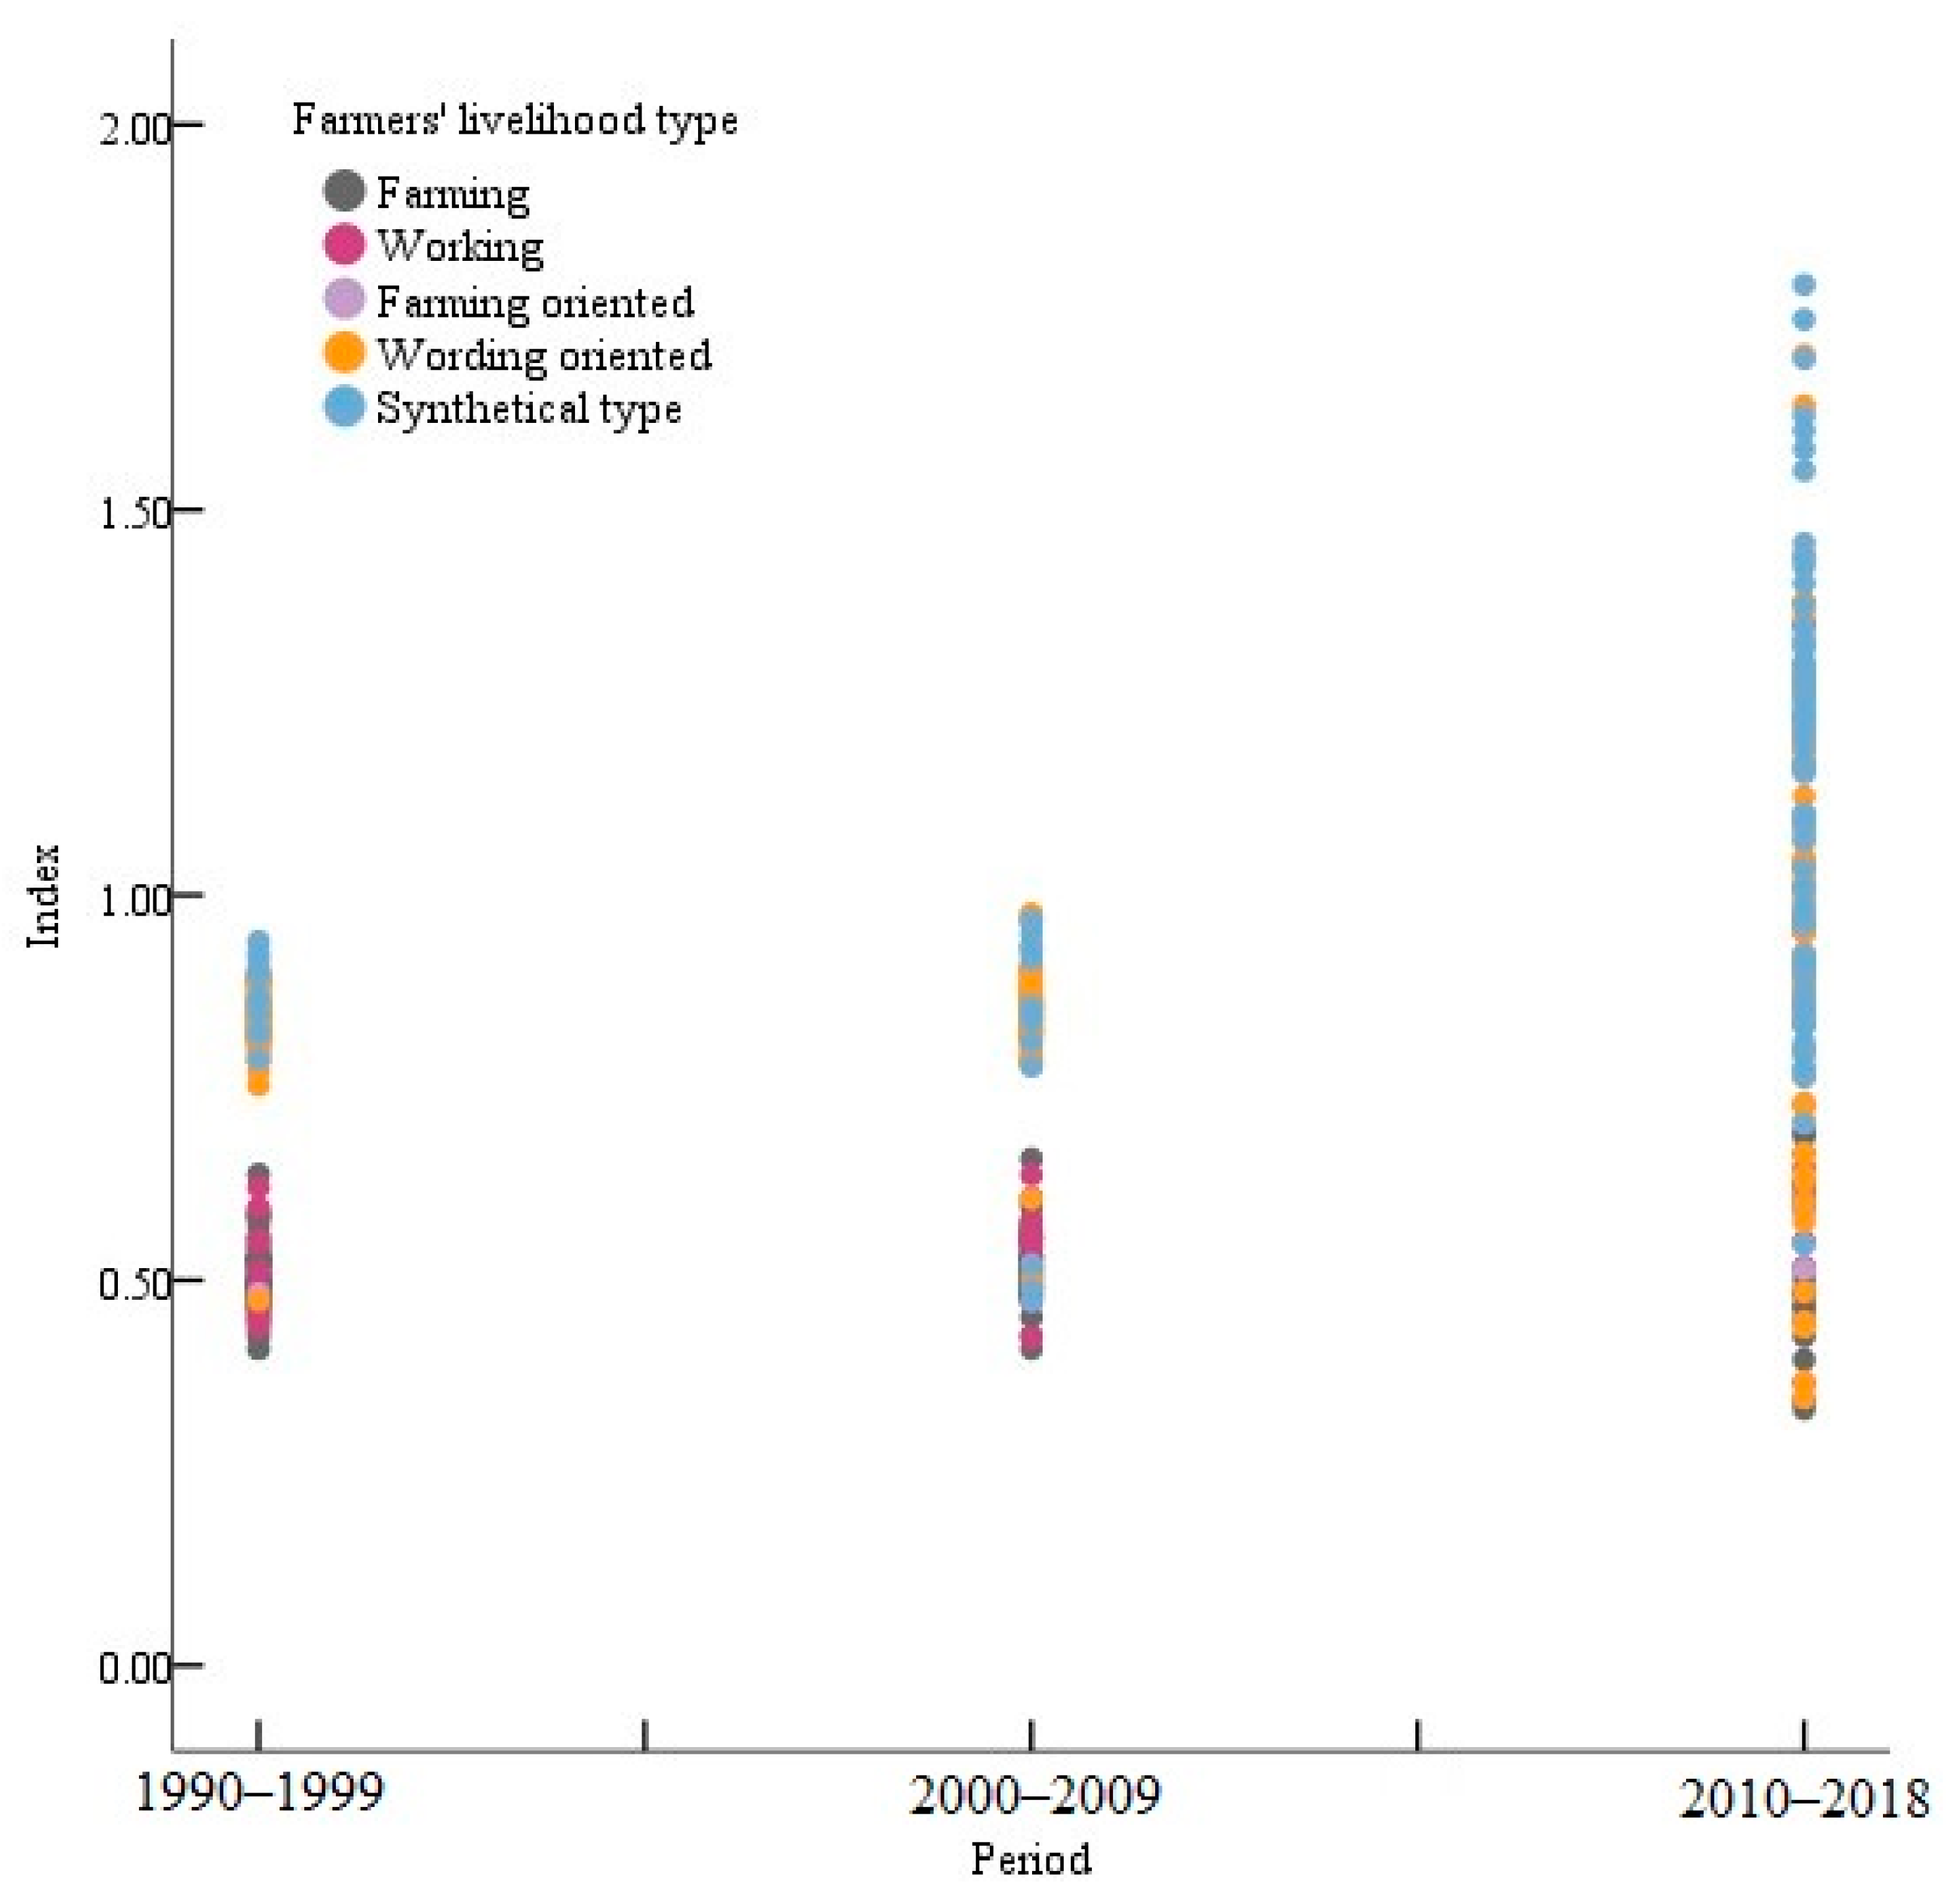
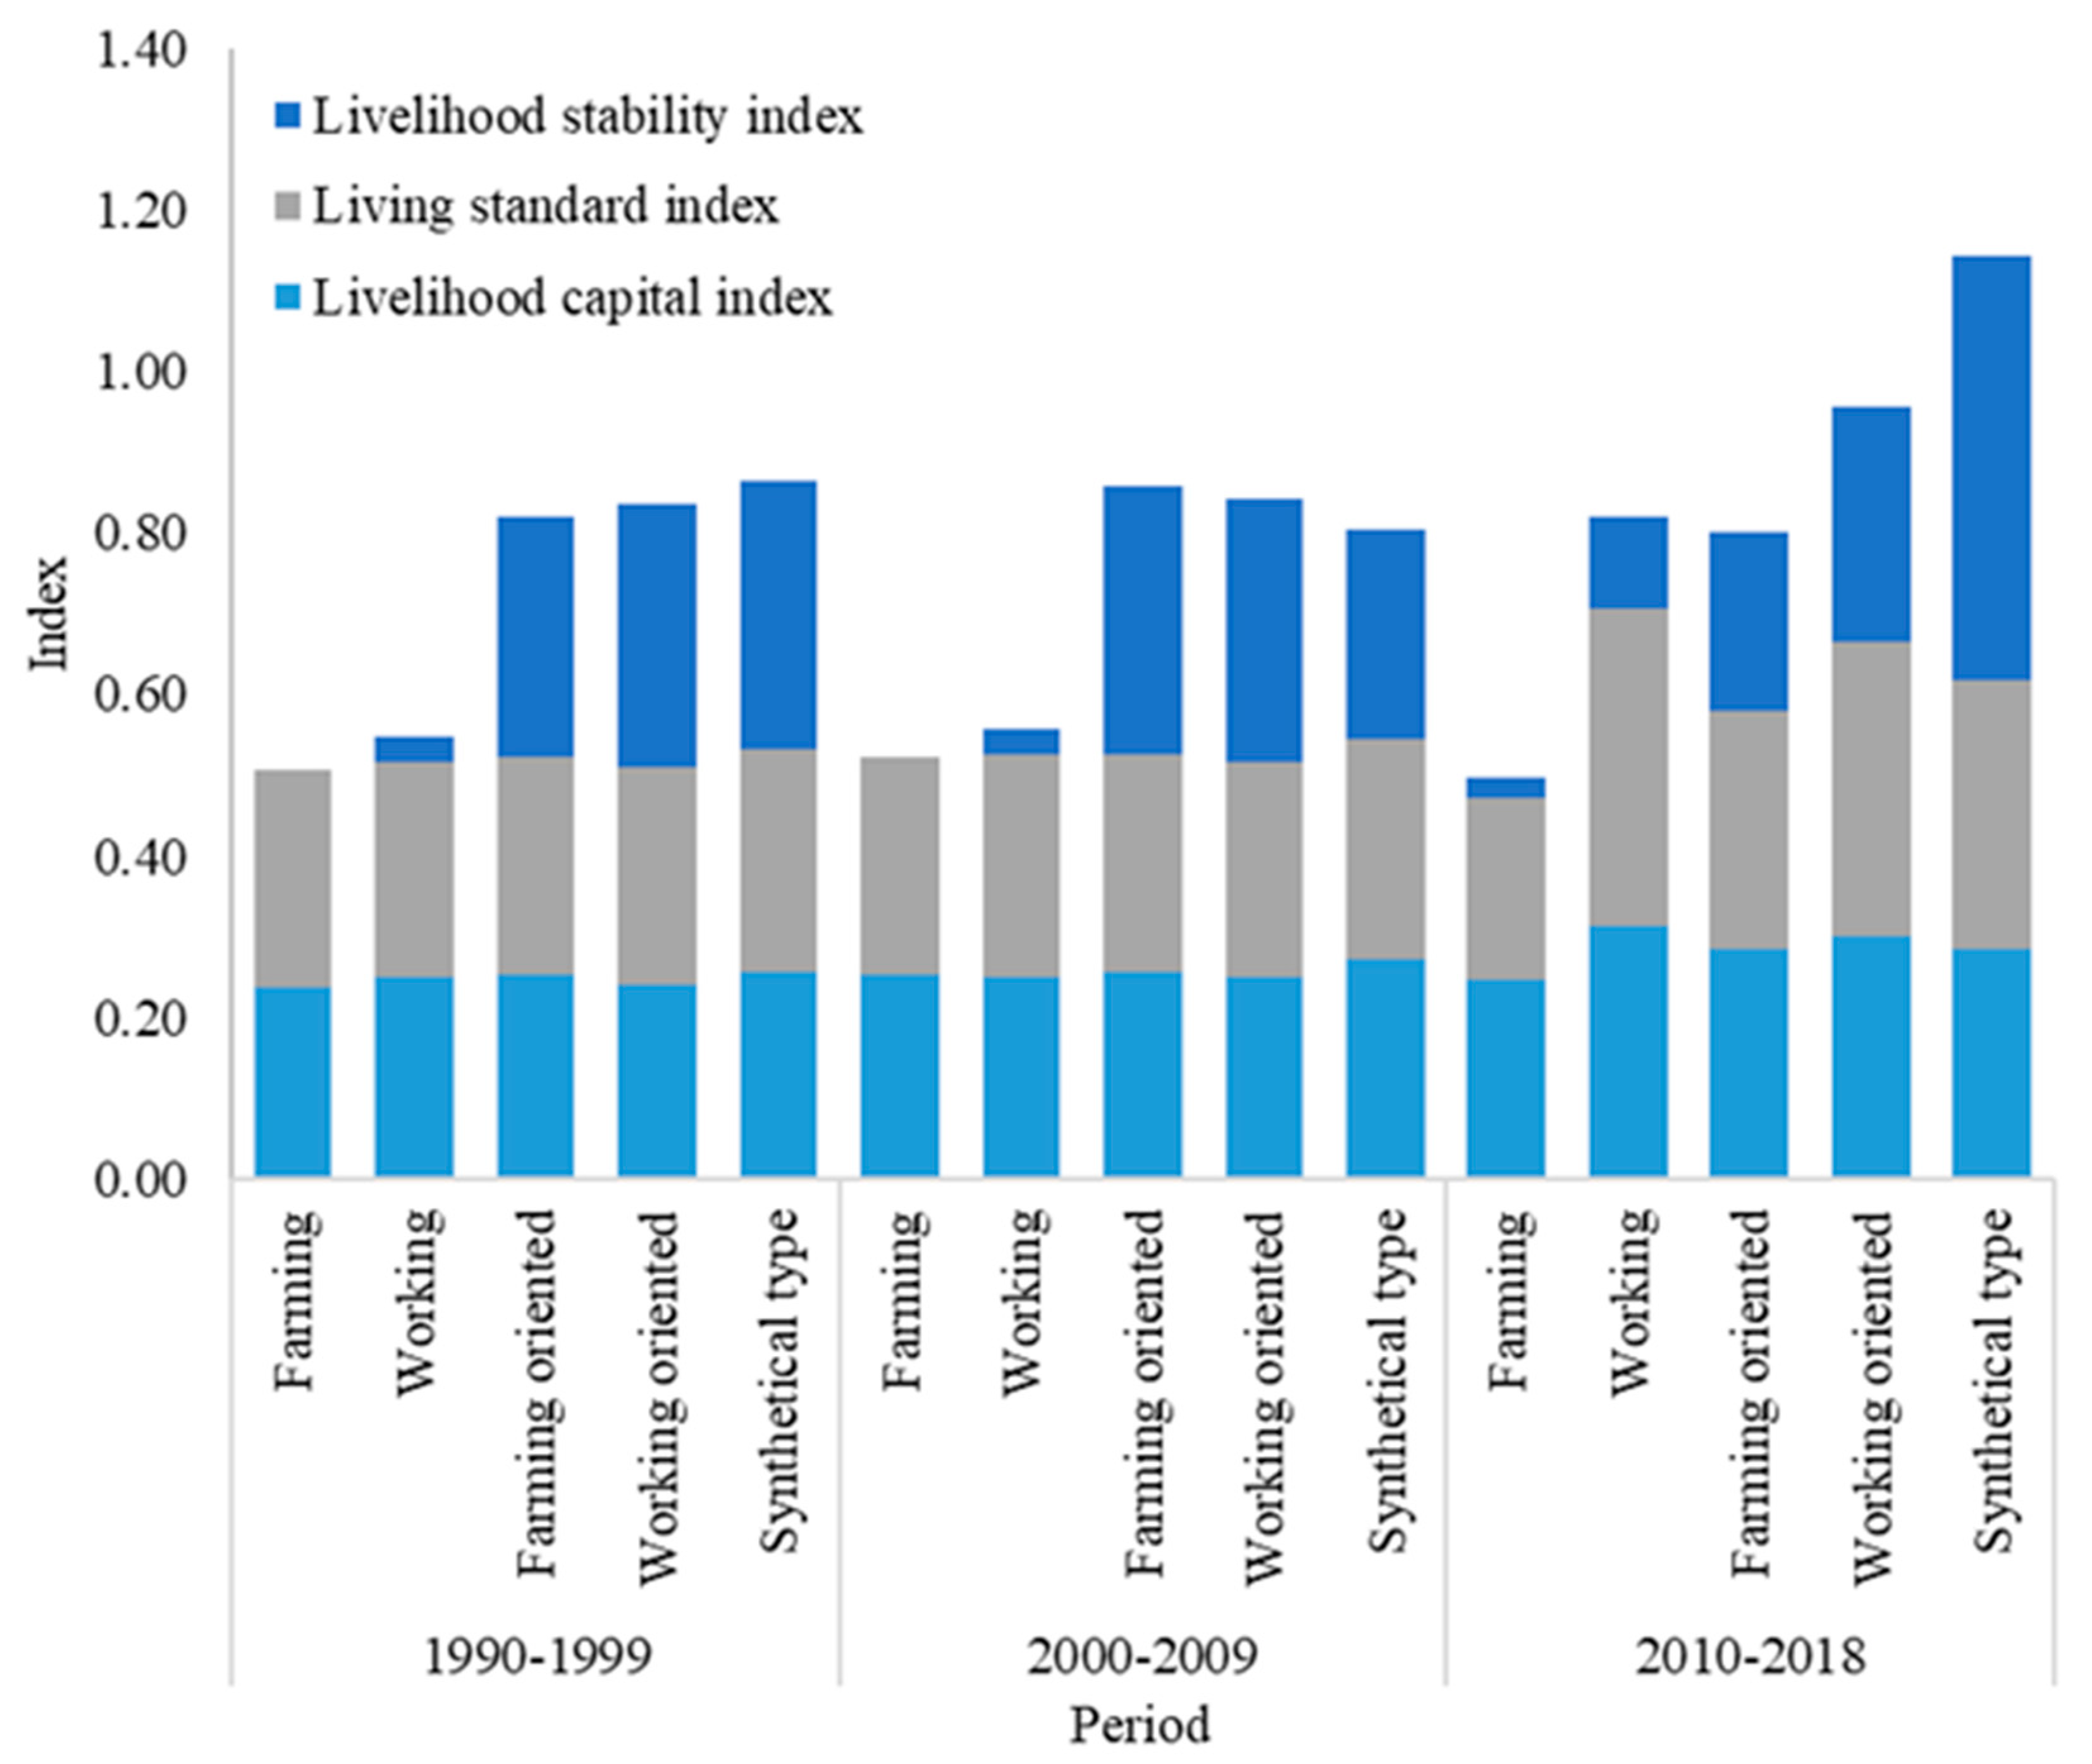
3.2. Adaptation of Farmers’ Livelihood Transformation

Equations (6) and (7) were applied to calculate the adaptation index of farmers’ livelihood transformation. The adaptation index of farmers’ livelihood transformation showed an increasing trend from 1990 to 2018 (Figure 3). From 1990 to 2009, two types of livelihood transformation, working oriented and synthetical type, had a high and concentrated adaptation of livelihood transformation, while the farming, the working, and the farming oriented had low and concentrated adaptation. From 2010 to 2018, the distribution of the adaptation index of farmers’ livelihood transformation was more decentralized, dominated by synthetical type and working oriented, and the adaptation index of farmers’ livelihood transformation of synthetical type was higher than that of working oriented.
From 1990 to 2009, the differences in the living standard index and the livelihood capital index of different transformation types of farmers were small, while the differences in the livelihood stability index were large (Figure 4). In particular, the living stability index of the farming oriented, the working oriented, and the synthetical type was significantly higher than that of the farming and the working, which was the reason that the adaptation index of livelihood transformation of the farming oriented and synthetical type was high and concentrated (Figure 3). The livelihood stability index of the synthetical type was the highest from 2010 to 2018, which was the most important reason why the adaptation index of farmers’ livelihood transformation of the synthetical type was higher than that of working oriented (Figure 3). At the same time, synthetical type and working oriented had significantly higher livelihood stability indexes than other types, and the living standard index was higher than the farming and the farming oriented. The synthetical type had the highest adaptation index. This result is consistent with the research results of Yin’s research [49], indicating that diversified farmers’ livelihoods have higher adaptability or adaptability.

3.3. Analysis of Influencing Factors

3.3.1. Influencing Factors of the Type of Farmers’ Livelihood Transformation

Multiple logistic regression analysis was used to investigate the influence of livelihood capital indicators on the type of farmers’ livelihood transformation. The livelihood capital indicators were introduced into the multivariate logistic regression model as independent variables, and three models were constructed according to the period, with “Synthetical type” as the reference level of the model. The significance levels of the likelihood ratio tests of the three models (Sig.) were 0.029, 0.000, and 0.000, which were all less than 0.05, and the models were statistically significant. The specific analysis results are shown in Table 3.
(1) Physical capital. From 1990 to 2018, the housing area in the physical capital had a significant effect on the type of farmers’ livelihood transformation, but the effect varied in different periods. From 1990 to 1999, the larger the housing area, the greater the possibility that the farmer took working as a way of livelihood. During this period, the income from farming was extremely low, and most farmers could only rely on working to increase their income to improve the material base of their households, which was conducive to increasing the size of the housing area. From 2000 to 2009, the larger the housing area, the smaller the possibility that the farmer was the farming or the working oriented type of farmers’ livelihood transformation, and the larger the possibility that the farmer was the synthetic type. Based on increasing household income through working, farmers gradually tried more non-farm livelihoods during this period, while diversified livelihood could effectively increase household income. Therefore, farmers did not only rely on farming and working, but also tried diversified livelihoods such as business to increase the household’s physical capital, which contributed to the increase in the housing area. From 2010 to 2018, the larger the housing area, the greater the possibility that farmers would rely on farming as a means of livelihood. Traditional agriculture in this period gradually began to transform from traditional agricultural cultivation to facility agriculture, which had higher economic efficiency and could increase income, contributing to the increase in household physical capital. At the same time, the richer the household’s physical assets, the greater the possibility that the household was the farming type of livelihood transformation. However, in the research results of Yin [49], farmers with richer material assets tended to choose diversified livelihood methods, which differed from this study. The reason for the differences was that different types of case areas in the Qinling Mountains and arid oases led to differences in the livelihood methods of farmers. Working income was still the main source of household income, and working could effectively improve household physical conditions.
(2) Social capital. During 1990–1999 and 2010–2018, the social network in the social capital had a significant impact on the types of farmers’ livelihood transformation. With the richer social network, the possibility that farmers chose a working or working-oriented livelihood was lower, and the probability that farmers experienced the synthetical type of livelihood transformation was higher. This result is consistent with Yin’s [49,50], as the richer the social network, the more diversified the livelihoods of farmers tend to be. The questionnaires and interviews revealed that the richer the social network of farmers, the more information resources they had access to. They no longer chose a single working or working-oriented livelihood, but preferred a synthetical livelihood because they diversified their livelihoods using information resources. From 2000 to 2009, with more assistant opportunities for farmers, the probability that they would have a farming or a farming-oriented livelihood was higher. As the cost of pesticides and fertilizers gradually increased compared with the 1990s, farmers had to draw on the social capital they owned to invest in agricultural production through loans.
(3) Financial capital. Income status and wealth gaps in financial capital had a significant impact on the types of farmers’ livelihood transformation. During 2000–2009, farmers with higher incomes were less likely to choose a working livelihood, but more likely to choose a synthetical livelihood. The investigation found that farm households with better income status had a greater possibility to choose diversified livelihood behaviors because their sources of income were diverse. This result was similar to existing studies [37,39], where income affected changes in farmers’ livelihood patterns. From 2010 to 2018, farmers were less likely to choose the farming oriented livelihood, but more likely the working-oriented type when the wealth gap was wider. Income from farming was much higher than working, and working was an important form of livelihood for increasing income, as well as increasing the wealth gap. A working-oriented livelihood was effective in raising household incomes while ensuring basic food needs through farming at the same time.
(4) Human capital. Household workforce, health status, and policy awareness in human capital had a great impact on the type of farmers’ livelihood transformation. From 2000 to 2009, the larger the household workforce, the probability that the farmer fit the farming or the working-oriented type of farmer’s livelihood transformation was larger. During this period, farming was still traditional farming, which required a large amount of labor. When households had surplus labor, they mainly invested in working. This result was similar to the research findings of Jiang [38], where labor had a significant impact on the livelihood transformation of farmers. Since the income generated by working was much higher than farming, farmers fit the working-oriented type of livelihood transformation. When their health status was better, the possibility that farmers fit the farming-oriented type of livelihood transformation was lower, and the probability that farmers fit the synthetical type of livelihood transformation was higher. Better health status indicated that the number of people with disabilities in the household was low, which was conducive to farming, working, and other livelihood activities. Therefore, to increase income, farmers tended to diversify and integrated livelihoods. From 2010 to 2018, the higher level of policy awareness, the lower possibility that farmers chose to farm, and the higher probability that they had synthetical and diverse types of livelihood transformation. The investigation found that farmers with a more detailed awareness of the policy would take advantage of the favorable conditions of the policy to diversify their livelihoods, such as planting facility-based agriculture, rather than engaging in traditional farming or working.
(5) Natural capital. From 2010 to 2018, the actual cultivated area in natural capital had a significant effect on the type of farmers’ livelihood transformation. The larger the actual cultivation area, the lower the possibility that farmers took working as their livelihood, and the higher the probability that they chose diversified and synthetical livelihoods. This result was similar to Chen’s [35], Not only in terms of actual cultivation area, but also in terms of the transformation of farmland utilization, which was an important factor affecting the livelihood transformation of farmers. The survey found that the larger actual cultivated area indicated that farmers’ livelihoods were still dependent on farming, but it was difficult to maintain their livelihoods by relying only on the income from farming. As a result, they preferred to diversify their livelihoods to increase their incomes.
To summarize, livelihood capital differentiation led to differences in the livelihood of farmers and affected the type of farmers’ livelihood transformation. The impact of livelihood capital on the types of farmers’ livelihood transformation was greater in 2000–2009 and 2010–2018. Farmers with richer physical and human capital were significantly different in the tendency to choose their way of livelihood in different periods. Farmers with richer social networks tended to choose integrated and diversified livelihood options. The richer the financial and natural capital, the greater probability of farmers choosing non-farming livelihood options.

3.3.2. Obstacle Factors to the Adaptation of Farmers’ Livelihood Transformation

According to Equations (8) and (9) of the obstacle model, the obstacles to the adaptation of farmers’ livelihood transformation in Shangzhou District in different periods were calculated. To highlight the key factors, and refer to the existing studies [27,28,29], this research listed the top five indicators with the highest degree of obstacles to the adaptation of farmers’ livelihood transformation in each period (Table 4). The main obstacles to the adaptation of farmers’ livelihood transformation in Shangzhou District from 1990 to 2018 included: the leadership potential and social networks of the social capital, the livestock of the physical capital, the income status of the financial capital, and the actual cultivation area of the natural capital. From the perspective of the time evolutionary process, the obstacle factors for the adaptation of farmers’ livelihood transformation in different periods were consistent, which showed that leadership potential and social networks of social capital, livestock, income, and cultivated land status were the key variables that had been influencing the adaptation of farmers’ livelihood transformation in Shangzhou District since 1990.
From 1990 to 2018, the obstacle degree of income status was gradually decreasing, while the obstacle degree of leadership potential, livestock, social networks, and the actual cultivated area was gradually increasing. From 1990 to 2018, with the growth of farmers’ incomes, the financial capital, the standard of living, and the adaptation of farmers’ livelihood transformation increased. Therefore, the impact of the obstacles of income status on the adaptation of farmers’ livelihood transformation gradually decreased. However, social capital such as leadership potential and social networks did not improve significantly. The assistance and resources farmers obtained from their networks were limited, which was not conducive to the enhancement of farmers’ livelihood capital and the adaptation of livelihood transformation. Physical and natural capital, such as livestock and actual cultivated area, directly affected the agricultural income of farming households. Since 1990, due to the implementation of ecological protection policies, such as Grain for Green, the actual cultivated area of farming households had been small, leading to low agricultural income, which in turn affected the enhancement of livelihood capitals and the adaptation of livelihoods.

3.4. Policy Implications

Through the above analyses, based on the reality of the lack of arable land resources and the contradiction of ecological protection in the Qinling mountainous region of China, the following three aspects were suggested to improve the adaptation of farmers’ livelihood transformation. ① Strengthen the promotion of modern agricultural cash crop cultivation. This suggestion is consistent with Yin’s research [41]. Although in different types of case areas, the transformation from traditional agriculture to modern agriculture is an inevitable trend for sustainable rural development in the future. It ought to improve the economic benefits of arable land output and promote the development of modern facility-based agriculture [23], such as greenhouse vegetables and edible fungi cultivation. It should transform the previous single traditional agricultural planting into diversified modern agricultural planting, and promote the improvement of farmers’ livelihood economic capital. ② Further improve the economic benefits of Grain for Green. Based on previous studies, the Grain for Green improved the ecological quality of the region and had a certain lagging effect on promoting local economic development [51]. Therefore, it is necessary to further improve the economic benefits of Grain for Green. It can provide technical guidance to farmers who have planted walnuts to reduce the impact of natural disasters on walnuts as much as possible. At the same time, it ought to establish fixed purchase enterprises and platforms, set a minimum purchase price, and help farmers solve market problems, which is to change the low economic benefits of walnuts. ③ Strengthen training on working skills. This is consistent with the recommendations of the existing research [52]. To meet the needs of the labor market, such as the basic requirements of enterprises for labor [52], it should improve farmers’ working skills through technical training and promote diversified choices for farmers’ livelihood transformation.

4. Conclusions

Previous studies on livelihood transformation have lacked exploration from the adaptive process to the adaptive outcomes, especially with adaptation as the theoretical basis. This research theoretically provided a new research perspective on farmers’ livelihood transformation. The process of rural transformation, the response of farmers’ livelihood transformation, and the results of livelihood transformation also provided a theoretical analysis approach for the study of livelihood adaptation. In addition, the Shangzhou District in the Qinling Mountains, one of the concentrated and contiguous poverty-stricken mountainous areas in China, was selected as the case area. It is greatly affected by China’s poverty-reduction policies and rural transformation, and the process of farmers’ livelihood transformation was obvious, with typical representativeness. At the same time, it also enriched the research cases of global poverty-stricken mountainous areas.
This research summarized the rural transformation process and its response to farmers’ livelihood in the Shangzhou District of the Qinling Mountains in China from 1990 to 2018, which was conducive to the understanding of the livelihood transformation process from a micro perspective. Based on constructing an evaluation system of adaptation of farmers’ livelihood transformation, the research quantified it and analyzed the evolutionary characteristics of different types of farmers’ livelihood transformation. Meanwhile, the obstacle model and multiple logistic regression were used to, respectively, identify the factors influencing the adaptation and the types of farmers’ livelihood transformation. The results of this study contributed to optimizing the sustainable farmers’ livelihood strategies in the Qinling Mountains of China, as well as providing a case study reference for farmers’ livelihood transformation in underdeveloped mountainous areas around the world.
The results of this research showed that the farmers’ livelihood transformation experienced a change from the farming + the working oriented to the synthetical type + the working oriented. During 1990–2018, the adaptation index of farmers’ livelihood transformation showed a growing trend. From 1990 to 2009, the adaptation index of the working oriented and the synthetical type was high and concentrated. From 2010 to 2018, the distribution of the adaptation index of farmers’ livelihood transformation was dispersed.
Diversification of farmers’ livelihood capital led to differences in the way of farmers’ livelihood transformation and affected the adaptation of it. Farmers with richer social networks tended to choose synthetical and diversified livelihoods. The richer the financial and natural capital, the greater the probability that farmers chose non-farm livelihoods. Leadership potential, social networks, livestock, income status, and actual cultivated area were the key variables that had been influencing the adaptation of farmers’ livelihood transformation in the Shangzhou district since 1990. Based on the results, we suggested improving the adaptation of livelihood transformation by strengthening the promotion of modern agricultural cultivation, improving the economic benefits of Grain for Green, and strengthening the training of working skills to promote the sustainable development of farmers’ livelihoods.
This research mainly explored the characteristics and influencing factors of the adaptation of farmers’ livelihood transformation from the perspective of time changes, lacking analysis of spatial differentiation patterns and their influencing factors. In future research, its characteristics and influencing factors can be explored from a geographical spatial perspective, which is conducive to a deeper understanding of the impact mechanism of farmers’ livelihood transformation adaptation.

Author Contributions

S.Y.: Survey, writing original draft and funding acquisition.; X.Y.: Conceptualization, review, and supervision. J.C.: Conceptualization, review, and editing. All authors have read and agreed to the published version of the manuscript.

Funding

This research was funded by National Natural Science Foundation of China, grant number 42201222, 2023 Shaanxi Provincial Philosophy and Social Science Research Project (2023年度陕西省哲学社会科学研究专项), grant number 2023QN0102, and The Fund Program of The Youth Innovation Team of Shaanxi Universities, grant number The Youth Innovation Team of Digital Village Development in Western China.

Institutional Review Board Statement

Not applicable.

Informed Consent Statement

Not applicable.

Data Availability Statement

Not applicable.

Conflicts of Interest

The authors declare no conflict of interest.

References

  1. He, Y.; Hu, Y.; Song, J.; Jing, X. Variation of runoff between southern and northern China and their attribution in the Qinling Mountains, China. Ecol. Eng. 2021, 171, 106374. [Google Scholar] [CrossRef]
  2. Zhang, H.; Guo, Y.; Gao, B. Multi-model Suitability Assessment of Construction Land in Tsinling Mountains Based on the Niche Theory: A Case Study of Shangzhou, Shangluo. Geogr. Geo-Inf. Sci. 2016, 32, 83–89. (In Chinese) [Google Scholar]
  3. Ma, C.; Wang, X.; Yuan, X.; Xu, H.; Ren, Z.; Wei, X. The evolution of social space in mountainous rural areas: A case study of three counties in Qinling Mountains area, Shaanxi. J. Nat. Resour. 2021, 36, 2557–2570. (In Chinese) [Google Scholar] [CrossRef]
  4. Kates, R.W.; Clark, W.C.; Corell, R.; Hall, J.M.; Jaeger, C.C.; Lowe, L.; McCarthy, J.J.; Schellnhuber, H.J.; Bolin, B.; Dickson, N.M.; et al. Environment and development: Sustainability science. Science 2001, 292, 641–642. [Google Scholar] [CrossRef] [PubMed]
  5. Below, T.B.; Mutabazi, K.D.; Kirschke, D.; Franke, C.; Sieber, S.; Siebert, R.; Tscherning, K. Can farmers’ adaptation to climate change be explained by socio-economic household-level variables. Glob. Environ. Chang. 2012, 22, 223–235. [Google Scholar] [CrossRef]
  6. Chen, J.; Yin, S.; Gebhardt, H.; Yang, X. Farmers’ livelihood adaptation to environmental change in an arid region: A case study of the Minqin Oasis, northwestern China. Ecol. Indic. 2018, 93, 411–423. [Google Scholar] [CrossRef]
  7. Dovie, D.B.K.; Pabi, O. Partial climatic risk screening, adaptation and livelihoods in a coastal urban area in Ghana. Habitat Int. 2023, 138, 102868. [Google Scholar] [CrossRef]
  8. Wichern, J.; Descheemaeker, K.; Giller, K.E.; Ebanyat, P.; Taulya, G.; Wijk, M.T. Vulnerability and adaptation options to climate change for rural livelihoods—A country-wide analysis for Uganda. Agric. Syst. 2019, 176, 102663. [Google Scholar] [CrossRef]
  9. Kuang, F.; Jin, J.; He, R.; Wan, X.; Ning, J. Influence of livelihood capital on adaptation strategies: Evidence from rural households in Wushen Banner, China. Land Use Policy 2019, 89, 104228. [Google Scholar] [CrossRef]
  10. Ankrah, D.A.; Anum, R.; Anaglo, J.N.; Boateng, S.D. Influence of sustainable livelihood capital on climate variability adaptation strategies. Environ. Sustain. Indic. 2023, 18, 100233. [Google Scholar] [CrossRef]
  11. Kuang, F.; Jin, J.; He, R.; Ning, J.; Wan, X. Farmers’ livelihood risks, livelihood assets and adaptation strategies in Rugao City, China. J. Environ. Manag. 2020, 264, 110463. [Google Scholar] [CrossRef] [PubMed]
  12. Zeng, X.; Guo, S.; Deng, X.; Zhou, W.; Xu, D. Livelihood risk and adaptation strategies of farmers in earthquake hazard threatened areas: Evidence from Sichuan province, China. Int. J. Disaster Risk Reduct. 2020, 53, 101971. [Google Scholar] [CrossRef]
  13. Mihiretu, A.; Okoyo, E.N.; Lemma, T. Climate variability trends-community perspective-livelihood adaptation strategy nexus in the arid-tropics, Ethiopia. J. Arid. Environ. 2023, 210, 104929. [Google Scholar] [CrossRef]
  14. Ichinose, Y.; Higuchi, H.; Kubo, R.; Nishigaki, T.; Kilasara, M.; Shinjo, H.; Funakawa, S. Adaptation of farmland management strategies to maintain livelihood by the Chagga people in the Kilimanjaro highlands. Agric. Syst. 2020, 181, 102829. [Google Scholar] [CrossRef]
  15. Williams, L.J.; Wensveen, M.; Dahlanuddin; Grünbühel, C.M.; Puspadi, K. Adoption as adaptation: Household decision making and changing rural livelihoods in Lombok, Indonesia. J. Rural. Stud. 2022, 89, 328–336. [Google Scholar] [CrossRef]
  16. Makwinja, R.; Kaunda, E.; Mengistou, S.; Alemiew, T.; Njaya, F.; Kosamu, I.B.M.; Kaonga, C.C. Lake Malombe fishing communities’ livelihood, vulnerability, and adaptation strategies. Curr. Res. Environ. Sustain. 2021, 3, 100055. [Google Scholar] [CrossRef]
  17. Kulsum, U.; Timmermans, J.; Haasnoot, M.; Khan, M.S.A.; Thissen, W. Why uncertainty in community livelihood adaptation is important for adaptive delta management: A case study in polders of Southwest Bangladesh. Environ. Sci. Policy 2021, 119, 54–65. [Google Scholar] [CrossRef]
  18. Fang, Y.P.; Zhu, R.; Zhang, C.J.; Rasul, G.; Neupane, N. Cascading Adaptation of Rural Livelihood to Changing Environment: Conceptual Framework and Experiment from the Koshi River Basin. Adv. Clim. Chang. Res. 2020, 11, 141–157. [Google Scholar] [CrossRef]
  19. Pandey, V.P.; Babel, M.S.; Shrestha, S.; Kazama, F. A framework to assess adaptive capacity of the water resources system in Nepalese River basins. Ecol. Indic. 2011, 11, 480–488. [Google Scholar] [CrossRef]
  20. Villiers, A.C.; Esler, K.J.; Knight, A.T. Social processes promoting the adaptive capacity of rangeland managers to achieve resilience in the Karoo, South Africa. J. Environ. Manag. 2014, 146, 276–283. [Google Scholar] [CrossRef]
  21. Thathsarani, U.S.; Gunaratne, L.H.P. Constructing and Index to Measure the Adaptive Capacity to Climate Change in Sri Lanka. Procedia Eng. 2018, 212, 278–285. [Google Scholar] [CrossRef]
  22. Murthy, C.S.; Laxman, B.; Sai, M.V.R.S. Geospatial analysis of agricultural drought vulnerability using a composite index based on exposure, sensitivity and adaptive capacity. Int. J. Disaster Risk Reduct. 2015, 12, 163–171. [Google Scholar] [CrossRef]
  23. Yin, S.; Yang, X.; Chen, J. Progress of research on adaptation of human-environment systems: Concepts, theoretical frameworks, and methods. Prog. Geogr. 2021, 40, 330–342. (In Chinese) [Google Scholar] [CrossRef]
  24. Acosta, L.; Klein, R.J.; Reidsma, P.; Metzger, M.J.; Rounsevell, M.D.; Leemans, R.; Schröter, D. A spatially explicit scenario-driven model of adaptive capacity to global change in Europe. Glob. Environ. Chang. 2013, 23, 1211–1224. [Google Scholar] [CrossRef]
  25. Clarvis, M.H.; Allan, A. Adaptive capacity in a Chilean context: A questionable model for Latin America. Environ. Sci. Policy 2014, 43, 78–90. [Google Scholar] [CrossRef]
  26. Long, H.; Zou, J.; Pykett, J.; Li, Y. Analysis of rural transformation development in China since the turn of the new millennium. Appl. Geogr. 2011, 31, 1094–1105. [Google Scholar] [CrossRef]
  27. Mitchell, C.J.A. Creative destruction or creative enhancement? Understanding the transformation of rural spaces. J. Rural. Stud. 2013, 32, 375–387. [Google Scholar] [CrossRef]
  28. Wang, Y.; Liu, Y.; Li, Y. The spatio-temporal patterns of urban–rural development transformation in China since 1990. Habitat Int. 2016, 53, 178–187. [Google Scholar] [CrossRef]
  29. Parsons, M.; Nalau, J. Historical analogies as tools in understanding transformation. Glob. Environ. Chang. 2016, 38, 82–96. [Google Scholar] [CrossRef]
  30. Liu, J.; Liu, Y.; Yan, M. Spatial and temporal change in urban-rural land use transformation at village scale: A case study of Xuanhua district, North China. J. Rural. Stud. 2016, 47, 425–434. [Google Scholar] [CrossRef]
  31. Gibson, K.; Cahill, A.; Mckay, D. Rethinking the dynamics of rural transformation: Performing different development pathways in a Philippine municipality. Trans. Inst. Br. Geogr. 2010, 35, 237–255. [Google Scholar] [CrossRef]
  32. Tang, Q.; Bennett, S.J.; Xu, Y.; Li, Y. Agricultural practices and sustainable livelihoods: Rural transformation within the Loess Plateau, China. Appl. Geogr. 2013, 41, 15–23. [Google Scholar] [CrossRef]
  33. Wang, D.; Wang, X.; Hao, H.; Lin, D.; Xiao, R. Research progress on farmers’ livelihood transformation and its ecological effects—A review. J. Resour. Ecol. 2022, 13, 912–924. [Google Scholar]
  34. Korah, P.I.; Nunbogu, A.M.; Akanbang, B.A.A. Spatio-temporal dynamics and livelihoods transformation in Wa, Ghana. Land Use Policy 2018, 77, 174–185. [Google Scholar] [CrossRef]
  35. Chen, K.; Wang, Y.; Li, N.; Xu, Y.; Zheng, Y.; Zhan, X.; Li, Q. The impact of farmland use transition on rural livelihood transformation in China. Habitat Int. 2023, 135, 102784. [Google Scholar] [CrossRef]
  36. Diao, X.; Magalhaes, E.; Silver, J. Cities and rural transformation: A spatial analysis of rural livelihoods in Ghana. World Dev. 2019, 121, 141–157. [Google Scholar] [CrossRef]
  37. Cely-Santos, M.; Hernández-Manrique, O.L. Fighting change: Interactive pressures, gender, and livelihood transformations in a contested region of the Colombian Caribbean. Geoforum 2021, 125, 9–24. [Google Scholar] [CrossRef]
  38. Jiang, X.; Yin, G.; Lou, Y.; Xie, S.; Wei, W. The Impact of Transformation of Farmers’ Livelihood on the Increasing Labor Costs of Grain Plantation in China. Sustainability 2021, 13, 11637. [Google Scholar] [CrossRef]
  39. Escarcha, J.F.; Lassa, J.A.; Palacpac, E.P.; Zander, K.K. Livelihoods transformation and climate change adaptation: The case of smallholder water buffalo farmers in the Philippines. Environ. Dev. 2020, 33, 100468. [Google Scholar] [CrossRef]
  40. Schumpeter, P. Capitalism, Socialism and Democracy; Harper and Row: New York, NY, USA, 1950. [Google Scholar]
  41. Yin, S. Adaptation of rural areas under drought stress: Based on a survey of peasant household in the Minqin Oasis. Master’s Thesis, Northwest University, Xi’an, China, 2017. (In Chinese). [Google Scholar]
  42. Tohidimoghadam, A.; PourSaeed, A.; Bijani, M.; Samani, R.E. Towards farmers’ livelihood resilience to climate change in Iran: A systematic review. Environ. Sustain. Indic. 2023, 19, 100266. [Google Scholar] [CrossRef]
  43. Li, L.; Jin, J.; Zhang, C.; Qiu, X.; Liu, D. How do livelihood capital affect farmers’ energy-saving behaviors: Evidence from China. J. Clean. Prod. 2023, 414, 137769. [Google Scholar] [CrossRef]
  44. Yang, Y.; Yuan, X.; Ma, C.; Xu, H.; Ren, Z. Coupling coordination analysis of farmers′ livelihoods and rural development in the Qinling-Daba Mountains: A case study of Luonan County in Shaanxi Province. J. Ecol. Rural. Environ. 2021, 37, 448–455. (In Chinese) [Google Scholar]
  45. Xu, J.; Li, G.; Wang, Y. Review and prospect of resource-based city vulnerability in China and Abroad. Resour. Sci. 2015, 37, 1266–1278. (In Chinese) [Google Scholar]
  46. Zhu, L.; Mei, X.; Xiao, Z. The digital economy promotes rural revitalization: An empirical analysis of Xinjiang in China. Sustainability 2023, 15, 12278. [Google Scholar] [CrossRef]
  47. Wang, D.; Li, Y.; Zhang, Z.; Gao, S.; Zhou, Q.; Zhuo, Y.; Wen, X.; Guo, Z. Evaluating urban ecological civilization and its obstacle factors based on integrated model of PSR-EVW-TOPSIS: A case study of 13 cities in Jiangsu Province, China. Ecol. Indic. 2021, 133, 108431. [Google Scholar] [CrossRef]
  48. Wang, D.; Shen, Y.; Zhao, Y.; He, W.; Liu, X.; Qian, X.; Lv, T. Integrated assessment and obstacle factor diagnosis of China’s scientific coal production capacity based on the PSR sustainability framework. Resour. Policy 2020, 68, 101794. [Google Scholar] [CrossRef]
  49. Yin, S.; Chen, J.; Wu, K.; Yang, X. Adaptation of farming households under drought stress: Based on a survey in the Minqin Oasis. Prog. Geogr. 2016, 35, 644–654. (In Chinese) [Google Scholar]
  50. Yin, S.; Chen, J.; Yang, X. Adaptive behavior of farming household and influential mechanism in the background of social-ecological system reconstruction. Hum. Geogr. 2020, 35, 112–121. (In Chinese) [Google Scholar]
  51. Wang, K.; Sun, P.; Wang, X.; Mo, J.; Li, N.; Zhang, J. Impact of the Grain for Green Project on the well-being of farmer households: A case study of the mountainous areas of Northern Hebei Province, China. Land 2023, 12, 1257. [Google Scholar] [CrossRef]
  52. Duan, T.; Li, Y.; Wang, R.; Ren, L. Research on the ability to eliminate poverty from the rural female-headed households in poor mountainous areas in the perspective of precision poverty alleviation: Survey data based on farmers’ families in the Qinba Mountain area of Southern Shaanxi. J. Shaanxi Norm. Univ. (Philos. Soc. Sci. Ed.) 2020, 49, 40–53. (In Chinese) [Google Scholar]
Figure 1. Case areas and surveyed villages in Shangzhou District.
Sustainability 15 13004 g001
Figure 2. The transformation of farmers’ livelihood during 1990–2018 in Shangzhou District.
Sustainability 15 13004 g002
Figure 3. The adaptation index of farmers’ livelihood transformation during 1990–2018.
Sustainability 15 13004 g003
Figure 4. Three dimensions of the adaptation index of farmers’ livelihood transformation during 1990–2018.
Sustainability 15 13004 g004
Table 1. Evaluation index system of farmers’ livelihood capitals.
IndexDimensionIndicatorIndicator Description and DefinitionMean ValueStandard DeviationWeightAnticipated Impact
Livelihood capitalNatural capitalEcological governance areaPer capita area of Grain for Green0.0920.2830.060-
Actual cultivated areaPer capita actual cultivated area of households0.6980.7180.073+
Physical capitalHousing areaPer capita housing area of households28.10022.3680.071+
Household physical assetsNumber of daily durable consumer goods2.6391.6440.068+
LivestockNumber of livestock = cattle × 1.4 + donkey × 1.2 + sheep × 1 + pig × 0.8 + chicken × 0.67.68977.6400.102+
Financial capitalIncome statusThe proportion of total household cash income (including government subsidies) to the total family population4867.7307703.4900.091+
The gap between the rich and the poorFarmers′ perception of the degree of wealth gap within the village. 0 = none, 0.25 = very little, 0.5 = ordinary, 0.75 = much more, 1 = quite a lot0.5510.2880.067+
Human capitalHousehold workforceThe proportion of the number of family workers (aged 16–65) to the total population0.5510.2670.065+
Health statusProportion of the number of disabled people to the total family population0.2580.2960.065-
Policy awarenessThe degree of understanding of government policies and measures such as ecological governance and agricultural structural adjustment. 0 = none, 0.25 = very little, 0.5 = ordinary, 0.75 = much more, 1 = quite a lot0.4310.2410.067+
Social capitalSocial networkNumber of households receiving assistance10.89411.3780.075+
Leadership potentialNumber of village committee members in the family0.1240.4650.127+
Assistance opportunitiesNumber of borrowers and credit opportunities. Credit opportunities: 0 = no, 1 = yes4.0222.6280.070+
Table 2. Types of farmers’ livelihood transformation.
TypeDescription1990–19992000–20092010–2018
NumberProportionNumberProportionNumberProportion
FarmingChoosing only farming as a means of livelihood7645.5%5532.9%148.4%
WorkingChoosing only working as a means of livelihood116.6%116.6%127.2%
Farming orientedChoosing farming and working as livelihoods with more than 50% of income from farming95.4%42.4%63.6%
Working orientedChoosing farming and working as livelihoods with more than 50% of income from working6136.5%8349.7%6740.1%
Synthetical typeChoosing three or more livelihoods, including farming, working, and other ways.106.0%148.4%6840.7%
Table 3. The logistic analysis results of influencing factors of farmers’ livelihood type during 1990–2018.
PeriodFactorsFarmingWorkingFarming OrientedWorking Oriented
BExp (B)BExp (B)BExp (B)BExp (B)
1990–1999Housing area2.77015.95324.335 **3.702 × 10100.5455.3270.0751.078
Social network−3.0290.048−5.922 *0.0030.3260.042−3.963 *0.019
2000–2009Housing area−13.953 **8.714 × 10−752.4666.105 × 1022−69.4267.059 × 10−31−21.459 ***4.792 × 10⁻¹⁰
Income status−40.740 ***2.027 × 10−18236.8197.068 × 10102−36.2871.741 × 10−166.887979.701
Household workforce7.970 **2893.215−8.6080.000−6.7580.0017.621 *2041.158
Assistance opportunities4.976 *144.87111.723123,343.40815.862 **7,740,669.7523.72041.271
Health status−2.0920.123−3.7070.025−13.667 **1.160 × 10⁻⁶−2.6690.069
2010–2018Housing area9.251 ***10,417.4114.659105.570−3.2980.037−2.9770.051
Actual cultivated area−0.9120.402−55.143 ***1.126 × 10−244.610100.448−0.2090.811
Household physical assets−2.1980.11111.263 ***77,870.4402.75915.7791.0462.845
Policy awareness−0.4760.621−5.170 **0.0061.4524.272−0.8840.413
Social network3.27126.344−33.086 ***4.274 × 10−1511.43592,520.347−7.923 ***0.000
The gap between rich and poor−1.3440.261−1.1280.324−6.598 *0.0012.350 **10.489
Note: Due to using the “Synthetic type” livelihood type as the reference level for the model, this dependent variable is not present in the table. * is significant at the 0.1 level. ** is significant at the 0.05 level. *** is significantly at the 0.01 level.
Table 4. The obstacle factors of farmers’ livelihood adaptation in Shangzhou District.
PeriodTypeObstacle Ranking
12345
1990–1999Obstacle factorLeadership potentialLivestockIncome statusSocial networkActual cultivated area
Obstacle degree (%)16.2613.3011.798.678.60
2000–2009Obstacle factorLeadership potentialLivestockIncome statusSocial networkActual cultivated area
Obstacle degree (%)16.5013.5311.688.808.76
2010–2018Obstacle factorLeadership potentialLivestockIncome statusSocial networkActual cultivated area
Obstacle degree (%)17.0714.389.739.409.37
Disclaimer/Publisher’s Note: The statements, opinions and data contained in all publications are solely those of the individual author(s) and contributor(s) and not of MDPI and/or the editor(s). MDPI and/or the editor(s) disclaim responsibility for any injury to people or property resulting from any ideas, methods, instructions or products referred to in the content.

