Article

Dynamic Relationship between Agricultural Water Use and the Agricultural Economy in the Inner Mongolia Section of the Yellow River Basin

1
College of Geographical Science, Inner Mongolia Normal University, Hohhot 010022, China
2
Key Laboratory of Remote Sensing & Geography Information System, Hohhot 010022, China
3
River and Lake Protection Center, Ordos Water Conservancy Bureau, Ordos 017000, China
4
Institute of Water Resources, Inner Mongolia Academy of Water Resources, Hohhot 010010, China
*
Author to whom correspondence should be addressed.
Sustainability 2023, 15(17), 12979; https://doi.org/10.3390/su151712979
Submission received: 28 June 2023 / Revised: 23 August 2023 / Accepted: 25 August 2023 / Published: 28 August 2023

Abstract

:
Water is a crucial resource for agricultural development in the Yellow River Basin. However, the effects of water shortages on the region’s agricultural development are becoming increasingly evident, creating a need to examine the relationship between agricultural water use (AWU) and the agricultural economy. This study uses panel vector autoregression to analyze the relationship between AWU and the agricultural economy in the Inner Mongolia section of the Yellow River Basin from 1998 to 2018. The results indicate the following: (1) AWU in the Inner Mongolia section of the Yellow River Basin significantly declined during the study period, showing clear differences in the AWU’s effectiveness among regions; (2) agriculture in the region stabilized after significant growth, and the share of primary-sector industries in the national economy also stabilized after significant decline; (3) in the long run, AWU and the agricultural economy become cointegrated with the AWU Granger-causing agricultural economy. By deepening our understanding of agricultural water demand in the Yellow River Basin, these findings provide theoretical justification for establishing water-conserving irrigation systems and making sustainable use of water resources.

1. Introduction

Agricultural water, an important resource for agricultural economic development, directly affects the size of the agricultural economy which, in turn, affects the supply of strategic resources, including food [1,2]. Water scarcity in China’s major agricultural regions poses a serious threat to food security in China and beyond [3,4]. As one of China’s main food production areas, the Yellow River Basin, including its Inner Mongolia section, is critical to food security in northern China [5]. However, the Inner Mongolian section of the Yellow River Basin is located in an arid and semi-arid area with less than 300 mm of precipitation. It has a total area of 15.13 × 10⁴ km2 and a cultivated land area of 1.96 × 10⁴ km2. Surges in industrial and agricultural development and, consequently, residential water consumption have led to an increasingly acute imbalance between the water supply and demand [6,7]. In 2018, agricultural water use (AWU) in the Inner Mongolia section of the Yellow River Basin totaled 7.061 billion m3, accounting for approximately 78% of the total water consumption in the region. Gross agricultural output reached CNY 413.537 billion in 2018, up from CNY 101.229 billion in 1998, yielding an average annual growth rate of 7.3% [8]. Although the proportion of the agricultural economy in this area is relatively low, less than 20%, the agricultural population accounts for more than 60% of the total population. Because AWUAWU accounts for the largest proportion of regional water consumption, determining how to sustainably increase water-use efficiency while increasing agricultural output is key to addressing the region’s water shortages [8]. Thus, accurately characterizing the relationship between AWU and the agricultural economy in the Inner Mongolia section of the Yellow River Basin is an important first step toward developing an effective water resource policy for the region’s agriculture and ensuring harmonious and stable development of the region’s social economy.
Many studies have investigated the mutually constraining relationship between AWU and the agricultural economy. American economist William Nordhaus defined the difference between the growth rate of per capita output with and without resource constraints as “growth drag” [9]. Economist Paul Romer further developed this theory in 2001, noting that water constraints lead to a lower rate of industrial development than there would be without such constraints [10]. Drawing on these insights, researchers have used methods such as the Cobb–Douglas production function or the transcendental logarithmic production function to examine the differences between economic growth rates with and without resource constraints. Wang, for example, found that from 1997 to 2006, insufficient water supply in the Beijing–Tianjin–Hebei region reduced the growth rate of agricultural production [11]. Regarding the Yellow River Basin, Zhuo et al. estimated the quantity and value of blue water and green water consumed for crop production to analyze the relationship between agricultural water use and its value [12]. Yin et al. considered the combined pressure imposed by climate change and social and economic development and evaluated the impact of water resource shortages on food production [13]. Wang et al. noted that significantly reduced river flow had degraded local ecosystems, hindered economic development, and brought about water resource conflicts [14]. Investigating water resources in the Inner Mongolia section of the Yellow River Basin and corresponding water-scarcity countermeasures, Yang et al. proposed an open-source, cost-cutting solution that would integrate other regions’ economic development trends into a tailored, localized water-use plan [15].
The abovementioned studies largely focused on the unilateral changes in water resources or the agricultural economy, or the one-way influence of one side on the other side, and less attention was paid to the bidirectional influences between variables. The AWU–agricultural economy relationship in the Inner Mongolia section of the Yellow River Basin has not been studied. Some studies have suggested that there might be a bidirectional causal relationship between AWU and the agricultural economy [16]. Thus, analyzing the one-way influence alone might lead to discrepancies between the research results and the reality. Therefore, taking the Inner Mongolia section of the Yellow River Basin as the study area, we used a panel vector autoregression (PVAR) model to comprehensively explore the interaction between AWU and the agricultural economy, as quantified by the gross agricultural output.
The objectives of this study were (1) to calculate and quantify the change characteristics of the agricultural water use and agricultural economy in the Inner Mongolia section of the Yellow River Basin and the cities in this region and (2) to determine whether there is a long-term equilibrium relationship between agricultural water use and the agricultural economy, whether there is a mutual influence, and whether there is a two-way causal relationship.
The findings can provide theoretical justifications for sustainable water resource management and economic development in the investigated region.

2. Study Area, Data, and Methods

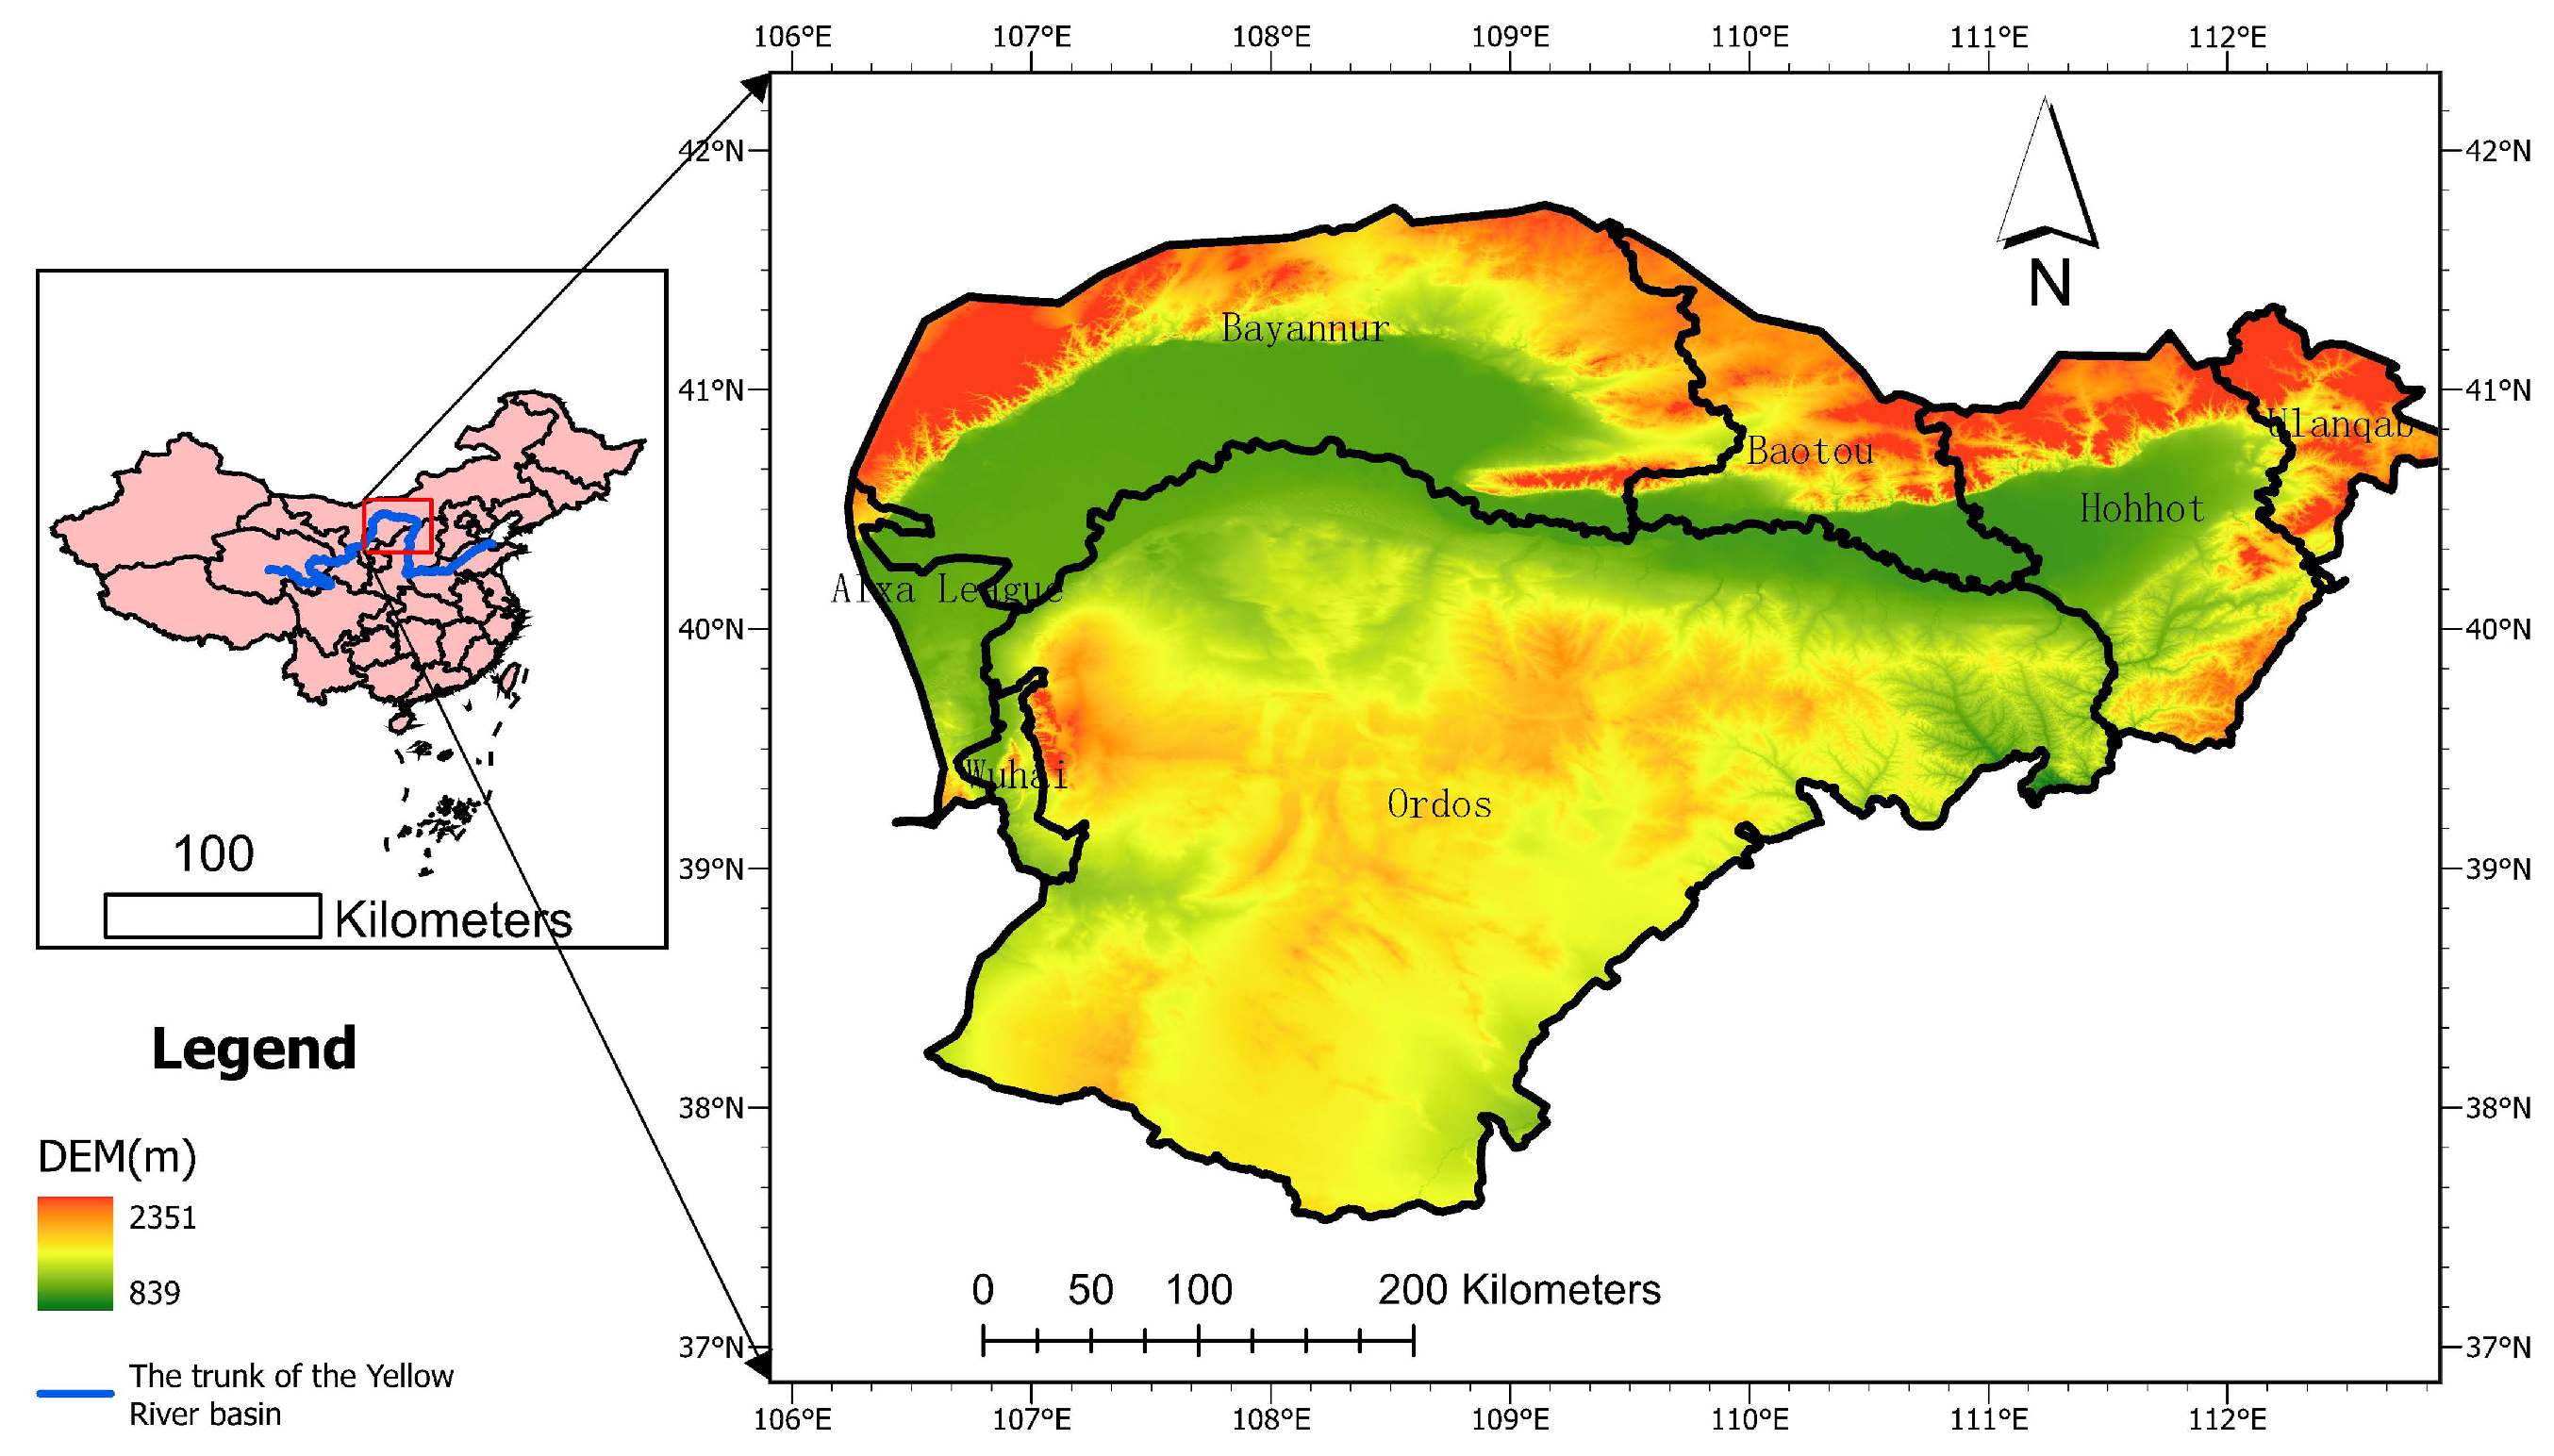
2.1. Study Area Overview

A total of 830 km of the Yellow River (total length: 5464 km) flows though the Inner Mongolia Autonomous Region (IMAR); 15.13 × 10⁴ km2 of the basin area, or 20.6% of the total Yellow River Basin, also lies within the IMAR. The elevation of the Inner Mongolia section of the Yellow River Basin is 799–2343 m, its geomorphology is complex, and its climate is arid and semi-arid, with an average annual precipitation of 297.25 mm and an average annual temperature of 6.63 °C [17]. In terms of administrative divisions, the Yellow River in Inner Mongolia mainly flows through six leagues and prefecture-level cities (Hohhot, Baotou, Wuhai, Ordos, Bayannur, and Alashan), including three secondary watershed areas (Lankou–Hekou, Hekou–Longmen, and the inner flow region) (Figure 1). Alashan has an area of 27 × 104 km2 (the largest of Inner Mongolia’s 12 cities and leagues), but the Yellow River flows through only 85 km along Alashan’s eastern edge, contributing little to the league’s agricultural irrigation. We, therefore, excluded Alashan from our study area, focusing on the remaining five prefecture-level cities. As the center of economic development in the IMAR, the Inner Mongolia section of the Yellow River Basin accounts for more than 60% of the region’s gross domestic product (GDP), and the region is dependent on the Yellow River’s streamflow for agricultural development [18].

2.2. Data Sources and Preprocessing

We analyzed two variables—AWU and the agricultural economy—as quantified by the gross agricultural output in the Inner Mongolia section of the Yellow River Basin between 1998 and 2018. Data were obtained from the Inner Mongolia Statistical Yearbook, Inner Mongolia Water Resources Bulletin, and the Yellow River Water Resources Bulletin. AWUAWU refers to the amount of water used to irrigate agricultural fields, orchards, and pastures (excluding livestock and fish farming water) as a proportion of the primary-sector water use [19]. The agricultural economic growth is expressed in terms of gross agricultural output, with the main crops being wheat, corn, beans, potatoes, and oilseeds. To account for price fluctuations, we standardized each year’s gross agricultural output to the relevant 1998 price during preprocessing [20]. Based on the total effective irrigated area, the indicator of AWU output efficiency and average AWUAWU per mu (1 mu = 1/15 of a hectare) can be further calculated. Among these indicators, the total effective irrigation area refers to the cultivated land area with a certain water source, relatively flat land, and irrigation projects or equipment have been equipped and can carry out normal irrigation in an ordinary year. The AWU output efficiency refers to the agricultural economic income from a unit water resource input in agricultural production, which is the ratio of the combined gross output of agriculture, forestry, and animal husbandry to the AWU. The average AWU per mu is the ratio of the total AWU to the AWU of the total effective irrigated area, which can quantitatively reflect the level of water utilization in agricultural production. The growth of the agricultural economy is the difference between the final agricultural gross national product (GNP) and the base agricultural GNP, which is a dynamic index reflecting the degree of change in the development level of the agricultural economy over a certain period.

2.3. Methods

2.3.1. PVAR Model Establishment

To examine whether a causal relationship exists between AWU and the agricultural economy, panel data spanning 1998–2018 for the two main variables (total AWUAWU and agricultural economy growth) were translated into two vectors and input into the PVAR model. Using the unit root test, cointegration test, and Granger causality test in EViews 10.0, we investigated, respectively, the stationarity, long-term equilibria, and mutual causality of the two main variables. PVAR parameters were then estimated using the generalized method of moments (GMM) to derive quantitative relationships between the variables. The resulting PVAR model [21] was as follows:
y s , t = a 0 + j = 1 k a j y i , t j + η i + e i , t ,
where y s , t includes two variables, which are the total AWUAWU and the agricultural economic growth (measured by gross agricultural output); i represents each Inner Mongolian league or city through which the Yellow River passes; t represents different years; k is the model’s lag length; η i is a regional fixed effect that captures the heterogeneity of the two main variables across different regions; and e i , t represents the error terms. To ensure the model’s validity, the panel data were first tested for stationarity and cointegration prior to the PVAR modeling.

2.3.2. Unit Root Test

We used the unit root test to determine the stationarity of the main variables (AWU and the agricultural economy) in the study area. First, the variables were logarithmized, denoted as lnW and lnG. EViews includes six commonly used panel data unit root tests: three homoscedastic tests (Levin–Lin–Chu, Breitung, and Hadri) and three heteroscedastic tests (Im–Pesaran–Shin, Fisher ADF, and Fisher PP). The null hypothesis of all of the tests is the presence of a unit root, except for the Hadri test, whose null hypothesis is a stationary series. We applied all of the tests, except the Hadri test, to the panel data to maximize the model’s robustness. If the test results rejected the null hypothesis, we concluded that the panel data did not have a unit root, indicating that the time series is stationary. Meanwhile, if we could not reject the null hypothesis, we concluded that the data were not stationary and further tested for the variables’ first differences [22].

2.3.3. Lag Length Selection

To build a PVAR model with multiple variables, it was first necessary to determine the optimal lag length k. A k that is too large or too small will reduce the model’s parameter estimation validity. Based on the Akaike information criterion (AIC) and Bayesian information criterion (BIC), we continuously adjusted the value of lag length k in EViews until the smallest AIC and BIC were obtained, which were −2.40 and −2.24, respectively. We finally determined that the value of lag length k was 1.

2.3.4. Cointegration Test

After investigating the stationarity of AWU and the agricultural economy, further cointegration tests were needed to determine the potential long-term equilibrium. The residual-based cointegration tests in EViews include Pedroni’s test and Kao’s test. Pedroni’s test is more comprehensive, since Kao’s residual cointegration test contains only the individual intercept specification, while Pedroni’s test includes two additional specifications: individual intercept and individual trend, and “none” [23]. Therefore, we used Pedroni’s test to determine the cointegration of AWU and the agricultural economy, evaluating the statistical significance of the resulting p-values at varying significance levels. We found that a long-term equilibrium relationship existed between variables, passing the cointegration test.

2.3.5. Generalized Method of Moments (GMM) Analysis

We estimated this study’s PVAR model parameters using GMM to fit the variables to the autoregression model. Because the PVAR model included both time effects and fixed effects, it was necessary to first subtract the average of all observations from the variables’ grouped averages to remove time effects. Then, we eliminated the fixed effects using forward orthogonal deviation.

2.3.6. Granger Causality Test

After testing the stationarity and cointegration of the variables (AWU and the agricultural economy), the final step was to use the Granger causality test to evaluate possible causal relationships between the variables. The null hypothesis of the Granger causality test is that there is no causal relationship between variables. After the null hypothesis was rejected, we determined whether the causal relationship was unidirectional or bidirectional using a t-test and evaluating the p-values at varying significance levels [24].

3. Results

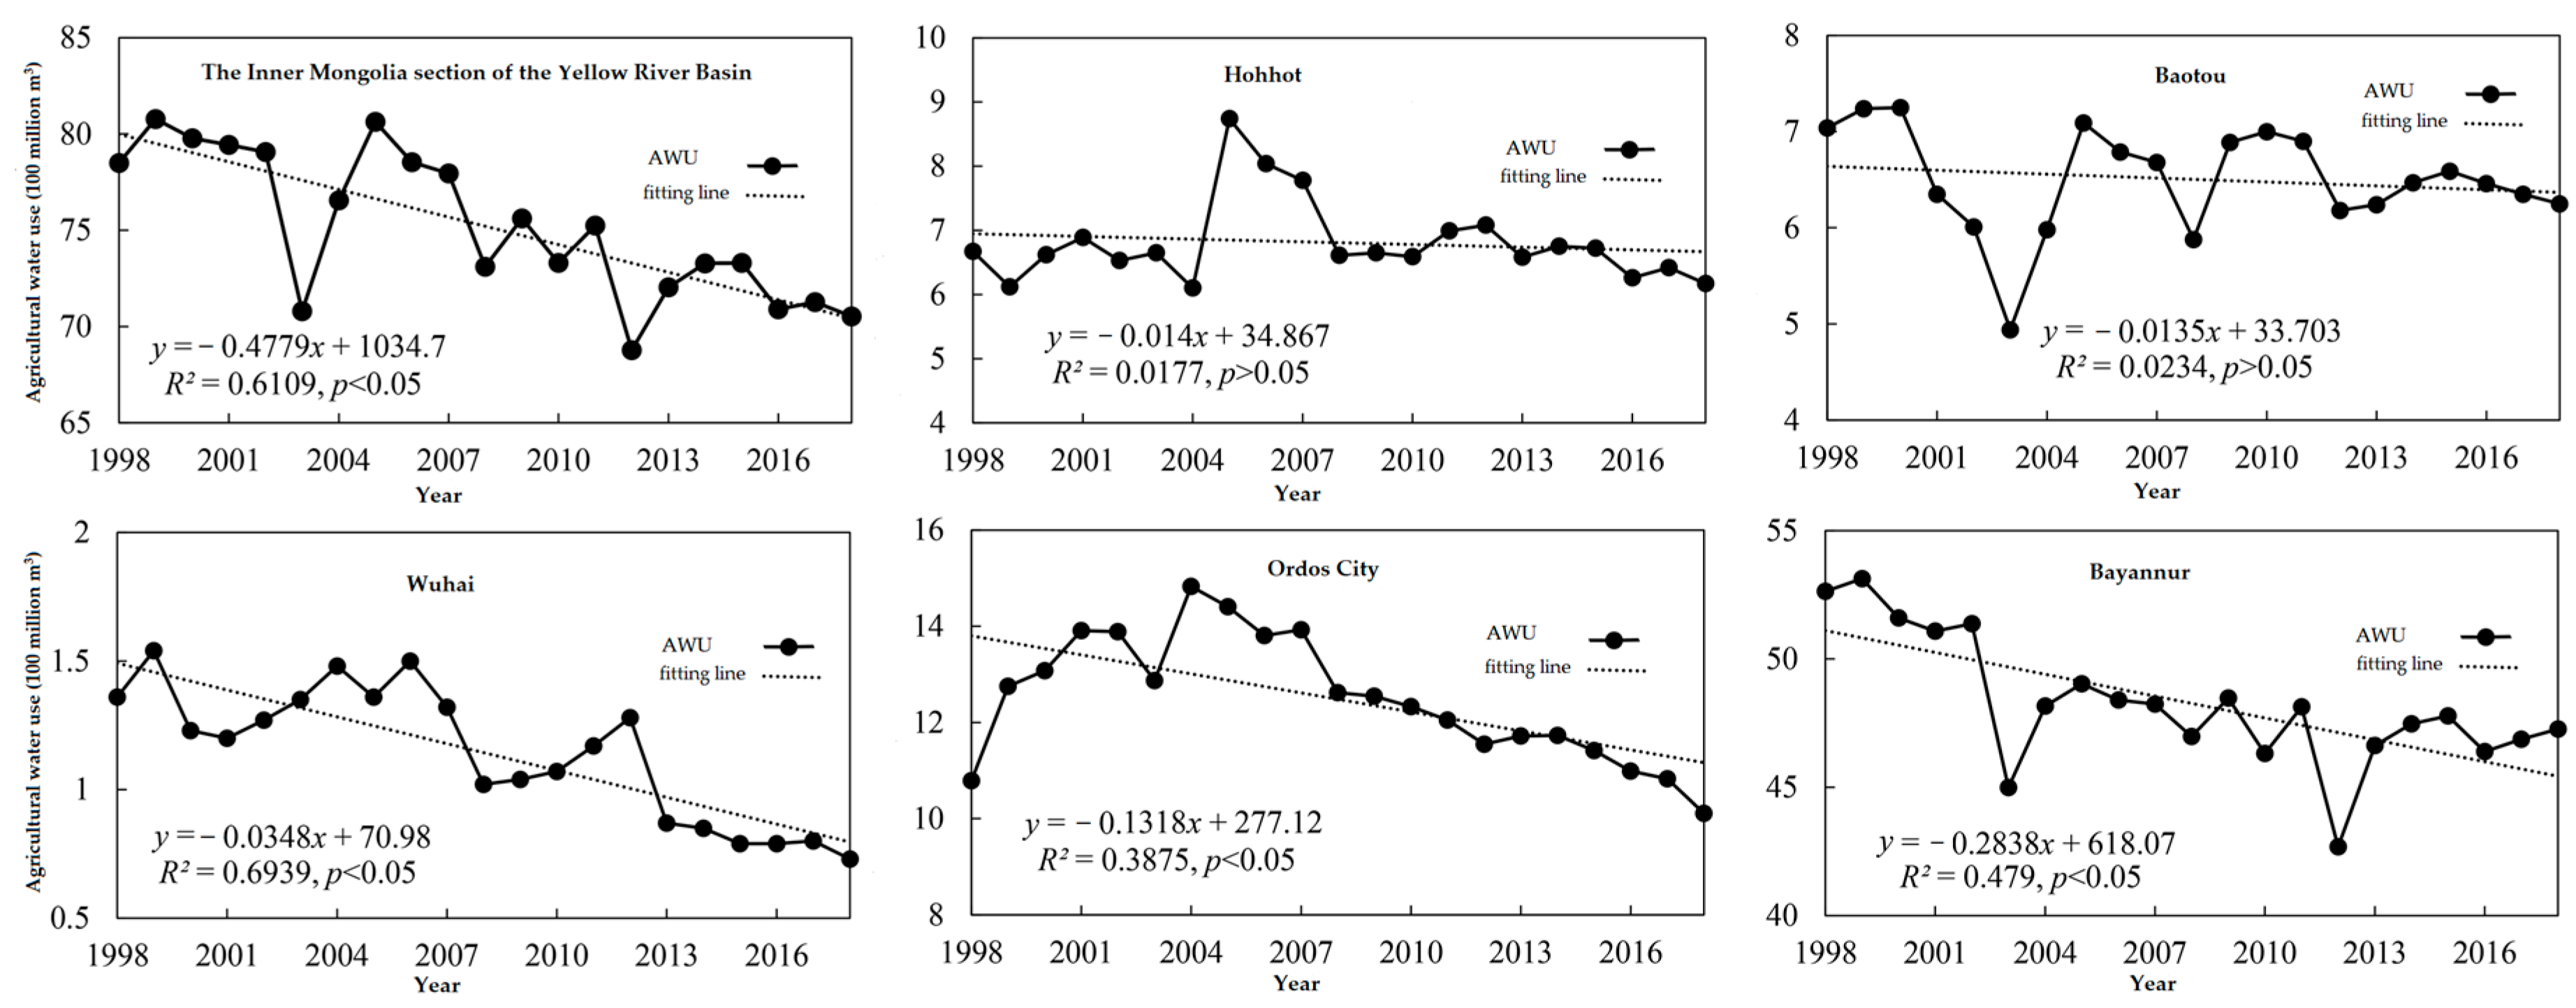
3.1. AWU in the Inner Mongolia Section of the Yellow River Basin

From 1998 to 2018, the multiyear average of the total AWUAWU in the Inner Mongolia section of the Yellow River Basin was 7.521 billion m3. It significantly decreased during the study period at a rate of 48 million m3/year (Figure 2). The highest total AWUAWU occurred in 2005, at 8.063 billion m3, and the lowest occurred in 2012, at 6.877 billion m3. Between 1998 and 2002, the region’s total AWU remained relatively stable. The AWU in the region gradually rebounded in 2004, reaching a 21-year high in 2005, and then it exhibited a fluctuating decreasing trend and a general decline. In 2012, the AWUAWU decreased significantly, down by 647 million m3. Precipitation in 2012 across all of the study area’s five administrative divisions was higher than the multiyear average, leading to a year of partial water surplus [25]. Rainfall consumed by crops (i.e., green water) was relatively high in 2012, resulting in a lower AWU for irrigation (i.e., blue water). In terms of prefecture-level cities, their 21-year average AWU was only 114 million m3. This decreasing trend was statistically significant (p < 0.05) in all cities, except Hohhot and Baotou. Bayannur had the highest multiyear average AWU (4.827 billion m3), which was much higher than that of other cities in the study area, accounting for 64.18% of the region’s water use (Figure 2). Bayannur showed the largest decline, at a rate of 28 million m3/year.
There were significant differences in the share of the AWU in the total water use across the five cities of the Inner Mongolia section of the Yellow River Basin. In 2018, for example, the AWU in Bayannur accounted for as much as 92.58% of the total water use (Table 1). Except for Wuhai (28.40%), the AWU in the remaining three cities all surpassed 50% of the total water consumption. There were also significant differences in the effectiveness of the AWU across the five cities. Hohhot had the lowest AWUAWU per mu and the highest AWU output efficiency, showing the highest overall AWU efficiency in the region. Baotou and Ordoswere next, with AWU output efficiencies of CNY 25.31/m3 and CNY 19.01/m3, respectively. However, with average AWUAWU per mu values significantly higher than those of Hohhot, the AWU output efficiencies of Baotou and Ordos might be overly reliant on AWU, meaning their water use efficiency was significantly lower than that of Hohhot. While Wuhai and Bayannur had the highest average AWU per mu—at 689.36 CNY/m3 and 482.82 CNY/m3, respectively—their AWU output efficiency values were significantly behind those of the other three cities, indicating poor AWU efficiencies. Especially in Wuhai, lower irrigation efficiency might stem from the fact that the area mainly grows crops such as greenhouse vegetables and grapes, leading to more water waste [8]. Consistent with previous studies [26], our results indicate that AWU efficiency varies greatly across the cities of the Inner Mongolia section of the Yellow River Basin. To meet the water demand needed for sustainable economic development, regions such as Wuhai and Bayannur should develop agricultural water management technologies, tailor irrigation methods, and improve water use efficiency.
The trends in AWU and major crop yields in the study area make it clear that the region’s AWU efficiency increased significantly from 1998 to 2018, indicating marked improvements in irrigation methods and technologies [8]. Although the average total AWUAWU of the Inner Mongolia section of the Yellow River Basin decreased significantly during the study period, major crop yields saw clear upward trends in the same period (Figure 3). Major crop outputs in the study area increased from 3,916,000 t in 1998 to 7,914,200 t in 2018, for an increased rate of 209,100 t/year. Bayannur had the highest yield of major crops and Wuhai the lowest. All five cities showed significant upward trends in major crop yields, with Bayannur exhibiting the largest growth rate of 77,100 t/year and Wuhai the slowest growth rate of 1100 t/year.

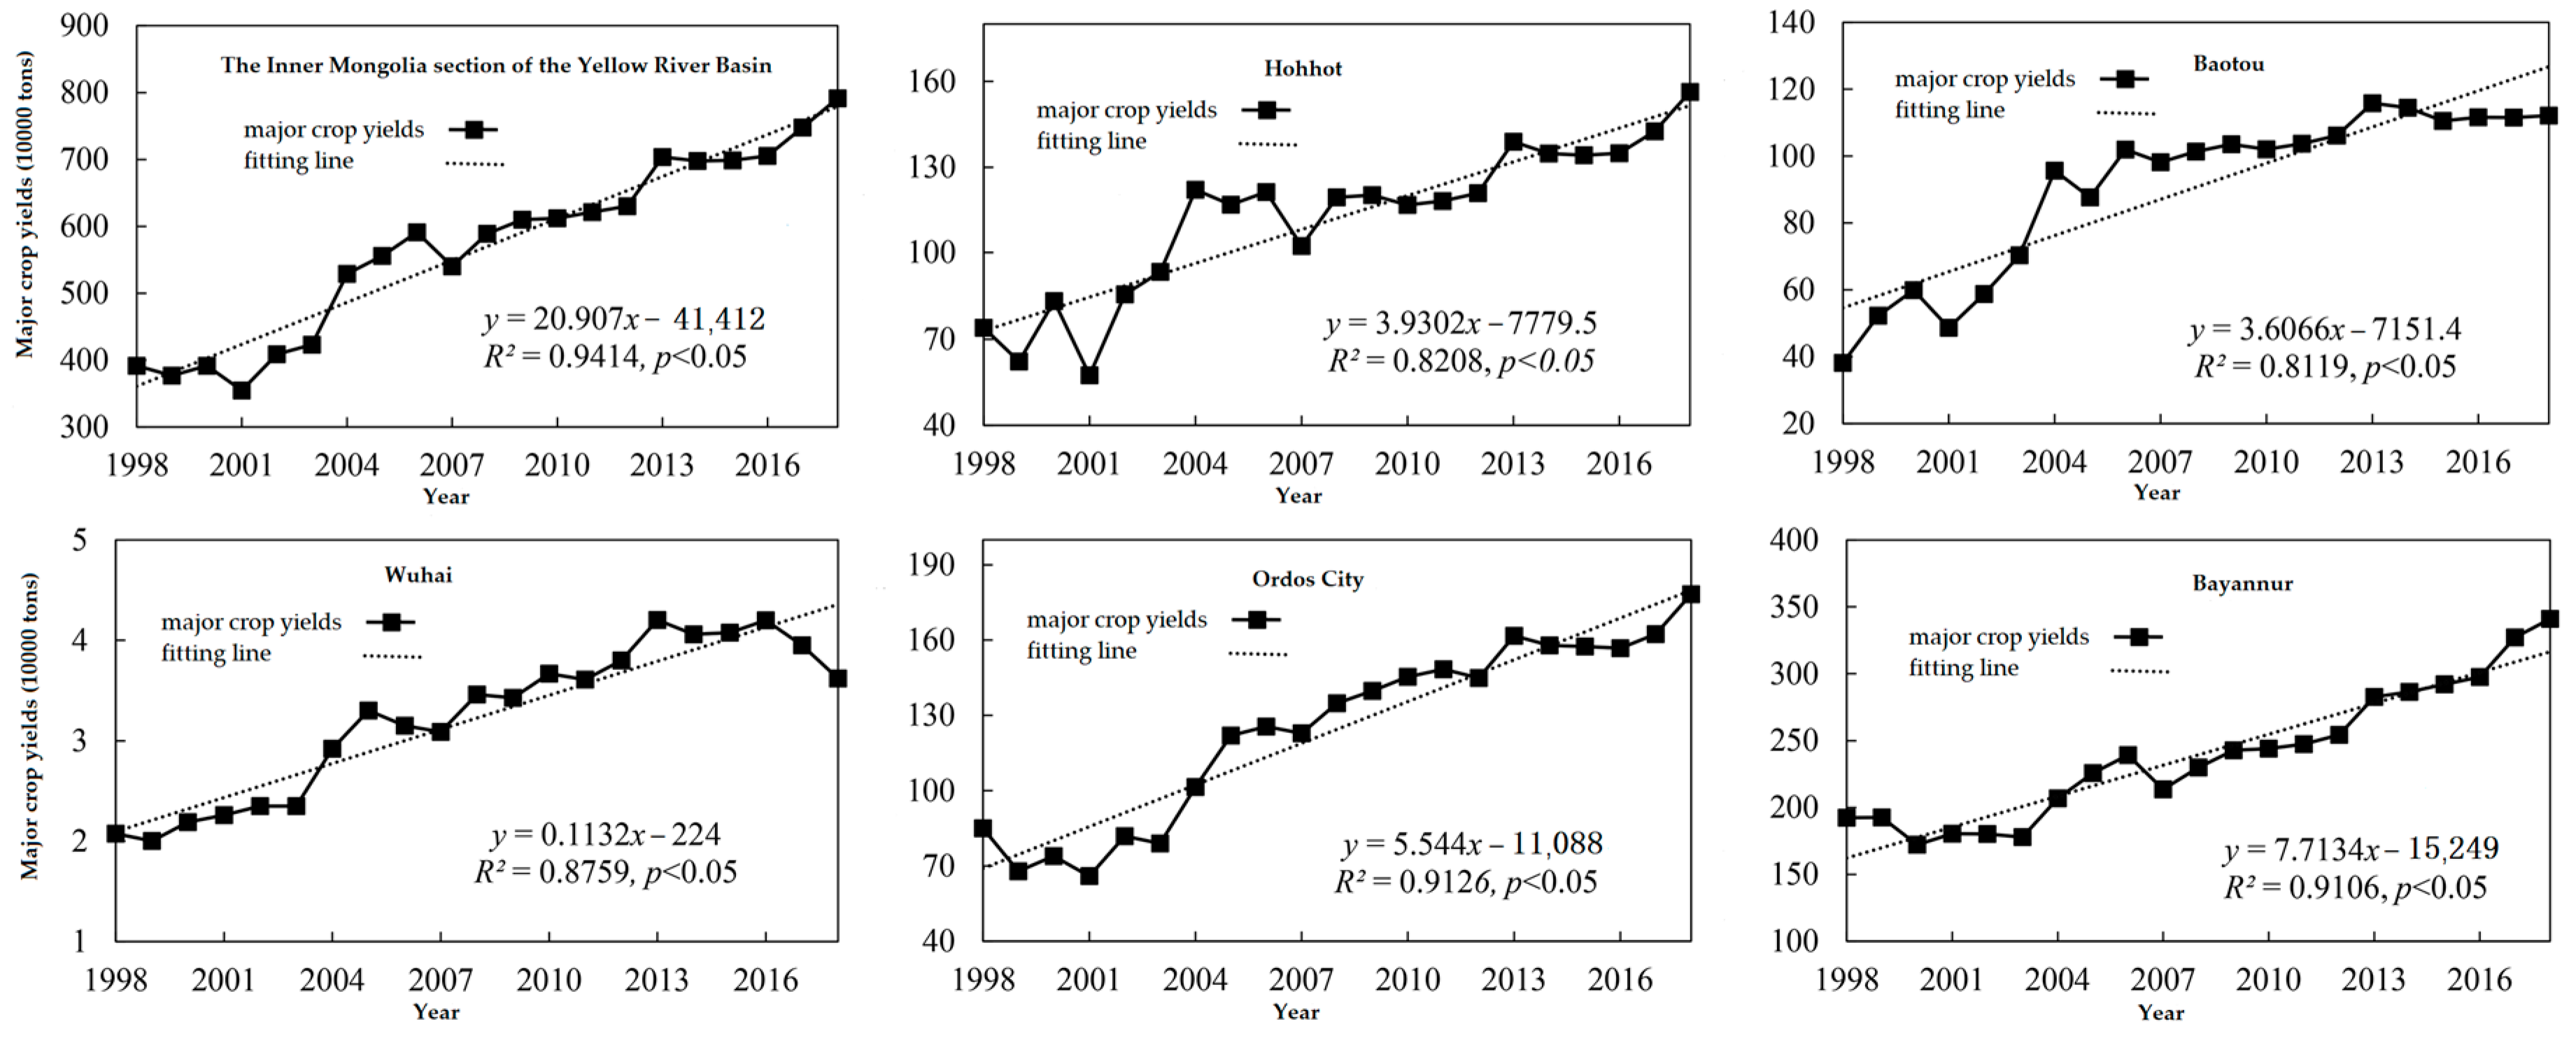
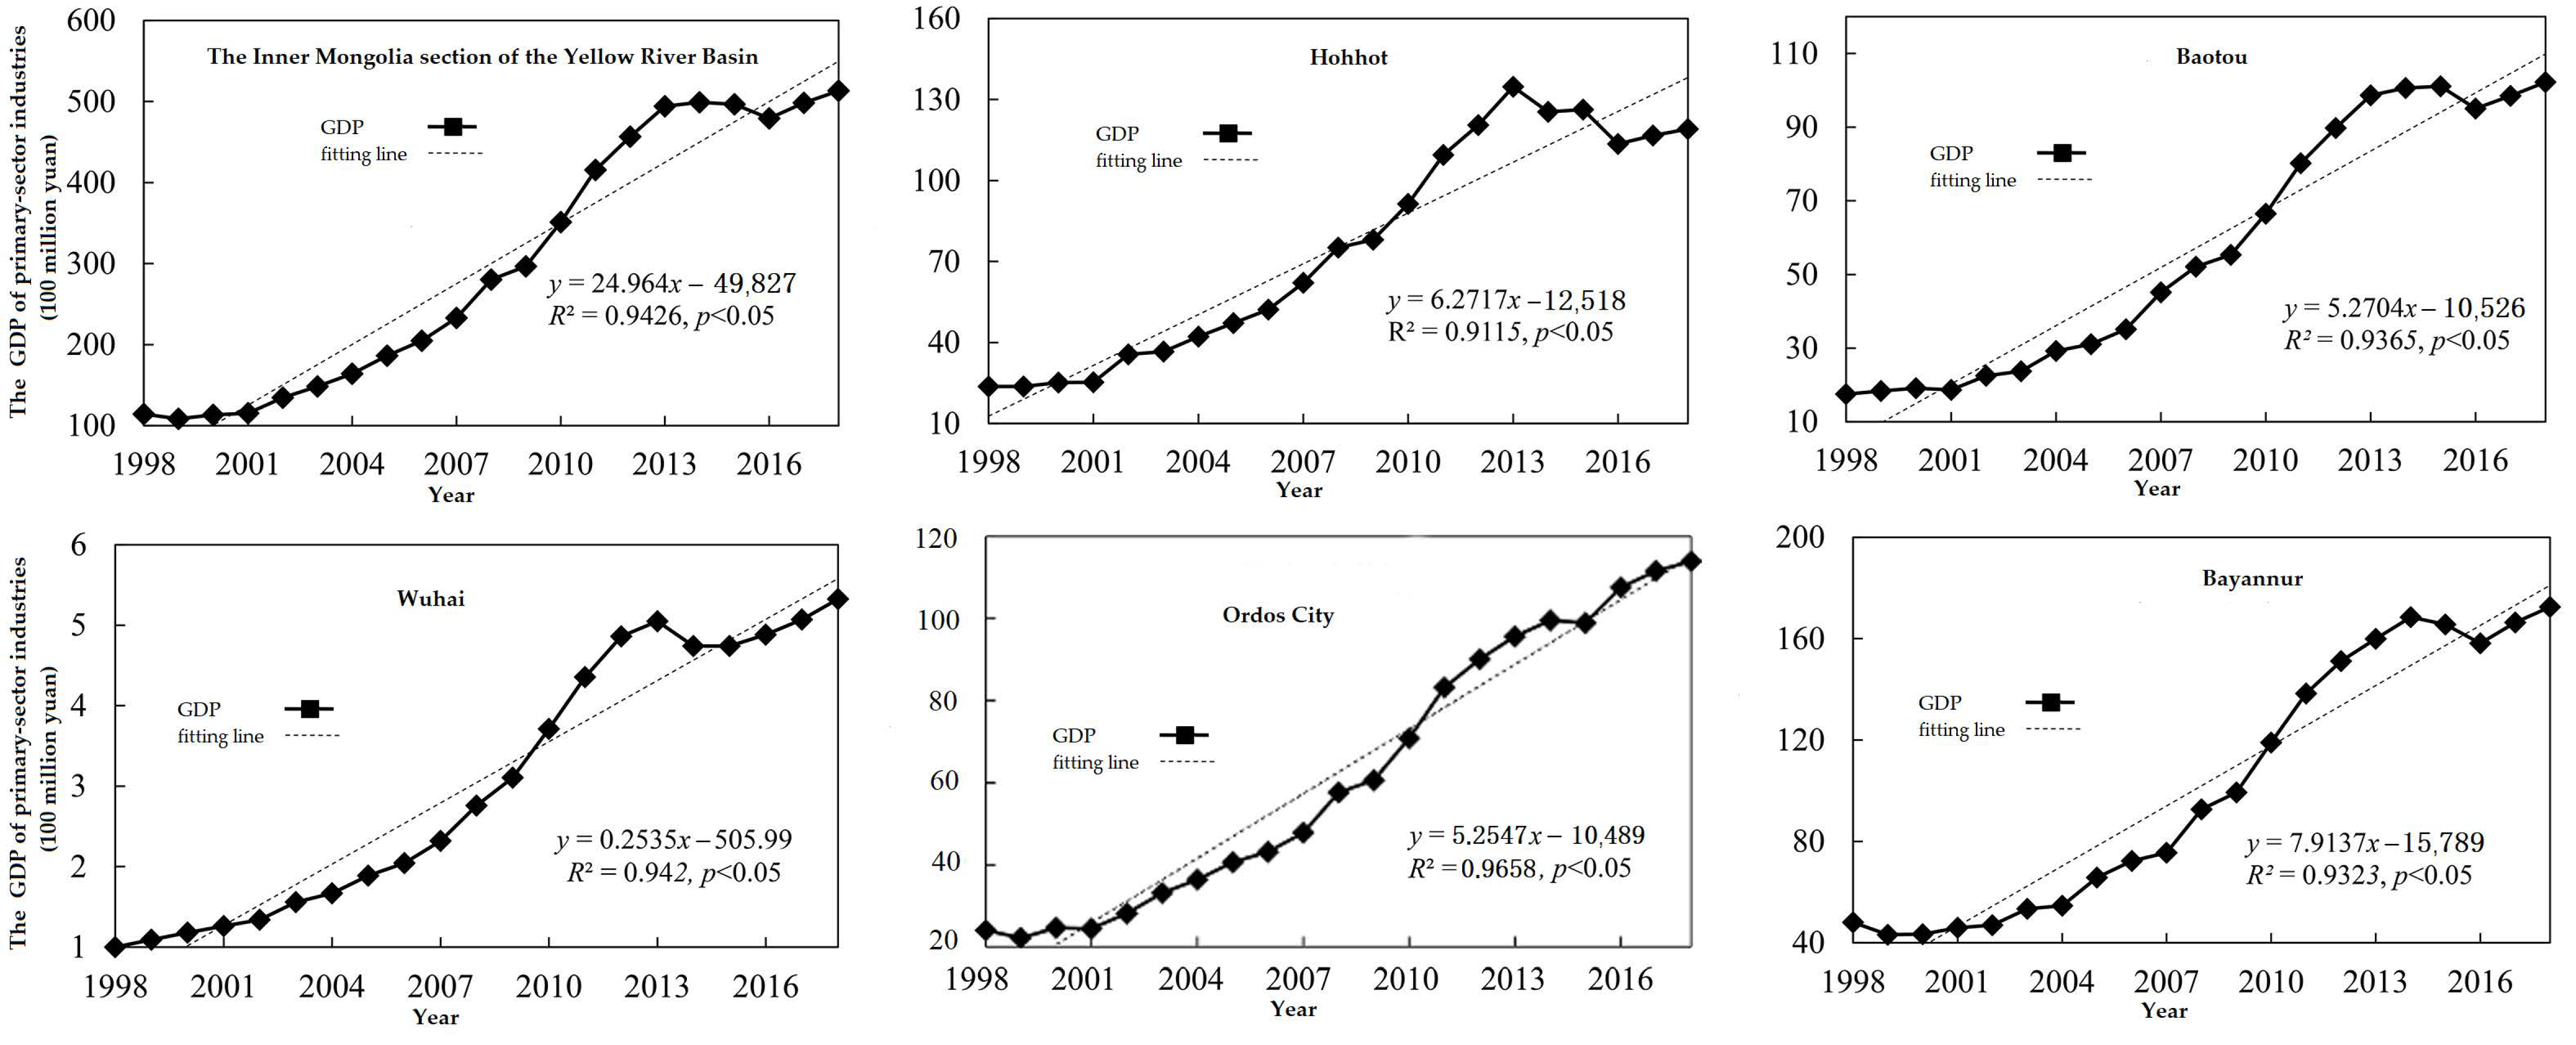
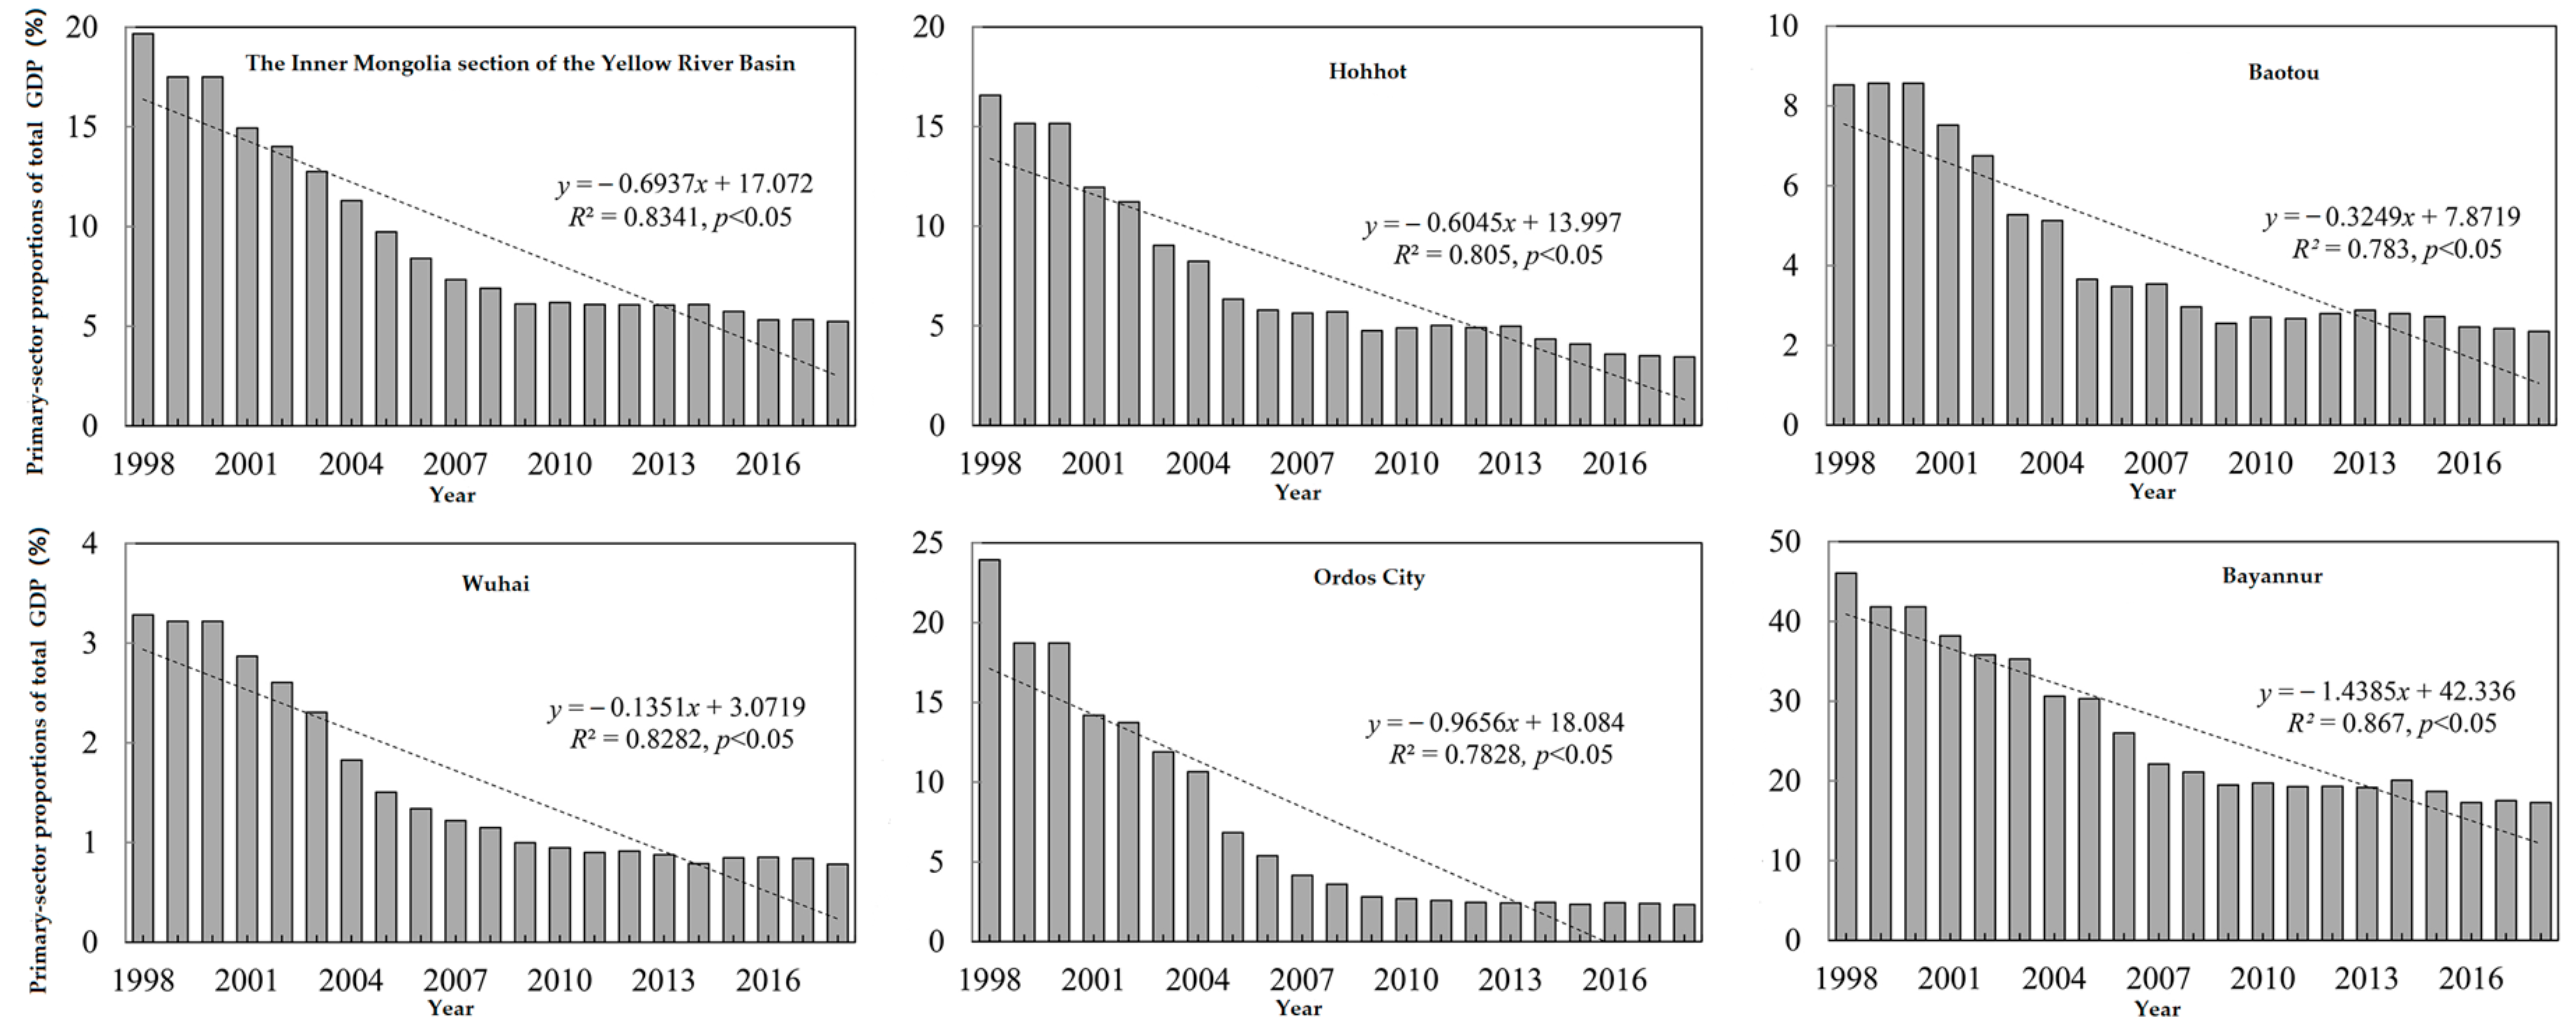
3.2. Agricultural Economy Growth in the Inner Mongolia Section of the Yellow River Basin

From 1998 to 2018, the average total GDP of primary-sector industries in the study area was CNY 30.014 billion and demonstrated a statistically significant upward trend (p < 0.05). Primary-sector industries’ total GDP grew from CNY 11.423 billion in 1998 to CNY 51.321 billion in 2018, for a growth rate of 2.496 billion CNY/year (Figure 4). Primary-sector GDP in all prefecture-level cities significantly increased initially, stabilized, then decreased slightly after reaching a certain threshold during 2012–2013, and finally grew again after 2016. Bayannur showed the fastest primary-sector growth, with a growth rate of 6.47%. Although primary-sector GDP in Wuhai maintained consistent growth, its magnitude was smaller, with an increase of only CNY 430 million.
The agricultural economy is a crucial part of the national economy. According to the Inner Mongolia Statistical Yearbook, during 1998–2018, there were differences between primary-sector GDP in the study area as a proportion of the total GDP and primary-sector GDP in each city as a proportion of the total city GDP. Nonetheless, all primary-sector proportions of the total GDP decreased significantly over the study period (Figure 5). By 2018, aside from the primary-sector share of Bayannur, an agricultural city, reaching 17% of the total GDP, all other cities’ primary-sector shares had fallen below 4%. These economic changes reveal the rapid development of secondary- and tertiary-sector industries in the Inner Mongolia section of the Yellow River Basin, which now account for a much larger share of the GDP than the primary sector. Overall, it appears that the region’s economic structure has undergone continuous optimization. The levels of industrialization and modernization seen today are gradually approaching those seen in developed economies, characterized by a large influx of capital and labor in the information and service industries.

3.3. Causality between AWU and the Agricultural Economy

To avoid unit roots in the panel data for AWU and the agricultural economy in the study area—and, thus, the phenomenon of spurious regression—we first conducted a unit root test for stationarity on the data (Table 2). When the unit root test was performed on lnW, the results indicated that both lnW and its first difference rejected the null hypothesis. This indicates that the original AWU observations and the first differences did not have unit roots. When the unit root test was performed on lnG, all five tests at varying significance levels indicated that lnG could not reject the null hypothesis, indicating that the original gross agricultural output data had unit roots, and the time series was nonstationary. Next, we performed the unit root test on the first differences of lnG, with all five tests rejecting the null hypothesis at the 1% significance level. This indicates that there were no unit roots in the first differences of the gross agricultural output (i.e., it was a stationary series). We concluded, therefore, that both lnW and lnG were integrated at order 1 and could be used for further PVAR modeling.
With the unit root test establishing these variables as a stationary series, we conducted further cointegration tests on the two variables (AWU and the agricultural economy) to determine whether a long-term equilibrium relationship existed between the two. Using Pedroni’s test, we constructed seven statistics based on the regression residuals of the cointegration equation; Table 3 shows the results. Among the seven statistics, all passed the significance test except Panel v. Others. This shows that the test results for Panel ADF under small-sample conditions were significantly influenced by other statistics [27]. We concluded, therefore, that there was long-term equilibrium between AWU and the agricultural economy in the Inner Mongolia section of the Yellow River Basin, which could be used for the PVAR model in the next step.
Table 4 shows the GMM estimation results of the PVAR model of the AWU and the agricultural economy. The one-period-lagged values of both the AWU and the agricultural economy were positive and significant at the 1% level, indicating that both were positively influenced by the previous period and also stimulated each other. With gross agricultural output as the dependent variable, the coefficients of the lagged agricultural economy and AWU were AWU 0.9843 and 0.0159, respectively. This indicates not only that agricultural economy development in the study area was dependent on its own development but also that AWUAWU significantly contributed to its agricultural economy. With AWU as the dependent variable, the coefficients of the lagged AWUAWU and the agricultural economy variables were 1.0025 and 0.0023, respectively. This result also indicates that greater agricultural output leads to greater AWU. However, the coefficient of the lagged AWU regressed on agricultural economy was greater than the coefficient of lagged agricultural economy regressed on AWU. In other words, AWU stimulated the agricultural economy more than the agricultural economy stimulated AWU. We should note that the PVAR model can only reflect the simulated dynamics between variables at the macro level and cannot account for causality between variables [24]. Therefore, the interaction between AWU and the agricultural economy needed to be further assessed using a panel Granger test.
The Granger causality test between the agricultural economy and AWU revealed that AWU Granger-caused an increase in the agricultural economy, but the agricultural economy failed to Granger-cause AWU (Table 5). This result indicates, first, that increasing AWU promotes the growth of the agricultural economy. Second, agricultural economic growth greatly improves AWU efficiency. This is potentially attributable to technological development and industrial optimization, which might, in turn, reduce the demand for water resources [11,20]. The changes in the AWU and major crop yields mentioned earlier may further support our result.

4. Discussion

On the basis of quantifying the changes in the AWU and agricultural economy in the Inner Mongolia section of the Yellow River Basin and the cities in this region, the results of this study further reveal whether there is a long-term equilibrium relationship between AWU and the agricultural economy, whether there is a mutual influence, and whether there is a two-way causal relationship. The results show that the AWU in the Inner Mongolian section of the Yellow River Basin exhibited a significant decreasing trend during 1998–2018 (p < 0.05), mainly due to the continuous improvement of the agricultural water use efficiency [28,29]. The AWU exhibited an unusually sharp decrease from 7.907 billion m3 in 2002 to 7.03 billion m3 in 2003. The statistics show that the groundwater resources in Bayannur decreased by 50.5% between 2002 and 2003, and the Yellow River Basin’s water volume decreased by 13.5% in the same time period, which may explain the notable decrease in the total AWU in 2003 [30]. The AWU of all of the cities exhibited decreasing trends of different degrees, and the rates of decrease were as follows: Bayannur > Ordos > Wuhai > Hohhot > Baotou. The flat Urat grasslands in the northern part of Bayannur and the fertile Hetao Great Bend plain in the south provide unique conditions for agriculture and animal husbandry, resulting in relatively advanced agricultural development [31]. This area is followed by Ordos, with an annual average AWU of 1.248 billion m3. Although Ordos city has the largest area among the five prefecture-level cities, its agricultural development is constrained by the Mu Us Desert and the Kubuqi Desert, which cover 47.95% of the city’s total area across the north and south and are difficult to exploit. The average multiyear AWU values in Hohhot and Baotou are comparable, at 681 million m3 and 650 million m3, respectively. Wuhai has favorable climate and temperature conditions for farming, but the geographical area is small; therefore, its 21-year average AWU is only 114 million m3.
The GDP of the primary industry in the Inner Mongolia section of the Yellow River Basin exhibited a significant increasing trend from 1998 to 2018 (p < 0.05). The GDP of the primary industry of each league city also exhibited a significant increasing trend, and the rates of increase from high to low were as follows: Bayannur > Hohhot > Baotou > Ordos > Wuhai. Although Bayannur had the largest water consumption, the GDP of the city’s primary industry accounted for the highest total output value, with an average of more than 26% in many years. However, the proportion of the GDP of the primary industry in the total output value of the Inner Mongolia section of the Yellow River Basin exhibited a decreasing trend. After the turn of the century, China adopted the 10th Five-Year Plan for National Economic and Social Development to adjust the economic structure of its key regions. Consequently, the economies of prefecture-level cities rapidly developed, and the proportion of the GDP of the primary-sector in the total GDP decreased. By 2009, this decline in the proportion of the total GDP slowed and ultimately stabilized [32]. All three industry sectors (primary, secondary, and tertiary) in the IMAR have been growing steadily; however, because the growth rate of the primary sector has been smaller than those of the secondary and tertiary sectors, the proportion of the primary industries in the total economy has gradually decreased [33].
Based on the PVAR model, in this study, we analyzed the interaction between the AWU and agricultural economy in the Inner Mongolia section of the Yellow River Basin. It was found that the time series data for the AWU and agricultural economy in this region during the study period are both stationary series, and there is a long-term equilibrium relationship between them. In addition, both are positively influenced by the previous period and promote each other. However, the dependence of the agricultural economy on AWU is greater than that of the AWU on the agricultural economy. Considering the characteristics of water resource shortages and ecological vulnerability in the study area, the results of this study are consistent with the study area’s water scarcity and agricultural development situations as economic development is more dependent on water resources in areas with relative water scarcity [30,34]. The Granger causality test between the agricultural economy and AWU revealed that the AWU Granger-causes an increase in the agricultural economy, but the agricultural economy fails to Granger-cause agricultural water consumption in the AWU. Notably, in addition to AWU, the agricultural economy is affected by various factors, such as irrigation methods and crop structure [35,36], and it is not feasible in the long term to rely solely on one element (i.e., increased AWU) to promote agricultural economic growth. According to the principle of marginal effect, after a threshold is reached, the marginal effect of the AWU on agricultural economic growth will decrease, which may lead to a waste of water resources [37]. We should aim, therefore, to sustainably develop agricultural water resources by improving existing technologies and optimizing existing industrial structures.

5. Conclusions

Using panel data for AWU and the agricultural economy in the Inner Mongolia section of the Yellow River Basin from 1998 to 2018, we analyzed the characteristics of water use and the agricultural economy over time, as well as the interaction effect between them, yielding the following conclusions:
(1)
From 1998 to 2018, the average total AWUAWU in the Inner Mongolia section of the Yellow River Basin was 7.521 billion m3, with a significant downward trend of 48 million m3/year. At the same time, AWU efficiency significantly increased during the study period, and major crop yields increased at a rate of 209,100 t/year. AWU efficiency varied greatly across administrative regions, with Hohhot having the highest level of water use efficacy and Wuhai and Bayannur having the lowest.
(2)
The agricultural economy of the study area grew substantially between 1998 and 2018, with the growth rate of the primary-sector GDP reaching 2.496 billion CNY/year. As a share of the total economy, primary-sector industries declined to varying degrees across regions.
(3)
A stable, long-term cointegration relationship exists between AWU and the agricultural economy growth in the Inner Mongolia section of the Yellow River Basin. Both variables were positively influenced by the previous period. Further, a one-way Granger-causal relationship exists from the AWU to the agricultural economic growth.
The results of this study reveal that there is a long-term equilibrium relationship between AWU and the agricultural economy in the Inner Mongolian section of the Yellow River Basin, there is a mutual influence, and there is a two-way causal relationship. However, this study has some limitations. In this study, we did not deeply probe the relationship between the change in the planting structure and the AWU. The unit water consumption and economic value of the different crop types are different. In the future, we will further study the relationship between the cooperative changes in the planting structure, AWU, and agricultural economy. According to the results of this study, we suggest that the local government should seek a sustainable development path for agricultural water resources by improving the existing agricultural technology level and optimizing the industrial structure to reduce AWU and increase agricultural economic income.

Author Contributions

Conceptualization, Y.W.; Methodology, Z.Y. and Y.W.; Software, R.Z.; Validation, P.M.; Resources, N.L.; Writing—original draft, Z.Y.; Writing—review and editing, Z.Y., Y.W., F.M. and S.Y.; Funding acquisition, Z.Y. All authors have read and agreed to the published version of the manuscript.

Funding

This research was funded by the Science and Technology Planning Project of Inner Mongolia Autonomous Region (No.2021GG0367), Inner Mongolia Academy of Water Resources Project (No. NSK2021-Z1), Postgraduate Research Innovation Project of Department of Education of Inner Mongolia Autonomous Region (No. B20210199Z), and Key Project of Natural Science Foundation of Inner Mongolia Autonomous Region (No. 2023ZD21).

Institutional Review Board Statement

Not applicable.

Informed Consent Statement

Not applicable.

Data Availability Statement

No new data were created or analyzed in this study.

Conflicts of Interest

The authors declare that they have no conflict of interest.

References

  1. Li, J.-H. Global water shortage and food crisis. Ecol. Econ. 2021, 37, 5–8. [Google Scholar]
  2. Taghdisian, A.; Bukkens, S.G.; Giampietro, M. A societal metabolism approach to effectively analyze the water–energy–food nexus in an agricultural transboundary River basin. Sustainability 2022, 14, 9110. [Google Scholar] [CrossRef]
  3. Yang, G.-Y.; Wang, H.; Lv, Y.; Li, S.-Y.; Chang, C. Analysis on the function of national water network construction to guarantee national food security strategy. China Water Resour. 2022, 9, 34–37. [Google Scholar] [CrossRef]
  4. Leonard, L. Climate change impacts and challenges of combating food insecurity in Rural Somkhele, KwaZulu-Natal, South Africa. Sustainability 2022, 14, 16023. [Google Scholar] [CrossRef]
  5. Sun, C.-Z.; Jin, C.-Y.; Hao, S. Study on water-energy-food nexus relationship of the Yellow River basin. Yellow River 2020, 42, 101–106. [Google Scholar] [CrossRef]
  6. Liu, C.-M.; Wei, H.-S.; Zhang, Y.-Q.; Tian, W.; Luan, J.-K. Analysis on the attribution of runoff changes in the mainstream of the Yellow River and discussion on related issues. Yellow River 2021, 43, 1–6. [Google Scholar]
  7. Lv, J.-X.; Liu, C.-M.; Liang, K.; Tian, W.; Bai, P.; Zhang, H.-Y. Spatiotemporal variations of extreme precipitation in the Yellow River Basin based on water resources regionalization. Resour. Sci. 2022, 44, 261–273. [Google Scholar] [CrossRef]
  8. Wang, W.-B.; Wang, P.; Wang, H.-H. Promote the economical and intensive use of agricultural water resources and the modernization of irrigated areas in the Yellow River Basin of Inner Mongolia. North. Econ. 2020, 08, 22–66. [Google Scholar] [CrossRef]
  9. Weitzman, M.L. Comments and Discussion (on “Lethal Model 2: The Limits to Growth Revisisted” by William D. Nordhaus). Brook. Pap. Econ. Act. 1992, 2, 50–54. [Google Scholar]
  10. Rode, S. Advanced Macroeconomics; Bookboon: London, UK, 2012. [Google Scholar]
  11. Wang, X.-Y.; Han, H.-Y. Growth drag of water resources to agriculture in China. J. Econ. Water Resour. 2008, 26, 1–5. [Google Scholar] [CrossRef]
  12. Zhuo, L.; Li, M.; Zhang, G.-P.; Mekonnen, M.-M.; Hoekstra, A.-Y.; Wada, Y.; Wu, P.-T. Volume versus value of crop-related water footprints and virtual water flows: A case study for the Yellow River Basin. J. Hydrol. 2022, 608, 127674. [Google Scholar] [CrossRef]
  13. Yin, Y.; Tang, Q.; Liu, X.; Zhang, X. Water scarcity under various socio-economic pathways and its potential effects on food production in the Yellow River basin. Hydrol. Earth Syst. Sci. 2017, 21, 791–804. [Google Scholar] [CrossRef]
  14. Wang, C.-S.; You, F.; Xue, D.-Q. The causes and alleviating countermeasures of the problems of water resources utilization in areas along the Yellow River in Inner Mongolia. J. Nat. Resour. 2002, 17, 579–589. [Google Scholar]
  15. Yang, G.-Y.; Wang, H.; Li, S.-Y.; Duan, N. Water resources conditions of Inner Mongolia Autonomous Region and measures for water development and utilization. China Water Resour. 2017, 23, 32–35. [Google Scholar]
  16. Zha, J.-P.; Zhou, Y.; Zhou, X. Coupling and coordination relationship between agricultural water use efficiency and agricultural economic development in the nine provinces(autonomous regions) along the Yellow River. J. Water Resour. Water Eng. 2021, 32, 219–226. [Google Scholar]
  17. Feng, Y.-W.; Zhen, J.-H. Eco-spatial security optimization in watershed of the Yellow River in Inner Mongnolia. Chin. J. Agric. Resour. Reg. Plan. 2022, 43, 129–138. [Google Scholar]
  18. Ma, L.; Liu, T.-X. Runoff response to climate change of typical tributary in the Inner Mongolia reach of Yellow River basin. J. Irrig. Drain. 2014, 33, 122–126. [Google Scholar]
  19. Yue, S.-Y.; Li, H.-E. Study on the marginal benefits of water resources in Baoji section of Wei River. J. Water Resour. Water Eng. 2019, 30, 19–24. [Google Scholar]
  20. Li, Q.; Chen, H.-M.; Wang, Y.-P. The interactive effect of agricultural water and agricultural economic growth in Xinjiang. Resour. Sci. 2014, 36, 1679–1685. [Google Scholar]
  21. Zeng, Z.; Han, J.-Q.; Wu, Y.-G. PVAR model analysis of the impact of urbanization on agricultural carbon emissions based on the panel data of Anhui Province. J. South China Agric. Univ. 2021, 26, 176–187. [Google Scholar]
  22. Zuo, X.-X. Review of the new development of unit root test. Math. Practice Theory 2020, 50, 272–279. [Google Scholar]
  23. Chu, J.; Zhu, H.-L. Co-integration test of the relationship between international trade and economic growth in China. Med. Decis. Mak. 2020, 36, 116–120. [Google Scholar] [CrossRef]
  24. Zhang, K.; Deng, X.; Shen, Q.-L.; Qi, Y.-B. Technological progress in agriculture, rural labor transfer and farmers income- analysis of PVAR model based on grouping of agricultural labor productivity. Agr. Technol. Econ. 2017, 06, 28–41. [Google Scholar]
  25. Ma, A.-H.; Yue, D.-P.; Zhao, J.-B.; Hu, Q. Spatiotemporal variation and effect of extreme precipitation in Inner Mongolia in recent 60 years. Arid Zone Res. 2020, 37, 74–85. [Google Scholar]
  26. Fu, J.-Y.; Li, H.-Y. Study on the spatio-temporal heterogeneity of agricultural water use efficiency and influencing factors in the Yellow River basin. Chin. J. Agric. Resour. Reg. Plan. 2022, 43, 77–89. [Google Scholar]
  27. Zhao, L.; Wang, J. Tourism development and economic growth in China: A co-integration analysis on provincial panel data. Tour. Sci. 2015, 29, 40–57. [Google Scholar] [CrossRef]
  28. Lu, C.-P.; Ji, W.; Hou, M.-C.; Ma, T.-Y.; Mao, J.-H. Evaluation of efficiency and resilience of agricultural water resources system in the Yellow River Basin, China. Agric. Water Manag. 2022, 266, 107605. [Google Scholar] [CrossRef]
  29. Zhao, J.; Wang, Y.; Zhang, X.; Liu, Q. Industrial and Agricultural Water Use Efficiency and Influencing Factors in the Process of Urbanization in the Middle and Lower Reaches of the Yellow River Basin, China. Land 2022, 11, 1248. [Google Scholar] [CrossRef]
  30. Jin, S.-Y.; Zhang, S.-Y.; Ma, Z.-J.; Zhang, P. Water consumption in Inner Mongolian reach of the Yellow River since integrated water regulation. Acta Geogr. Sin. 2015, 70, 501–508. [Google Scholar] [CrossRef]
  31. Hou, Z.-H.; Mei, L.-J.; Hou, A.-H.; Feng, H.-C. Analysis of the regional difference of agricultural resources utilization in Inner Mongolia. Chin. J. Agric. Resour. Reg. Plan. 2016, 37, 160–166. [Google Scholar]
  32. Guo, H.-Q.; Shen, X.-Q. The three industrial structures development and contribution to GDP in Inner Mongolia. Econ. Issues 2013, 5, 126–129. [Google Scholar]
  33. Meng, Z.-L.; Xue, Y.; Zhang, Y.-Y. Research on the coupling coordination mechanism between industrial structure and water resources in Inner Mongolia. Yellow River 2021, 43, 67–72. [Google Scholar]
  34. Tsimelas, G.; Kofinas, D. A resource nexus analysis methodology for quantifying synergies and trade-offs in the agricultural sector and revealing implications of a legume production paradigm shift. Sustainability 2023, 15, 9726. [Google Scholar] [CrossRef]
  35. Zhang, C.-J.; Zhang, H.-Q.; Chen, Q.-Y.; Gong, Y.-Y. Empirical research on the relationship between water use and economic growth. Resour. Sci. 2015, 37, 2228–2239. [Google Scholar]
  36. Xia, J.; Liu, B.-J.; Cheng, D.-D. Discussion on water security and high-quality development of Yellow River basin. Yellow River 2021, 43, 11–16. [Google Scholar] [CrossRef]
  37. Lang, Y.-H.; Wang, L.-M. The types of deficient resources and the trend of supply and demand. J. Nat. Resour. 2002, 17, 409–414. [Google Scholar]
Figure 1. Regional map of the Yellow River Basin.
Sustainability 15 12979 g001
Figure 2. Trends in the total AWU in the Inner Mongolia section of the Yellow River Basin (1998–2018).
Sustainability 15 12979 g002
Figure 3. Trends in major crop yields in the Inner Mongolia section of the Yellow River Basin (1998–2018).
Sustainability 15 12979 g003
Figure 4. Trends in primary-sector GDP in each prefecture-level city in the Inner Mongolia section of the Yellow River Basin (1998–2018).
Sustainability 15 12979 g004
Figure 5. Primary-sector GDP share of total GDP in each prefecture-level city in the Inner Mongolia section of the Yellow River Basin (1998–2018).
Sustainability 15 12979 g005
Table 1. Average agricultural water resources and use by region in the Inner Mongolia section of the Yellow River Basin (2018).
Agricultural Share of Total Water Use (%)Crop-Sowing Area (Thousand Hectares)Agricultural Water Use Output Efficiency (CNY/m3)Average Agricultural Water Use per Mu (m3)
Hohhot60.37457.5229.81193.42
Baotou58.41272.7825.31321.10
Wuhai28.405.9711.62689.36
Ordos64.77484.4319.01274.09
Bayannur92.58741.886.46482.82
Table 2. Results of unit root tests for agricultural water use and the agricultural economy.
TestlnWlnGdlnWdlnG
Levin–Lin–Chu−4.45515 ***3.98061−8.03974 ***−4.79198 **
Breitung−0.723912.83438−6.67362 ***−2.71619 ***
Im–Pesaran–Shin−3.41132 ***4.44567−8.59939 ***−3.54276 ***
Fisher ADF27.7100 ***0.5375467.3299 ***28.3229 ***
Fisher PP27.7005 ***1.1040879.846928.5564 ***
The dlnW and dlnG indicate the first differences of lnW and lnG; ** and *** indicate that the panel data passed the test at the 5% and 1% significance levels, respectively.
Table 3. Panel data cointegration test for agricultural water use and the agricultural economy.
Within-Group StatisticsPanel vPanel rhoPanel PPPanel ADF
1.1530−2.7522 ***−3.4329 ***−3.3014 ***
Between-group statisticsGroup rhoGroup PPGroup ADF
−1.3410 *−2.9741 ***−2.8715 ***
* and *** indicate that the panel data passed the test at the 10% and 1% levels, respectively.
Table 4. Generalized method of moments estimation of the panel vector autoregression model.
VariablesdlnGdlnW
dlnG(−1)0.9843 ***0.0023 **
dlnW(−1)0.0159 **1.0025 ***
c0.3699−0.6476
Values in parentheses are t-statistics; ** and *** indicate that the panel data passed the test at the 5% and 1% levels, respectively. LNG = 0.9843 × LNG(−1) + 0.0159 × LNW(−1) + 0.3699; LNW = 0.0023 × LNG(−1) + 1.0025 × LNW(−1) − 0.6476.
Table 5. Granger causality test between agricultural water use and the agricultural economy.
Null Hypothesisp-ValueConclusion
lnG does not Granger-cause lnW0.8254Does not reject the null hypothesis
lnW does not Granger-cause lnG0.0495Rejects the null hypothesis at the 5% significance level
Disclaimer/Publisher’s Note: The statements, opinions and data contained in all publications are solely those of the individual author(s) and contributor(s) and not of MDPI and/or the editor(s). MDPI and/or the editor(s) disclaim responsibility for any injury to people or property resulting from any ideas, methods, instructions or products referred to in the content.

