Article

Impact of Maker Movement on the Urban Resilience Development: Assessment Methodology and Analysis of EU Research and Innovation Projects

1
School of Engineering and Architecture, University of Zaragoza, C. María de Luna, 3, 50018 Zaragoza, Spain
2
Italian National Agency for New Technologies, Energy and Sustainable Economic Development (ENEA, DUEE-SPS-ESE), C.R. Casaccia, Via Anguillarese 301, 00123 Rome, Italy
*
Authors to whom correspondence should be addressed.
Sustainability 2023, 15(17), 12856; https://doi.org/10.3390/su151712856
Submission received: 15 July 2023 / Revised: 18 August 2023 / Accepted: 21 August 2023 / Published: 25 August 2023

Abstract

:
Cities are the engine of human development, and increasing urban sustainability is crucial to ensure human prosperity. The development of smart cities generally increases the sustainability of the cities. However, technical and environmental aspects are generally developed in smart cities neglecting socio-economic dimensions. The urban resilience concept includes the complex interactions of environmental, economic, and societal pillars. In this context, the emerging maker movement proposes an economic paradigm shift, with the interaction of humans and technology at the center of urban evolution. This paper proposes a multi-criteria methodology to define and assess the main characteristics of the resilient approach of the projects involving maker practices applied to urban development. The proposed methodology is based on the application of computer-assisted qualitative text analysis and a subsequent classification according to 12 indicators (community and urban efficiency, co-creation and professional, making sense and problem-solving, network and site-specific, implementation and optimization, sustainability-oriented and market-oriented) that define different dimensions of a bottom-up project’s resilient approach in three main key principles: inclusiveness, complexity, and durability. The method has been tested in 94 EU-funded projects. This analysis reveals the evolution and orientation of EU-funded projects from economic, technical, and social perspectives. Specifically, the patterns of remediation of non-participatory practices, the weak presence of open innovation initiatives, and the development of activities focusing on co-creation as a participatory tool. The applied methodology could be subsequently implemented at different scales and integrated with LCA in order to evaluate the sustainability of bottom-up projects toward urban development.

Graphical Abstract

1. Introduction

Cities are the core of human activities, and increasing their sustainability is crucial in the fight against climate change. Half of the worldwide population lives in cities, generating 80% of the gross domestic product, consuming two-thirds of the energy, and being responsible for more than 70% of GHG emissions [1]. Moreover, the population in cities is expected to achieve 70% in 2050, with a significant environmental impact.
The energy transition in the cities is driven by digitalization, included in the concept of smart cities. Digital solutions made the integration of traditional networks and services more efficient. Therefore, the smart city integrates complex systems covering several aspects such as the increase of energy efficiency and renewable energy [2], the generation and use of “big data” [3], public transportation [4], reduction of waste [5], or the efficient use of water [6].
Different experiences on smart cities in Europe have been carried out since the nineties [7]. The importance of smart cities in Europe as enablers of climate neutrality is demonstrated by the EU mission “100 climate-neutral and smart cities by 2030” as innovation hubs and experimentation places to extend best practices to all the cities of Europe by 2050 [8].
Usually, the development of smart cities drives an increase in the sustainability of the cities [9]. However, smart city development has been heavily technocentric [10], and the social, economic, and governance concepts linked to sustainability have been generally underrated [11]. Hence it is necessary to include the concept of resilience (including all the complex interactions between systems) [12] in the development of urban sustainability.
The concept of resilience (originally introduced by Holling in 1973 [13]) is commonly used as synonymous with “a kind of elastic resistance” or the capacity of ecosystems with alternative attractors to persist in the original state subject to perturbations. It would mean adaptability to external changes, and with this meaning, it has gained political success. It is common to hear the term resilience associated with alternative sustainable developed city models involving long-term ecological variables and short social feedback variables. It is often misunderstood that the word itself is embedded in the use of dynamic models of socioecological systems [14].
Urban resilience is defined in [15]: “Urban resilience refers to the ability of an urban system-and all its constituent socio-ecological and socio-technical networks across temporal and spatial scales-to maintain or rapidly return to desired functions in the face of a disturbance, to adapt to change, and to quickly transform systems that limit current or future adaptive capacity”.
Several urban sustainability assessment methods have been developed in the past three decades, covering the three dimensions of sustainability (environment, economy, and society) [16]. The most developed fields are related to environmental issues, namely: sustainable development indicators, energy, green infrastructure, water, land use, and urban design. The socio-economic aspects have been generally neglected [17]. Moreover, the lack of criteria for urban resilience measurement is notable [18].
Notable studies for the assessment of the sustainability of cities are the city resilience index (formed from 52 indicators in 4 dimensions: (a) health and wellbeing, (b) economy and society, (c) infrastructure and environment, and (d) leadership and strategy) [19] and the city sustainability index (composed of 16 indicators from ecological footprint to the human development index) [20].
The application of life cycle thinking (as an aggregated scheme for life cycle assessment (LCA), life cycle costing (LCC), social LCA (S-LCA), and life cycle sustainability assessment (LCSA)) on the analysis of city sustainability has been reviewed in [21]. Most of the works analyzed are focused on water, waste, and buildings, paying small attention to urban planning, energy, and socio-economic aspects. The LCA has also been linked to the urban metabolism method in order to try to assess the city as a whole [22], focusing on energy and material flows [23]. Significant works present the integration of LCA tools in the development of urban green infrastructure [24] or achieve the neighborhood scale instead of only the building scale [25].
In this context of complex interconnections, the role of the maker movement can help to address the socio-economic aspects of urban resilience. The maker movement is defined as a disruptive technology-based extension of DIY culture based on digital fabrication tools, open-source hardware and software, and the integration of physical and digital (bits and atoms) worlds. The personal fabrication tools are oriented to rapid prototyping and include electronics, robotics, 3D printing, CNC milling, or laser cutting tools. The maker movement promulgates a change in the economic paradigm with implications in education [26], design and manufacturing [27], entrepreneurship [28], and the reinvention of more sustainable cities [29].
Despite the potential of the maker movement as an urban resilience driver, as presented in the literature (see Section 2—Literature Review), there is a lack of tools and methods to systematically analyze the impact of its projects on the city. Hence, the main goal of the present work is to develop and validate a method to define and quantify the main characteristics of the resilient approach of projects involving maker practices.
Additionally, this research presents some secondary goals:
  • To identify and characterize the EU-funded projects related to maker practices applied to urban development.
  • To study the common trends in research and innovation in the field at the European level.
In order to achieve these objectives, this work presents for the first time a methodology to assess the use of digital fabrication technologies and DIY practices toward the citizen’s creation of city resilience, with several original contributions. Firstly, a methodology to categorize and quantify the resilience of maker-related projects based on 12 indicators and 6 dichotomic pairs of dimensions, sets in 3 topics, namely:
  • Inclusiveness intended as multistakeholder participation.
  • Complexity as the integration of multiple disciplines and tools.
  • Durability, including adaptiveness and long-time perspective.
Secondly, an analysis of the evolution of research and innovation policies at the European level on ICT, digital fabrication, and citizen science, with socio-economic implications, has been carried out. A total number of 94 EU-funded projects have been analyzed. Thirdly, the resilience attitude of the projects has been quantified and analyzed in three scenarios: design perspective, economic goals, and applied tools. Finally, some trends related to policy-making and policy evolution have been identified.

2. Literature Review

The first intent of postulation of the conceptual basis of the maker movement has been dealt with by Gershenfeld in his 2007 pioneering work “FAB: the incoming revolution on your desktop” [30]. This work presents a revolutionary approach to the democratization of personal fabrication as a result of MIT’s course “How to Make (Almost) Anything”. The economic implications and evolution of the maker were subsequently discussed in the works by Anderson [31], Rifkin [32], and Gershenfeld et al. [33]. In these works, the interrelations between the physical and digital environments (also known as the inter-changeability of bits and atoms) are extensively discussed from the industry, design, economy, education, and social points of view.
The maker movement presents a very complex taxonomy in terms of definition (FabLab, Makerspaces, Hackerspaces, etc.) and as a function of its social, local, and global nature. The evolution of these spaces varies due to the mix of bottom-up movements and top-down policies with heterogenous players and interests [34,35]. The evolution of the maker movement is complex due to the compromise between openness and commercial aspects, the limitations to engaging some citizen sectors (low-income or elderly groups), and the difficulties in maintaining long-term operation [36]. Moreover, digital fabrication provides a bridge between the concepts of circular economy and industry 4.0 [37].
The maker movement’s role in sustainability issues has been recently gaining interest from the scientific community [38]. Millard et al. [39] analyzed the effective role of maker movement to support sustainability. They evaluated 42 initiatives across Europe under four perspectives: technology; ambitions and achievements by the analytical pillar; the importance of gender; and the importance of scale. The results obtained confirm the important contribution to sustainability due to the technological aspects of the maker movement. However, several gaps between social and sustainable innovations have been identified. In order to close these gaps, specific topics on gender dimension (females usually underrepresented), local scale involvement, and professionalization of the makers should be addressed. Corsini and Moultrie [40] evaluated the potential of digital fabrication for humanitarian and development projects, proposing a framework for designing for social sustainability. This pioneering work was effectively demonstrated by the makers’ worldwide distributed production of protection devices during the COVID-19 crisis [41,42,43].
The link between digital fabrication and sustainability has been extensively studied in educational environments. Specifically, the architecture and design disciplines have addressed this topic in detail due to the importance of prototyping [44]. Soomro et al. [45] reviewed the social, environmental, and economic sustainability aspects of digital fabrication, proposing a sustainable prototyping design thinking model. Milara et al. [46] evaluated the impact of FabLab in the education process across four technological dimensions: 2D/3D design, tools and machines, electronics, and programming. The impact of maker spaces as a place for the development of skills, knowledge, and practices in engineering students and recommendations for its inclusion in university programs is presented in [47].
Life cycle analysis is a crucial tool to objectively evaluate the sustainability of digital fabrication compared to traditional methods. Ford and Despeisse [48] analyzed the potential of additive manufacturing as a driver of sustainability with a sensible reduction of energy, materials, and toxicity as well as social impacts. An extensive analysis of the advantages and challenges are presented, from domestic 3D printers to industrial applications. In [49], two common techniques for digital fabrication were compared: additive manufacturing and CNC milling. The impact of each fabrication process was related to the material being effectively physically manipulated. This work extended previous works mainly based on energy analysis [50].
Specifically to construction, [51] presented the LCA comparison of digital fabrication and conventional processes in fabrication. This study underlined the importance of construction materials, being secondary to the construction method. A systematic review developed by Pessoa et al. [52] analyzed the interconnections between materials, printing process, design, and function of the constructions. Ebrahimi et al. [53] analyzed the LCA impact of magnesium oxide and calcium sulfoaluminate cement printed with insulation and phase-change materials. The impact of these 3D materials is 400 lower than the Portland cement in terms of GHG emissions.
Despite the potential of digital fabrication to increase the sustainability of the cities, the real impact of maker spaces on the circular economy, social involvement, and economic development is unclear. Tsui et al. [54] analyzed the role of urban manufacturing as a driver of circularity in cities and the main barriers to their development. After a review of LCA literature, the high impact of transportation confirms digital fabrication as a sustainable driver of urban sustainability. The main barriers are related to means, skills, and knowledge of the new digital fabrication. These challenges have been addressed through practical experiences in seven European cities, and several recommendations to municipalities have been provided [55].
These aspects of the maker movement and digital fabrication on sustainability represent some of the dimensions of the potential impact on urban resilience. Urban resilience interconnects different networks of governance, material flows, infrastructures, and socio-economic dynamics [56]. Most of the literature on urban resilience is focused on the climate-change environmental impacts and remediation aspects, with a lack of research on the spatial morphology and structures [18] that are linked with socio-economic aspects addressed by the maker movement. Only a few works present qualitatively the experiences of maker spaces (or FabLabs) in the development of urban resilience in specific cities such as Hamburg [57], Barcelona [58], Otaniemi [59], Rome [60,61], Zaragoza [62], or some cities in the UK [63].
The impact of urban innovation policies is usually analyzed from a top-down perspective. Noticeably, some studies have been recently carried out to quantify the impact of public administration measures on urban development [64]. On the one hand, in China, an extensive study evaluates the agglomeration model and allocation of urban resources under the urban administrative hierarchy in 281 cities showing the important impact of including environmental aspects on urbanization [65]. Specifically, the smart city pilot strategy significantly enhanced the energy and environmental performance in cities in China [66]. These analyses were carried out by mixing spatial analysis and statistical methods that can be applied to study single policies, such as the driving restriction policies in Shanghai [67] or the underground urban development of Nanjing [68]. On the other hand, in Central Europe, some studies underline the role of public administrations as effective constructors of smart cities, analyzing the characteristics and principles underlying public service organizations in the XXI century [69], providing guidelines for the performance-based planning of smart cities in small municipalities [70]; and assessing the legal regulation to ensure more efficient functioning of smart cities [71]. The present work proposes a shifting perspective in the methodology to assess the impact of projects and policies, proposing a bottom-up analysis.
Hence, this paper presents a double ambition. On the one hand, to propose a methodology to analyze the impact of maker movement projects and policies on urban resilience that can be integrated with other indicators and indexes. On the other hand, the paper assesses the resilience impact of 94 EU-funded projects related to different dimensions of digital fabrication.

3. Materials and Methods

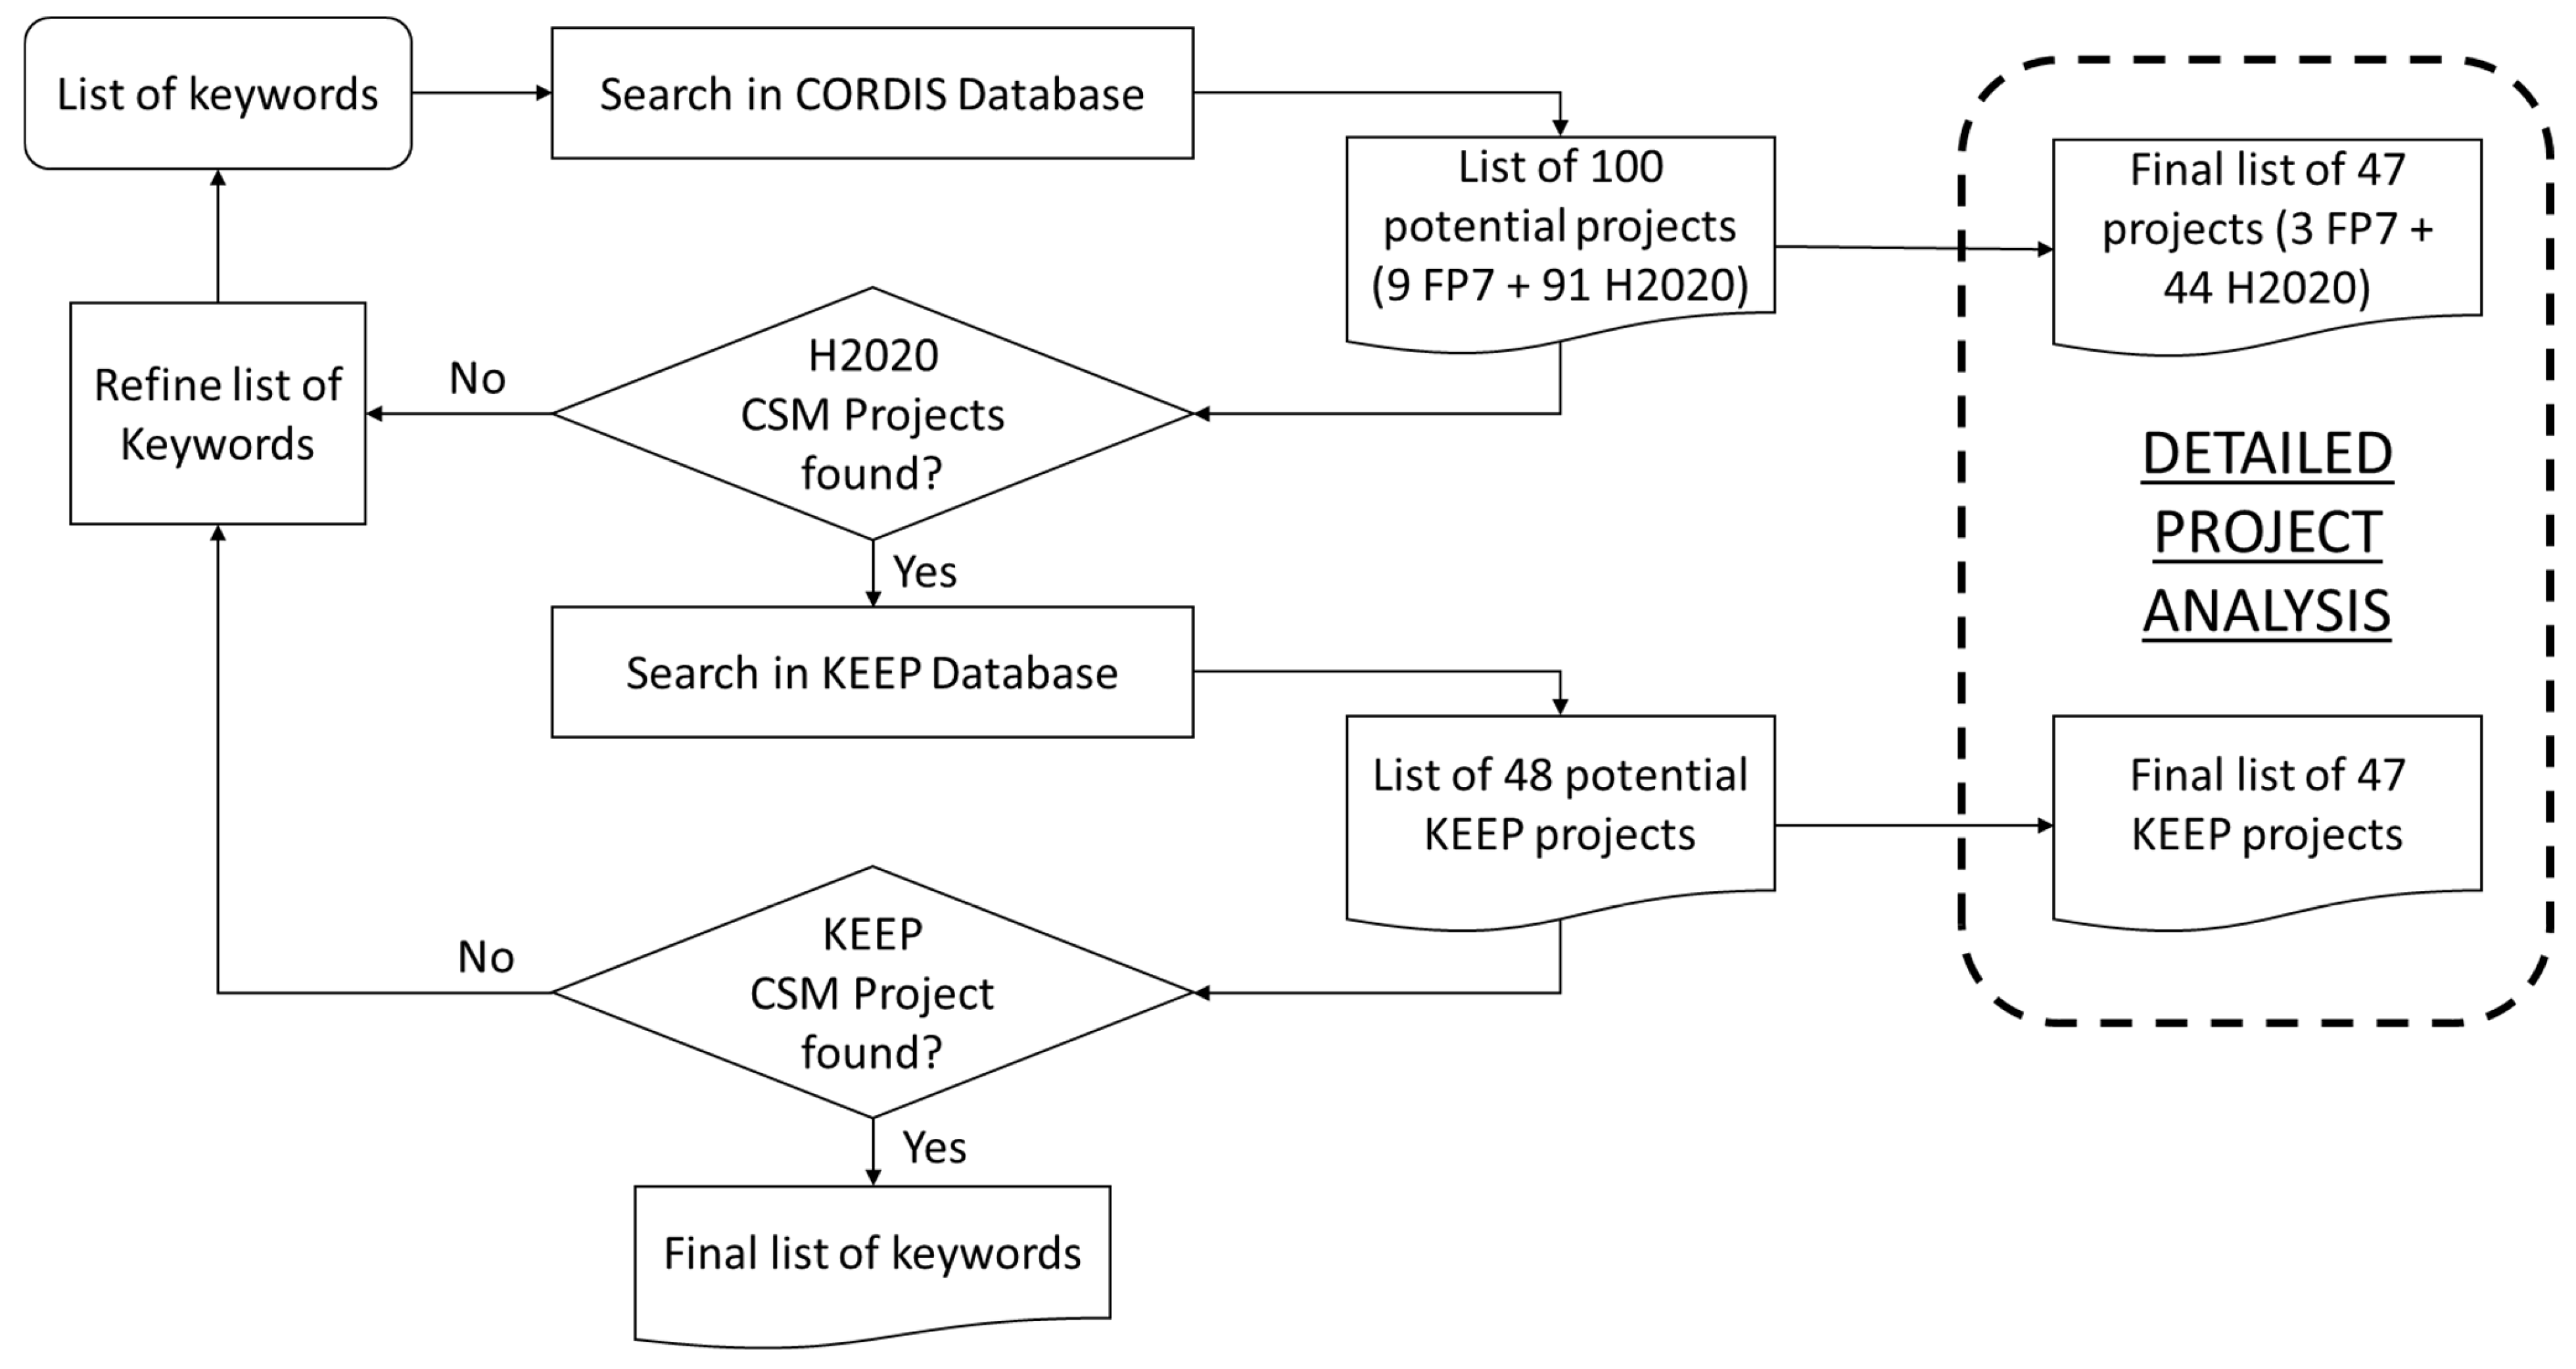
3.1. Selection of European Projects

The selection of EU-funded research projects as case studies was carried out in two phases. Firstly, a review of EU databases. Secondly, a methodology to select the final 94 projects was developed.

3.1.1. Databases

The overview of the European research projects has been carried out considering the period from 2009 to 2020 in two databases: CORDIS and KEEP.eu. On the one hand, the Community Research and Development Information Service (CORDIS) is the European Commission’s primary source of results from the projects funded by the EU’s framework programs for research and innovation (in the studied period, mainly the FP7 and Horizon 2020 programs). It is a public repository with all projects with the mission to bring research results to professionals in the field, foster open science, create innovative products and services, and stimulate growth across Europe. The projects available are the Research and Innovation Actions (RIA), Innovation Actions (IA), Coordination and Support Actions (CSA), and other actions (ERC, MSCA, etc.).
On the other hand, Keep.eu is a platform devoted to Interreg, Interreg IPA cross-border, ENPI/ENI, and IPA-IPA cross-border programs during the 2000–2006, 2007–2013, and 2014–2020 periods. It is run by the INTERact Program, an Interreg program itself, financed under the European Territorial Cooperation goal of the European Structural and Investment Funds. This project mainly involved public local and regional administrations that propone interregional collaborations. The actions developed with financial support from Interreg Europe must fall into one of the following four categories (according to ERDF programs): (a) research and innovation (including access to ICT, education, social issues, and innovation in public authorities); (b) SME competitiveness; (c) low-carbon economy; and (d) environment and resource efficiency.
Other programs have been excluded after preliminary analysis. Life project database analyses projects with technological developments that generally exclude the municipalities, the main organizations responsible for urban development. The Creative Europe database provides limited information about the projects funded in terms of description of the action and quantitative analysis. Finally, the Joint Programming Initiative (JPI) Urban Europe, a knowledge hub for urban transitions funded in 2010, is aimed at addressing global urban challenges with the ambition to develop a European research and innovation hub on urban matters to connect public authorities, civil society, scientists, innovators, business, and industry to provide a new environment for research and innovation. The topics are strictly related to the aim of this work. However, as a database, JPI Urban Europe was incomparable with the selected databases due to the qualitative nature of the documentation offered, mainly posters and images, which is strictly linked to the urban and architectural discipline. The inability to perform a quantitative analysis of the program was confirmed by the evaluation report of the platform itself, which denounces its low scientific impact in bibliometric terms [72].

3.1.2. Methodology of Project Selection

The methodology to select the projects related to the aim of this study is presented in Figure 1.
The first step to address the selection of relevant projects was to define a number of “Case Study Markers” (CSM). These CSM projects have been identified as good practices for the development of resilient practices on urban development based on maker tools by means of interviews with relevant stakeholders and networking research in fairs and conferences. The five CSM projects selected are:
  • CENTRINNO: New CENTRalities in INdustrial areas as engines for inNOvation and urban transformation (H2020-RIA). This project adopts the principles of circular economy in new urban transformation processes of industrial historic sites into productive and creative hubs, with a bottom-up approach centered on the neighborhood scale.
  • iSCAPES’s: Improving the Smart Control of Air Pollution in Europe (H2020-RIA). A multistakeholder approach based on the citizen scientist figure and the living labs as places of social revindication and bottom-up laboratories of alternative citizen-driven data collection. The Smart Citizen KIT (an open source-based al citizen scientist toolkit with an international eco) was developed in the framework of this project.
  • Making Sense: Making Sense (H2020-RIA). This project extends the potential of Smart Citizen KIT potential, in order to provide local communities with open tools (software and hardware) to characterize its environment, as pointed out by the JRC report [73].
  • Make IT: Understanding Collective Awareness Platforms with the Maker Movement (H2020-RIA). This project presents a multistakeholder attitude focused on the maker community, founding the investigation on “three analytical pillars of organization and governance, peer and collaborative activities and value creation and impact” and participatory exploration as a renewed approach to research action characterized by knowledge transfer and CAPS technologies implementation toward social innovation goal.
  • Urban M: Stimulating Innovation through Collaborative Maker Spaces (Interreg Europe). This project aims to identify good practices and policy recommendations to ensure that collaborative maker spaces thrive, providing a toolkit for public administrations from a multistakeholder approach.
The second step was the definition of a series of keywords related to digital fabrication tools and the search for the occurrences in the CORDIS and KEEP databases. If the CSM project is not found in the search, the list of keywords has been refined. As an example, in the very first stage, only the CORDIS database was included in the research. Then the absence of the Urban M Project redirects the research to include the KEEP database. Consequently, the keywords set were primarily defined during the research developed in the CORDIS database, secondary applied to the KEEP database, and adjusted with the CSM verification method, to be tertiary feedback to the CORDIS database.
Three categories of keywords were deducted. Firstly, the Maker Tool (MT) group includes the different declination of maker spaces and tools. Secondly, the Citizen Science Practices (CSP) class is oriented to citizen involvement in ICTs ecosystems. Finally, the Sustainable City Goal (SCG) category is focused on the concepts of urban resilience.
The final three category set of research keywords was:
  • Maker Tools (MT): Fab Lab (FL); Maker Space (MS); Digital Fabrication (DF).
  • Citizen Science Practices (CSP): Citizen Science (ICT, CS); DIY Science (DIYS); Smart Citizen (SCz).
  • Sustainable City Goal (SCG): Resilient City (RC); City Resilience (CR); ICT for Smart City (ICT, SC).
The third step was to apply the presence of the keywords in the project information included in the two project databases. A total of 148 projects were identified:
  • 100 CORDIS’ projects were developed between 2009 and 2020, of which 9 were under the FP7 framework and 91 under the H2020 programs frameworks.
  • 48 KEEP’s projects developed between 2012 and 2020, including Interreg, Interreg IPA cross-border, ENPI/ENI, and IPA-IPA cross-border programs.
The fourth step was to develop a subsequent detailed analysis of the 148 projects in order to characterize the projects that are effectively related to the aim of this work. The selection favored projects focusing on sustainable city development with a bottom-up approach, covering all the four categories defined by the resilient cities frameworks [19]: health and wellbeing, leadership and strategy, economy and society, infrastructure, and ecosystem. Therefore, several projects were discarded during the refined detailed analysis of the project.
The final dataset comprised 94 projects: 47 of those were selected from the CORDIS portal database and 47 more from the KEEP portal database (complete list in Appendix A).
The information on the selected projects was finally homogenized in order to obtain comparable datasets due to the differences between the information contained in both databases. On the one hand, the CORDIS database research offers just basic data; in addition to the ID and record number, acronym name, and date of start and end, it gives the program, teaser, URL, and EURO SCI Vol classification of disciplines. On the other hand, the KEEP database basic research offers a complete set of data, including the acronym, name, program, and date of start and end of the projects, the complete project’s partners’ data, and a separate analysis of calls including the same research keyword including date of start and end and budget. In order to obtain a significant dataset comparable between the two lists of projects selected, it was necessary to manually complete missing data, referring to the information contained in the OPEN EU DATA PORTAL database. CORDIS’ projects list dataset, for example, was completed with country participants and coordinator data, while the KEEP project list was integrated with additional information such as the topic of the program, objectives, participants, and coordinating countries.
The final dataset collection was defined to ensure the quantitative and qualitative analyses focused on the approach rather than the numerical impact. Consequently, the analyzed data lists were selected referring to their qualitative content potential. For example, data concerning the program, topic, as well as objective and description of the projects cover a high interest, while data concerning the budget are shown in the single project data sheets to offer a scale of reference of the project itself but not considered in terms of comparison or evaluation.
Due to the nature of the projects concerning the portals CORDIS and KEEP databases, two different data sheets were set to be as comparable as possible. The two final data sets included in the datasheet, showing the individual project evaluation, are presented in Table 1.

3.2. Methodology for Project Resilience Assessment

In order to research how digital fabrication tools are involved in the development of a resilient city, the set of 94 EU-funded projects selected according to their purpose of use considered tools applied to city sustainability improvement. They submitted to a resilience attitude analysis (RA). The RA analysis is based on grounded theory, one of the more common methods of analysis in qualitative research, extensively applied in the social sciences [74]. This deductive approach aims to discover “what is going on?” beyond the single projects from the analysis of the objectives of the projects rather than the results.
The RA evaluation refers to the qualitative analysis of projects’ resilient objectives and approaches rather than a quantitative resilient status evaluation that characterizes existing models, exemplified by the city resilience index [19]. As qualitative analysis, the RA evaluation aims to examine trends common to the European researcher/innovator community, afforded as much freedom as possible by establishing categories and classifications that inform the competitive call mechanism of the projects. In order to avoid a re-evaluation process of projects that have already reached the EU funds, the RA evaluation method was developed based on a deductive approach.
The RA evaluation analysis, which is a priori with respect to the outcomes of the projects, aims to assess the main characteristics that define the resilience of the project itself, with the ultimate goal of proposing a method of evaluating resilience attitude based on direct observation. This can allow evaluation and self-assessment of bottom-up experiences and encourage their implementation.
The RA evaluation indicators have been deducted from the project’s objectives text analysis by means of a decoding process and assessment process set in four stages:
  • Coding.
  • Conceptualization.
  • Categorization
  • Comparison
The coding was an in itinere process. Codes and sub-codes were found in the text and grouped ex-post during the conceptualization stage. Then, parameters were set, improving resilience and their antagonist, creating a restricted list of categories. The comparison stage required the transposition from qualitative to quantitative data, supported by specific software and a multicriteria analysis developed with Python coding.

3.2.1. Coding

The coding stage was developed through two main actions of text analysis:
  • Qualitative text decoding.
  • Incidence of significant terms.
The first was characterized by a deductive process that involved the project’s objective’s description token as a representative abstract of the entire project in the analysis. The analysis underlined recurrent topics related to city resilience, digital tools, and participation in parallel with the topic evidenced in the state-of-the-art analysis. Each theme was assigned a subcode.
The result of the analysis led to the codification of the objectives of each project in fragments of text attributed to one or more subcodes. The sentence was considered the minimum element in order to safeguard the logical context of each code analyzed and avoid the fragmentation of meaning and decontextualization. Such a minimum quantum of analysis led to the repeated overlapping of several codes on the same unit of text, also depending on the style of writing and the complexity of the objectives themselves. The following key topics emerged as results of the Qualitative texts decoding action of the 94 texts analyzed:
Bottom Up, Citizen Engagement, Citizen Science, Co-Creation, Community, Digital Fabrication, Implementation, Making Sense, Market Oriented, Multistakeholder, Network, New Tool, Open Innovation, Optimization, Platform, Problem Solving, Professional, Replicability, Resilience, Site Specific, Smart City, Social Innovation, Sustainability Oriented, Top-Down, Trans-Disciplinary, Urban Efficiency.
Additionally, an analysis of the most cited keywords related to the topic in the Scopus database (search “TITLE-ABS-KEY (“smart city” OR resilience AND “digital fabrication” OR “citizen science” OR “social innovation”)” with 318 results between 2012 and 2020) led to the inclusion of
Citizen, Education, Energy District, Energy Efficiency, Government, Industry, Infrastructures, Lab, Mobility, Open Spaces, Participation, Policy, Scenario, Service, Smart Grids, Sustainability, Tool.

3.2.2. Conceptualization

The code’s system, counting on 43 sub-codes, 26 of which were deducted from the text analysis and 17 implemented from the bibliographic analysis of keywords recurrence, was re-arranged under twelve codes, respectively, linked to three main topics derived from the reliance’s concepts parameter of inclusiveness, complexity, and durability (as presented in Table 2).
This conceptualization aligned with other works, as the city resilience index [19] is reflected in parts of the framework, as suggested by those overturning their perspective. For the goals categorization, the aim of the RA analysis was to evaluate the seven qualities of resilient systems (reflectiveness, robustness, redundancy, flexibility, resourcefulness, inclusiveness, integrations) re-arranged under the three main topics suggested as parameters affecting the “who” (inclusiveness), the “how” (complexity), and the “how long” (durability) resilient action systems are planned. The re-arrangement was driven on the one hand by the absence of some of the seven qualities, for example, robustness, recorded during the deductive process of analysis, due to the nature of the project analyzed, and on the other hand, by the aim of making the future categorization as much as possible easily affordable for the general public.
Two indicators are defined by a pair of “antagonistic” sub-indicators to each of the three main topics. Each sub-indicator compounding an indicator pair was identified as the limit of the domain of the indicator itself, corresponding to a variable number of sub-codes as variables.
Along with the conceptualization process that was brought from the code system to the indicators system, the incidence of key terms was arranged according to the bibliographic cluster analysis, depending on clusters belonging to one of the antagonist codes or indicators pair deducted from the qualitative analysis. This process resulted in a heterogeneous distribution of the sub-codes due to the preliminary selection of the projects themselves. The overall codification is presented in Figure 2.

3.2.3. Categorization

The categorization process took into analysis the opposing indicators considering each pair as a dichotomic variable: urban quality-community (URB-COM); professional_co-design (PRO-CO); problem solving_making sense (SOLV-SENS); site-specific_global network (SITE-NET); optimization_implementation (OPT-IMP) and market oriented_sustainability oriented (MARK-SUS). The cross-comparison of the dichotomic variables underlined three significant scenarios of categorization based on the very nature of the deducted variables: design modes, goals, and tools.
The three scenarios were analyzed by means of a project’s mapping process having dichotomic variables as axes of two-dimensional spaces. The graphical analysis refers to a two-dimensional space divided into four sectors by the two dichotomic variable axes. Each half-axe defines an indicator value, respectively, positives or negatives corresponding with the positive or negative contribution to general resilience.
The first of these analyses explicitly refers to the classification proposed by E. Manzini (in design when everybody designs) as design mode mapping, which defines a vertical axis of convergence of emerging cultures [75]. The second analysis aims to map goal distribution by identifying a central axe corresponding with the smart city and community EU program topic. The third analysis affords the tool application mode defining a glocalism axis of equilibrium.

Design Mode Categorization

The design mode map (Figure 3) is used to analyze the indicator systems from a design perspective, relating the PRO-CO dichotomic indicator with the SOLV-SENS one. The four sectors defined correspond to many macro design attitudes defined as: served, referring to top-down solutions (problem-solving-professional sector); participation, referring to participation practices (professional_making-sense sector); DIY, referring to bottom-up actions (problem-solving co-design sector); and DIWCo, referring to community-based bottom-up actions as the new scenario of systematization of bottom-up practices as a participation tool that involves the making practices as inhabiting expression (co-design_making sense sector).

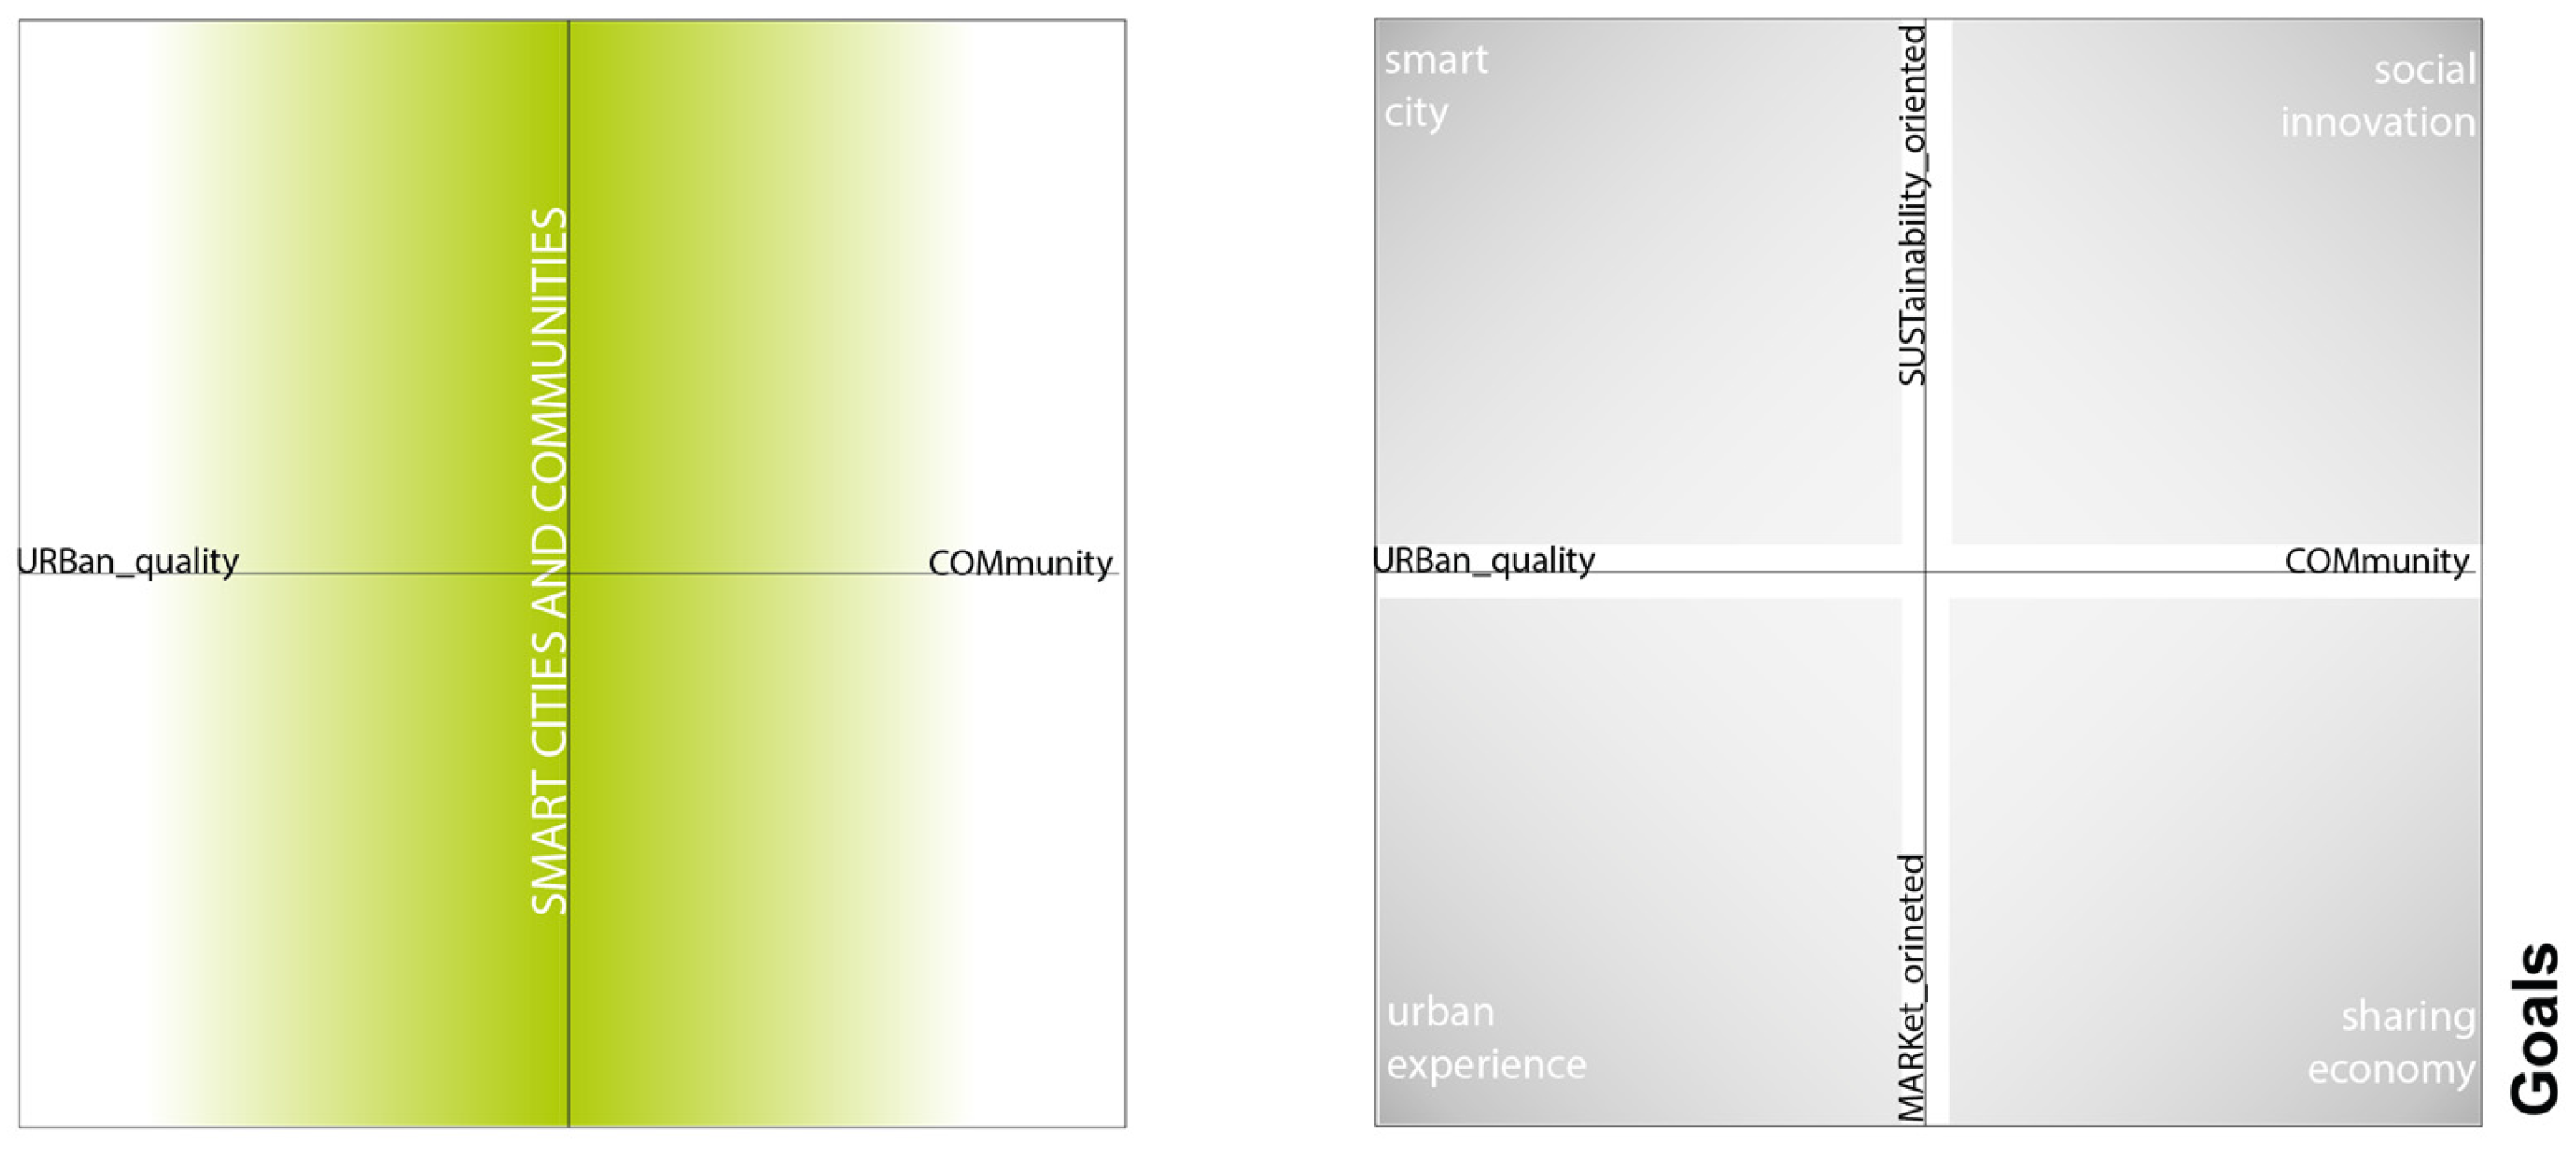
Goals Categorization

The second analysis focuses on the projects’ goals, investigating the relation between the URB-COM and MARK-SUS dichotomic variables (Figure 4). The four sectors defined correspond with the known field of experimentation: the smart city (urban quality_sustainability), urban experience (urban quality_market), sharing economy (market_community), and social innovation (sustainability_community sector).

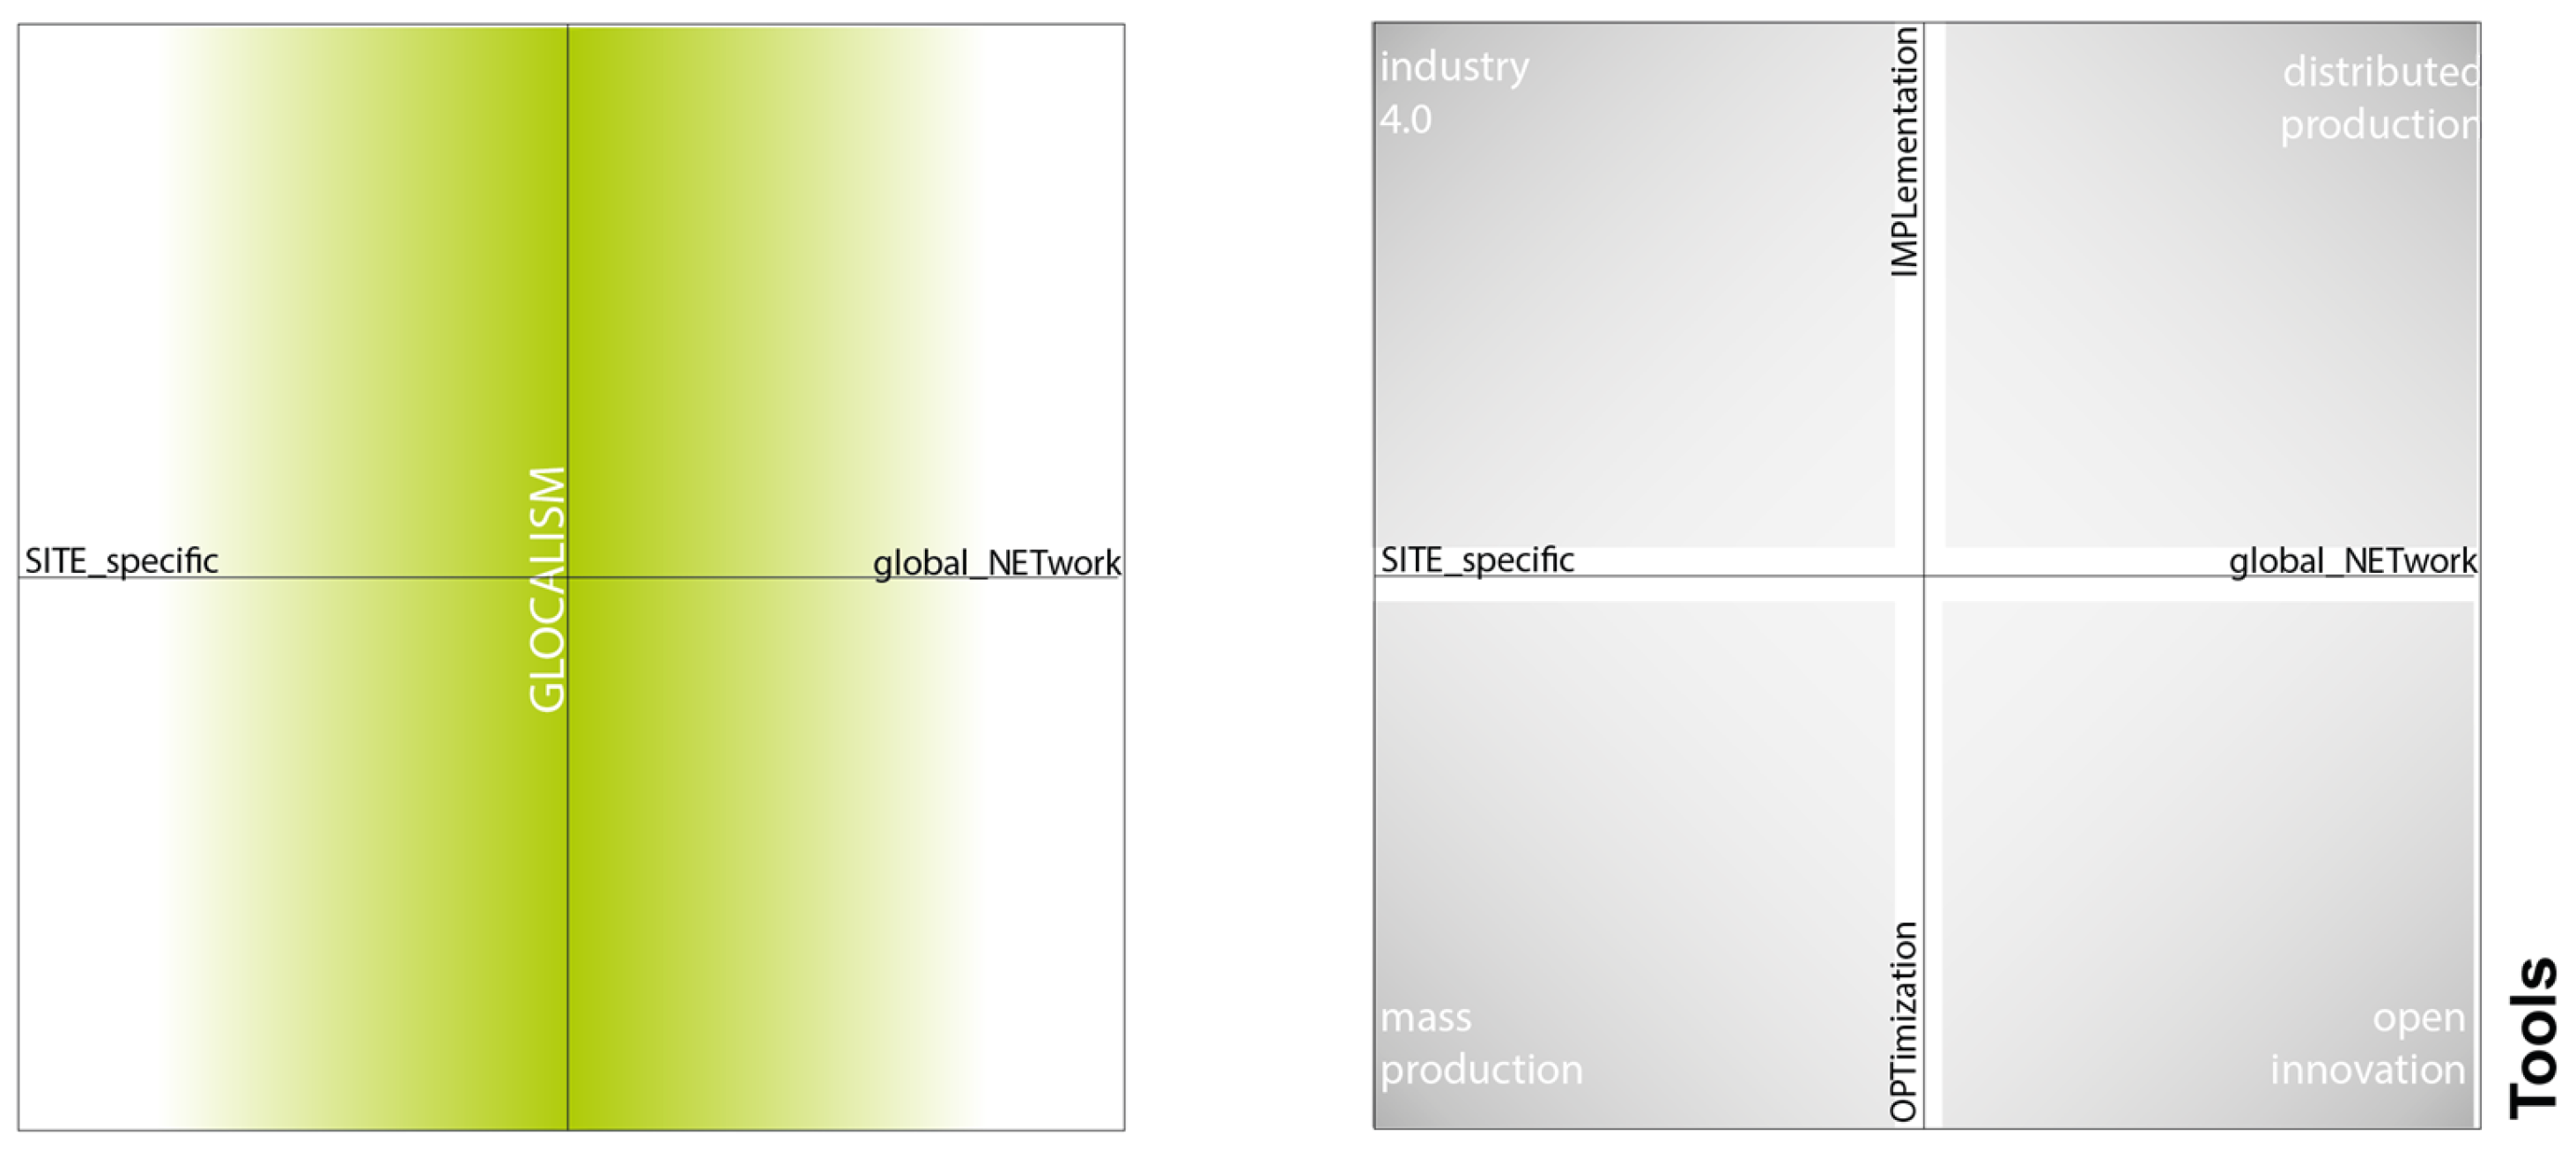
Tools Categorization

The third analysis considers the tool’s application perspective, focusing on the SITE-NET and OPT-IMP dichotomic variables. Figure 5 shows four sectors corresponding to productive models: mass production (site-specific_optimization), industry 4.0 (site-specific implementation), open innovation (optimization_global network), and a scenario of distributed production characterized by global network and implementation.

3.2.4. Comparison

The last step of this methodology is to develop a quantitative analysis from the qualitative information included in the project databases (mainly objectives and description). Specifically, a grounded theory analysis using the commercial software MAXQDA, v. 2020, was carried out.
Using MAXQDA 2020 software, each coded fragment was assigned a numerical value corresponding to the portion of text devoted to the specific variable under examination, measured in the number of characters. This software, developed for grounded theory application and improved for literature review analysis, was chosen to manage the relevant datasets, including extended text qualitative evaluation tools for the decoding process, quantitative evaluation, and word frequency function.
The coding process was developed by taking the sentence as a minimum fragment of text analyzable in order to prevent decontextualization and meaning loss. This minimum fragment unit, (F), resulted from the quality analysis and was the object of a quantification transposition based on the characters count (Fsc, Fkc) using specific software and then manually combined and normalized as described by the following functions:
  • Fsc = number of characters contained in unit F dedicated to subcode [s] belonging to code [c];
  • Fkc = number of characters contained in unit F containing the keyword [k] belonging to the code [c];
  • Xc = f (Fsc,Fkc) = Fsci + Fkci = number of characters contained in the fragments: Fkc1 + … Fkc2 + Fsc1 … Fsc2 ….
For the purpose of comparing projects with a different amount of text, the quantitative data were normalized by analyzing the percentage values of each code in proportion to the sum of the encoding values of the entire text analysis,
Xcn = Xc/Xt·100
Xt = (i = 1, 2, …, 12) Xci
These values were then remapped to ensure that the domain of each code variable was between 0 and 1
Xcm = Xcn/Xcn,max
For resilience assessment purposes, each pair of antagonistic codes was assigned a positive or negative value depending on its positive or negative contribution to project resilience. Based on the literature study and resilient thinking principles, these value judgments were evaluated.
Xcm = Xr = Xcr·1
Xcm = Xa = Xca·(−1)
In order to develop the categorization analysis, three two-dimensional mappings were developed, and each showed two dichotomic variables (n), represented by the numerical value (Cn) corresponding to four indicators respectively associated to a resilient code’s value (Cnr) and its antagonist code value (Cna)
Cn = Cnr − Can
Design mode dichotomic variables definitions:
Xdm [Solving-Sensing]; Ydm [Pro-CO];
Xdm = Cdm(r,a) = Cdmr − Cdma = C3 − C9 = V1
Ydm = Cdm(r,a) = Cdmr − Cdma = C2 − C8 = V2
Goal dichotomic variables definitions:
Xg [Urb-Comm]; Yg [Mark-Sus];
Xg = Cg(r,a) = Cgr − Cga = C1 − C7 = V4
Yg = Cg(r,a) = Cgr − Cga = C6 − C12 = V3
Tools dichotomic variables definitions:
Xt [Site-Net]; Yt [Opt-Imp];
Xt = Ct(r,a) = Ctr − Cta = C4 − C10 = V5
Yt = Ct(r,a) = Ctr − Cta = C5 − C11 = V6

4. Results and Discussions

4.1. General Information

The first overview of the collected data set (summarized in Figure 6) correlates the distribution of projects across the European territory belonging to the H2020-FP7 framework programs (listed in the right-hand image) and INTERREG (listed in the left-hand column), respectively, with the search keywords (arranged in the bottom line).

4.1.1. Geographical Analysis

On the one hand, the coordination of H2020 projects is heterogeneously distributed. The most represented country is Spain, coordinating 18 projects, followed by the UK (12 projects), the Netherlands (10 projects), Greece (9 projects), Denmark and Italy (7 projects), and France, Finland, and Germany (6 projects each).
On the other hand, due to the regional scale of the INTERREG program, the projects are proportionally distributed within the European countries (with three projects coordinated per country on average). The most prolific country of the Interreg projects recorded was Italy (IT), coordinating 7 projects and collaborating as a partner in other 40 projects.

4.1.2. Analysis by Keywords

The analysis of keywords presents a strong polarization as a function of the funding scheme program. The ICT keyword is the more represented keyword and is equally linked with H2020 and Interreg projects. The H2020 projects seem to be more related to Citizen Science Practices (CSP) keywords (i.e., CS), whilst Interreg projects present a stronger correlation with Sustainable City Goal (SCG) keywords (i.e., RC and CR). Finally, a further reflection is required by the MT category that looks to be mostly present in the H2020 projects despite the identification of DF and MS keywords in specific Interreg calls, which did not correspond to projects presenting the same keywords.
Insight into the more specific keywords shows that: the DITOs project, coordinated by the UK, was the only one corresponding to the DIYs keyword. Six projects responding to the SCz keyword have been identified, one corresponding to the INTERREG program, the ACE project coordinated by France, and four corresponding to the H2020 program framework, respectively coordinated by UK ES IE BE, GROW, iSCAPE, REPLICATE, and Making Sense.
Preliminary observation of the projects’ basic data set has shown a non-direct relation between the discipline’s keywords, citizen science, smart city, and ICT, with the properly dedicated call topic of ISSI, SCC, and ICT. Moreover, it highlighted that keywords registered in the Interreg call did not correspond to the relative project’s purposes.

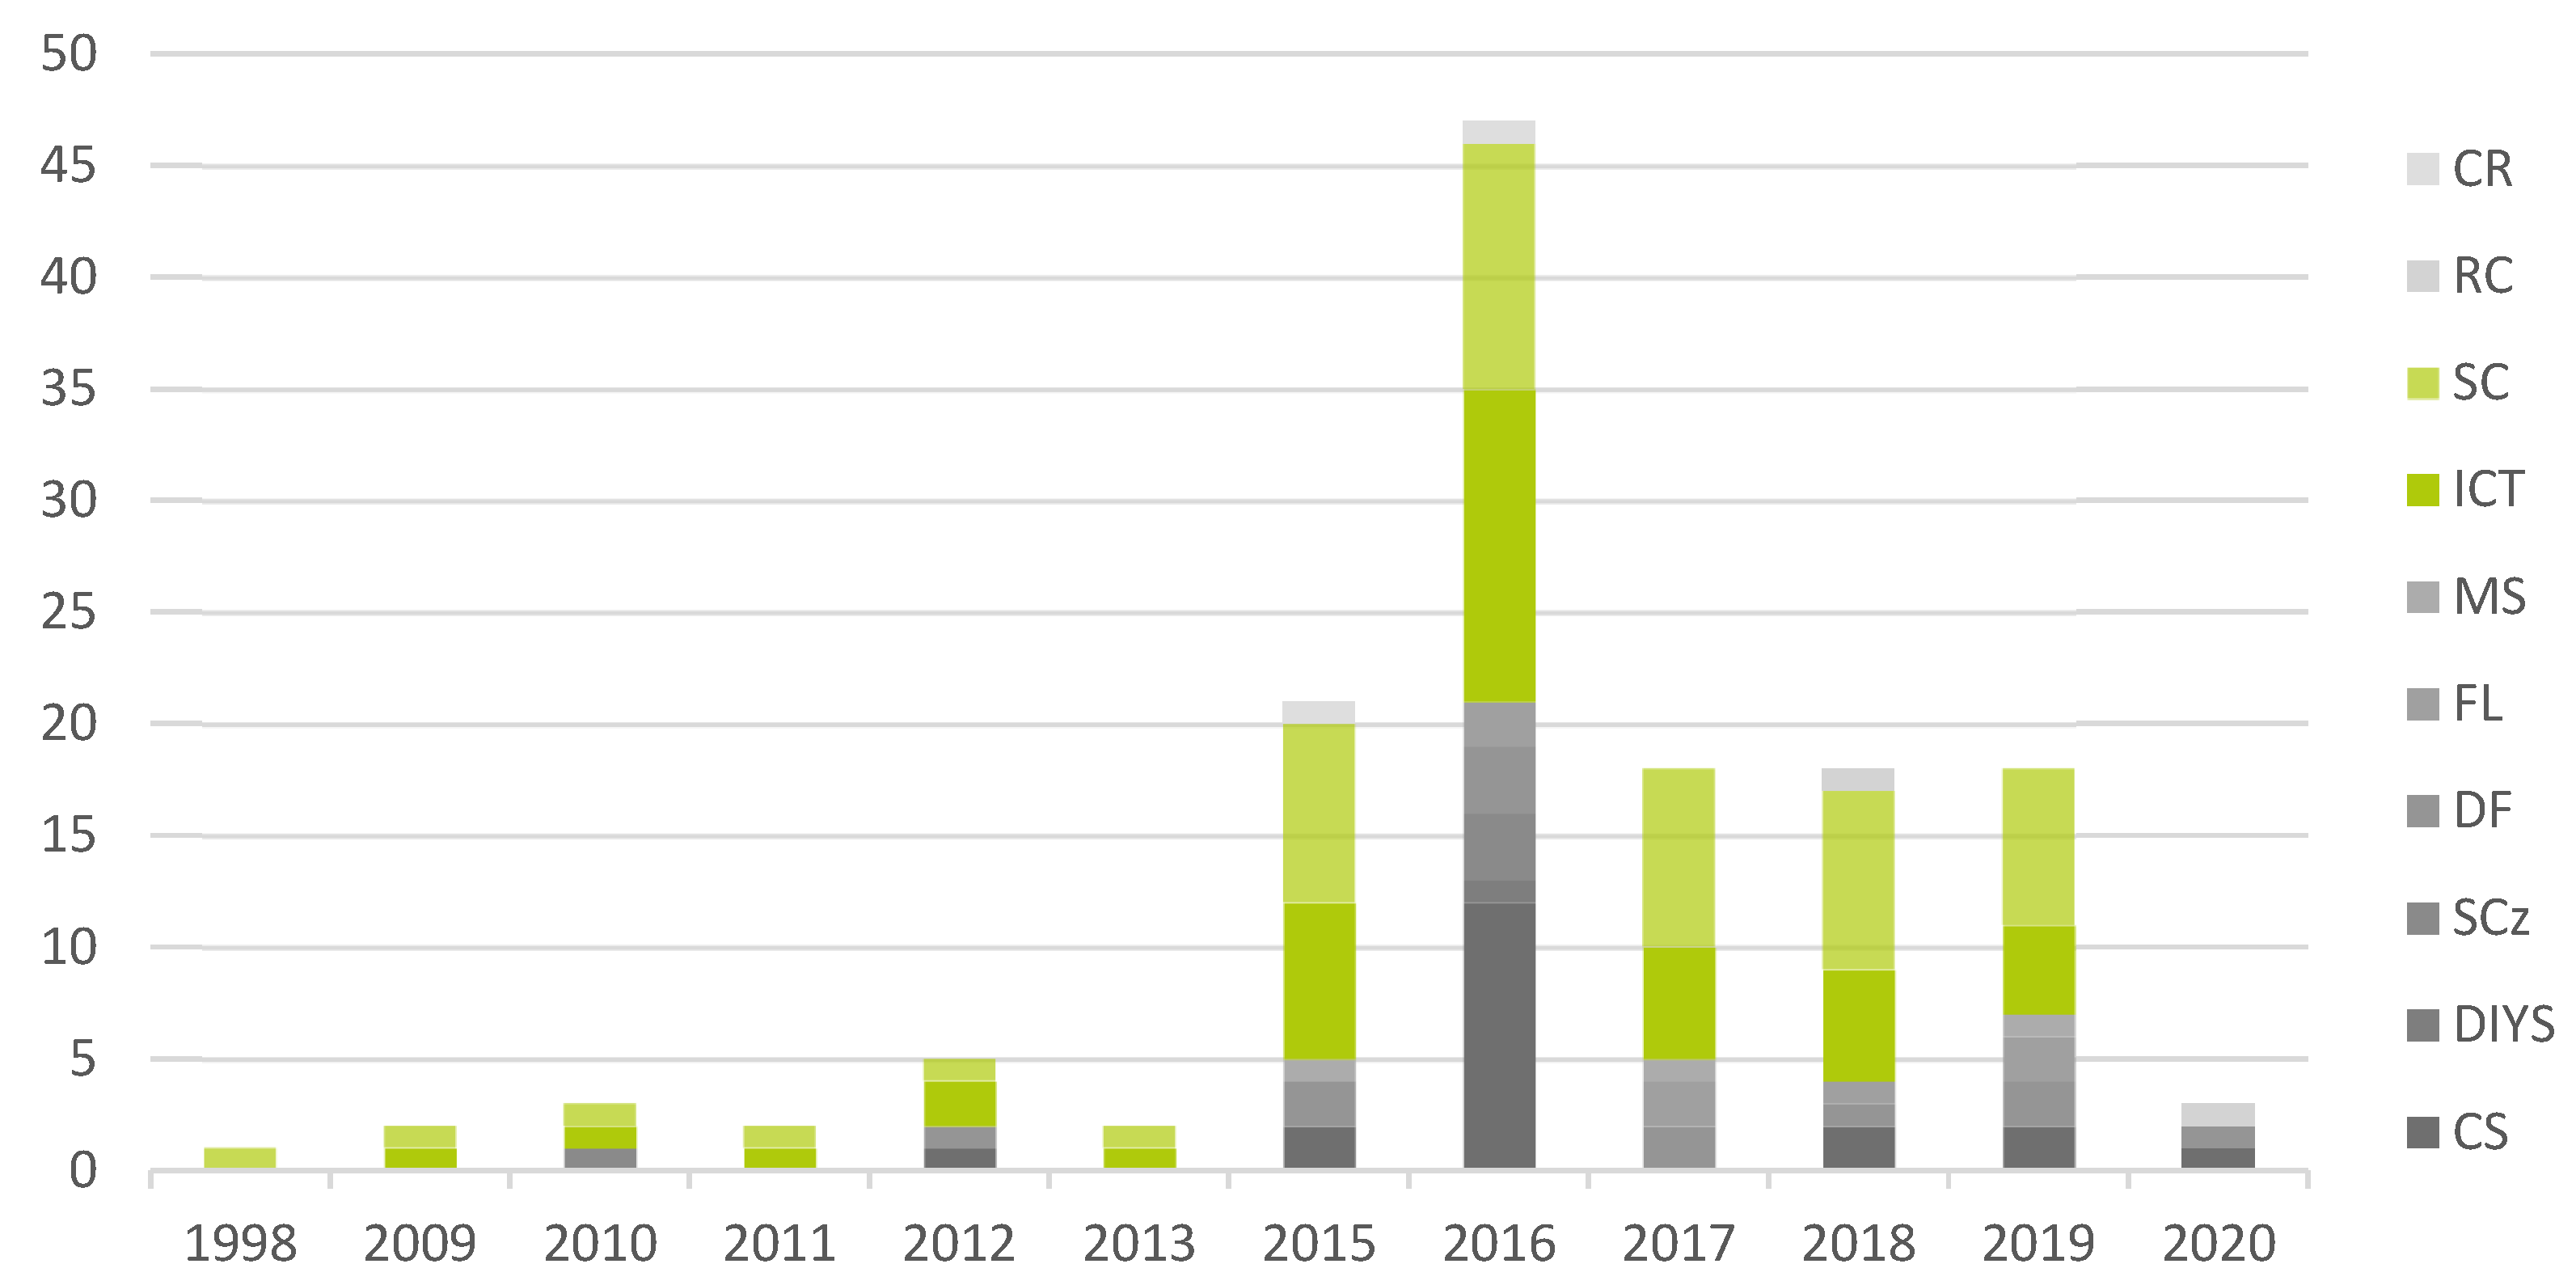
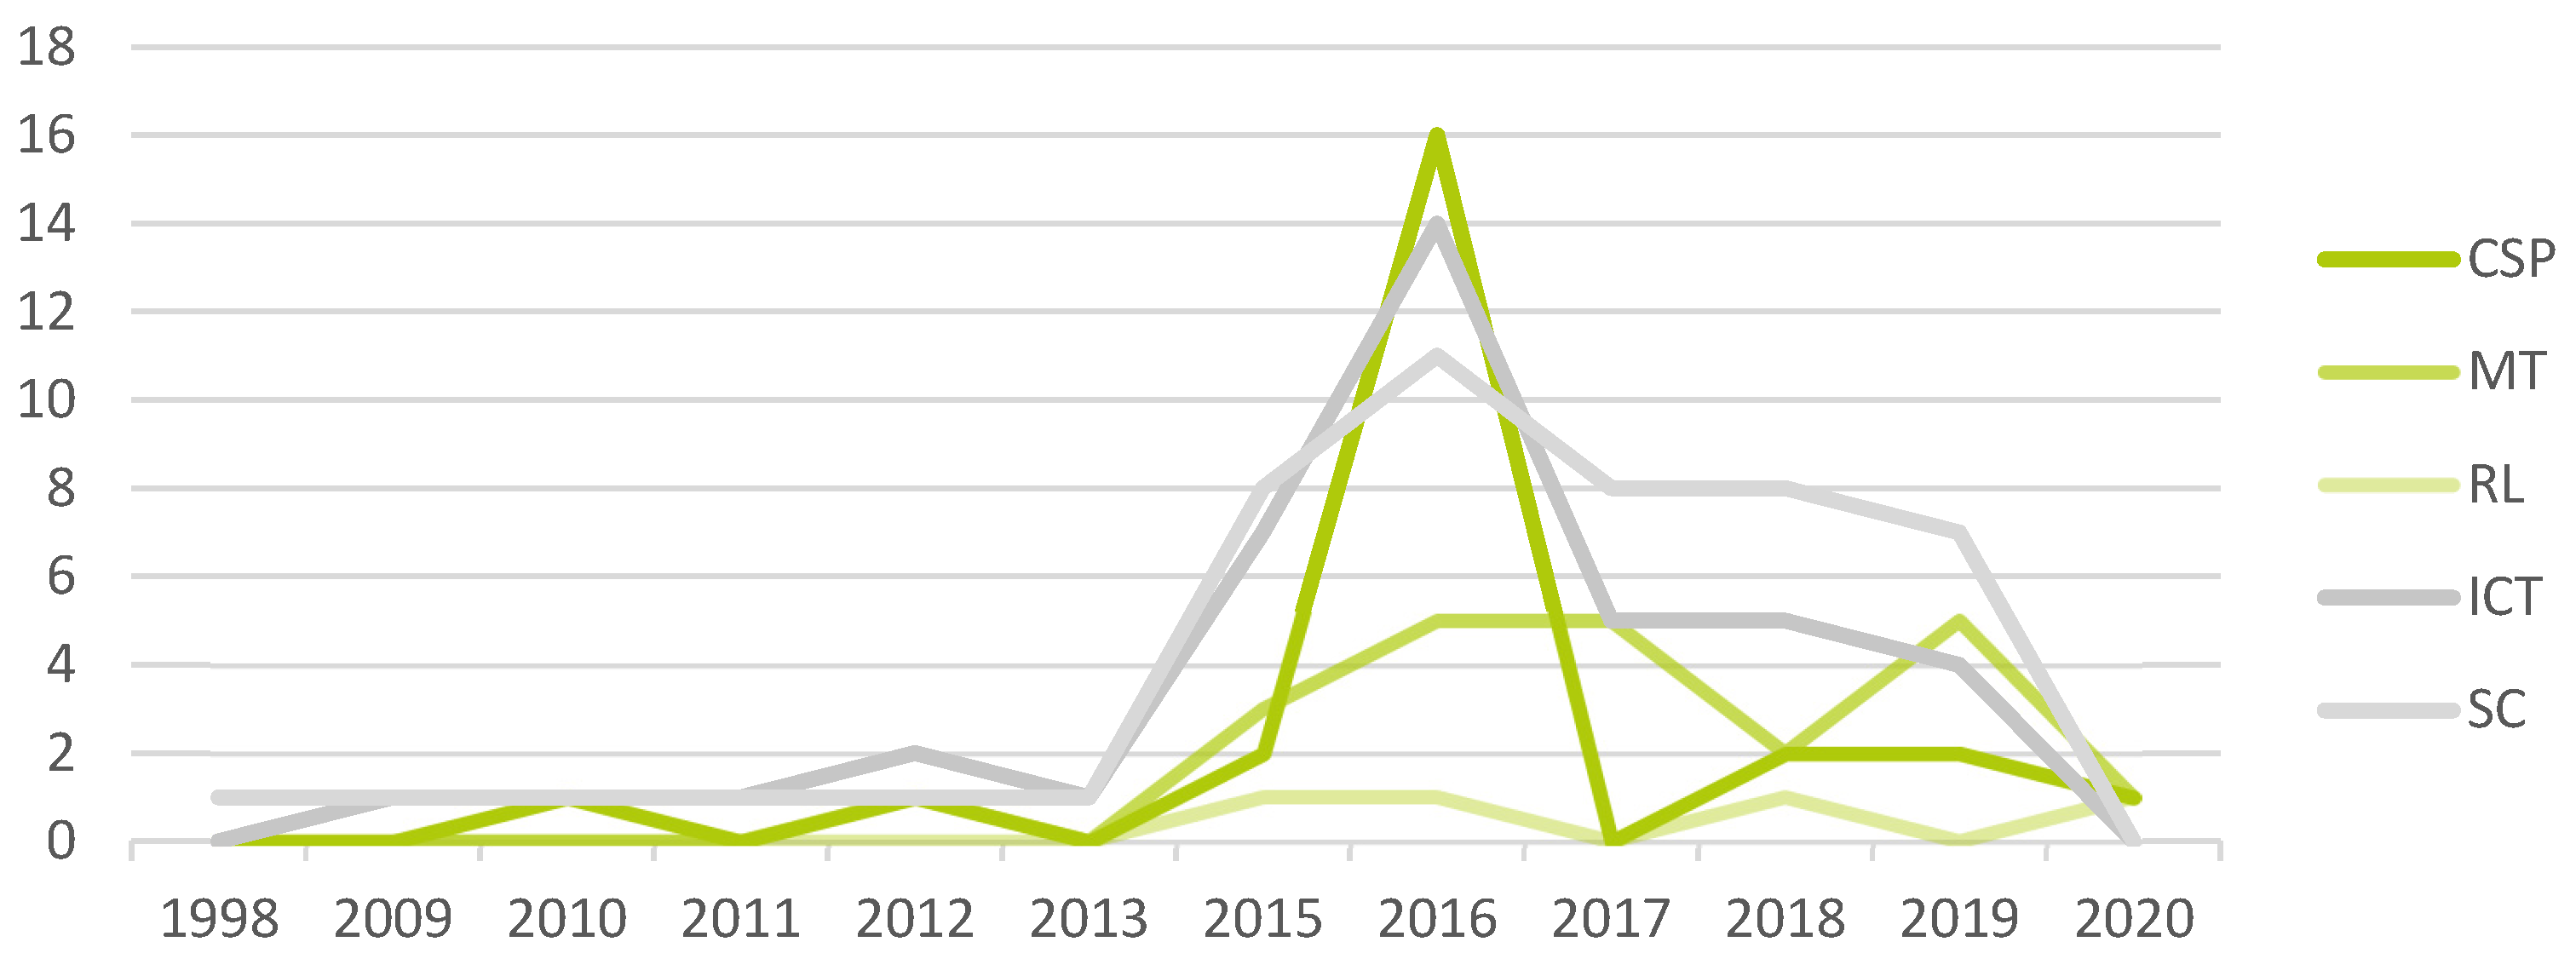
4.1.3. Temporal Analysis

The analysis of keyword incidence has been evaluated in relation to the starting years of the projects, as presented in Figure 7.
The starting time analysis shows the projects’ distribution over 22 years, from 1998, starting year of the EcoBusiness Plan Danube Interreg project, to 2020, starting year of the last H2020 project analyzed, CENTRINNO.
Time distribution shows an increasing number of projects starting from 2013, with a peak in 2016 with some relevant evolution of key terms incidence. Firstly, there was a constant presence of ICT and SC terms with exponential growth ending in 2016, followed by a slow degrowth, corresponding with the emergence of the resilient city and city resilience terms. Secondly, the DF term occurrence started in 2012, while MS and FL onset was in 2015 and 2016, mostly as a synonym. Thirdly, the CS term appeared in 2012, mostly following the same growth of ICT, while SCz appeared episodically in 2010 and then in 2016, jointly with DIYS.
The previous analysis suggests re-arranging part of the keywords in the three additional macro sets:
-
Maker Tools set (MT): including Digital fabrication (DF), FabLab (FL), Maker Space (MS), terms;
-
Citizen Scientist Practices set (CSP): including Citizen Science (CS), DIYscience (DIYS), and Smart Citizen (SCz);
-
Resilience Living set (RL): including City Resilience (CR) and Resilient City (RC).
The incidence of the new set of keywords re-evaluated in relation to time is presented in Figure 8:
The last basic data set analysis indicates that resilience-related terms are progressively substituting the smart-city term centrality, especially under the spotlight of the sanitary emergency. Maker tool-related terms have been following the citizen science practices wave since 2016, presenting a variable trend converging to CSP and resilience-related terms.
ICT terms have a constant presence, as well as city-related terms, and are inherent with the study foundation itself, as so can be simplified from the following analysis.
A second stage of data overviews analyzed separately the two collections of projects proceeding from the CORDIS and KEEP databases, linking them with keywords and with the respective list of calls and founding schemes identified. Both analyses have marked fragmentation within calls, with a comparable number of calls for each program (33 different calls for CORDIS and 24 different programs coming from KEEP) and only 2% of those concerning more than one project.

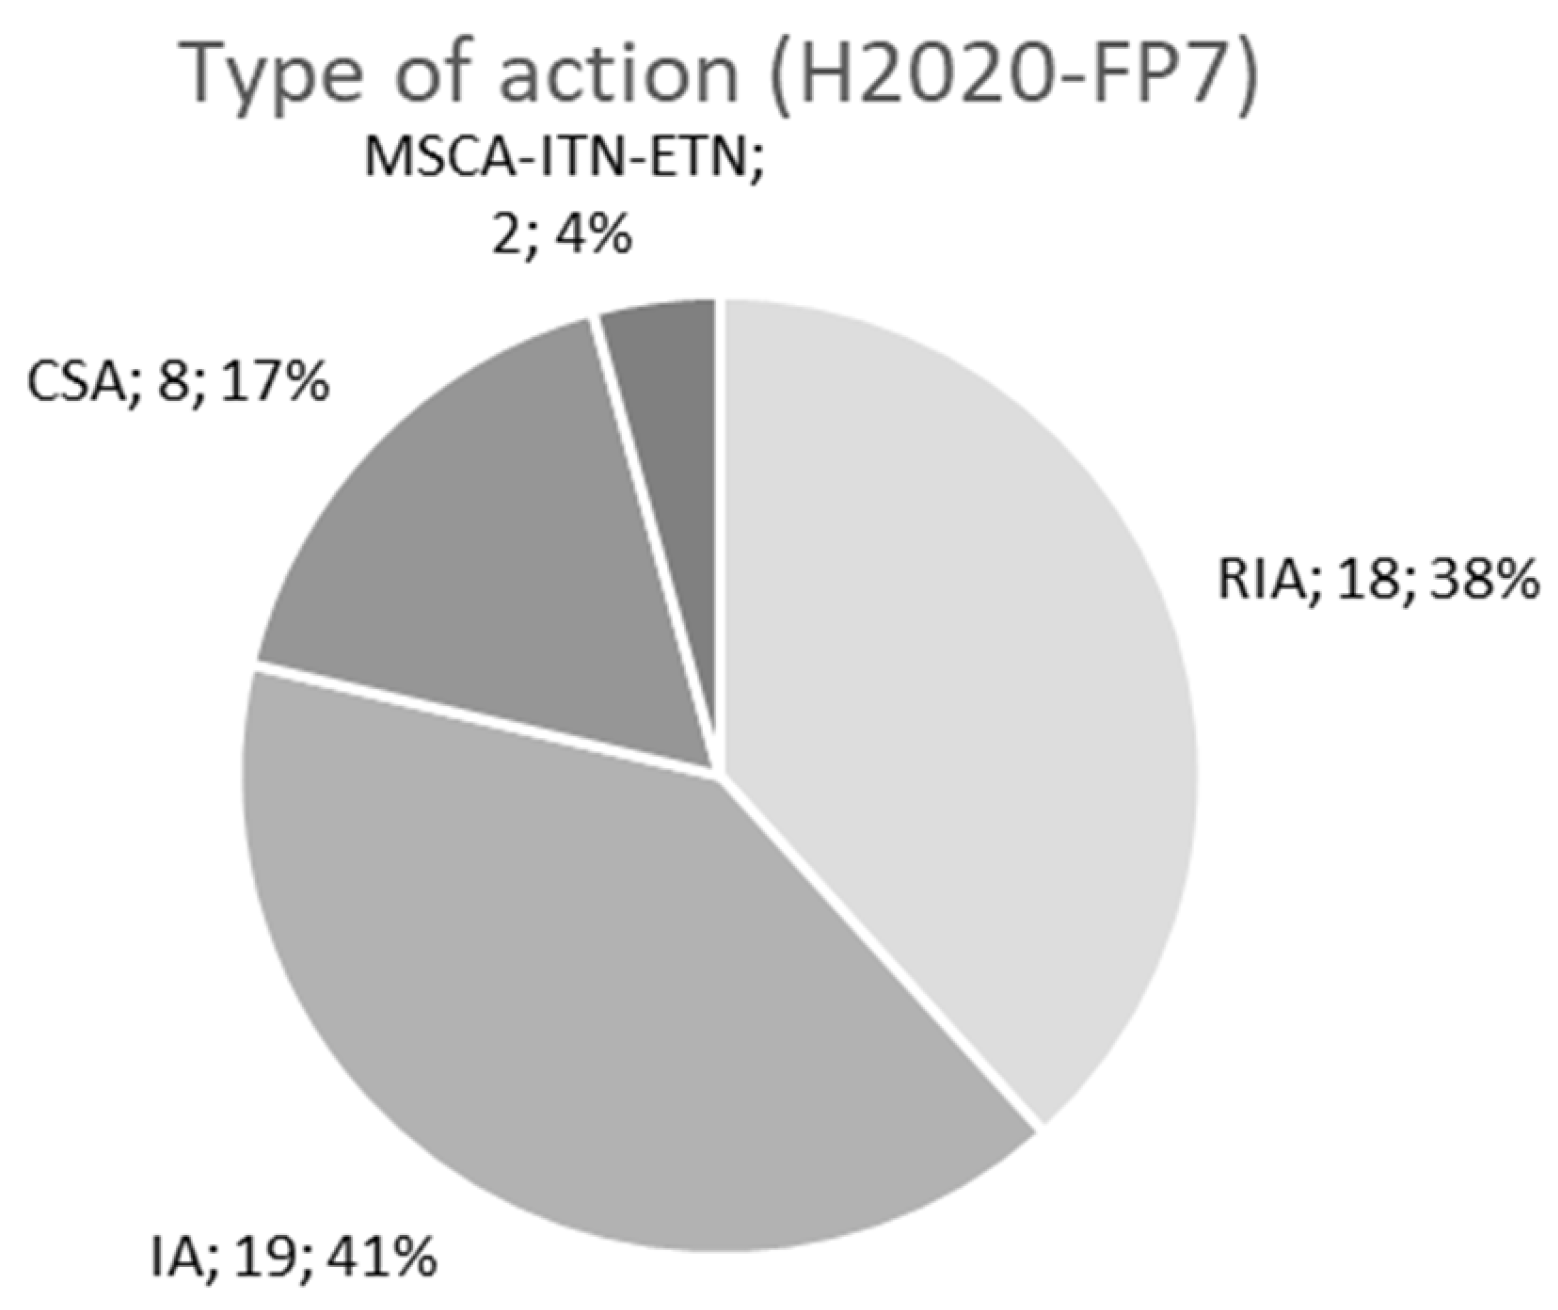
4.1.4. CORDIS (H2020 and FP7) Projects Analysis

The whole collection of 47 projects selected from the CORDIS database includes three projects concerning the three different calls of the FP7 project framework and 43 projects concerning 28 more H2020 framework program calls themselves belonging to four main topics: ICT (Information and Communication Technologies), SC5 (Societal Challenge 5_Climate action, environment, resource efficiency, and raw materials), SCC (Smart City and Community) and ISSI (Integrating Society in Science and Innovation). Several of the fifteen H2020 projects concerned the ICT topic; the ICT-10-2015 call involved six projects, and ICT-11-2017-1, ICT-11-2016-1, and ICT-11-2014-1 involved a medium of three projects for each call. ISSI and SC5 involve two and six projects through two calls each, i.e., ISSI-2014-1 and ISSI-2015-1, and SC5-2015 and SC5-2019-2. The SCC topic involved seven projects distributed on four calls for two projects: SCC-01-2014, SCC-2016, SCC-2017, and SCC-01-2015. The remaining projects are distributed on 18 more calls.
The calls analysis extended to the funding scheme evidence comparable fragmentation is presented in Figure 9. The 47 projects’ results balanced are between RIA and IA actions, respectively, 38% and 41%, and the remaining part is divided within CSA (17%) and MSC-ITN-ETN 4%.
Insight into the projects underlines that only the DITOs project corresponds to the DIYS keyword, while GROW, iSCAPE, REPLICATE, and Making Sense involve the SCz keyword. The older project, TAYLORCRETE, was coordinated by DK, while the newer CENTRINNO and GOLIATH were coordinated by IT. Projects coordinated by FI and FR always include CS keywords. NL and DE involved ICT SC CS and DF keywords, while EL has no projects involving DF keywords.

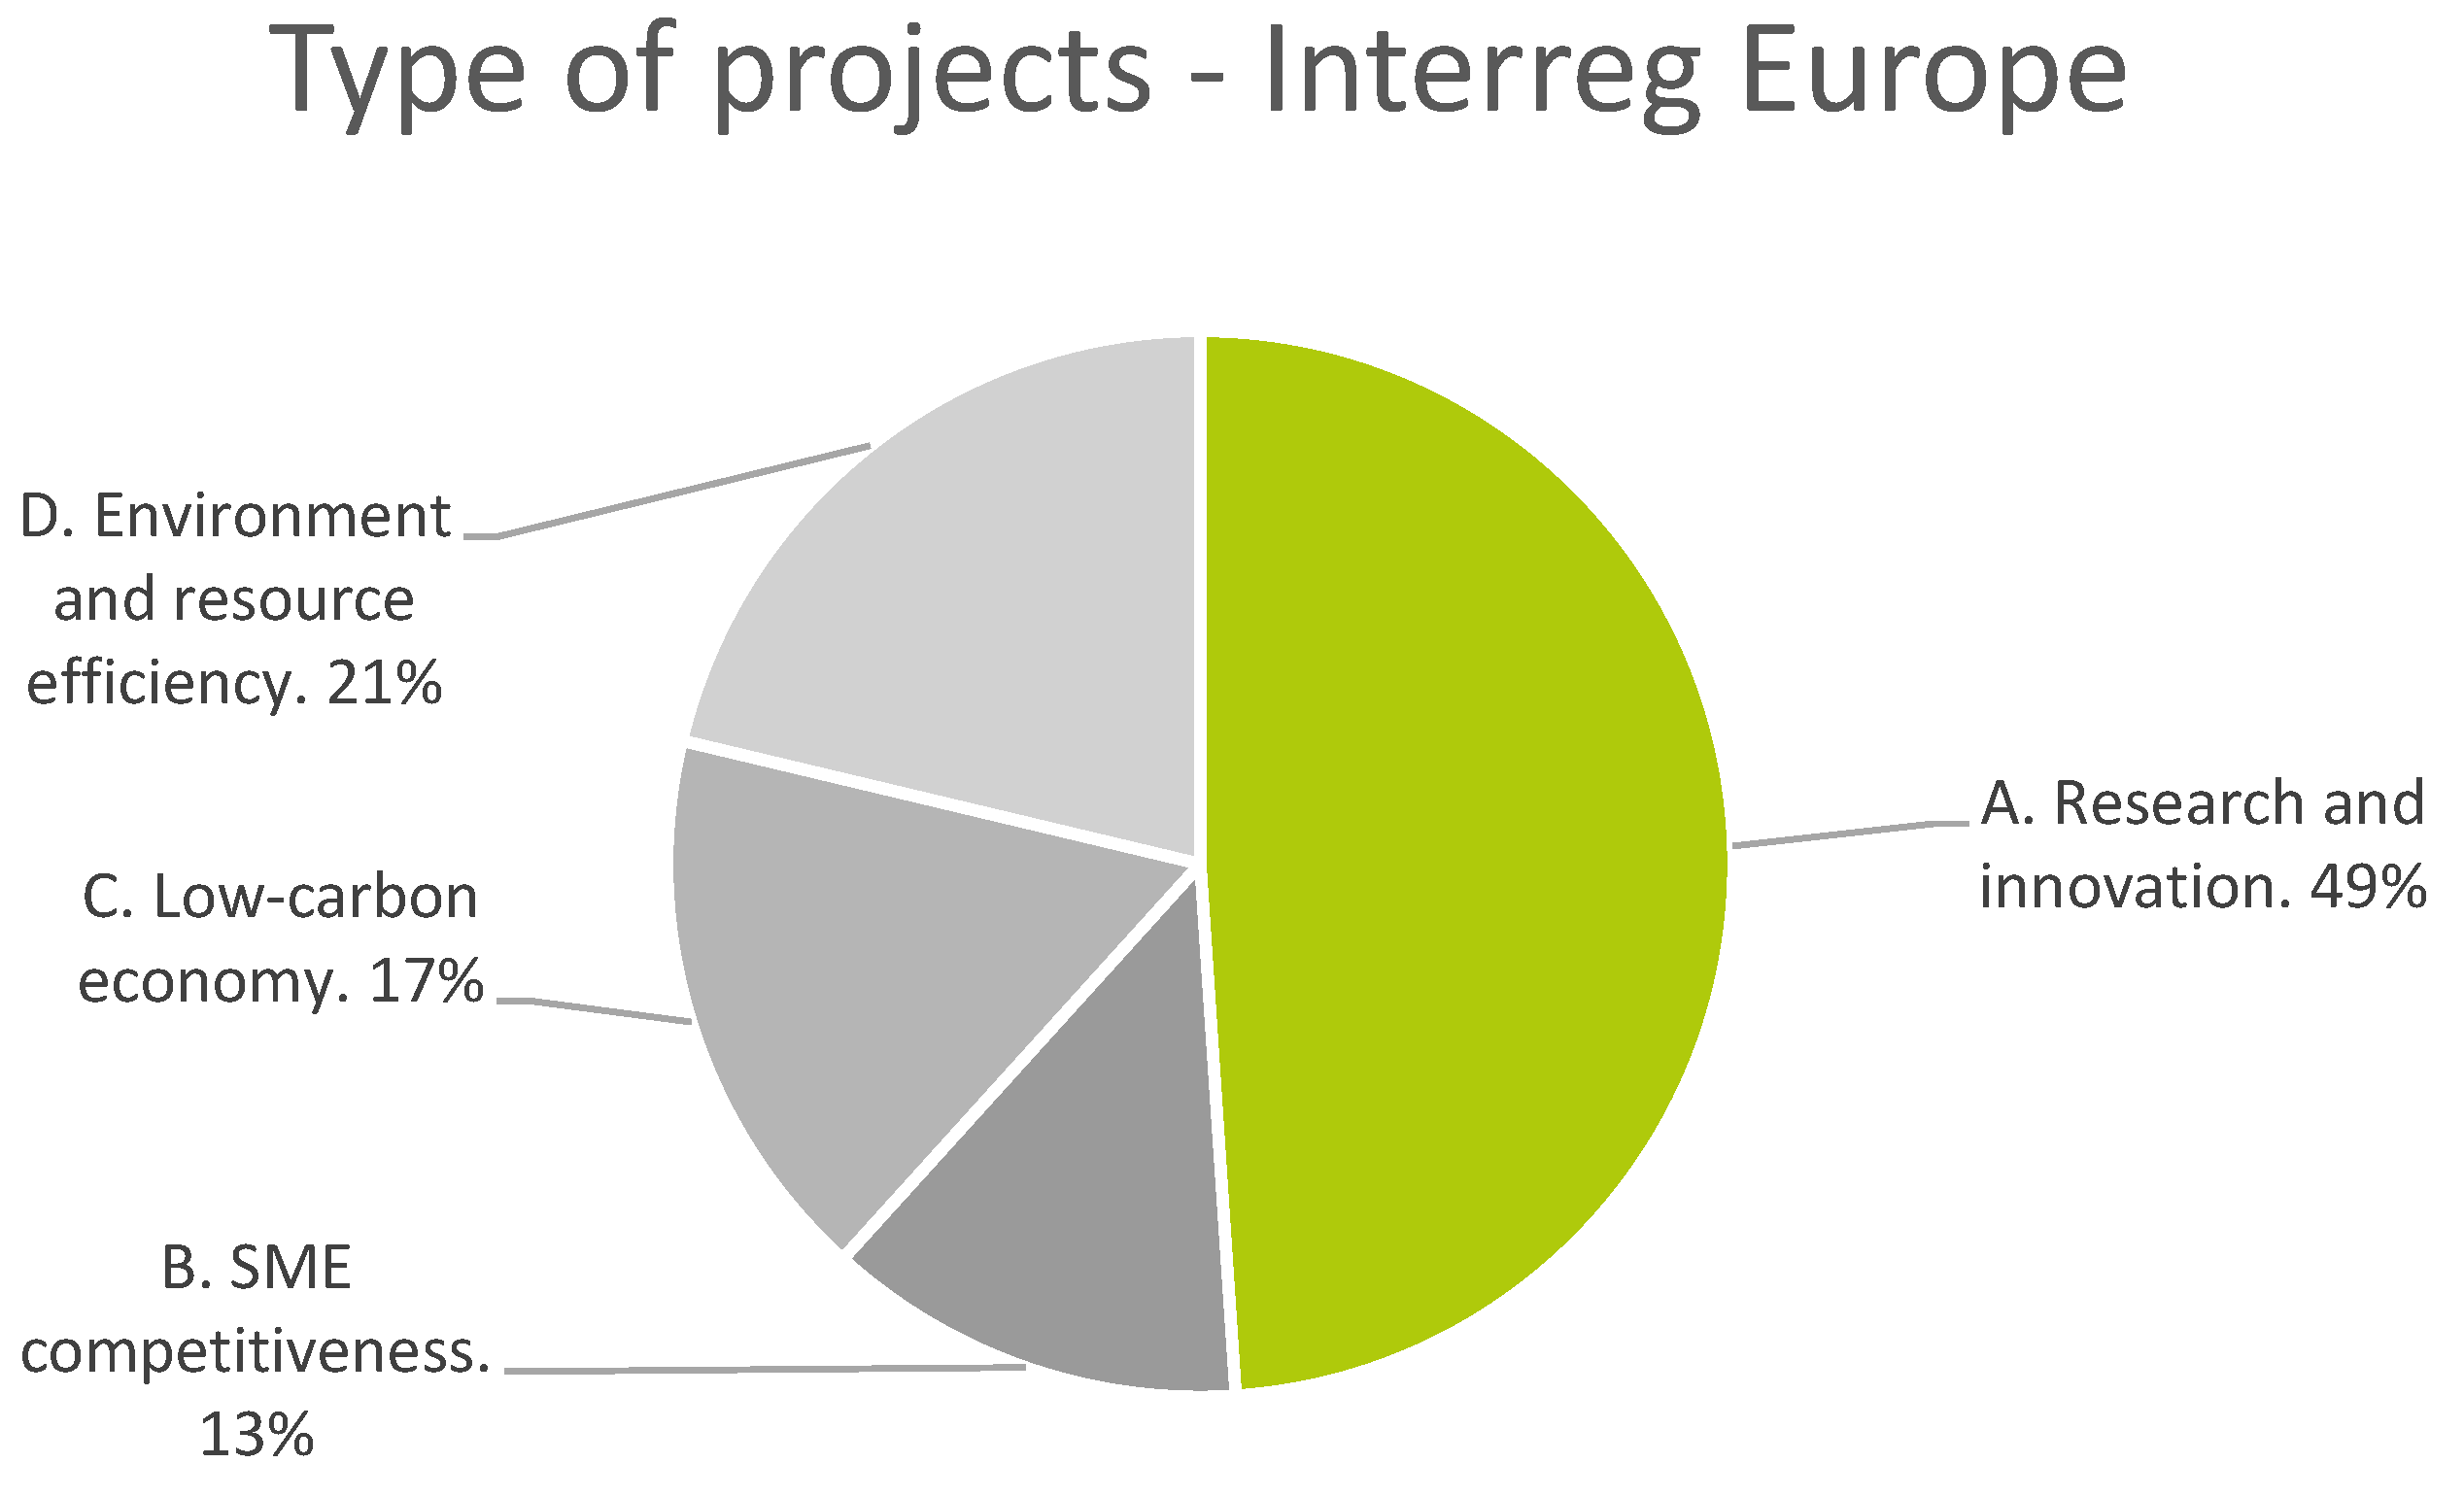
4.1.5. Interreg Projects Analysis

The 47 projects’ collection results are homogeneously distributed under 24 different programs in 7 categories (see Table 3 and Figure 10), with little prevalence for the URBACT III 2014–2020. The specific action analysis identified the dominance of research and Innovation actions which belong to 49% of the selected projects, while environment and resource efficiency action characterized 21% of the projects, low carbon economy 17%, and SME competitiveness 13%.
Insight into the projects shows that most of the Interreg projects selected involve the SC keyword and the SCz keyword; when present, it is used as synonymous with SC rather than CS practices.
MT category keywords have been recorded in the INTERREG VB North Sea alone and the Interreg EUROPE, and the Interreg VB central Europe and Interreg IPA CBC Croatia-Serbia programs. It corresponds to five projects, each belonging to a different program.
Furthermore, the CS keyword is involved in just four projects, and the DIYS keyword is not represented. It has not been identified in any projects involving both CS and SC keywords or the city resilience and resilient city keywords with any other keywords.

4.2. Assessment of the Projects

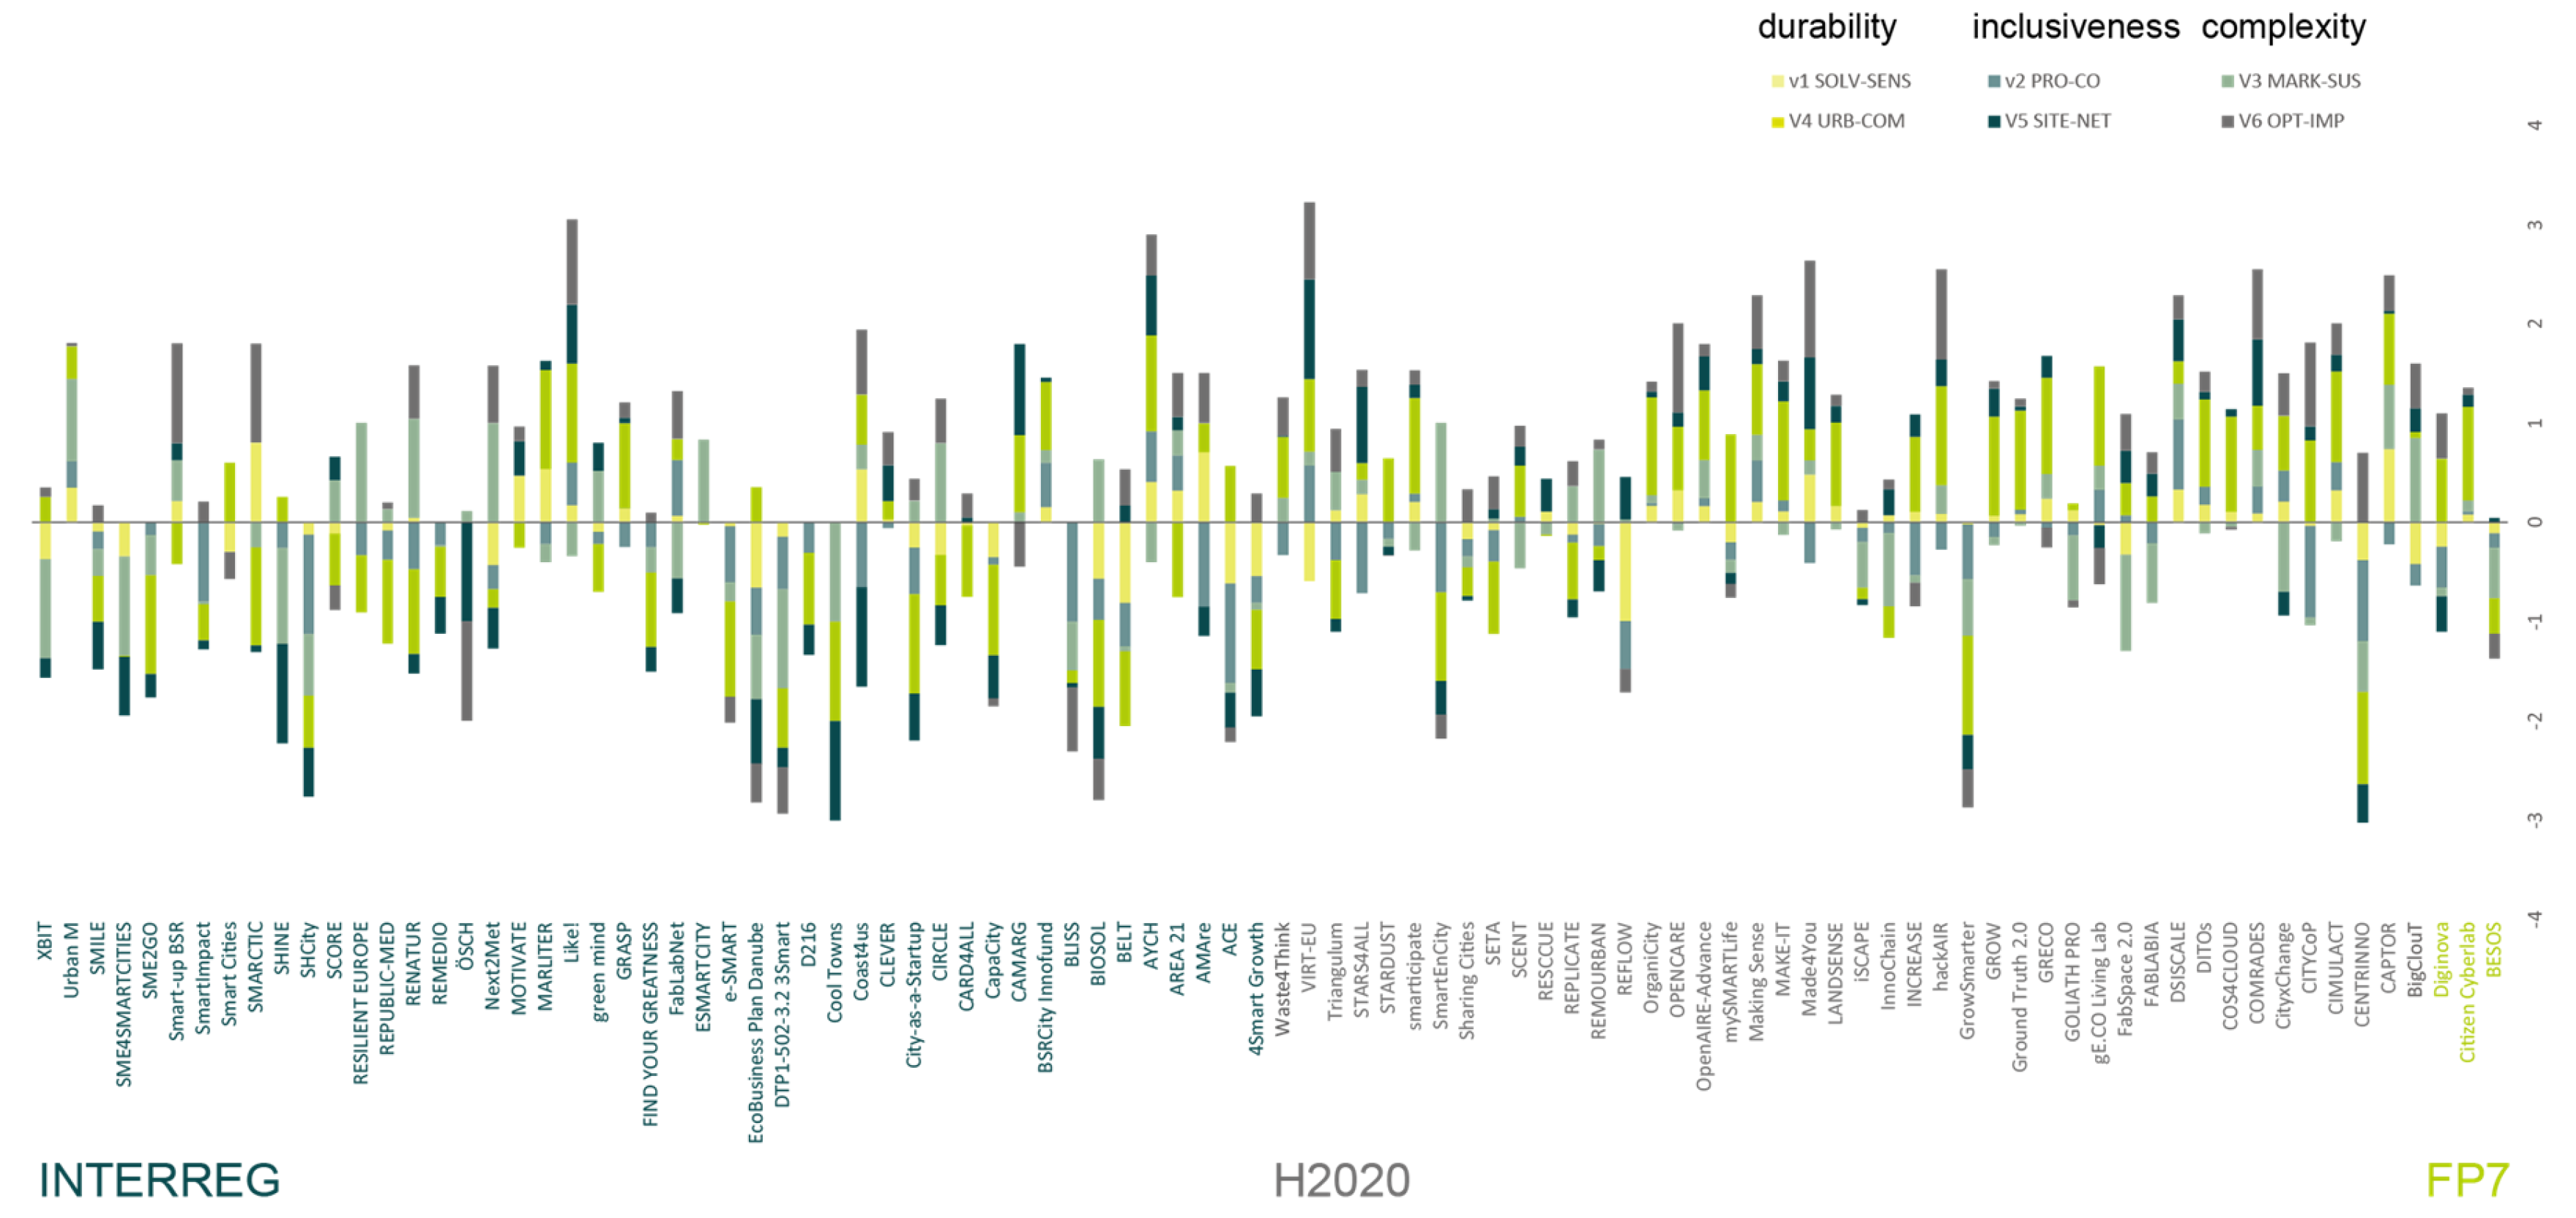
4.2.1. Resilience Attitude Quantification

The methodology presented in Section 2 was applied to each project. Specifically, the text was the objectives and description of the project analyzed using the grounded theory analysis, and a normalized mark was assigned to the 12 parameters presented in Table 2. The antagonist couple of parameters was assigned with positive and negative values. Hence, a mark between −1 and +1 has been assigned to each project in each of the six main categories, with an overall mark between −6 and +6. The detailed results are presented in Figure 11 and in Appendix B.
Figure 11 shows a resilience evaluation overview. It evidences only eight projects having all positive parameters. At the same time, these projects show a low value of general resilience (around +2) despite peaks of +3 positives in projects presenting a mix of resilient and antagonist parameters.

4.2.2. Independence Variable Analysis

In order to make an overall assessment of the resilient attitude of the selected projects and to verify the categorization proposed, a linear correlation analysis between the resilience variables was developed. The analysis, considering the six variables, pairs of antagonistic parameters, for all 94 projects analyzed, was carried out with the development of specific code in the Python program language.
This analysis aims to verify the robustness and independence of the six main variables. If the six main variables are mainly independent, the selection and classification of the 43 sub-codes can be considered correct (despite the intrinsic intercorrelation between the concepts). Hence, the first step is to analyze the correlation between variables. It is important to note that this kind of linear correlation analysis is usually applied in semantic analysis and computational linguistics [76,77,78], the base of the quantitative analysis of the selected categories.
In the first instance, a pairwise linear correlation analysis of all columns in the data frame was carried out using the Pearson method. The use of r (correlation coefficient) is applied extensively in many fields as an indicator of the strength of the correlation [79]. The correlation matrix is presented in Figure 12.
The linear correlation analysis between the six variables showed a generally low or very low level of correlation (maximum value r = 0.39), thus confirming the independence between the last set of six variables. Moreover, it is important to note that it is not possible to further reduce the number of variables with dependency relationships. At the same time, the analysis highlighted a weak correlation between the following dichotomic variable pairs:
-
V5 (SITE-NET) and V4 (URB-COM), 0.385;
-
V4 (URB-COM) and V2 (PRO-CO), 0.334;
-
V5 (SITE-NET) and V2 (PRO-CO), 0.325;
This triad of relationships can be read as a syllogistic implication that relates objective (URB-COM), tool (SITE-NET), and design method (PRO-CO), related to the opposing cultures of open-source design on the one hand, and professional efficiency on the other.
By including slightly lower correlations, it is also possible to identify:
-
V6 (OPT-IMP) V5 (SITE-NET), 0.272;
-
V1 (SOLV-SENS) V4 (URB-COM), 0.271;
-
V6 (OPT-IMP), V1 (SOLV-SENS), 0.270;

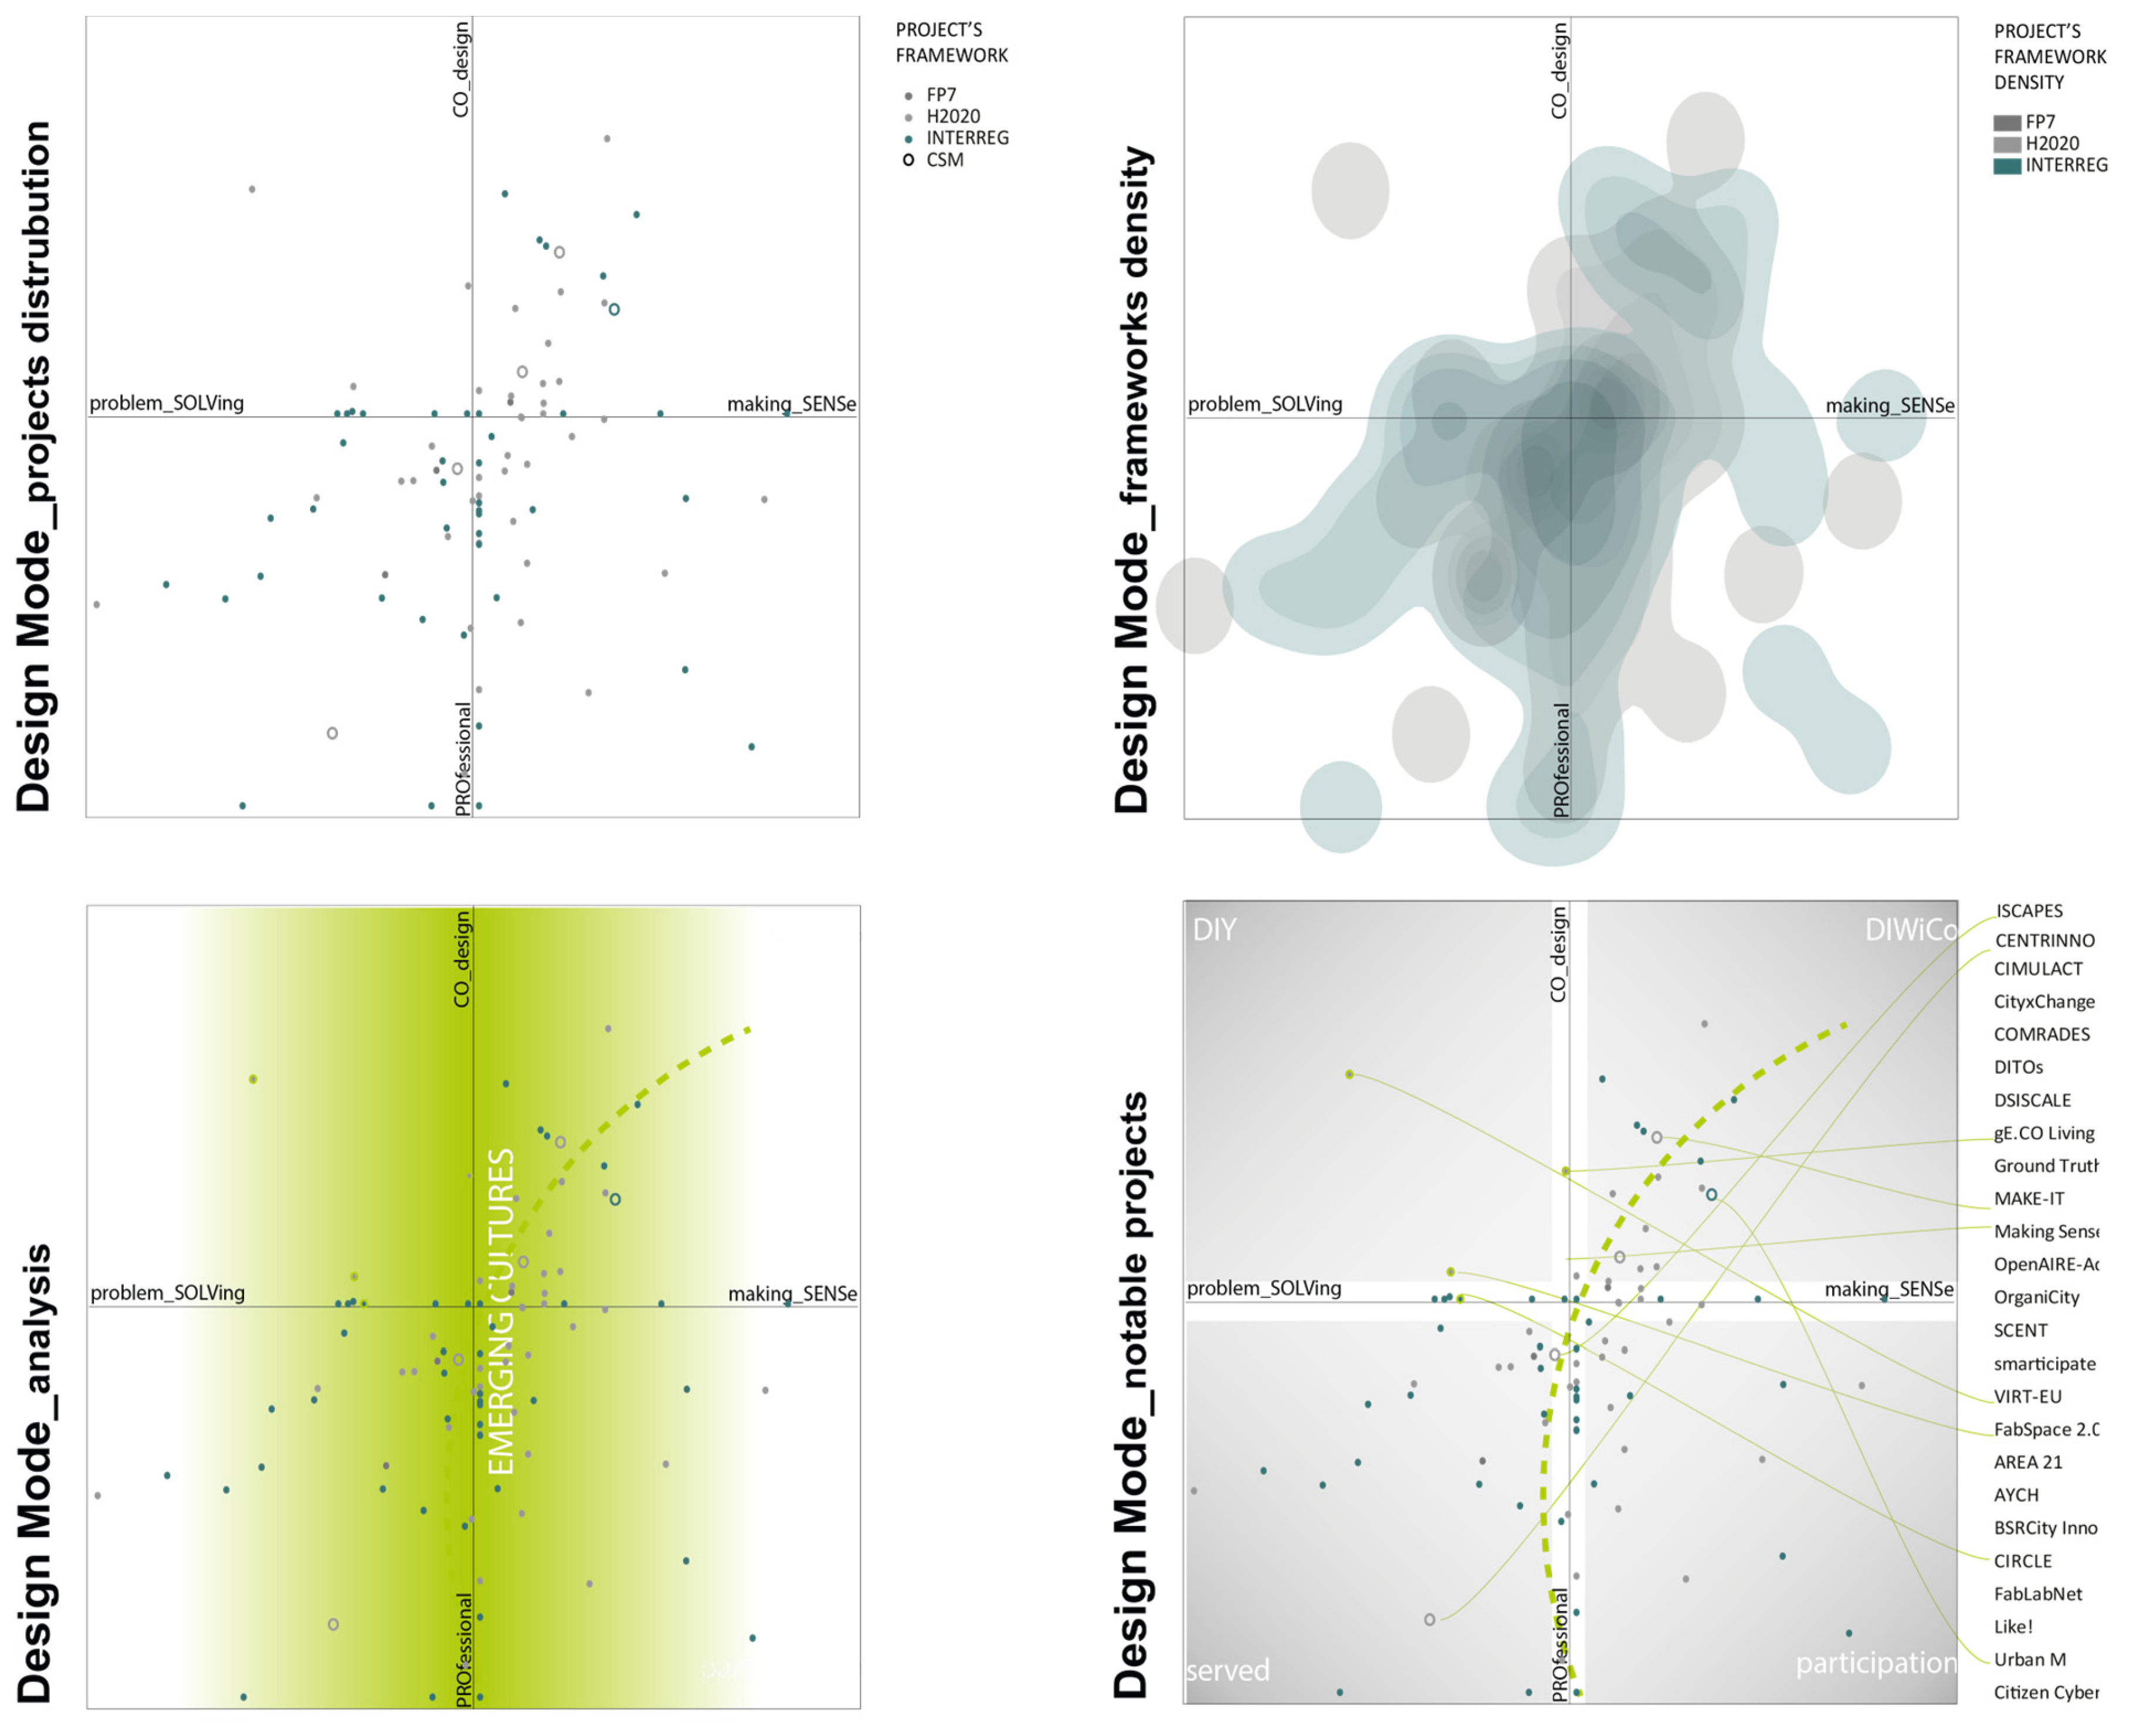
4.3. Resilience Attitude Assessment Scenarios

The final step of the RA assessment is to analyze the 94 projects in the three scenarios previously categorized: design mode, goals, and tools. This analysis is based on the quantitative index values resulting from the RA evaluation and, finally, a mapping representation. Each map concerns a two-dimensional representation of four RA indexes re-arranged in pair of dichotomic variables compound of antagonists’ index. The three maps represent the following:
-
DESIGN MODE: problem solving_making sense (SOLV-SENS/V1) and professional_co-design (PRO-CO/V2) dichotomic variables.
-
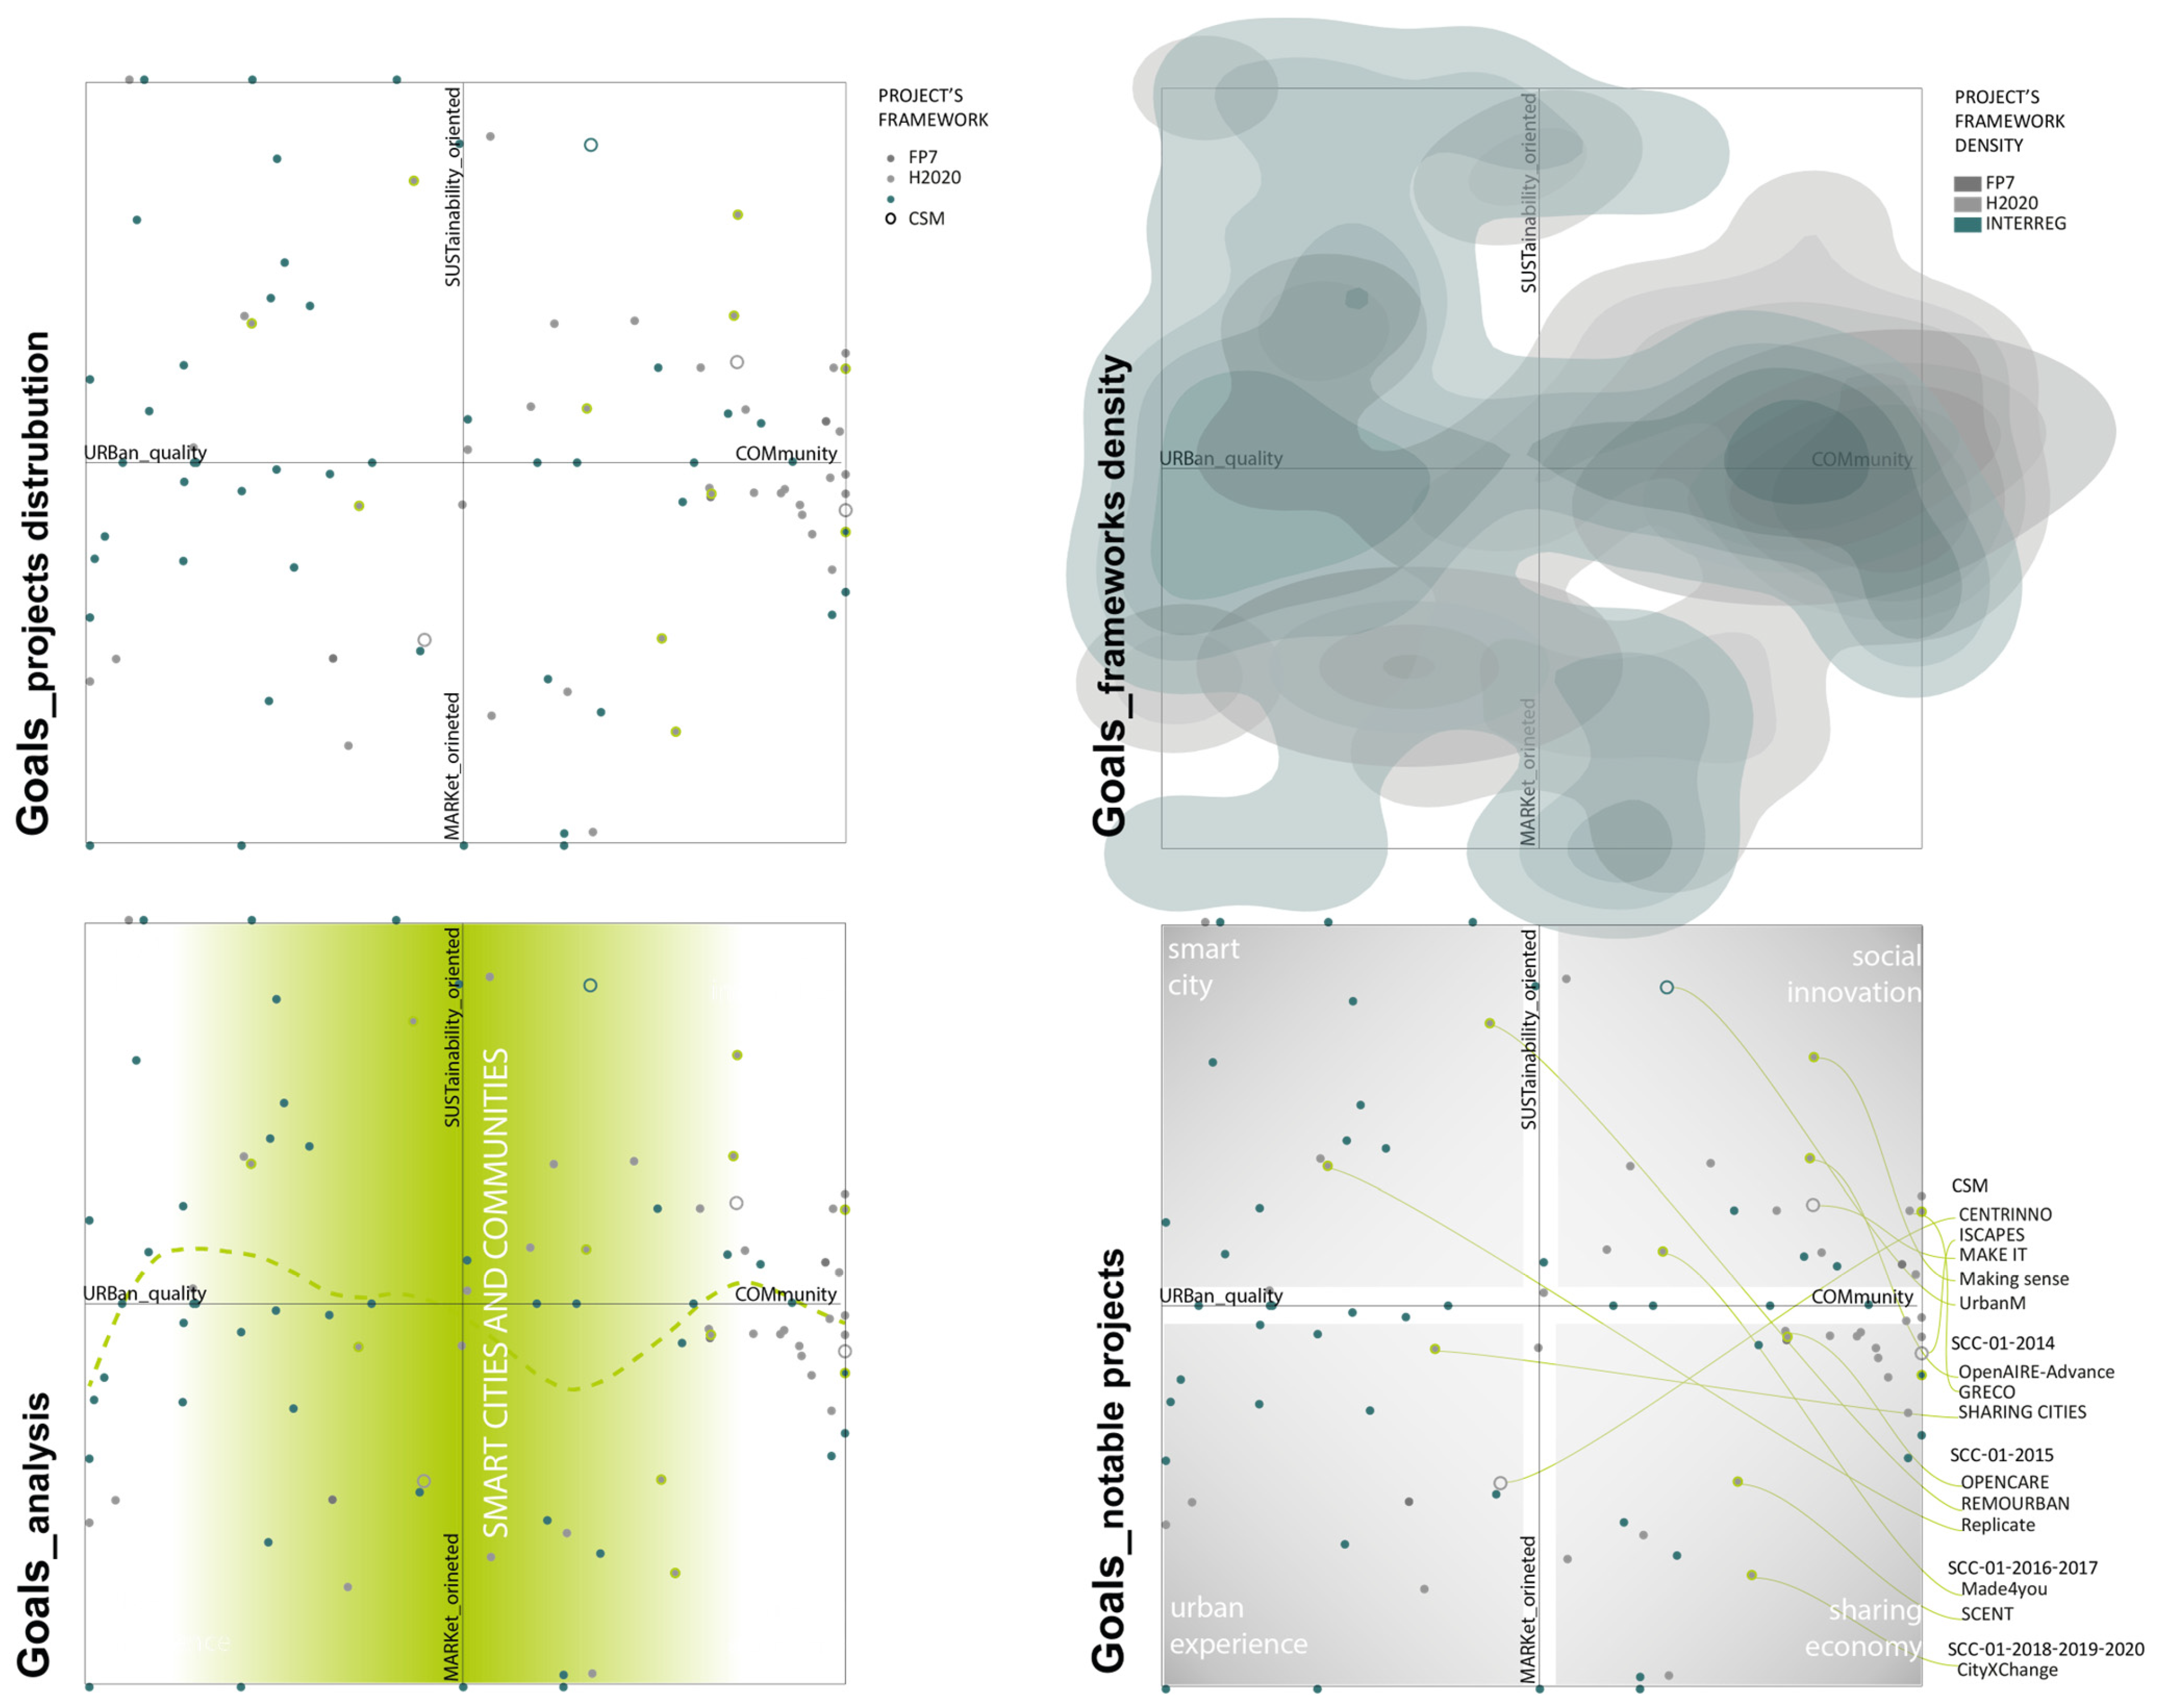
GOALS: market oriented_sustainability oriented (MARK-SUS/V3) and urban quality-community (URB-COM/V4) dichotomic variables.
-
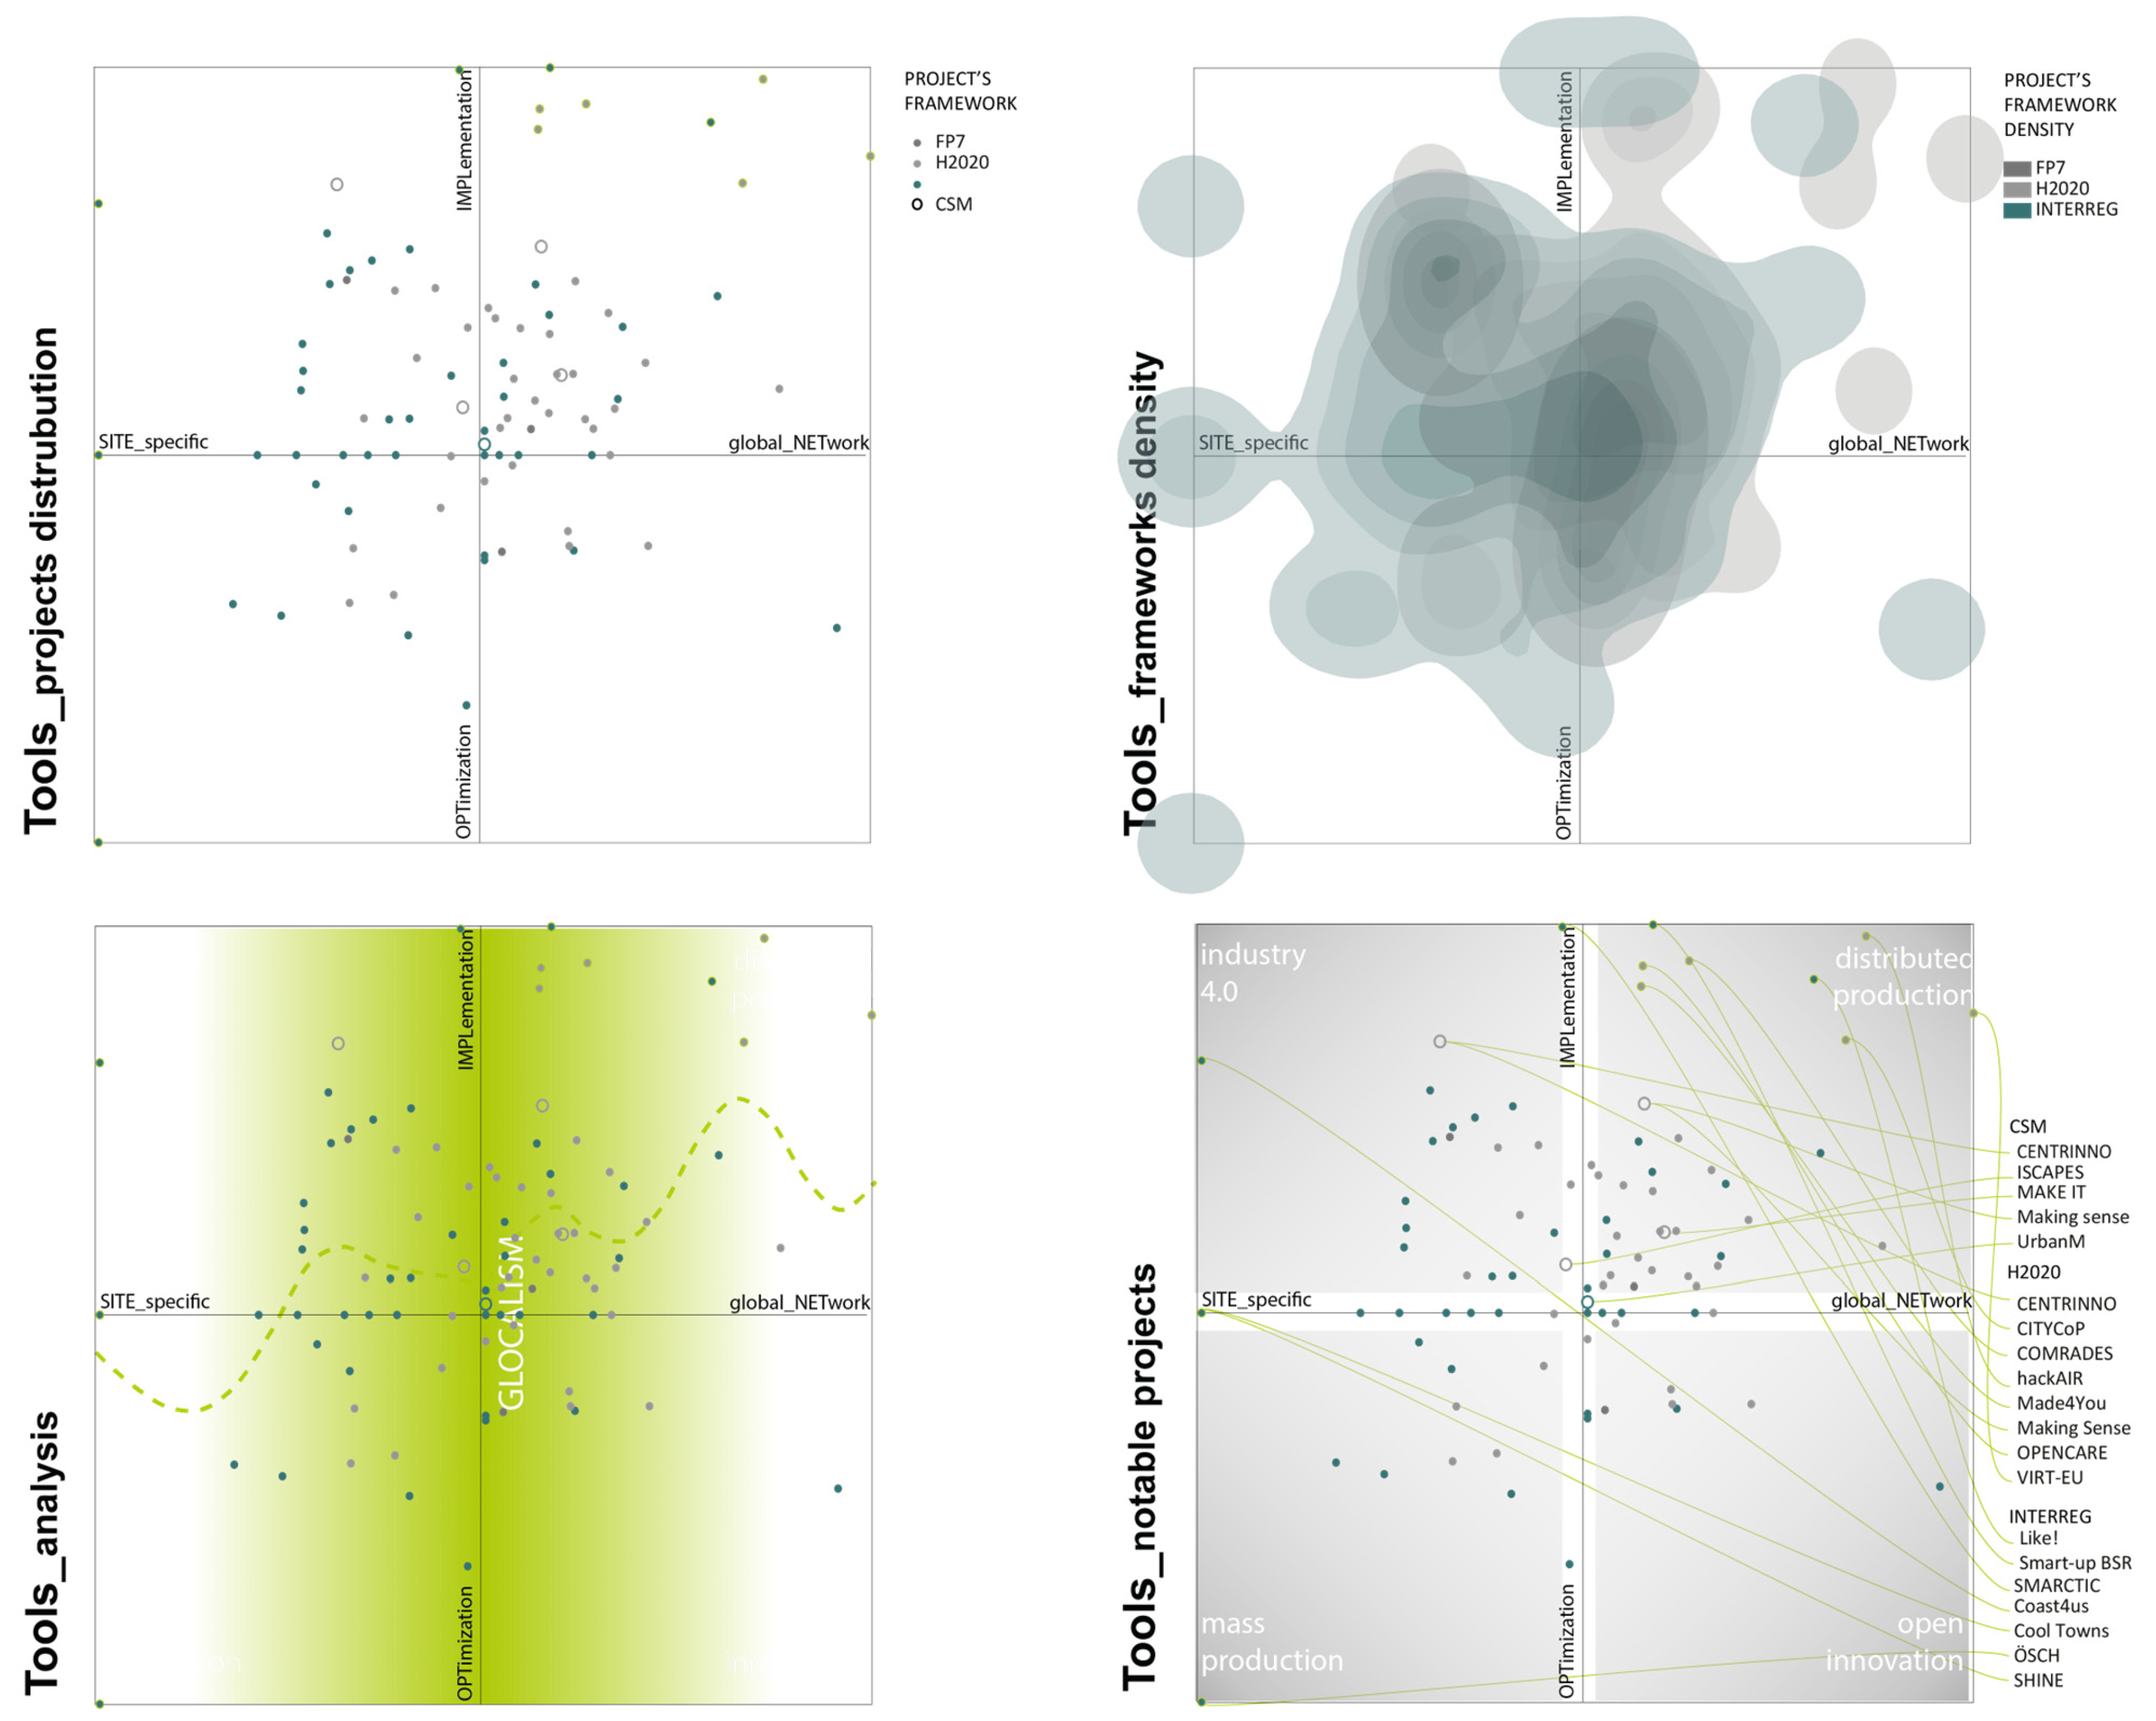
TOOLS: site-specific_global network (SITE-NET/V5) and optimization_implementation (OPT-IMP/V6) dichotomic variables.
Each map respectively defines a set of four categories of EU-funded projects classification, the object of the following discussion. The twelve categories have been broadly identified respectively with models of participation and inhabiting practices, models of ICT implementation to the city, and production and distribution models in parallel with the themes afforded in the state-of-the-art. Considering that all three maps represent the complete collection of 94 projects despite their individual field of application, not all the projects represented in the design mode include participatory processes, and projects represented in the tools maps are not all focused on production; those definitions have to be considered in an extended meaning as similar attitude. Moreover, the mapping representation, by its very nature, does not define closed sectors but two-dimensional gradients in which the exemplificative models that define each quadrant should symbolically occupy the most external corner.
Further consideration is required to interpret the axis that defines the 0 values correctly. According to the resilience approach, complex systems tend to a dynamic equilibrium rather than to the static optimization of single aspects [80]. This tendency is represented in the mapping by next-0 boundaries that overlap the central axis defining areas of “chaotic evolution”. Projects falling within these areas are particularly interesting for having a complex mix of objectives and applications. Some of those next-0 boundaries have been objects of a specific insight to represent a specific phenomenon to be analyzed as emerging design culture, smart city and community mission, and glocalism.
As a result of the previous indications, there are no “good” or “bad” categories in which projects analyzed can fall in terms of resilient attitude, but interesting boundaries of experimentation of integrated models and interaction.
(A)
Mapping Design Mode (Figure 13)
In order to analyze the indicators systems from a design perspective, the design mode map relates the PRO-CO dichotomic indicator with the SOLV-SENS one. The four sectors identified categories of design attitudes respectively defined as: “Served”, referring to top-down solutions (problem-SOLVing -PROfessional sector); “participation”, referring to participation practices (PROfessional_making-SENSe sector); “DIY” referring to bottom-up actions (problem-SOLVing CO-design sector) and DIWCo, referring to community-based bottom-up actions as a new scenario of systematization of bottom-up practices as a participation tool that involves the making practices as inhabiting expression.
As introduced in the Section 3.2.3, the design mode map refers to Manzini’s definition, which, by linking problem-solving, making sense with expert, diffuse design, identifies four quadrants: being served, co-management, DIY, and co-production, which have been redefined by the present study’s categorization (Served, DIY, DIWYCo and Participation) according to the specific nature of the projects under examination, selected on the basis of the use of digital manufacturing technologies and DIY practices for participation [75].
The overview of the design mode map distribution evidences a general 0-boundary tendency, with a significant number of projects concentrated along the two axes. Otherwise, the remaining projects are tendentially distributed along the quadrant’s diagonals. This cross-distribution misses the definition in the DIY quadrant, mostly devoid, except for three projects concerning the H2020 framework program and one project concerning the Interreg’s framework program, respectively; VIRT-EU, ge.CO living, Fabspace, and Circle. Focusing on the last one, it can be considered as part of a six Interreg project group more assimilable with the next 0 Pro-Co index value resulting from an equilibrium between professional attitude and co-creation aims. Similarly, participation quadrant project distribution can be described by three linear distributions, the two mains along the axes, and a smaller number of dispersed projects characterized by a classic participation approach along the top-down diagonal.
“The Served” and “DIWCo” quadrant results host the major number of projects mostly distributed along the specular bottom-up diagonal. Served quadrants show a dominance of the Interreg program projects, with a wider distribution, while the “DIWiCo” quadrant shows a dominance of H2020 projects characterized via a cluster distribution whose center is attracted by the 0-boundaries overlaps.
It is interesting to understand the emerging design culture boundary distribution. As advanced, the solving-sense boundary has been defined by Manzini’s mapping as a territory of design emerging culture development. The insight observation of the project’s distribution along this boundary shows a relevant amount of the next 0 projects dislocated between the “served” and “participation” quadrants supported by the dominant projects’ concentration in the proximity of the two 0-bounderies’ overlap. This characteristic distribution along the emerging culture boundary presents a radical change that crossed the horizontal boundary evidencing only 3 EU-funded projects in favor of a prevalent diagonal project’s distribution.
This shift in the prevalent project distribution is, in the opinion of the research, partly caused by the nature of the projects analyzed. As illustrated in the project selection material’ description, the list of the projects analyzed was collected through two stages, a previous database keyword research based on DIY tools, followed by a manual selection of projects presenting bottom-up approaches. Consequently, the project collection includes an emerging culture component reflected in the “DIWiCo” category. Otherwise, the four quadrants’ equilibrated “distribution” and the “DIY” project’s minority confirm the correct project selection.
The emerging culture boundary shift toward the “DIWiCo” quadrants confirms the emerging trend, concentrated in the 2013–2019 period, based on the co-creating practice as a medium of multistakeholder participation.
(B)
Goals Overview (Figure 14)
In order to analyze a common intents trend, the goals map represents the collected EU-funded project distribution relating the URB-COM (urban quality-community) and MARK-SUS (market oriented_sustainability oriented) dichotomic variables. The four sectors’ categories identify fields of experimentation of digital hybridization of city and community defined as smart city (urban quality_sustainability oriented), urban experience (urban quality_market oriented), sharing economy (market oriented_community), and social innovation (sustainability oriented_community).
In this mapping process, 0-boundaries require special attention for being the real resilient goal. As illustrated in the state-of-the-art section dedicated to resilient thinking, resilience requires, by definition, an integrated approach exemplified by multistakeholder participation and extended to complex multisystemic interaction intended as a whole metabolic system. This complex approach is represented in the goals mapping by the tendency to the center of the map itself or to 0-boundaries overlap, intended as an equilibrium of intent final goal.
The goal map shows the clear eccentric distribution of collected EU-funded projects, characterized by extreme values of the URB-COM dichotomic index and mostly homogeneous distribution over the MARK-SUS dichotomic index. The goal map project distribution narrative can be afforded by a couple of quadrants, presenting a tendential double axes symmetry.
A dominant presence of H2020 projects characterizes the two community quadrants, sharing economy and social innovation. In contrast, the two urban efficiency quadrants, i.e., urban experience and smart city, present an Interreg project’s dominance.
There is a more centered distribution along the MARK-SUS boundary. It is possible to observe a higher concentration in the two community quadrants, while projects in the two urban efficiency quadrants are more dispersed. A significant number of Interreg projects are recorded and distributed along with the MARK-SUS axe, characterized by the next 0 index values. Meanwhile, the URB-COM boundary results are mostly empty.
It is important to note the low concentration of projects close to the smart city and community boundary. The eccentric EU project distribution looks to mismatch with the European Commission’s Smart City and Community mission, explicated by the European Innovation Partnership for Smart Cities and Communities (EIP-SCC) using specific programs, topics, and calls.
The insight views on the smart city and community boundary evidence six next 0 projects, half coming from the H2020 program and half from the Interreg program. None of them are concerned about the Smart City and Community (SCC) topic.
As already shown in the basic data overviews, in the 47 EU-funded projects concerning H2020 and FP7 framework programs, only nine projects correspond to the SCC topic distributed in four programs from 2014 to 2020. These projects are underlined in the map as Open Aire Advance, GRECO, Sharing cities (SCC-01-2014), OPENCARE, REMOURBAN, Replicate (SCC-01-2015), Made4you, SCENT (SCC-01-2016-2017), and CityXChange (SCC-01-2018-2019-2020). They are distributed in all four category quadrants with little prevalence in the two community quadrants: three in the sharing economy and three in social innovation, one in the urban experience quadrant, and two in the smart city quadrant. Of those, the REMOURBAN project concerning the smart city category is the only one that can be considered close to the smart city and community boundary. This mismatch evidenced between the EC mission and the objective proposed by the EU-funded projects analyzed found confirmation in scientific literature thanks to the Kitchin and Cardullo study [81] that analyzed the influence of EU neoliberal policies in ‘citizen-focused’ smart cities. It underlines the causal relationship between the very structure of the calls for tenders in which the SCC mission was expressed and a widespread phenomenon of re-mediation of non-participatory practices, definable as tokenistic practices under Arnstein’s classification [82], which has led to a transnational model of “marketization” of the smart city.
(C)
Tools Overview (Figure 15)
In order to analyze the new tool’s application and implication trends, the tools’ map relates to the SITE-NET and the OPT-IMP dichotomic indicators. The four sectors identified represent categories of manufactory application defined by their development-production-distribution models respectively as “mass production”, referring to last century’s production model based on massive dislocated production (site-specific_optimization sector); “open innovation”, referring to open source and sharing model of design and development (global network_optimization sector); “industry 4.0” referring to a centralized model of high customizable production, (site-specific_implementation sector) and “distributed production” referring to prosumer and hyper-local models of goods production.
In this mapping process, the SITE-NET boundary corresponds to glocalism intended as a simultaneous occurrence of universalizing and particularizing tendencies.
The tools’ map shows a clearly centered main distribution, with a major presence of projects in the two implementation quadrants: distributed production and industry 4.0 sectors. Otherwise, the second ring of dispersed projects with extreme marginal dislocation in the four quadrants, mainly composed of Interreg projects (Like!; Smart-up BSR; SMARTIC; Coast4us; Cool Towns; ÖSCH; SHINE) characterizes the distributed production sector with a relevant number of H2020 projects (CENTRINNO, CITYCoP, COMRADES, hackAIR, Made4You, Making Sense, OPENCARE, VIRT-EU).
Interreg projects are mainly concerned with the Industry 4.0 quadrants, while H2020 projects are in the distributed production sector.
Insight boundary observations evidence a relevant number of perfect 0 Interreg projects on the OPT-IMP boundary; meanwhile, the glocalism boundary is mostly empty in the optimization quadrants and becomes highly populated in the following two implementation quadrants.
The main distribution in the implementation quadrats can be identified with the platform tool, a variable included in the implementation index, which is strongly characteristic of distributed production and industry 4.0. Moreover, the conceptual boundary between industry 4.0, as an expression of the fourth industrial revolution, and the distributed production model characterizing the third industrial revolution theorization are often blurring, and the two terms are used and interchanged according to policy, media, and opportunity [32].
Otherwise, it is relevant to the open innovation scarce presence of EU-funded projects balanced by the distributed production main dislocation.
According to Obradovic [83], “the study of sustainability, commitment-based human resource practices, and Industry 4.0 (I40) represent important future research streams for OI in the manufacturing industry.” This confirms, on the one hand, the relationship between topics such as open strategy, innovation, and collaboration evidenced by the literature reviews and, on the other hand, open innovation as a field of research in evolution.
(D)
Transversal Observations
The three scenarios analyzed present interesting results:
  • The “Design” scenario presents a distribution of the projects close to the “emerging cultures” boundary. This distribution is due to the good balance between the “making sense” and “problem solving” orientation of the projects. A higher concentration in the “DiWiCO” and “served” quadrants suggests a paradigm shift from top-down practices to co-creating practices as a medium of multistakeholder participation.
  • The “Goals” scenario presents a strong polarization of projects, particularly with respect to the “smart city and community” boundary. This result could imply a separation between the smart city projects and their social implications. In fact, few projects seem to try to merge these two interconnected objectives. Additionally, it is possible to observe a dispersion between market and sustainability values, probably driven by an implicit interconnection that is difficult to capture with the proposed analysis tools.
  • The “Tools” scenario presents a centered concentration of projects. This higher concentration seems to take into consideration the principles and implications of the maker movement. On the one hand, the integration of local and global scales. On the other hand, it is possible to observe a higher concentration in the quadrants focused on “distributed production and industry 4.0” compared to “mass production” and “open innovation” (mainly due to the market-oriented results from the H2020 projects).

5. Conclusions

Several of the 94 EU-funded projects have been selected from the CORDIS and KEEP portals, based on a common set of 9 keywords describing makers’ tools, citizen science practices, and sustainable city goals, in order to identify common trends and patterns of resilience approach and digital tool application. Three of those projects were part of the FP7 program framework, 44 projects came from the H2020 program framework, and 47 were Interreg projects. Each project’s data set was implemented manually through the EU open data portal database to obtain comparable data sets.
The 94 EU-funded projects’ lists were analyzed through four stages:
  • General basic data overviews.
  • Project’s RA qualitative analysis.
  • Multi-Criteria Analysis (MCA).
  • Projects’ design mode, goals, and tools mapping process.
The general basic data overviews involved the complete 94 projects dataset, evaluating coordinator countries distribution in the European territory as well as participant countries: the time distribution, concerning call’s programs, and founding schemes in relation to the keywords characterizing each project.
The territorial distribution of coordinator countries evidences a homogeneous distribution of Interreg projects and a southwest-centered distribution of H2020 projects, with Spain as the most present country in H2020 and Italy as the most present country in Interreg projects.
The time overviews show a time distribution within 22 years from 1998 and 2020, characterized by a peak of projects between 2013 and 2016 that did not correspond to a specific program H2020 call or Interreg.
The call’s programs overview evidence an extremely fragmented scenario, respectively, 24 Interreg programs and 33 calls for a whole of 94 projects, confirmed by respective actions distributions. It is shown the equal presence of RIA and IA funding schemes in H2020 projects and the prevalence of innovation actions in Interreg projects.
The RA analysis has been character”zed ’y qualitative evaluation of the entire collection of 94 EU-funded projects individually described in Appendix A by data sheets. From the qualitative analysis, the overviews deducted 12 quantitative indicators’ framework of RA evaluation and then applied it to each project in feedback.
The whole RA analysis transposed in comparable quantitative indicators, has been the object of a multicriteria analysis aimed at investigating variables’ correlation. The linear correlation analysis evidenced only low or little correlation, confirming the correct variable reduction from twelve indicators to six dichotomic variables.
We verified the validity of the final indicators set. A project’s mapping has been afforded in order to focus on specific trends deducted from the state of the arts:
  • The role of ICT technologies in dealing with the global community re-localization.
  • The community-based smart city alternative model.
  • The maker practice potential as a tool of participation.
The project mapping process was approached through three different map models, each representing four of the twelve indicators deduced from the RA analysis. The three maps focused on design mode, goals, and tools application, and each showed a significant trend toward the remediation and revolution scenarios identified at the beginning of this study.
The following trends were revealed:
  • Patterns of remediation of non-participatory practices.
  • The weak presence of open innovation initiatives.
  • Development of activities focusing on co-creation as a participatory tool.
The first one, pointed out in the goals map by the marginal distribution of the projects in relation to the 0-boundary identified as smart city and community, confirms the misalignment between the EC mission objectives and their applicability is intrinsic in the neoliberal mechanism of multistakeholder collaboration of the SCC initiative itself.
The second, evidenced In the tools map by the scarcity of projects identified in the open innovation quadrant, reveals once again a remediation mechanism of ownership-based innovation models. This phenomenon can be seen both as a misalignment of objectives between the EC and proposing entities and as an opportunity, not entirely lost, for further development that would require more coherent policies.
The third trend revealed by the design mode map identifies a trajectory of experimentation of bottom-up projects models of inhabit based on the practices of doing together as a participatory tool.
The present work has been focused on the development and validation of the methodology to evaluate the resilient attitude of maker practices. However, some theoretical and practical issues should be further studied. Firstly, the analysis has been based on the project objectives (ex ante). Hence, an ex post analysis of the project results should be carried out in order to evaluate the real impact of the actions and the deviations from the proposals. Secondly, the territorial declination of each project should be considered in their context. Therefore, the methodology can be adapted to the project follow-up analysis, maintaining the indicators and categorization systems and proposing alternative tools of data collection (i.e., self-assessment surveys, LCA parameters, end-of-life project exploitation). Thirdly, the method can be integrated into a multisite digital platform to integrate the resilience analysis with smart city data. Finally, the legal, ethical, and regulatory framework of the policies should be integrated with the projects.

Author Contributions

Conceptualization, L.M. and C.H.; methodology, L.M.; formal analysis, L.M.; investigation, L.M.; data curation, L.M.; writing—original draft preparation, L.M. and C.H. All authors have read and agreed to the published version of the manuscript.

Funding

This research received no external funding.

Data Availability Statement

Data is contained within the article.

Acknowledgments

The authors thanks Jorge R. Gómez for his crucial support on the independence variable analysis. The authors are also grateful to Raimundo Bambó and Ignacio Zabalza for their valuable comments that helped improve the quality of this paper. The authors wish to thank Francesca Pagliaro, Marco Morini, and Giovanni Murano for the invitation to publish in this Sustainable Special Issue.

Conflicts of Interest

The authors declare no conflict of interest.

Appendix A. General Information of Analyzed Projects

This appendix presents the main information of the analyzed projects. Table A1, Table A2 and Table A3 provide information from the CORDIS database (FP7 and H2020 projects), and Table A4 form the KEEP database (Interreg projects).
Table A1. List of projects selected from the CORDIS database through the MT category of keywords. Date format is dd/mm/yyyy.
ProgramAcronymProject NameStart DateEnd DateKeyw.
MT
H2020-EU.3.5.6.CENTRINNONew CENTRalities in INdustrial areas as engines for inNOvation and urban transformation01/09/202029/02/2024DF
FP7-NMPDiginovaInnovation for Digital Fabrication01/03/201228/02/2014DF
H2020-EU.2.1.1.DSISCALESupporting the scale and growth of Digital Social Innovation in Europe through coordination of Europe’s DSI and CAPS Networks01/01/201830/06/2019FL
H2020-EU.2.3.2.2.FABLABIADFLab as Entrepreneurship supporting tool for innovation agencies01/06/201931/05/2020DF
H2020-EU.3.6.FabSpace 2.0The DFlab for geodata-driven innovation—by leveraging Space data in particular, in Universities 2.001/03/201628/02/2019FL
H2020-EU.3.6.2.2.gE.CO Living LabGenerative European Commons Living Lab01/02/201931/01/2022FL
H2020-EU.3.;H2020-EU.2.3.;H2020-EU.2.1.GOLIATH PROThe first portable and automated milling robot tool enabling professional manufacturers to produce large-size objects in whatever place01/04/201930/09/2019DF
H2020-EU.1.3.1.InnoChainBuilding Innovation in the Extended Digital Chain01/09/201531/05/2020DF
H2020-EU.2.1.1.Made4YouOpen and Inclusive Healthcare for Citizens Based on Digital fabrication01/01/201831/12/2020DF
H2020-EU.2.1.1.MAKE-ITUnderstanding Collective Awareness Platforms with the Maker Movement01/01/201631/12/2017DF
H2020-EU.2.1.1.Making SenseMaking Sense01/11/201531/12/2017DF; ICT; CS
H2020-EU.2.1.1.OPENCAREOpen Participatory Engagement in Collective Awareness for REdesign of Care Services01/01/201631/12/2017DF
H2020-EU.1.3.1.REFLOWPhosphorus REcovery for FertiLisers frOm dairy processing Waste01/01/201931/12/2022FL; MS
Table A2. List of projects selected from the CORDIS database through the CPS category of keywords. Date format is dd/mm/yyyy.
ProgramAcronymProject NameStart DateEnd DateKeyw.
CSP
H2020-EU.2.1.1.CAPTORCollective Awareness Platform for Tropospheric Ozone Pollution01/01/201631/12/2018ICT; CS
H2020-EU.5.c.CIMULACTCITIZEN AND MULTI-ACTOR CONSULTATION ON HORIZON202001/06/201531/03/2018CS
FP7-ICTCitizen CyberlabTechnology Enhanced Creative Learning in the field of Citizen Cyberscience01/10/201230/11/2015ICT; CS
H2020-EU.2.1.1.COMRADESCollective Platform for Community Resilience and Social Innovation during Crises01/01/201631/12/2018ICT; CS
H2020-EU.1.4.1.3.COS4CLOUDCo-designed Citizen Observatories Services for the EOS-Cloud01/11/201928/02/2023ICT; CS
H2020-EU.5.c.DITOsDoing It Together science (DITOs)01/06/201631/05/2019DIYS
H2020-EU.5.d.;H2020-EU.5.c.;H2020-EU.5.e.GRECOFostering a Next Generation of European Photovoltaic Society through Open Science01/06/201831/05/2021CS
H2020-EU.3.5.5.Ground Truth 2.0Ground Truth 2.0—Environmental knowledge discovery of human sensed data01/09/201631/12/2019CS
H2020-EU.3.5.5.GROWGROW Observatory01/11/201631/10/2019CS; SCz
H2020-EU.2.1.1.hackAIRCollective awareness platform for outdoor air pollution01/01/201631/12/2018CS; ICT
H2020-EU.3.2.1.1.INCREASEIntelligent Collections of Food Legumes Genetic Resources for European Agrofood Systems01/05/202030/04/2025CS
H2020-EU.3.5.1.iSCAPEImproving the Smart Control of Air Pollution in Europe01/09/201630/11/2019CS; SCz
H2020-EU.3.5.5.LANDSENSEA Citizen Observatory and Innovation Marketplace for Land Use and Land Cover Monitoring01/09/201631/08/2020CS
H2020-EU.2.1.1.Making SenseMaking Sense01/11/201531/12/2017DF; ICT; CS
H2020-EU.1.4.1.3.OpenAIRE-AdvanceOpenAIRE Advancing Open Scholarship01/01/201831/12/2020CS; ICT
H2020-EU.3.3.1.3.REPLICATEREnaissance of Places with Innovative Citizenship and TEchnolgy01/02/201631/01/2021SCz; ICT; CS
H2020-EU.3.5.5.SCENTSmart Toolbox for Engaging Citizens into a People-Centric Observation Web01/09/201631/08/2019CS
H2020-EU.2.1.1.SETASETA: An open, sustainable, ubiquitous data and service ecosystem for efficient, effective, safe, resilient mobility in metropolitan areas01/02/201631/01/2019CS; ICT
H2020-EU.2.1.1.STARS4ALLA Collective Awareness Platform for Promoting Dark Skies in Europe01/01/201631/12/2018CS; ICT
H2020-EU.3.5.4.Waste4ThinkMoving towards Life Cycle Thinking by integrating Advanced Waste Management Systems01/06/201629/02/2020CS; ICT
Table A3. List of projects selected from the CORDIS database through the SCG category of keywords. Date format is dd/mm/yyyy.
ProgramAcronymProject NameStart DateEnd DateKeyw.
SCG
FP7-ICTBESOSBuilding Energy decision Support systems fOr Smart cities01/10/201330/09/2016ICT; SC
H2020-EU.2.1.1.BigClouTBig data meeting Cloud and IoT for empowering the citizen clout in smart cities01/07/201630/06/2019ICT; SC
H2020-EU.3.7.CITYCoPCitizen Interaction Technologies Yield Community Policing01/06/201531/05/2018ICT; SC
H2020-EU.3.3.1.3.CityxChangePositive City ExChange01/11/201831/10/2023ICT; SC
H2020-EU.3.3.1.3.GrowSmarterGrowSmarter01/01/201531/12/2019ICT; SC
H2020-EU.3.3.1.mySMARTLifeSmart Transition of EU cities towards a new concept of smart Life and Economy01/12/201630/11/2021ICT; SC
H2020-EU.2.1.1.3.OrganiCityOrganiCity—Co-creating smart cities of the future01/01/201530/06/2018ICT; SC
H2020-EU.3.3.1.3.REMOURBANREgeneration MOdel for accelerating the smart URBAN transformation01/01/201530/06/2020ICT; SC
H2020-EU.3.5.;H2020-EU.3.7.RESCCUERESCCUE—RESilience to cope with Climate Change in Urban arEas—a multisectorial approach focusing on water01/05/201630/04/2020CR
H2020-EU.3.3.1.3.Sharing CitiesSharing Cities01/01/201631/12/2020ICT; SC
H2020-EU.3.3.1.3.SmartEnCityTowards Smart Zero CO2 Cities across Europe01/02/201631/07/2021ICT; SC
H2020-EU.3.6.smarticipatesmart services for calculated impact assessment in open governance01/02/201631/01/2019ICT; SC
H2020-EU.3.3.1.STARDUSTHOLISTIC AND INTEGRATED URBAN MODEL FOR SMART CITIES01/10/201730/09/2022ICT; SC
H2020-EU.3.3.1.3.TriangulumTriangulum: The Three Point Project/Demonstrate. Disseminate. Replicate.01/02/201531/01/2020ICT; SC
H2020-EU.2.1.1.VIRT-EUValues and ethics in Innovation for Responsible Technology in EUrope01/01/201731/12/2019ICT; SC
Table A4. List of projects selected from the KEEP database through the MT category of keywords. Date format is dd/mm/yyyy.
ProgramAcronymProject NameStart DateEnd DateKeyw.
MT
2014–2020 INTERREG VB Atlantic AreaAYCHAtlantic Youth Creative Hubs01/10/201701/10/2020DF
2014–2020 INTERREG VB Central EuropeFabLabNetMaking Central Europe more competitive by unlocking the innovation capacity of Fab Labs within an enhanced innovation ecosystem01/07/201630/06/2019DF; FL
2014–2020 INTERREG VB North SeaSHINEShared value creation in the Healthcare economy through INtegrated business modEls01/12/201531/01/2020MS
2014–2020 Interreg EuropeUrban MUrban Manufacturing—Stimulating Innovation Through Collaborative Maker Spaces01/01/201731/12/2021FL; MS
2014–2020 Interreg IPA CBC Croatia-SerbiaXBITCross-Border IT network for competitiveness, innovation and entrepreneurship01/09/201731/08/2019DF; FL
Table A5. List of projects selected from the KEEP database through the CSP category of keywords. Date format is dd/mm/yyyy.
ProgramAcronymProject NameStart DateEnd DateKeyw.
CSP
2007–2013 North West EuropeACENWE Academy of Champions for Energy01/04/201030/09/2015ICT; SC; SCz
2014–2020 INTERREG VB MediterraneanAMAreActions for Marine Protected Areas01/11/201631/01/2020ICT; CS
2014–2020 Black Sea Basin ENI CBCMARLITERImproved online public access to environmental monitoring data and data tools for the Black Sea Basin supporting cooperation in the reduction of marine litter24/07/201823/07/2021ICT; CS
2014–2020 Interreg EuropeRENATURImproving regional policies to better protect natural heritage of peri-urban open spaces01/08/201931/07/2023ICT; CS
Table A6. List of projects selected from the KEEP database through the CSP category of keywords. Date format is dd/mm/yyyy.
ProgramAcronymProject NameStart DateEnd DateKeyw.
CSP
2014–2020 INTERREG V-A Finland—Estonia—Latvia—Sweden (Central Baltic)4Smart GrowthSmart Clusters for Smart Growth through Joint Business Intelligence01/04/201930/06/2021SC
2014–2020 INTERREG VB Baltic SeaAREA 21Baltic Smart City Areas for the 21st century01/10/201730/09/2020ICT;SC
2014–2020 INTERREG V-A Finland—Estonia—Latvia—Sweden (Central Baltic)BELTBaltic Entrepreneurship Laboratories01/10/201530/09/2018SC
2014–2020 Interreg IPA CBC Croatia-SerbiaBIOSOLUse of biomass and solar energy as renewable sources for sustainable and efficient energy for stand-alone complexes with a social purpose01/07/201931/03/2021SC
2007–2013 North West EuropeBLISSBetter Lighting In Sustainable Streets01/01/200930/06/2014ICT;SC
Other (EUSBSR projects related)BSRCity InnofundFunding models and Systemic Innovation for Smart Sustainable Cities in the Baltic Sea Region (a set of projects)01/01/201131/12/2018ICT;SC
2014–2020 INTERREG VB MediterraneanCAMARGClusters of Innovative Zero-km Agrofood Marketplaces for Growth01/02/201731/12/2019SC
Other (EUSDR projects related)CapaCityUrban Competences01/02/201631/12/2016SC
2014–2020 URBACT IIICARD4ALLCONNECTING CITIES, CITIZENS AND SERVICES.04/04/201804/12/2020SC
2014–2020 INTERREG VB Adriatic—IonianCIRCLECircular Innovation and Resilient City Labs in the Adrion Region01/02/202031/07/2022RC
2014–2020 URBACT IIICity-as-a-StartupCity branding strategies & smart city technologies04/04/201804/10/2018SC
2014–2020 INTERREG VB DanubeCLEVERCo-designing smart Local solutions for Exploiting Values and Enhancing Resilience01/09/201831/08/2019ICT;SC
2014–2020 INTERREG V-A Finland—Estonia—Latvia—Sweden (Central Baltic)Coast4usCoast4us01/01/201831/12/2020ICT;SC
2014–2020 INTERREG V-A France—Belgium—The Netherlands—United Kingdom (Les Deux Mers/Two seas/Twee Zeeën)Cool TownsSpatial Adaptation for Heat Resilience in Small and Medium Sized Cities in the 2 Seas Region01/09/201830/09/2022RC
2014–2020 INTERREG V-A Slovakia—Czech RepublicD216Information Bridge III: Smart City as a Source of the Czech-Slovak Border Region Development01/02/201831/10/2019SC
2014–2020 INTERREG VB DanubeDTP1-502-3.2 3SmartSmart Building—Smart Grid—Smart City01/01/201731/12/2019ICT; SC
Other (EUSDR projects related)EcoBusiness Plan DanubeThe Environmental Service Package of the City of Vienna01/01/1998 SC
2014–2020 INTERREG VB Alpine Spacee-SMARTe-mobility SMART grid for passengers and last mile freight transports in the Alpine Space01/10/201931/03/2022SC
2014–2020 INTERREG VB MediterraneanESMARTCITYEnabling Smarter City in the MED Area through Networking01/02/201831/07/2020ICT;SC
2014–2020 URBACT IIIFIND YOUR GREATNESSEurope’s first strategic brand building program for smart cites02/09/201902/03/2020SC
2007–2013 Programme MEDGRASPGReen procurement And Smart city suPport in the energy sector SC
2014–2020 INTERREG VB Mediterraneangreen mindGREEN and smart Mobility INDustry innovation01/02/201831/07/2020SC
2014–2020 INTERREG VB North SeaLike!Like! Building a Local Digital Innovation Culture01/10/201601/03/2020ICT; SC
2014–2020 INTERREG VB MediterraneanMOTIVATEPromoting citizens’ active involvement in the development of Sustainable Travel Plans in Med Cities with Seasonal Demand01/11/201631/10/2019SC
2014–2020 Interreg EuropeNext2MetIncreasing attractiveness of Next2Met regions with soft digitalisation measures01/08/201931/01/2023ICT; SC
2007–2013 Öresund—Kattegat—Skagerrak (SE-DK-NO)ÖSCHÖresund Smart Cities Hub01/08/201230/09/2014ICT; SC
2014–2020 INTERREG VB MediterraneanREMEDIOREgenerating mixed-use MED urban communities congested by traffic through Innovative low carbon mobility sOlutions01/11/201631/10/2019SC
2007–2013 Programme MEDREPUBLIC-MEDREtrofitting PUBLic spaces in Intelligent MEDiterranean Cities ICT; SC
2014–2020 URBACT IIIRESILIENT EUROPEEuropean cities joining forces to improve city resilience15/09/201503/05/2018CR
2014–2020 INTERREG VB North SeaSCORESmart Cities + Open Data RE-use01/09/201728/02/2022SC
2014–2020 INTERREG VB South West EuropeSHCitySmart Heritage City01/07/201631/12/2018SC
2014–2020 INTERREG VB Northern Periphery and ArcticSMARCTICSmart energy management in remote Northern, Peripheral and Arctic regions01/07/201930/06/2022ICT; SC
2014–2020 INTERREG V-A Greece—CyprusSmart CitiesDevelop smart city applications in the municipalities of Cyprus, Crete and the North Aegean09/05/201731/10/2019ICT; SC
2014–2020 URBACT IIISmartImpactSmartImpact15/09/201503/05/2018ICT; SC
2014–2020 INTERREG VB Baltic SeaSmart-up BSRImproving smart specialisation implementation of the Baltic Sea Region through orchestrating innovation hubs01/10/201730/09/2020SC
2014–2020 INTERREG V-A Finland—Estonia—Latvia—Sweden (Central Baltic)SME2GOCentral Baltic Region Smart City Solutions for Global Cities01/10/201530/09/2018SC
2014–2020 Mediterranean Sea Basin ENI CBCSME4SMARTCITIESMediterranean SME working together to make cities smarter01/09/201931/08/2022SC
2007–2013 Programme MEDSMILESMart green Innovative urban Logistics for Energy efficient Mediterranean cities ICT; SC

Appendix B. Resilience Attitude Projects Quantification

The details of the six resilience attitude quantification categories are presented in Table A7.
Table A7. Six Resilience Attitude quantification categories.
TitleSOLV-SENS
V1 = C3-C9
PRO-CO V2 = C2-C8MARK-SUS V3= C6-C12URB-COM V4= C1-C7SITE-NET V5 = C4-C10OPT-IMP V6 = C5-C11
BigClouT−0.422−0.2140.8520.0600.2350.449
CAPTOR0.741−0.2190.6480.7150.0280.353
CENTRINNO−0.381−0.815−0.513−0.931−0.3810.698
CIMULACT0.3260.283−0.1870.9110.1690.313
CITYCoP−0.037−0.918−0.0800.8290.1390.841
CityxChange0.2120.311−0.7030.551−0.2320.425
COMRADES0.0940.2680.3710.4420.6690.702
COS4CLOUD0.109−0.008−0.0390.9590.073−0.026
DITOs0.1800.180−0.1100.8790.0760.197
DSISCALE0.3330.7020.3630.2290.4170.238
FABLABIA0.000−0.210−0.5980.2640.2300.210
FabSpace 2.0−0.3270.070−0.9650.3310.3210.367
gE.CO Living Lab−0.0280.3260.2451.000−0.235−0.361
GOLIATH PRO0.125−0.129−0.6610.0630.000−0.067
GRECO0.241−0.0580.2480.9680.216−0.196
Ground Truth 2.00.0830.045−0.0311.0000.0410.070
GROW0.067−0.146−0.0811.0000.2820.068
GrowSmarter−0.022−0.547−0.571−1.000−0.350−0.382
hackAIR0.089−0.2750.2861.0000.2630.907
INCREASE0.108−0.533−0.0780.7570.220−0.235
InnoChain0.074−0.106−0.739−0.3160.2610.093
iSCAPE−0.056−0.140−0.463−0.115−0.0560.123
LANDSENSE0.1670.000−0.0690.8390.1670.108
Made4You0.483−0.4070.1410.3150.7220.970
MAKE-IT0.1130.107−0.1241.0000.1990.207
Making Sense0.2090.4120.2630.7130.1470.538
mySMARTLife−0.202−0.172−0.1360.885−0.113−0.136
OpenAIRE-Advance0.1660.0770.3840.7040.3380.120
OPENCARE0.325−0.014−0.0660.6390.1430.894
OrganiCity0.1680.0270.0810.9840.0600.096
REFLOW−0.994−0.4870.0340.0000.424−0.234
REMOURBAN−0.017−0.2220.736−0.143−0.3120.095
REPLICATE−0.122−0.0830.364−0.572−0.1750.251
RESCCUE0.111−0.010−0.110−0.0140.3260.000
SCENT0.0000.059−0.4590.5140.1880.209
SETA−0.081−0.3130.039−0.7260.0930.328
Sharing Cities−0.171−0.171−0.113−0.288−0.0430.329
SmartEnCity0.000−0.7041.000−0.896−0.340−0.240
smarticipate0.2080.082−0.2790.9640.1310.141
STARDUST0.000−0.163−0.0810.645−0.087−0.003
STARS4ALL0.285−0.7110.1460.1670.7640.171
Triangulum0.125−0.3810.383−0.591−0.1270.431
VIRT-EU−0.5900.5730.1390.7351.0000.772
Waste4Think0.000−0.3300.2480.6160.0100.380
4Smart Growth−0.541−0.266−0.074−0.598−0.4720.287
ACE−0.614−1.000−0.1030.569−0.352−0.144
AMAre0.708−0.8500.0000.289−0.2920.502
AREA 210.3230.3520.254−0.7520.1320.441
AYCH0.4090.508−0.3970.9640.6040.410
BELT−0.813−0.436−0.050−0.7510.1680.362
BIOSOL−0.568−0.4140.634−0.876−0.527−0.414
BLISS0.000−1.000−0.492−0.126−0.047−0.646
BSRCity Innofund0.1570.4430.1280.6890.0380.000
CAMARG0.0000.0000.1030.7760.913−0.446
CapaCity−0.353−0.0740.000−0.913−0.437−0.076
CARD4ALL−0.0310.0000.000−0.7180.0490.238
CIRCLE−0.3290.0060.794−0.505−0.4010.442
City-as-a-Startup−0.253−0.4700.217−1.000−0.4700.217
CLEVER0.032−0.0580.0000.1840.3580.331
Coast4us0.536−0.6530.2480.504−1.0000.649
Cool Towns0.0000.000−1.000−1.000−1.0000.000
D2160.000−0.3060.000−0.724−0.3020.000
DTP1-502-3.2 3Smart−0.147−0.525−1.000−0.599−0.198−0.465
EcoBusiness Plan Danube−0.659−0.472−0.6520.353−0.652−0.385
e-SMART−0.039−0.565−0.193−0.9610.000−0.259
ESMARTCITY0.0000.0000.833−0.0220.0000.000
FabLabNet0.0670.561−0.5650.212−0.3490.477
FIND YOUR GREATNESS0.000−0.247−0.257−0.753−0.2470.092
GRASP0.139−0.2450.0030.8600.0500.151
green mind−0.095−0.1200.523−0.4850.2780.000
Like!0.1740.428−0.3381.0000.5860.859
MARLITER0.537−0.216−0.1811.0000.0880.000
MOTIVATE0.4710.0000.000−0.2530.3460.145
Next2Met−0.431−0.2431.000−0.188−0.4080.573
ÖSCH0.0000.0000.1130.000−1.000−1.000
REMEDIO0.000−0.227−0.018−0.506−0.3660.000
RENATUR0.046−0.4691.000−0.856−0.1940.531
REPUBLIC-MED−0.084−0.2910.135−0.8430.0000.063
RESILIENT EUROPE0.000−0.3331.000−0.5700.0000.000
SCORE−0.1160.0000.430−0.5210.231−0.246
SHCity−0.124−1.000−0.622−0.526−0.4870.000
SHINE0.000−0.255−0.9680.255−1.0000.000
SMARCTIC0.8000.000−0.251−0.988−0.0650.994
Smart Cities−0.3020.0000.0000.5990.000−0.271
SmartImpact0.000−0.796−0.030−0.365−0.0860.205
Smart-up BSR0.2190.0000.409−0.4180.1701.000
SME2GO0.000−0.125−0.404−1.000−0.2300.000
SME4SMARTCITIES−0.3430.000−1.000−0.010−0.5880.000
SMILE−0.093−0.175−0.274−0.460−0.4750.167
Urban M0.3510.2660.8300.3260.0000.028
XBIT−0.3680.000−1.0000.255−0.1940.094
BESOS−0.111−0.144−0.511−0.3570.045−0.250
Citizen Cyberlab0.0820.0300.1080.9480.1210.067
Diginova−0.244−0.411−0.0900.643−0.3570.452

References

  1. IEA Empowering Cities for a Net Zero Future; International Energy Agency: Paris, France, 2021.
  2. Calvillo, C.F.; Sánchez-Miralles, A.; Villar, J. Energy Management and Planning in Smart Cities. Renew. Sustain. Energy Rev. 2016, 55, 273–287. [Google Scholar] [CrossRef]
  3. Kitchin, R. The Real-Time City? Big Data and Smart Urbanism. GeoJournal 2014, 79, 1–14. [Google Scholar] [CrossRef]
  4. Kuo, Y.-H.; Leung, J.M.Y.; Yan, Y. Public Transport for Smart Cities: Recent Innovations and Future Challenges. Eur. J. Oper. Res. 2023, 306, 1001–1026. [Google Scholar] [CrossRef]
  5. Esmaeilian, B.; Wang, B.; Lewis, K.; Duarte, F.; Ratti, C.; Behdad, S. The Future of Waste Management in Smart and Sustainable Cities: A Review and Concept Paper. Waste Manag. 2018, 81, 177–195. [Google Scholar] [CrossRef] [PubMed]
  6. Koop, S.H.A.; van Leeuwen, C.J. The Challenges of Water, Waste and Climate Change in Cities. Environ. Dev. Sustain. 2017, 19, 385–418. [Google Scholar] [CrossRef]
  7. Caragliu, A.; Del Bo, C.; Nijkamp, P. Smart Cities in Europe. J. Urban Technol. 2011, 18, 65–82. [Google Scholar] [CrossRef]
  8. European Commission, Directorate-General for Research and Innovation. EU Missions, 100 Climate-Neutral and Smart Cities: Cities on a Journey to Climate Neutrality; Publications Office of the European Union: Luxembourg, 2023. [Google Scholar] [CrossRef]
  9. Haarstad, H.; Wathne, M.W. Are Smart City Projects Catalyzing Urban Energy Sustainability? Energy Policy 2019, 129, 918–925. [Google Scholar] [CrossRef]
  10. Yigitcanlar, T.; Kamruzzaman, M.; Foth, M.; Sabatini-Marques, J.; da Costa, E.; Ioppolo, G. Can Cities Become Smart without Being Sustainable? A Systematic Review of the Literature. Sustain. Cities Soc. 2019, 45, 348–365. [Google Scholar] [CrossRef]
  11. Ahvenniemi, H.; Huovila, A.; Pinto-Seppä, I.; Airaksinen, M. What Are the Differences between Sustainable and Smart Cities? Cities 2017, 60, 234–245. [Google Scholar] [CrossRef]
  12. Holling, C.S. Understanding the Complexity of Economic, Ecological, and Social Systems. Ecosystems 2001, 4, 390–405. [Google Scholar] [CrossRef]
  13. Holling, C.S. Resilience and Stability of Ecological Systems. Annu. Rev. Ecol. Syst. 1973, 4, 1–23. [Google Scholar] [CrossRef]
  14. Carpenter, S.; Walker, B.; Anderies, J.M.; Abel, N. From Metaphor to Measurement: Resilience of What to What? Ecosystems 2001, 4, 765–781. [Google Scholar] [CrossRef]
  15. Meerow, S.; Newell, J.P.; Stults, M. Defining Urban Resilience: A Review. Landsc. Urban Plan. 2016, 147, 38–49. [Google Scholar] [CrossRef]
  16. Huang, L.; Wu, J.; Yan, L. Defining and Measuring Urban Sustainability: A Review of Indicators. Landsc. Ecol. 2015, 30, 1175–1193. [Google Scholar] [CrossRef]
  17. Sharifi, A. Urban Sustainability Assessment: An Overview and Bibliometric Analysis. Ecol. Indic. 2021, 121, 107102. [Google Scholar] [CrossRef]
  18. Masnavi, M.R.; Gharai, F.; Hajibandeh, M. Exploring Urban Resilience Thinking for Its Application in Urban Planning: A Review of Literature. Int. J. Environ. Sci. Technol. 2019, 16, 567–582. [Google Scholar] [CrossRef]
  19. Arup. City Resilience Index. Understanding and Measuring City Resilience; The Rockefeller Foundation and Arup 2014. Available online: https://www.arup.com/-/media/arup/files/publications/c/170223_cri-brochure.pdf (accessed on 20 August 2023).
  20. Mori, K.; Christodoulou, A. Review of Sustainability Indices and Indicators: Towards a New City Sustainability Index (CSI). Environ. Impact Assess. Rev. 2012, 32, 94–106. [Google Scholar] [CrossRef]
  21. Petit-Boix, A.; Llorach-Massana, P.; Sanjuan-Delmás, D.; Sierra-Pérez, J.; Vinyes, E.; Gabarrell, X.; Rieradevall, J.; Sanyé-Mengual, E. Application of Life Cycle Thinking towards Sustainable Cities: A Review. J. Clean. Prod. 2017, 166, 939–951. [Google Scholar] [CrossRef]
  22. Goldstein, B.; Birkved, M.; Quitzau, M.-B.; Hauschild, M. Quantification of Urban Metabolism through Coupling with the Life Cycle Assessment Framework: Concept Development and Case Study. Environ. Res. Lett. 2013, 8, 35024. [Google Scholar] [CrossRef]
  23. Pincetl, S.; Bunje, P.; Holmes, T. An Expanded Urban Metabolism Method: Toward a Systems Approach for Assessing Urban Energy Processes and Causes. Landsc. Urban Plan. 2012, 107, 193–202. [Google Scholar] [CrossRef]
  24. Spatari, S.; Yu, Z.; Montalto, F.A. Life Cycle Implications of Urban Green Infrastructure. Environ. Pollut. 2011, 159, 2174–2179. [Google Scholar] [CrossRef]
  25. Lotteau, M.; Loubet, P.; Pousse, M.; Dufrasnes, E.; Sonnemann, G. Critical Review of Life Cycle Assessment (LCA) for the Built Environment at the Neighborhood Scale. Build. Environ. 2015, 93, 165–178. [Google Scholar] [CrossRef]
  26. Halverson, E.R.; Sheridan, K. The Maker Movement in Education. Harv. Educ. Rev. 2014, 84, 495–504. [Google Scholar] [CrossRef]
  27. Tanenbaum, T.J.; Williams, A.M.; Desjardins, A.; Tanenbaum, K. Democratizing Technology: Pleasure, Utility and Expressiveness in DIY and Maker Practice. In Proceedings of the Conference on Human Factors in Computing Systems—Proceedings, Paris, France, 27 April–2 May 2013; pp. 2603–2612. [Google Scholar]
  28. Browder, R.E.; Aldrich, H.E.; Bradley, S.W. The Emergence of the Maker Movement: Implications for Entrepreneurship Research. J. Bus. Ventur. 2019, 34, 459–476. [Google Scholar] [CrossRef]
  29. Diez, T. Fab City Whitepaper. Locally Productive, Globally Connected Self-Sufficient Cities; Fab City: Barcelona, Spain, 2016. [Google Scholar]
  30. Gershenfeld, N. Fab: The Coming Revolution on Your Desktop—From Personal Computers to Personal Fabrication; Basic Books: Boston, MA, USA, 2007; ISBN 0465027466. [Google Scholar]
  31. Anderson, C. Makers: The New Industrial Revolution; Random House: New York, NY, USA, 2012; ISBN 9781448136803. [Google Scholar]
  32. Rifkin, J. The Zero Marginal Cost Society: The Internet of Things, the Collaborative Commons, and the Eclipse of Capitalism; St. Martin’s Press: New York, NY, USA, 2014; ISBN 1137437766. [Google Scholar]
  33. Gershenfeld, N.; Gershenfeld, A.; Cutcher-Gershenfeld, J. Designing Reality: How to Survive and Thrive in the Third Digital Revolution; Basic Books: Boston, MA, USA, 2017; ISBN 9780465093489. [Google Scholar]
  34. Menichinelli, M.; Gerson Saltiel Schmidt, A. First Exploratory Geographical and Social Maps of the Maker Movement. Eur. J. Creat. Pract. Cities Landsc. 2019, 2, 35–62. [Google Scholar] [CrossRef]
  35. Voigt, C.; Montero, C.S.; Menichinelli, M. An Empirically Informed Taxonomy for the Maker Movement BT—Internet Science; Bagnoli, F., Satsiou, A., Stavrakakis, I., Nesi, P., Pacini, G., Welp, Y., Tiropanis, T., DiFranzo, D., Eds.; Springer International Publishing: Cham, Switzerland, 2016; pp. 189–204. [Google Scholar]
  36. Saari, H.; Åkerman, M.; Kieslinger, B.; Myllyoja, J.; Sipos, R. How Open Is the Maker Movement? Integrative Literature Review of the Openness Practices in the Global Maker Movement. Sustainability 2021, 13, 13559. [Google Scholar] [CrossRef]
  37. Rosa, P.; Sassanelli, C.; Urbinati, A.; Chiaroni, D.; Terzi, S. Assessing Relations between Circular Economy and Industry 4.0: A Systematic Literature Review. Int. J. Prod. Res. 2020, 58, 1662–1687. [Google Scholar] [CrossRef]
  38. Kohtala, C.; Hyysalo, S. Anticipated Environmental Sustainability of Personal Fabrication. J. Clean. Prod. 2015, 99, 333–344. [Google Scholar] [CrossRef]
  39. Millard, J.; Sorivelle, M.N.; Deljanin, S.; Unterfrauner, E.; Voigt, C. Is the Maker Movement Contributing to Sustainability? Sustainability 2018, 10, 2212. [Google Scholar] [CrossRef]
  40. Corsini, L.; Moultrie, J. Design for Social Sustainability: Using Digital Fabrication in the Humanitarian and Development Sector. Sustainability 2019, 11, 3562. [Google Scholar] [CrossRef]
  41. Corsini, L.; Dammicco, V.; Moultrie, J. Frugal Innovation in a Crisis: The Digital Fabrication Maker Response to COVID-19. R&D Manag. 2021, 51, 195–210. [Google Scholar] [CrossRef]
  42. Abbassi, W.; Harmel, A.; Belkahla, W.; Ben Rejeb, H. Maker Movement Contribution to Fighting COVID-19 Pandemic: Insights from Tunisian FabLabs. R&D Manag. 2022, 52, 343–355. [Google Scholar] [CrossRef]
  43. Kieslinger, B.; Schaefer, T.; Fabian, C.M.; Biasin, E.; Bassi, E.; Freire, R.R.; Mowoh, N.; Arif, N.; Melis, P. COVID-19 Response From Global Makers: The Careables Cases of Global Design and Local Production. Front. Sociol. 2021, 6, 629587. [Google Scholar] [CrossRef]
  44. Kim, D.Y. A Design Methodology Using Prototyping Based on the Digital-Physical Models in the Architectural Design Process. Sustainability 2019, 11, 4416. [Google Scholar] [CrossRef]
  45. Soomro, S.A.; Casakin, H.; Georgiev, G. V Sustainable Design and Prototyping Using Digital Fabrication Tools for Education. Sustainability 2021, 13, 1196. [Google Scholar] [CrossRef]
  46. Milara, I.S.; Georgiev, G.V.; Riekki, J.; Ylioja, J.; Pyykkönen, M. Human and Technological Dimensions of Making in FabLab. Des. J. 2017, 20, S1080–S1092. [Google Scholar] [CrossRef]
  47. Choi, Y.H.; Bouwma-Gearhart, J.; Lenhart, C.A.; Villanueva, I.; Nadelson, L.S. Student Development at the Boundaries: Makerspaces as Affordances for Engineering Students’ Development. Sustainability 2021, 13, 3058. [Google Scholar] [CrossRef]
  48. Ford, S.; Despeisse, M. Additive Manufacturing and Sustainability: An Exploratory Study of the Advantages and Challenges. J. Clean. Prod. 2016, 137, 1573–1587. [Google Scholar] [CrossRef]
  49. Faludi, J.; Bayley, C.; Bhogal, S.; Iribarne, M. Comparing Environmental Impacts of Additive Manufacturing vs Traditional Machining via Life-Cycle Assessment. Rapid Prototyp. J. 2015, 21, 14–33. [Google Scholar] [CrossRef]
  50. Behrendt, T.; Zein, A.; Min, S. Development of an Energy Consumption Monitoring Procedure for Machine Tools. CIRP Ann. 2012, 61, 43–46. [Google Scholar] [CrossRef]
  51. Agustí-Juan, I.; Habert, G. Environmental Design Guidelines for Digital Fabrication. J. Clean. Prod. 2017, 142, 2780–2791. [Google Scholar] [CrossRef]
  52. Pessoa, S.; Guimarães, A.S.; Lucas, S.S.; Simões, N. 3D Printing in the Construction Industry—A Systematic Review of the Thermal Performance in Buildings. Renew. Sustain. Energy Rev. 2021, 141, 110794. [Google Scholar] [CrossRef]
  53. Ebrahimi, M.; Mohseni, M.; Aslani, A.; Zahedi, R. Investigation of Thermal Performance and Life-Cycle Assessment of a 3D Printed Building. Energy Build. 2022, 272, 112341. [Google Scholar] [CrossRef]
  54. Tsui, T.; Peck, D.; Geldermans, B.; van Timmeren, A. The Role of Urban Manufacturing for a Circular Economy in Cities. Sustainability 2021, 13, 23. [Google Scholar] [CrossRef]
  55. Coskun, A.; Metta, J.; Bakırlıoğlu, Y.; Çay, D.; Bachus, K. Make It a Circular City: Experiences and Challenges from European Cities Striving for Sustainability through Promoting Circular Making. Resour. Conserv. Recycl. 2022, 185, 106495. [Google Scholar] [CrossRef]
  56. Dicken, P. Global Shift: Mapping the Changing Contours of the World Economy; SAGE Publications Ltd.: New York, NY, USA, 2007; ISBN 1412929555. [Google Scholar]
  57. Hildebrandt, L.; Zadow, S.; Lange, L.; Langhammer, M.; Moritz, M.; Redlich, T.; Wulfsberg, J.P. What Are the Role and Capabilities of Fab Labs as a Contribution to a Resilient City? Insights from the Fab City Hamburg. In Proceedings of the Conference on Production Systems and Logistics: CPSL 2022, Vancouver, BC, Canada, 17–20 May 2022; pp. 192–205. [Google Scholar]
  58. Capdevila, I.; Zarlenga, M.I. Smart City or Smart Citizens? The Barcelona Case. J. Strateg. Manag. 2015, 8, 266–282. [Google Scholar] [CrossRef]
  59. Staffans, A.; Kahila-Tani, M.; Geertman, S.; Sillanpää, P.; Horelli, L. Communication-Oriented and Process-Sensitive Planning Support. Int. J. E-Plan. Res. 2020, 9, 1–20. [Google Scholar] [CrossRef]
  60. Fasoli, A.; Tassinari, S. Engaged by Design: The Role of Emerging Collaborative Infrastructures for Social Development. Roma Makers as a Case Study. Des. J. 2017, 20, S3121–S3133. [Google Scholar] [CrossRef]
  61. Monaco, L.; D’Elia, L.; Malakuczi, V. Making in Proximity: Design Policies for Collaborative Making Cultures. In Proceedings of the Cumulus Conference Proceedings 2021, Rome, Italy, 8–11 June 2021; pp. 2920–2930. [Google Scholar]
  62. Monaco, L. Looking for City 4.0. Two Work in Progress Experiences in Zaragoza. In Proceedings of the Fab14, Toulouse, France, 2–8 July 2018. [Google Scholar]
  63. Taylor, N.; Hurley, U.; Connolly, P. Making Community: The Wider Role of Makerspaces in Public Life. In Proceedings of the 2016 CHI Conference on Human Factors in Computing Systems, San Jose, CA, USA, 7–12 May 2016; pp. 1415–1425. [Google Scholar]
  64. Principale, S.; Cosentino, A.; Lombardi, R.; Rocchi, A. Public Administration in Smart City: A Bibliometric Analysis. J. Public Aff. 2023, 23, e2863. [Google Scholar] [CrossRef]
  65. Yu, B.; Zhou, X. Urban Administrative Hierarchy and Urban Land Use Efficiency: Evidence from Chinese Cities. Int. Rev. Econ. Financ. 2023, 88, 178–195. [Google Scholar] [CrossRef]
  66. Guo, Q.; Zhong, J. The Effect of Urban Innovation Performance of Smart City Construction Policies: Evaluate by Using a Multiple Period Difference-in-Differences Model. Technol. Forecast. Soc. Change 2022, 184, 122003. [Google Scholar] [CrossRef]
  67. Qin, Z.; Liang, Y.; Yang, C.; Fu, Q.; Chao, Y.; Liu, Z.; Yuan, Q. Externalities from Restrictions: Examining the Short-Run Effects of Urban Core-Focused Driving Restriction Policies on Air Quality. Transp. Res. Part D Transp. Environ. 2023, 119, 103723. [Google Scholar] [CrossRef]
  68. Chen, Y.; Chen, Z.; Guo, D.; Zhao, Z.; Lin, T.; Zhang, C. Underground Space Use of Urban Built-up Areas in the Central City of Nanjing: Insight Based on a Dynamic Population Distribution. Undergr. Space 2022, 7, 748–766. [Google Scholar] [CrossRef]
  69. Sararu, C.-S. Considerations on the Public Services in the XXI Century. Trib. Jurid. 2016, 6, 160–166. [Google Scholar]
  70. Čajková, A.; Šindleryová, I.B. Usability of Municipal Performance-Based Budgets within Strategic Planning in Slovakia: Perception of Elected Local Representatives. NISPAcee J. Public Adm. Policy 2022, 15, 17–37. [Google Scholar] [CrossRef]
  71. Srebalová, M.; Peráček, T. Effective Public Administration as a Tool for Building Smart Cities: The Experience of the Slovak Republic. Laws 2022, 11, 67. [Google Scholar] [CrossRef]
  72. De Jong, M.; Joss, S.; Schraven, D. Review of Research Findings Generated under JPI Urban Europe’s Strategic Research and Innovation Agenda 2013–2018; JPI Urban Europe 2018. Available online: https://jpi-urbaneurope.eu/wp-content/uploads/2019/02/De-Jong-et-al-1.pdf (accessed on 20 August 2023).
  73. Nascimento, S.; Guimarães Pereira, A.; Ghezzi, A. From Citizen Science to Do It Yourself Science: An Annotated Account of an On-Going Movement; JRC Science and Policy Reports; Publications Office of the European Union: Luxembourg, 2014. [Google Scholar] [CrossRef]
  74. Strauss, A.; Corbin, J. Grounded Theory Methodology: An Overview. In Handbook of Qualitative Research; Denzin, N.K., Lincoln, Y.S., Eds.; Sage Publications, Inc.: New York, NY, USA, 1995. [Google Scholar]
  75. Manzini, E. Design, When Everybody Designs. An Introduction to Design for Social Innovation; The MIT Press: Cambridge, MA, USA, 2015; ISBN 9780262028608. [Google Scholar]
  76. Qu, R.; Fang, Y.; Bai, W.; Jiang, Y. Computing Semantic Similarity Based on Novel Models of Semantic Representation Using Wikipedia. Inf. Process. Manag. 2018, 54, 1002–1021. [Google Scholar] [CrossRef]
  77. Agirre, E.; Alfonseca, E.; Hall, K.; Kravalova, J.; Paşca, M.; Soroa, A. A Study on Similarity and Relatedness Using Distributional and Wordnet-Based Approaches. In Proceedings of the NAACL HLT 2009—Human Language Technologies: The 2009 Annual Conference of the North American Chapter of the Association for Computational Linguistics, Boulder, CO, USA, 31 May–5 June 2009; pp. 19–27. [Google Scholar]
  78. Bollegala, D.; Matsuo, Y.; Ishizuka, M. Measuring Semantic Similarity between Words Using Web Search Engines. In Proceedings of the 16th International World Wide Web Conference, WWW2007, Banff, AB, Canada, 8–12 May 2007; University of Tokyo: Tokyo, Japan, 2007; pp. 757–766. [Google Scholar]
  79. Asuero, A.G.; Sayago, A.; González, A.G. The Correlation Coefficient: An Overview. Crit. Rev. Anal. Chem. 2006, 36, 41–59. [Google Scholar] [CrossRef]
  80. Pisano, U. Resilience and Sustainable Development: Theory of Resilience, Systems Thinking and Adaptive Governance; ESDN Quarterly Report 26; European Sustainable Development Network: Vienna, Austria, 2012. [Google Scholar]
  81. Cardullo, P.; Kitchin, R. Smart Urbanism and Smart Citizenship: The Neoliberal Logic of ‘Citizen-Focused’ Smart Cities in Europe. Polit. Space 2019, 37, 813–830. [Google Scholar] [CrossRef]
  82. Arnstein, S.R. A Ladder of Citizen Participation. J. Am. Inst. Plan. 1969, 35, 216–224. [Google Scholar] [CrossRef]
  83. Obradović, T.; Vlačić, B.; Dabić, M. Open Innovation in the Manufacturing Industry: A Review and Research Agenda. Technovation 2021, 102, 102221. [Google Scholar] [CrossRef]
Figure 1. Scheme of procedure selection of projects and keywords to analyze.
Sustainability 15 12856 g001
Figure 2. Schematic representation of the parameters/indicators and resilient dimensions (* Code derived from bibliometric analysis from Scopus).
Sustainability 15 12856 g002
Figure 3. Design mode categorization scheme. Design modes (problem-solving vs. making sense) and convergence of emerging cultures region (left) and design mode quadrants (right).
Sustainability 15 12856 g003
Figure 4. Goals categorization scheme. Goal scale (urban vs. community) and smart cities and communities axis (left), and goal mode quadrants (right).
Sustainability 15 12856 g004
Figure 5. Tools categorization scheme. Tool scale (close vs. open innovation) and innovation glocalism axis (left), and tool quadrants (right).
Sustainability 15 12856 g005
Figure 6. Distribution of analyzed project by coordinator country and keyword topic.
Sustainability 15 12856 g006
Figure 7. Number of projects by starting year and keyword topic.
Sustainability 15 12856 g007
Figure 8. Number of projects by starting year and keyword macro sets.
Sustainability 15 12856 g008
Figure 9. Distribution of FP7 and H2020 projects by type of action.
Sustainability 15 12856 g009
Figure 10. Categorization of the Interreg project by macro-area.
Sustainability 15 12856 g010
Figure 11. Quantitative resilient attitude assessment of EU projects by funding program.
Sustainability 15 12856 g011
Figure 12. Correlation matrix of resilience assessment variables.
Sustainability 15 12856 g012
Figure 13. Design mode categorization maps showing project distribution (top left), funding program density (top right), analysis of trends (bottom left), and notable project distribution (bottom right).
Sustainability 15 12856 g013
Figure 14. Goals categorization maps showing project distribution (top left), funding program density (top right), analysis of trends (bottom left), and notable project distribution (bottom right).
Sustainability 15 12856 g014
Figure 15. Tools categorization maps showing project distribution (top left), funding program density (top right), analysis of trends (bottom left), and notable project distribution (bottom right).
Sustainability 15 12856 g015
Table 1. CORDIS and KEEP datasets available information structure.
CORDISKEEP
BASICAcronymAcronym
TitleProject Name
Start DateProject Start
End DateProject End
EuroSciVoc
CALLProgramProgram
Framework Program
Topics
CallCall
FUNDTotal Cost
EC Max ContributionBudget/EU Funding
Funding SchemeCo-Financing Sources
DESCRIPTIONProject URL
ObjectiveDescription
PARTICIPANTSCoordinator (Entity)Lead Partner
Coordinator CountryCountry
Participants (Entity)Partners
Participant CountriesCountry Partners
Table 2. Code system for resilient attribute analysis in three levels: topic, resilient code (C), and sub-codes based on keywords.
TopicResilient CodeSub-CodeAntagonist CodeSub-Code
InclusivenessCommunity (C1)Government *
Service *
Citizen *
Participation *
Education *
Citizen Science
Urban Efficiency (C7)Citizen Engagement
Mobility *
Energy Efficiency *
Smart Grids *
Infrastructures *
Energy District *
Open Spaces *
Smart City
Co-Creation (C2)Open Innovation
Bottom Up
Multistakeholder
Professional (C8)Top-Down
DurabilityMaking Sense (C3)Social InnovationProblem Solving (C9)
Network (C4)PlatformSite Specific (C10)Replicability
ComplexityImplementation (C5)Trans-Disciplinary
New Tool
Digital Fabrication
Optimization (C11)
Sustainability Oriented (C6)Scenario *
Sustainability *
Policy *
Resilience
Market Oriented (C12)Lab *
Industry *
Tool *
* Code derived from bibliometric analysis from Scopus.
Table 3. Distribution of type of the Interreg projects as a function of the ERDF topics.
Type of Project No. of Projects
A. Research and innovation.(1) Strengthening research, technological development, and innovation.12
(9, 10, 11) Social inclusion, education, and formation, Enhancement of public administrations11
B. SME competitiveness.(3) Enhancing the competitiveness of SMEs.6
C. Low-carbon economy.(4) Supporting the shift towards a low-carbon economy in all sectors8
D. Environment and resource efficiency.(5) Promoting climate change adaptation, risk prevention, and management.3
(6) Preserving and protecting the environment and promoting resource efficiency.5
(7) Promoting sustainable transport and removing bottlenecks in key network infrastructures.2
Disclaimer/Publisher’s Note: The statements, opinions and data contained in all publications are solely those of the individual author(s) and contributor(s) and not of MDPI and/or the editor(s). MDPI and/or the editor(s) disclaim responsibility for any injury to people or property resulting from any ideas, methods, instructions or products referred to in the content.

