Article

Assessing the Impact of Farm-Management Practices on Ecosystem Services in European Agricultural Systems: A Rapid Evidence Assessment

by
Kato Van Ruymbeke
1,*,
Joana G. Ferreira
2,
Vasileios D. Gkisakis
3,
Jochen Kantelhardt
4,
Gordana Manevska-Tasevska
5,
Peter Matthews
6,
Andreas Niedermayr
4,
Lena Schaller
4,
Katarzyna Bańkowska
7,
Kewan Mertens
1,8 and
Liesbet Vranken
1
1
Department of Earth and Environmental Sciences, Katholieke Universiteit (KU) Leuven, 3000 Leuven, Belgium
2
Department of Rural Economy, Environment and Society, Scotland’s Rural College (SRUC), Edinburgh EH9 3JG, UK
3
Hellenic Agricultural Organization (ELGO-DIMITRA), 11528 Athens, Greece
4
Institute of Agriculture and Forestry Economics, Universität für Bodenkultur Wien (BOKU), 1180 Wien, Austria
5
Department of Economics, Agrifood Economic Centre, Swedish University of Agricultural Sciences (SLU), 750 07 Uppsala, Sweden
6
School of Anthropology and Conservation, University of Kent, Canterbury CT2 7NZ, UK
7
Department of Economic Modelling, Institute of Rural and Agricultural Development, Polish Academy of Sciences, PL-02-668 Warsaw, Poland
8
CSI i3—Center for Sociology of Innovation i3, National School of Mines of Paris (Mines Paris-PSL), 75006 Paris, France
*
Author to whom correspondence should be addressed.
Sustainability 2023, 15(17), 12819; https://doi.org/10.3390/su151712819
Submission received: 14 July 2023 / Revised: 15 August 2023 / Accepted: 21 August 2023 / Published: 24 August 2023

Abstract

:
Many farm-management practices focus on maximizing production, while others better reconcile production with the regulation of ecological processes and sociocultural identity through the provisioning of ecosystem services (ESs). Though many studies have evaluated the performance of management practices against ES supply, these studies often focused on only a few practices simultaneously. Here, we incorporate 23 distinct management practices in a rapid evidence assessment to draw more comprehensive conclusions on their supply potential across 14 ESs in European agriculture. The results are visualized using performance indicators that quantify the ES-supply potential of a given management practice. In total, 172 indicators are calculated, among which cover crops are found to have the strongest positive impact on pollination-supply potential, while extensive livestock management is found to have the strongest negative impact for the supply potential for habitat creation/protection. The indicators also provide insight into the state of the peer-reviewed literature. At both the farm and territorial levels, the literature noticeably fails to evaluate cultural services. Further, disparities between the number of indicators composed at the farm and territorial levels indicate a systematic bias in the literature toward the assessment of smaller spatial levels.

1. Introduction

Agroecosystems are, arguably, one of the most important ecosystems for sustaining human wellbeing. Not only do we rely on these systems for provisioning ecosystem services (ESs) such as food—they also provide many non-productive benefits, such as recreation, regulation of natural hazards, and carbon sequestration [1,2]. Historically, however, these systems have been primarily managed to sustain food production and other provisioning ESs [3,4,5], with preservation of non-productive ESs (e.g., regulation and maintenance ESs and cultural ESs) put largely on the backburner [2]. That is not to say that both productive and non-productive ESs cannot be maintained simultaneously. Through well-planned and regulated farm-management practices, we can manage agroecosystems to ensure long-term sustainability, finding a balance between meeting demands for productive output and maximizing environmental and social performance [6,7,8,9].
With this understanding, European agricultural policies increasingly incorporate support for agricultural management aimed at maintaining environmental and social wellbeing by leveraging ESs. In the 2023–2027 EU Common Agricultural Policy (CAP) reform, instruments such as enhanced conditionality and eco-schemes specifically link subsidy payments to the adoption of more ecological farm-management practices [10]. Currently, these instruments are primarily enforced through action-based payment schemes, where farmers receive compensation for adopting specific management practices [2,11]. However, action-based payment schemes are often criticized for lacking sensitivity to local conditions, which may hinder their environmental effectiveness [12]. Result-based payment schemes, through which farmers receive compensation that is conditional on achieving pre-established (environmental) results, are, therefore, increasingly being considered for their ability to allow farmers the freedom to select practices tailored to local conditions [12]. Regardless of the payment schemes adopted, the increased incorporation of ES-based policy schemes highlights the need for a clear understanding of the link between farm-management practices and ESs in European agroecosystems.
The academic literature provides an overwhelming database of evidence evaluating ESs within the context of agricultural management [13]. For examples, see [14,15,16]. However, few efforts have been made to synthesize this evidence, and those articles that do synthesize this evidence have a tendency to incorporate, simultaneously, no more than a handful of practices and/or ESs. Nonetheless, due to their ability to synthesize a wide berth of information in a relatively short period of time, evidence syntheses are able to fulfil the current need for evidence-based informed policy decisions in environmental planning [17]. Indeed, such a synthesis may help in identifying patterns and trends in the literature to determine which management practices can be linked to which ESs (and how) and how often these practices have been studied.
Accordingly, in this article, we perform a systematic evidence synthesis to evaluate the impact of farm-management practices on ES-supply potential, delineating the impacts of 23 farm-management practices on 14 ESs at the farm and territorial levels across farming systems in Europe. To improve the interpretation of our results and to facilitate comparisons, we visualize the obtained information using performance indicators. These indicators quantify the ES-supply potential of given management practices, based on the availability and the quality of evidence derived from the academic literature.
The goal of the work carried out in this paper was to gain a comprehensive overview of the impact of farm-management practices on ES supply in Europe. Such an overview may be used to inform ES-based policy schemes by summarizing the potential impact of farm-management practices on an ES. In this way we may inform action-based payment schemes by identifying which practices are most eligible for subsidies. Alternatively, our results may form a vital step in moving toward more results-based payment schemes, whereby the performance indicators serve as intermediate steps in moving toward quantifying specific impacts of farm-management practices on ESs.
As in the study in [18], we do not claim that the indicators presented in this paper are decisive measures of the impact of farm-management practice on ES supply. Rather, we assert that the proposed indicators are valuable in providing a first attempt at summarizing the multitude of evidence that is available in the literature in a concise, intuitive, and transparent manner. In this way, we hypothesize that by consolidating the academic evidence that evaluates management practices against ESs, we will gain a better understanding of the current state of affairs in the literature, identify where (and what) evidence is missing, and open a discussion on how to go about utilizing the information we already have and filling the remaining information gaps.

2. Materials and Methods

Data were extracted from the secondary literature (i.e., articles synthesizing evidence from the primary literature, e.g., meta analyses) by carrying out a systematic evidence synthesis, specifically a rapid evidence assessment, following the review approach proposed by Cochrane (2022) [19]: (i) identifying the relevant studies; (ii) selecting studies for inclusion based on predefined criteria; (iii) systematically collecting data; and (iv) synthesizing the data. In Section 2.1, we provide an overview of the data-collection strategy. (A more detailed description of the rapid evidence assessment protocol can be found in the Supplementary Materials (File S1) Next, we describe the evidence-synthesis process (Section 2.2), the mathematical approach used to calculate performance indicators from the evidence obtained during the evidence synthesis (Section 2.3), the intended interpretation of the indicators (Section 2.4), and the sensitivity analyses that were carried out to test the assumptions made in composing the indicators (Section 2.5).

2.1. Selection of Farm-Management Practices and Ecosystem Services

In a first step, we needed to decide which practices to focus on and to evaluate them in terms of their potential to supply ESs. Twenty-three practices were included in the analysis. The list of selected management practices was compiled in consultation with eight (research) experts across eight European countries during a workshop, combined with the extensive list of European practices identified by [20] during a systematic review of the literature. The common international classification of ecosystem services (CICES) [1] was used to select the ESs included in this study.

2.2. Systematic Evidence Synthesis: Rapid Evidence Assessment

Rapid evidence assessments are designed to be less resource-intensive and time-intensive—taking a couple of months to complete—while at the same time maintaining a transparent methodology and minimizing bias [17,21]. In addition to analyzing the impact of interventions (e.g., farm-management practices), rapid evidence assessments enable a critical appraisal of the volume and characteristics of available evidence [17,21]. Therefore, a rapid evidence assessment was adopted in this paper, allowing us to obtain a large amount of data regarding both the impact of management practices on ESs and the state of the current literature, in a relatively short amount of time.

2.2.1. Selection of Papers and Inclusion Criteria

To compose the final search string, we adopted an iterative process that consisted of formulating separate search strings for each individual management practice, combining these into a composite search string, evaluating the search-string hits against the inclusion of a set of pre-defined test papers, and adjusting the search string where necessary until all test papers appeared among the hits. The search string (File S1: Table S2), the full list of management practices (File S1: Table S3), and the test papers included in this assessment can be found in the Supplementary Materials (File S1).
Prior to carrying out the rapid evidence assessment, a clear ex ante delineation of population, intervention/exposure, comparator, and outcome (PICO) [22] was established, based on the objectives (Table 1). The PICO components were used to inform the inclusion criteria for sample selection. Articles were included based on the geographic scope, the study type, the language, and the intervention (i.e., the management practices linked to ESs). Ultimately, only English-language secondary literature that measured the impact of a management practice on the supply of an ES in Europe, either partially or completely, were included. The inclusion criteria are described in more detail in File S1.
The search was conducted on 21 April 2020, exclusively in the Web of Science platform [23]. This resulted in 2228 hits. Reviewers consisted of 13 researchers from nine research institutions across Europe. Through title-screening and abstract-screening, a total of 647 articles were selected for inclusion. Reviewers extracted meta-analytic data from the articles, such as type of review, location of study, management practice(s) considered, level of assessment (e.g., farm level or territorial level), and ESs assessed. Farm levels and territorial levels of assessment were identified, based on the spatial scale specified within the article, referring to the scale at which the ESs were measured. To facilitate the reading and data extraction process within a reasonable time frame, a targeted selection of the 647 articles was carried out for full-text screening (similar to the process used in [24] for personal communication). Where possible, targeted sampling consisted of randomly selecting up to five articles (of which one was a meta-analysis) per management practice. This resulted in a total of 99 articles being screened at full-text level. (Some management practices were only scarcely evaluated in the literature, so that five distinct articles did not exist in our corpus from which to take a random selection. If fewer than five articles for a single management practice were included in the corpus, all articles for such a practice were considered in the random selection.) Another 12 articles were excluded based on the exclusion criteria, resulting in a final corpus of 87 articles from which observations were extracted.

2.2.2. Data Extraction

For each synthesis article, quantitative, and expert-mediated qualitative data for the link between management practices and an ES were extracted into a database, within which the impact on the supply potential of an ES was coded as 1 (negative impact), 2 (inconclusive impact), or 3 (positive impact). (The exact data extraction process is described in more detail in the protocol included in the Supplementary Materials (File S1)). Observations were defined as expert-mediated qualitative observations reflecting the negative, inconclusive, or positive supply potential of an ES from a management practice. As we considered only secondary literature, multiple observations of the same management practice–ES link could be extracted from a single article.
During full-text screening, reviewers also evaluated the quality of each article across 26 standardized quality criteria adapted from [25,26] (Supplementary Materials File S1: Table S5). The criteria reflected the quality of the included synthesis articles across all steps of the review process, including the literature search, data extraction, data analysis, and interpretation [27]. The criteria included whether the research questions and objectives were explicitly stated, whether inclusion/exclusion criteria were mentioned, whether the full dataset was available to the reader, and whether issues related to bias within and across studies were raised. For each of the 26 criteria, reviewers were asked to indicate whether it was addressed (yes/no) in the article under consideration. A single final quality score, ranging from 0 to 1, was attributed to each article through a weighted averaging of the performance across the 26 quality criteria. The weighting of the criteria was achieved during a one-off exercise, in which reviewers were asked to indicate, on a scale of 1–5, how important they considered each of the 26 criteria in determining the quality of an article. Quality scores were calculated for each article included in the rapid evidence assessment. Accordingly, all observations derived from the same synthesis article had the same article quality score.

2.3. Calculating the Indicator(s)

The indicators that were composed, based on the evidence derived from the rapid evidence assessment, reflected the supply potential of an ES from a single farm-management practice in the context of European agriculture. To compose indicators from the expert-mediated qualitative observations, a weighted arithmetic mean was calculated, on the basis of which observations (i.e., negative, inconclusive, or positive impacts for a practice–ES link) were weighted against the single-quality score of the synthesis article from which they were derived. The integration of the observations with the quality criteria is illustrated in Equation (4), and the full process of indicator composition is illustrated in Figure 1.
Relying on expert-mediated qualitative data derived from secondary literature, we observed a need to incorporate a measure of confidence in the conclusions put forward by our evidence synthesis and the resulting indicators. Due to the nature of this qualitative data, we were not able to incorporate traditional confidence measures, such as confidence intervals. Instead, we relied on the quality and the quantity of the evidence and formalized this into what we referred to as the correction factor, to provide us with an indication of confidence.
Both the quality of the literature and the quantity of evidence that could be derived reflected the confidence we had in the results put forward by the secondary literature. The quantity of evidence was an important aspect of confidence, as it illustrated the degree to which a certain management-practice–ES link had been studied. Our confidence in conclusions drawn from 100 observations was naturally higher than our confidence in conclusions drawn from only five observations. We considered the quantity of evidence at the observation level (i.e., the number of observations per practice–ES link), rather than at the article level (i.e., the number of synthesis articles), because one synthesis article may have contained several observations of a specific management-practice–ES link. In such circumstances, multiple observations from a single article reflected evidence from various primary studies in the literature. While quantity of evidence mattered, we also wanted to differentiate between much evidence of low quality and much evidence of high quality. Therefore, we also considered the average article quality of all evidence regarding a specific practice–ES link. The reasoning behind this was that we did not have the same level of confidence in a high number of low-quality observations as we did in a low number of high-quality observations. By incorporating both average quality and quantity of evidence into a single value, the correction factor provided us with an indication of the confidence we could have in the identified impact of management practices on ES-supply potential put forward by the indicators. Equations (1) to (4) illustrate how the quantity and quality of evidence were incorporated into the correction factor ( w j k ).

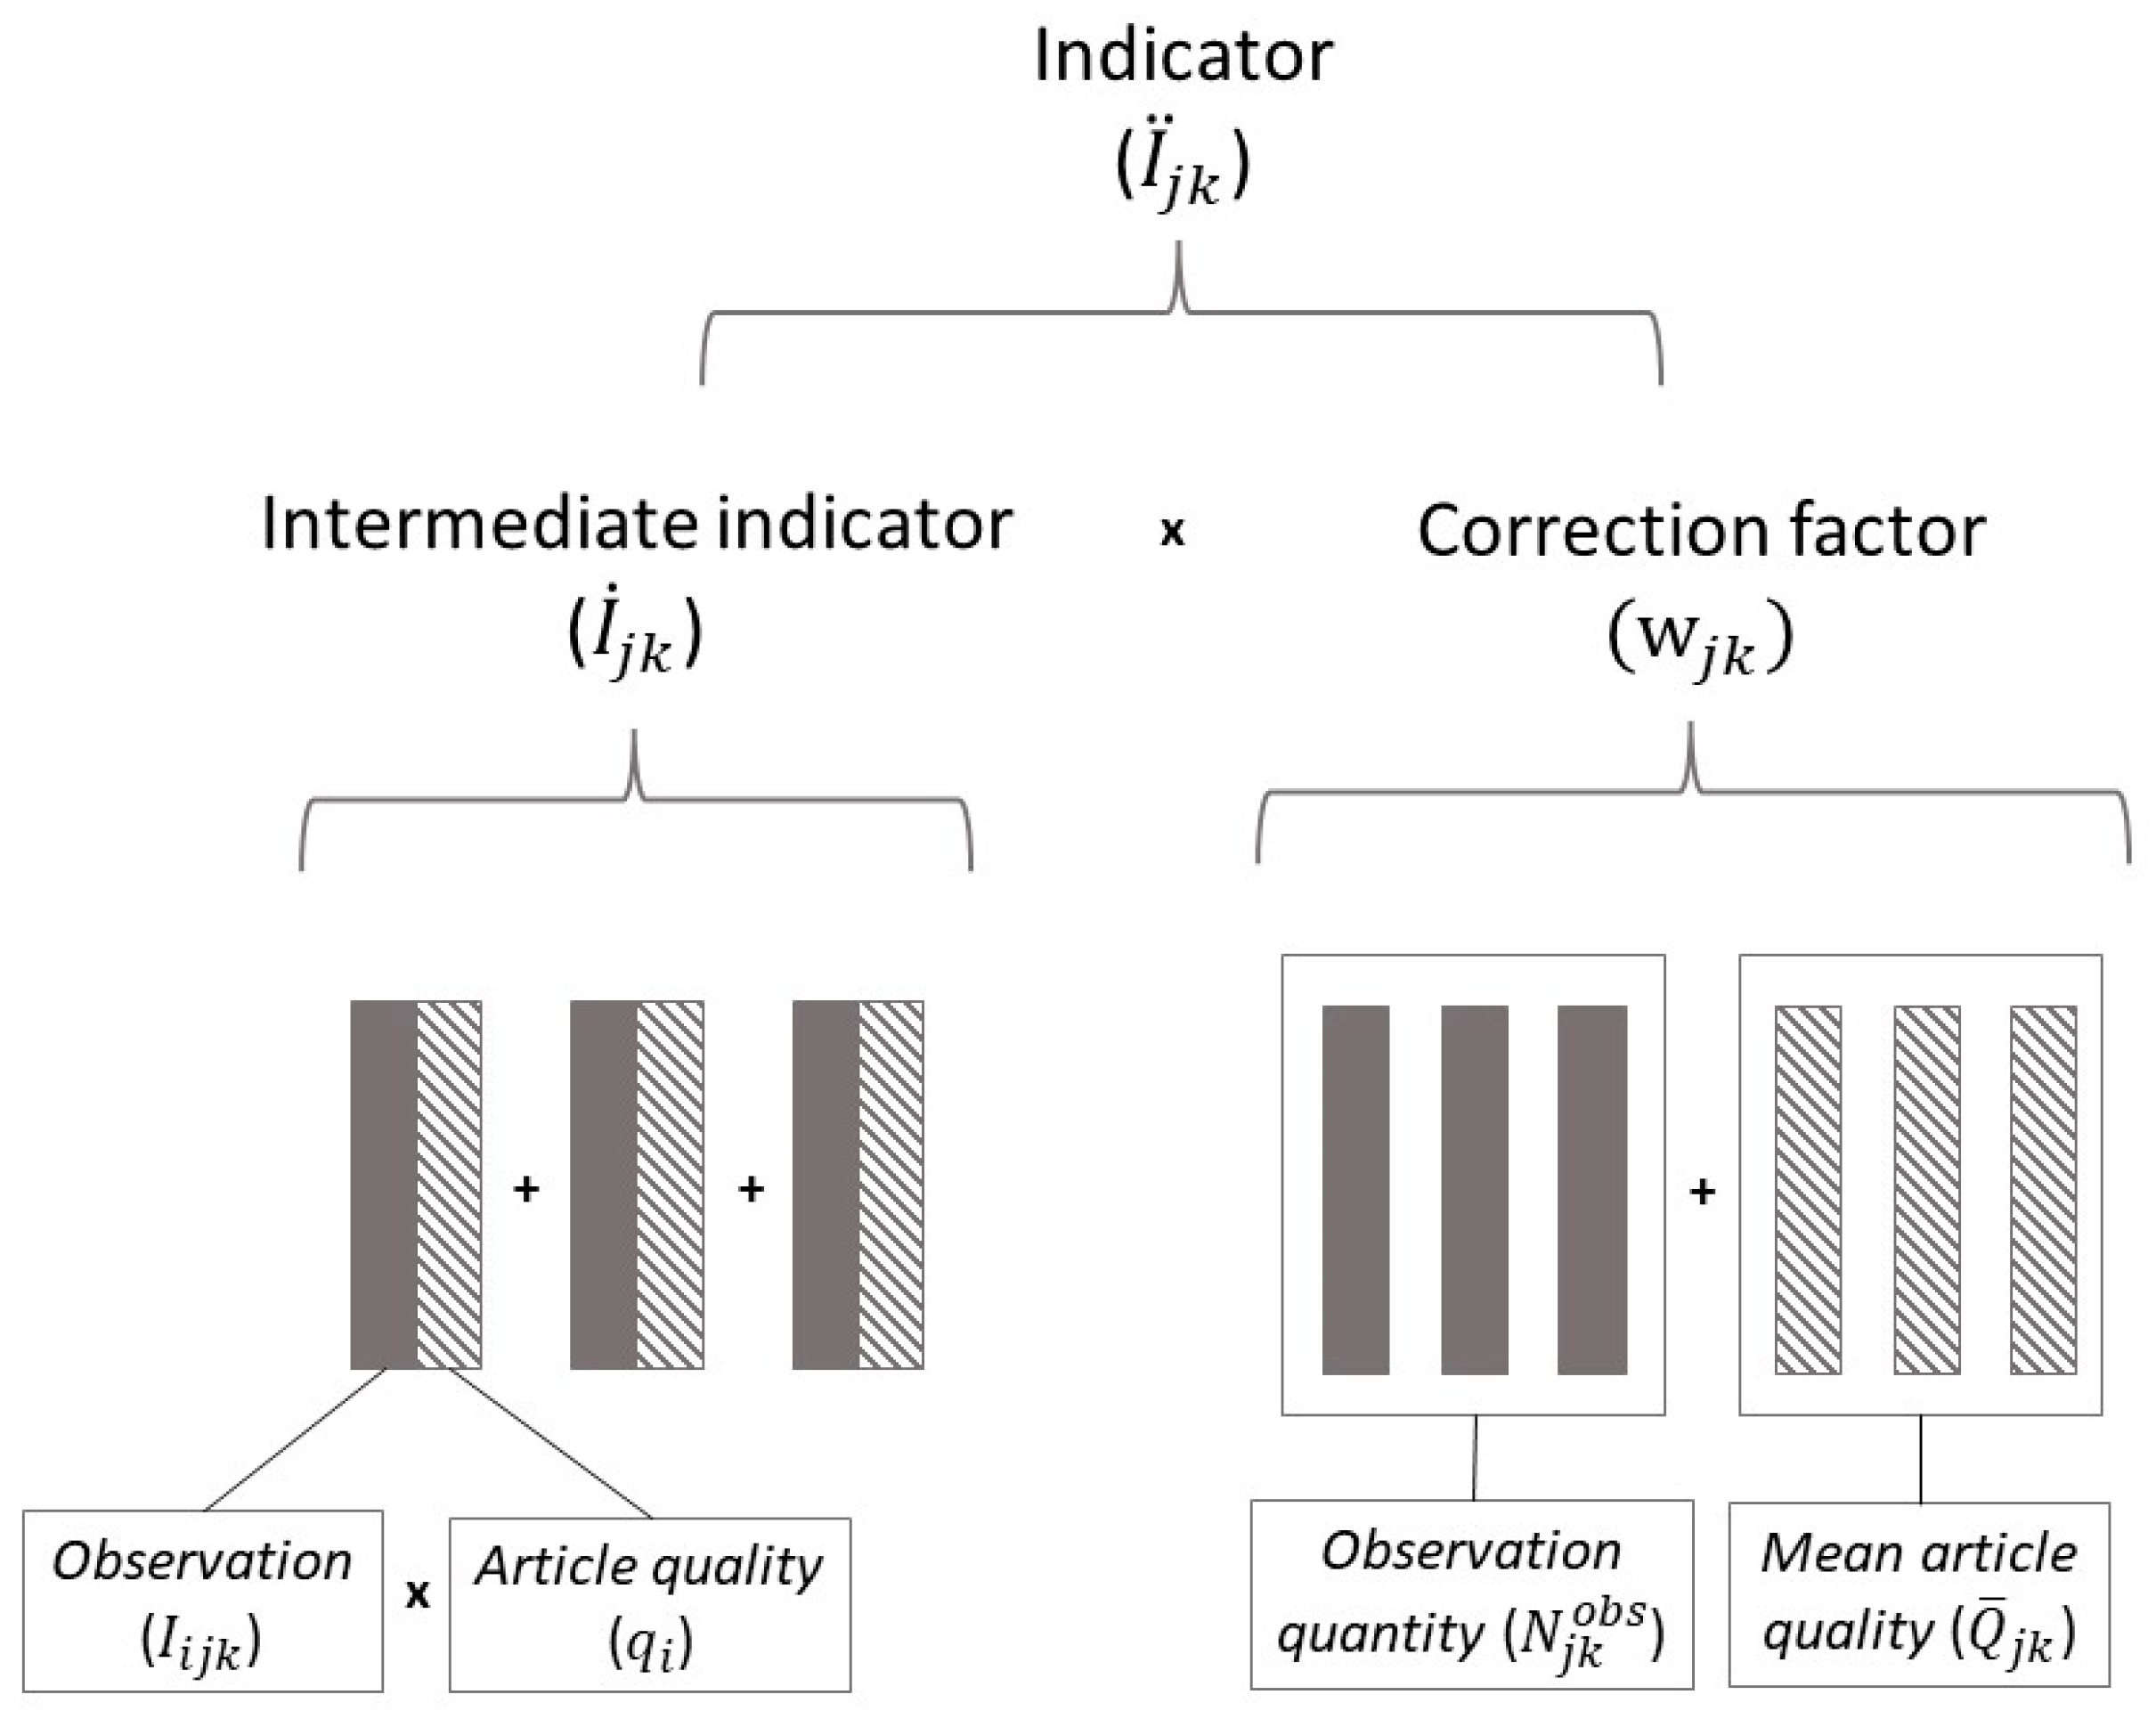
2.3.1. Mathematical Composition

As described above, the correction factor is composed of a measure of the quantity and quality of evidence. For each indicator I ¨ j k , the mean article quality ( Q ¯ j k ) across all synthesis articles evaluating the impact of management practice j on the supply of ES k was calculated as follows:
Q ¯ j k = i = 1 N j k o b s q i N j k o b s
where q i is the article quality associated with observation i and N j k o b s is the total number of observations evaluating the supply of ES k from the management practice j . Q ¯ j k may take a value between 0 and 1.
The quantity of evidence is incorporated into the correction factor by evaluating N j k o b s per indicator. This is achieved by using the cumulative distribution function (CDF) separately for farm-level observations and territorial-level observations. The CDF estimates the probability that each I ¨ j k is based on exactly N j k o b s number of observations, considering the distribution of the number of observations across all indicators at the considered level. Using that approach, we gained an understanding of how well a given ES–management-practice link was studied in the literature and, accordingly, we were able to draw conclusions. Using the exponential distribution, probabilities were estimated as follows:
P N j k o b s < N ¯ o b s = 1 e N j k o b s N ¯ o b s  
where N ¯ o b s is the mean number of observations across all indicators ( N ¯ f a r m o b s = 3.64 and N ¯ t e r r o b s = 1.68 ) and N j k o b s is the number of observations linking management practice j to ES k . The CDF is calculated for each management practice j linked to ES k . The probabilities derived using the CDF are then incorporated with Q ¯ j k , as follows, to obtain a single value for the correction factor ( w j k ):
w j k = Q ¯ j k 1 r + P N j k o b s 0.5 0.5 r
where w j k is the correction factor for I ¨ j k linking management practice j to ES k , calculated based on the mean article quality Q ¯ j k across I ¨ j k , the probability P N j k o b s associated with the number of observations that go into the composition of I ¨ j k , as well as a constant r that reflects the trade-off made between the number of observations ( N j k o b s ) and the mean article quality ( Q ¯ j k ). Such a trade-off is considered because the quality and the quantity of evidence are related, but distinct measures influencing the indicator. r may take a value between 0 and 1, where 0 reflects the full importance being placed on evidence quality (neglecting evidence quantity), 1 reflects the full importance being placed on evidence quantity (neglecting evidence quality), and any value in between reflects a trade-off between the two.
The correction factor is boundless. Hypothetically, an indicator incorporating a high quantity of high-quality evidence may result in a correction factor greater than 1. Likewise, an indicator incorporating a low quantity of low-quality evidence may result in a correction factor less than 0. The latter example may result in a situation where an intermediate indicator incorporates a single inconclusive ( I i j k = 0 ) observation, but the low quantity and the low quality of evidence result in the composition of an indicator with a negative directionality. Due to the normalization of indicators to a scale of -1 to +1, such a situation will only ever result in a very low magnitude indicator. As such, the interpretation of the indicator remains unchanged, as the magnitude is so close to 0 that our confidence in the directionality is too low to draw any corollary conclusions.
By setting r = 0.1 , we assumed that the quality of evidence ( Q ¯ j k ) was more influential in determining our level of confidence in the indicator than the quantity of evidence ( N j k o b s ). Not all of the secondary literature was of equal quality. If special care was not paid to the process of synthesizing evidence from the primary literature, there was a substantial risk of drawing biased, misinterpreted, and/or incorrect conclusions [28]. Therefore, by placing more importance on Q ¯ j k we were able to correct our observations for these risks. Finally, the correction factor was incorporated into the calculation of the indicator. The indicator was composed using a weighted arithmetic mean, as described in Equation (4).
I ¨ j k = I ˙ j k w j k 2 w j k = i = 1 N j k I i j k q i i = 1 N j k q i w j k 2 w j k
where I ¨ j k is the indicator composed for management practice j linked to ES k , I ˙ j k is the intermediate indicator linking management practice j to ES k , and w j k is the correction factor specific to the interaction between management practice j and ES k (derived in Equation (3)). I ˙ j k is calculated using a weighted mean in which the weighted sum across all observations for a given management-practice–ES link is divided by the sum of all weights. Specifically, I i j k is the coded semi-qualitative value of observation i linking management practice j to ES k (which takes the value of 1, 2, or 3), q i is the article quality associated with observation i , and normalization of the indicator to a scale of −1 to +1 is achieved by subtracting 2 w j k .
The above-described process was carried out for the full set of data derived from the rapid evidence assessment and was repeated for each observation at the farm and territorial levels.

2.3.2. Supplementary Measures

To increase transparency, supplementary measures were reported alongside the indicators. For each I ¨ j k linking management practice j to ES k , the supplementary measures included the correction factor ( w j k ), the quantity of observations ( N j k o b s ), the quantity of articles ( N j k a r t ), and a consensus value ( c j k ). While the first two supplementary measures were also incorporated into the indicator calculation (as illustrated in Section 2.3), the second two supplementary measures were not. Instead, N j k a r t and c j k were reported alongside the indicators to increase transparency and to facilitate interpretation.
Consensus ( c j k ) quantifies the degree to which the various observations included in the calculation of I ¨ j k take the same value. In other words, the consensus value measures the amount of agreement among observations in terms of the reported impact of management practice j on the supply of ES k . Consensus is highly correlated to variance, but it is more suited to illustrate heterogeneity amongst ordinal observations, as it more accurately considers proximities of observations in ordinal scales [29]. Consensus is calculated according to the approach developed by [29], as follows:
c j k = 1 + i = 1 N p I i j k   log 2 1 I i j k I ¯ j k d I i j k
where p i is the relative frequency of the coded semi-qualitative observation I i j k , I ¯ j k is the arithmetic mean value across the vector of all observations of I j k for management practice j linked to ES k as calculated according to Equation (6), and distance d I i j k = I i j k m a x I i j k m i n .
I ¯ j k = I i j k = 1 3 p I i j k I i j k
A complete lack of consensus (i.e., observations taking opposing values) would result in a consensus value of c j k = 0 . In contrast, if all observations took the same value, there would be complete consensus and c j k = 1 .

2.4. Indicator Interpretation

As the indicators are dimensionless, they should be interpreted according to their directionality and their magnitude. In this sense, the indicators illustrated the big picture of how management practices influence the supply potential of ES within the context of European agriculture.
The directionality of an indicator refers to the sign taken on by the indicator value, i.e., whether it is positive or negative. The indicator magnitude refers to the size of the indicator value in the positive or negative direction. In addition to the degree to which observations take the same values, indicator magnitude is determined by the quantity and the quality of the articles from which observations were derived, and the trade-off between the two. Therefore, indicator magnitude is reflective of the current state of the peer-reviewed literature and may be interpreted as an indication of the level of confidence we had in the directionality of the indicator based on the available evidence. We assumed that the combination of a high level of consensus ( c j k 1 ) and a large N j k o b s associated with an indicator implied that the link between a management practice and an ES was strong and easily observed. Under this assumption, we interpreted the indicator magnitude as a measure of the strength of the quantified management-practice–ES link.
The indicator magnitude is jointly dependent on the number of positive, negative, and/or inconclusive observations, as well as on the quality of the articles from which the observations were derived. If more positive/negative observations than inconclusive observations were included in an indicator, and/or if the positive/negative observations were derived from higher-quality articles, the indicator magnitude increased in the positive/negative direction. Alternatively, if more inconclusive observations were included, and/or if these inconclusive observations were derived from higher-quality articles, the indicator magnitude remained low and close to 0.

2.5. Sensitivity Analysis
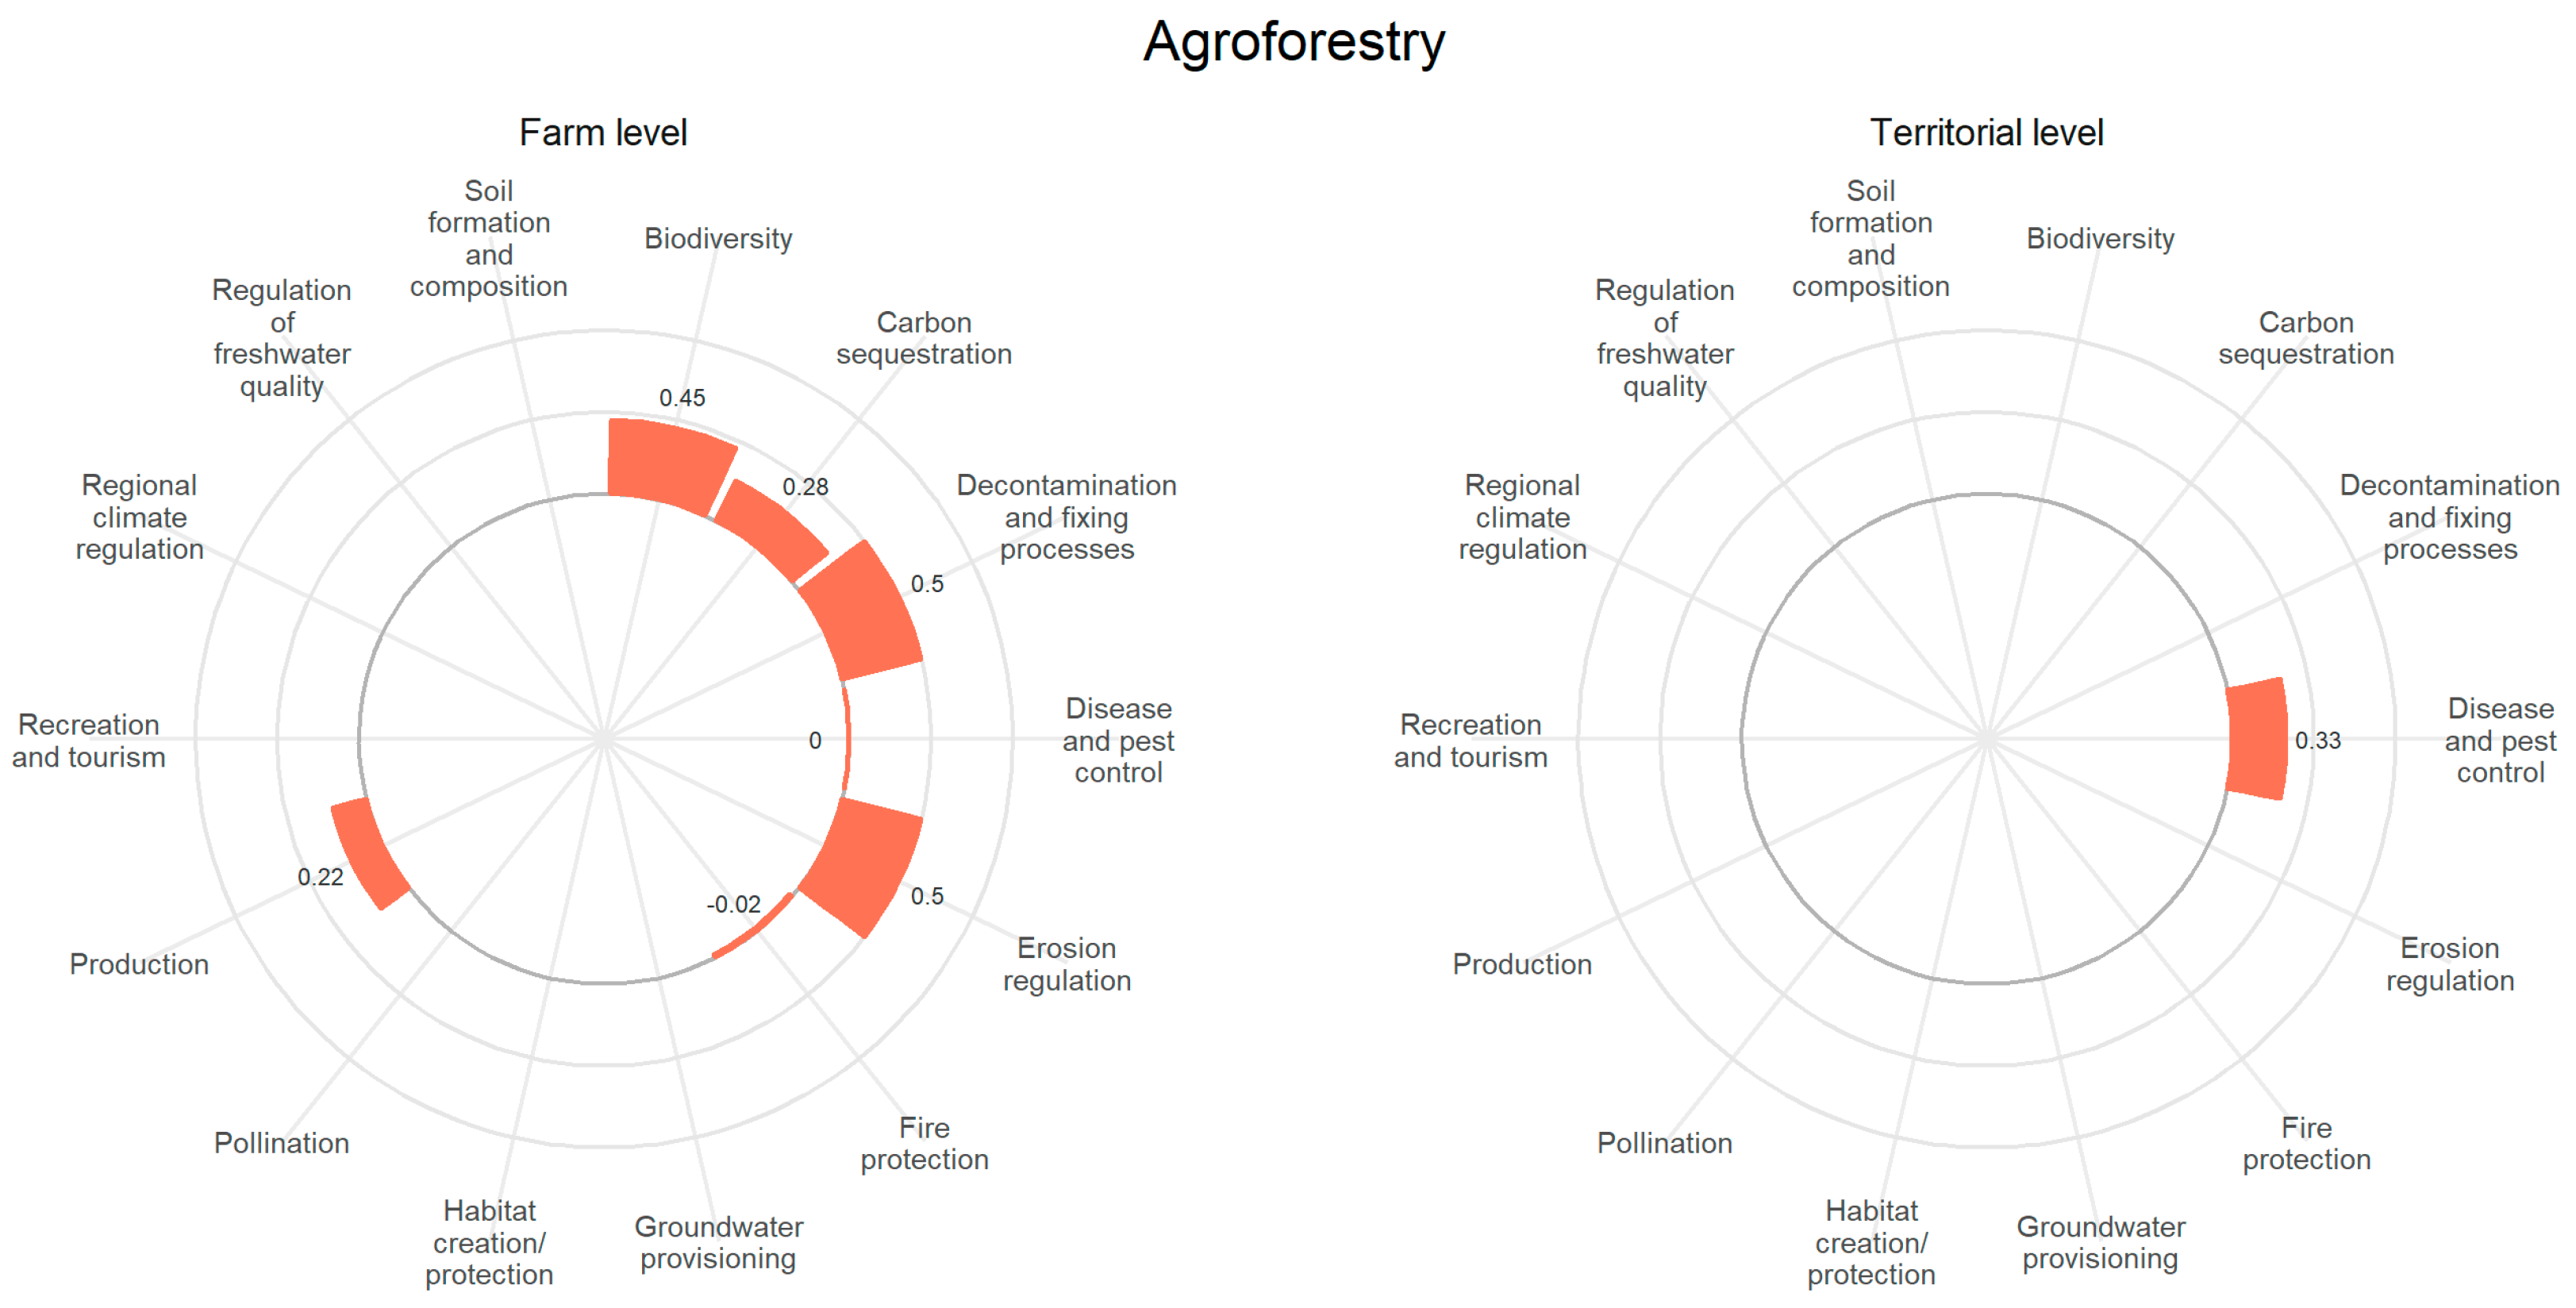
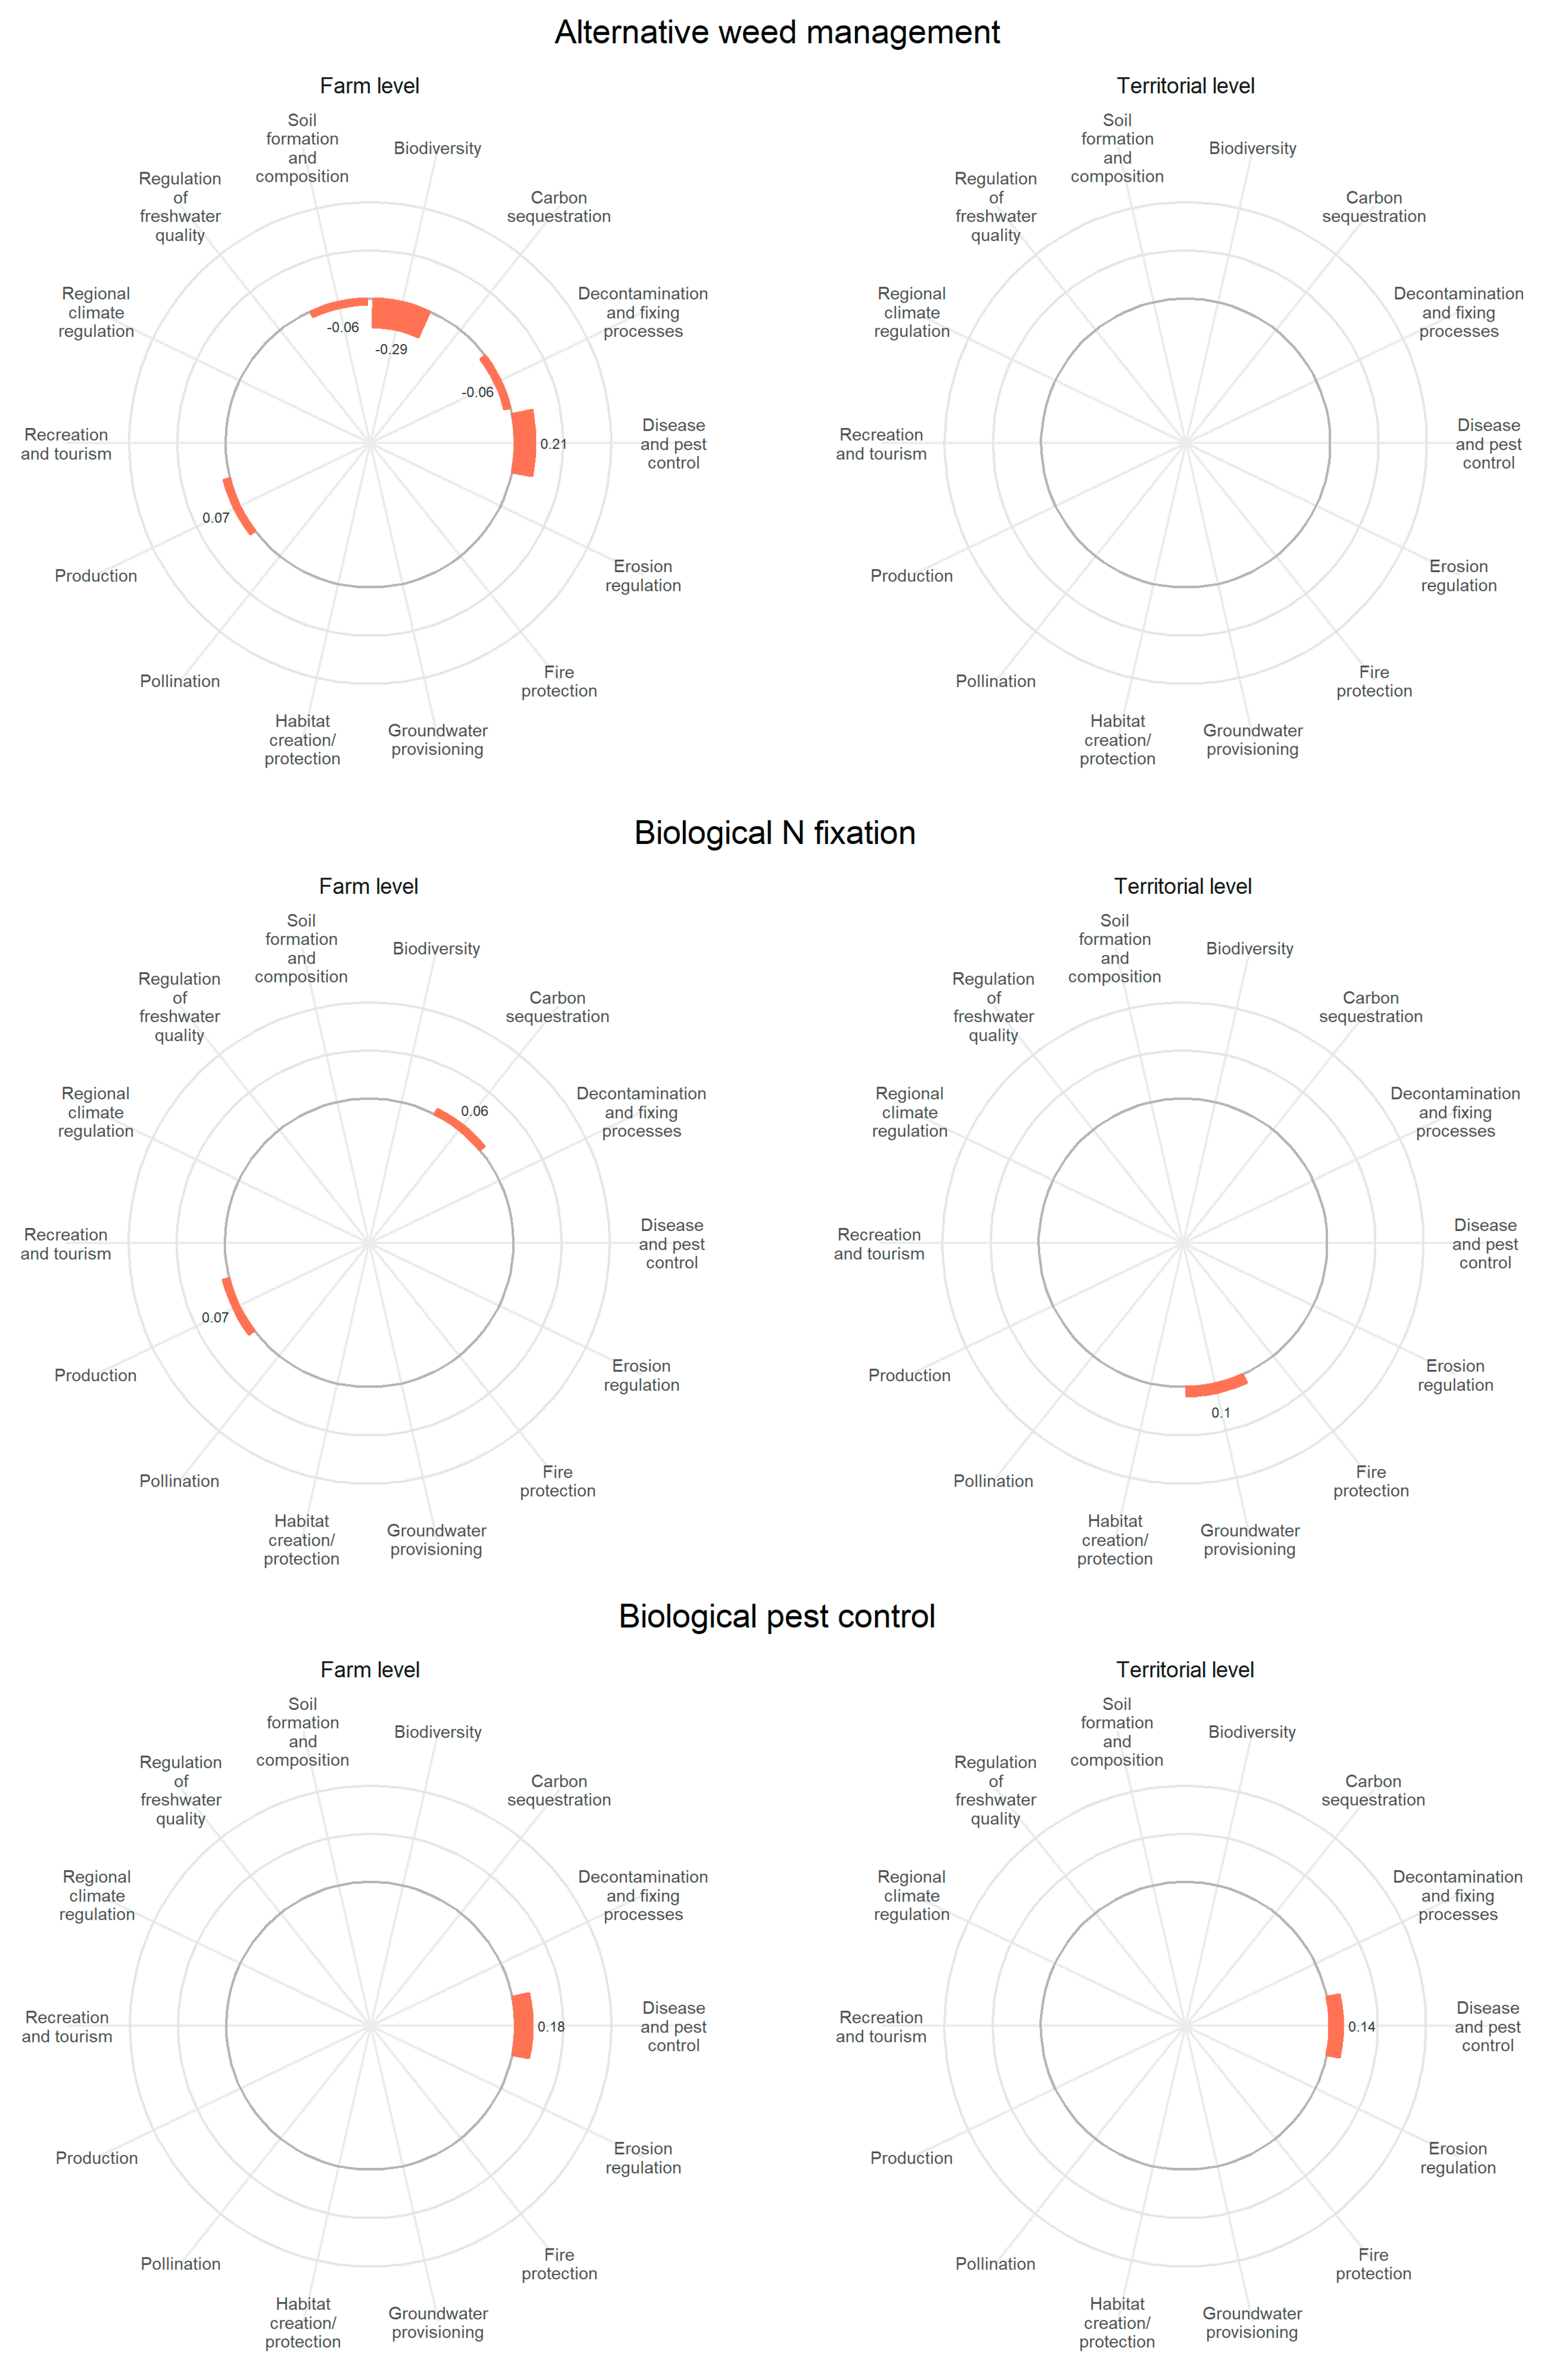
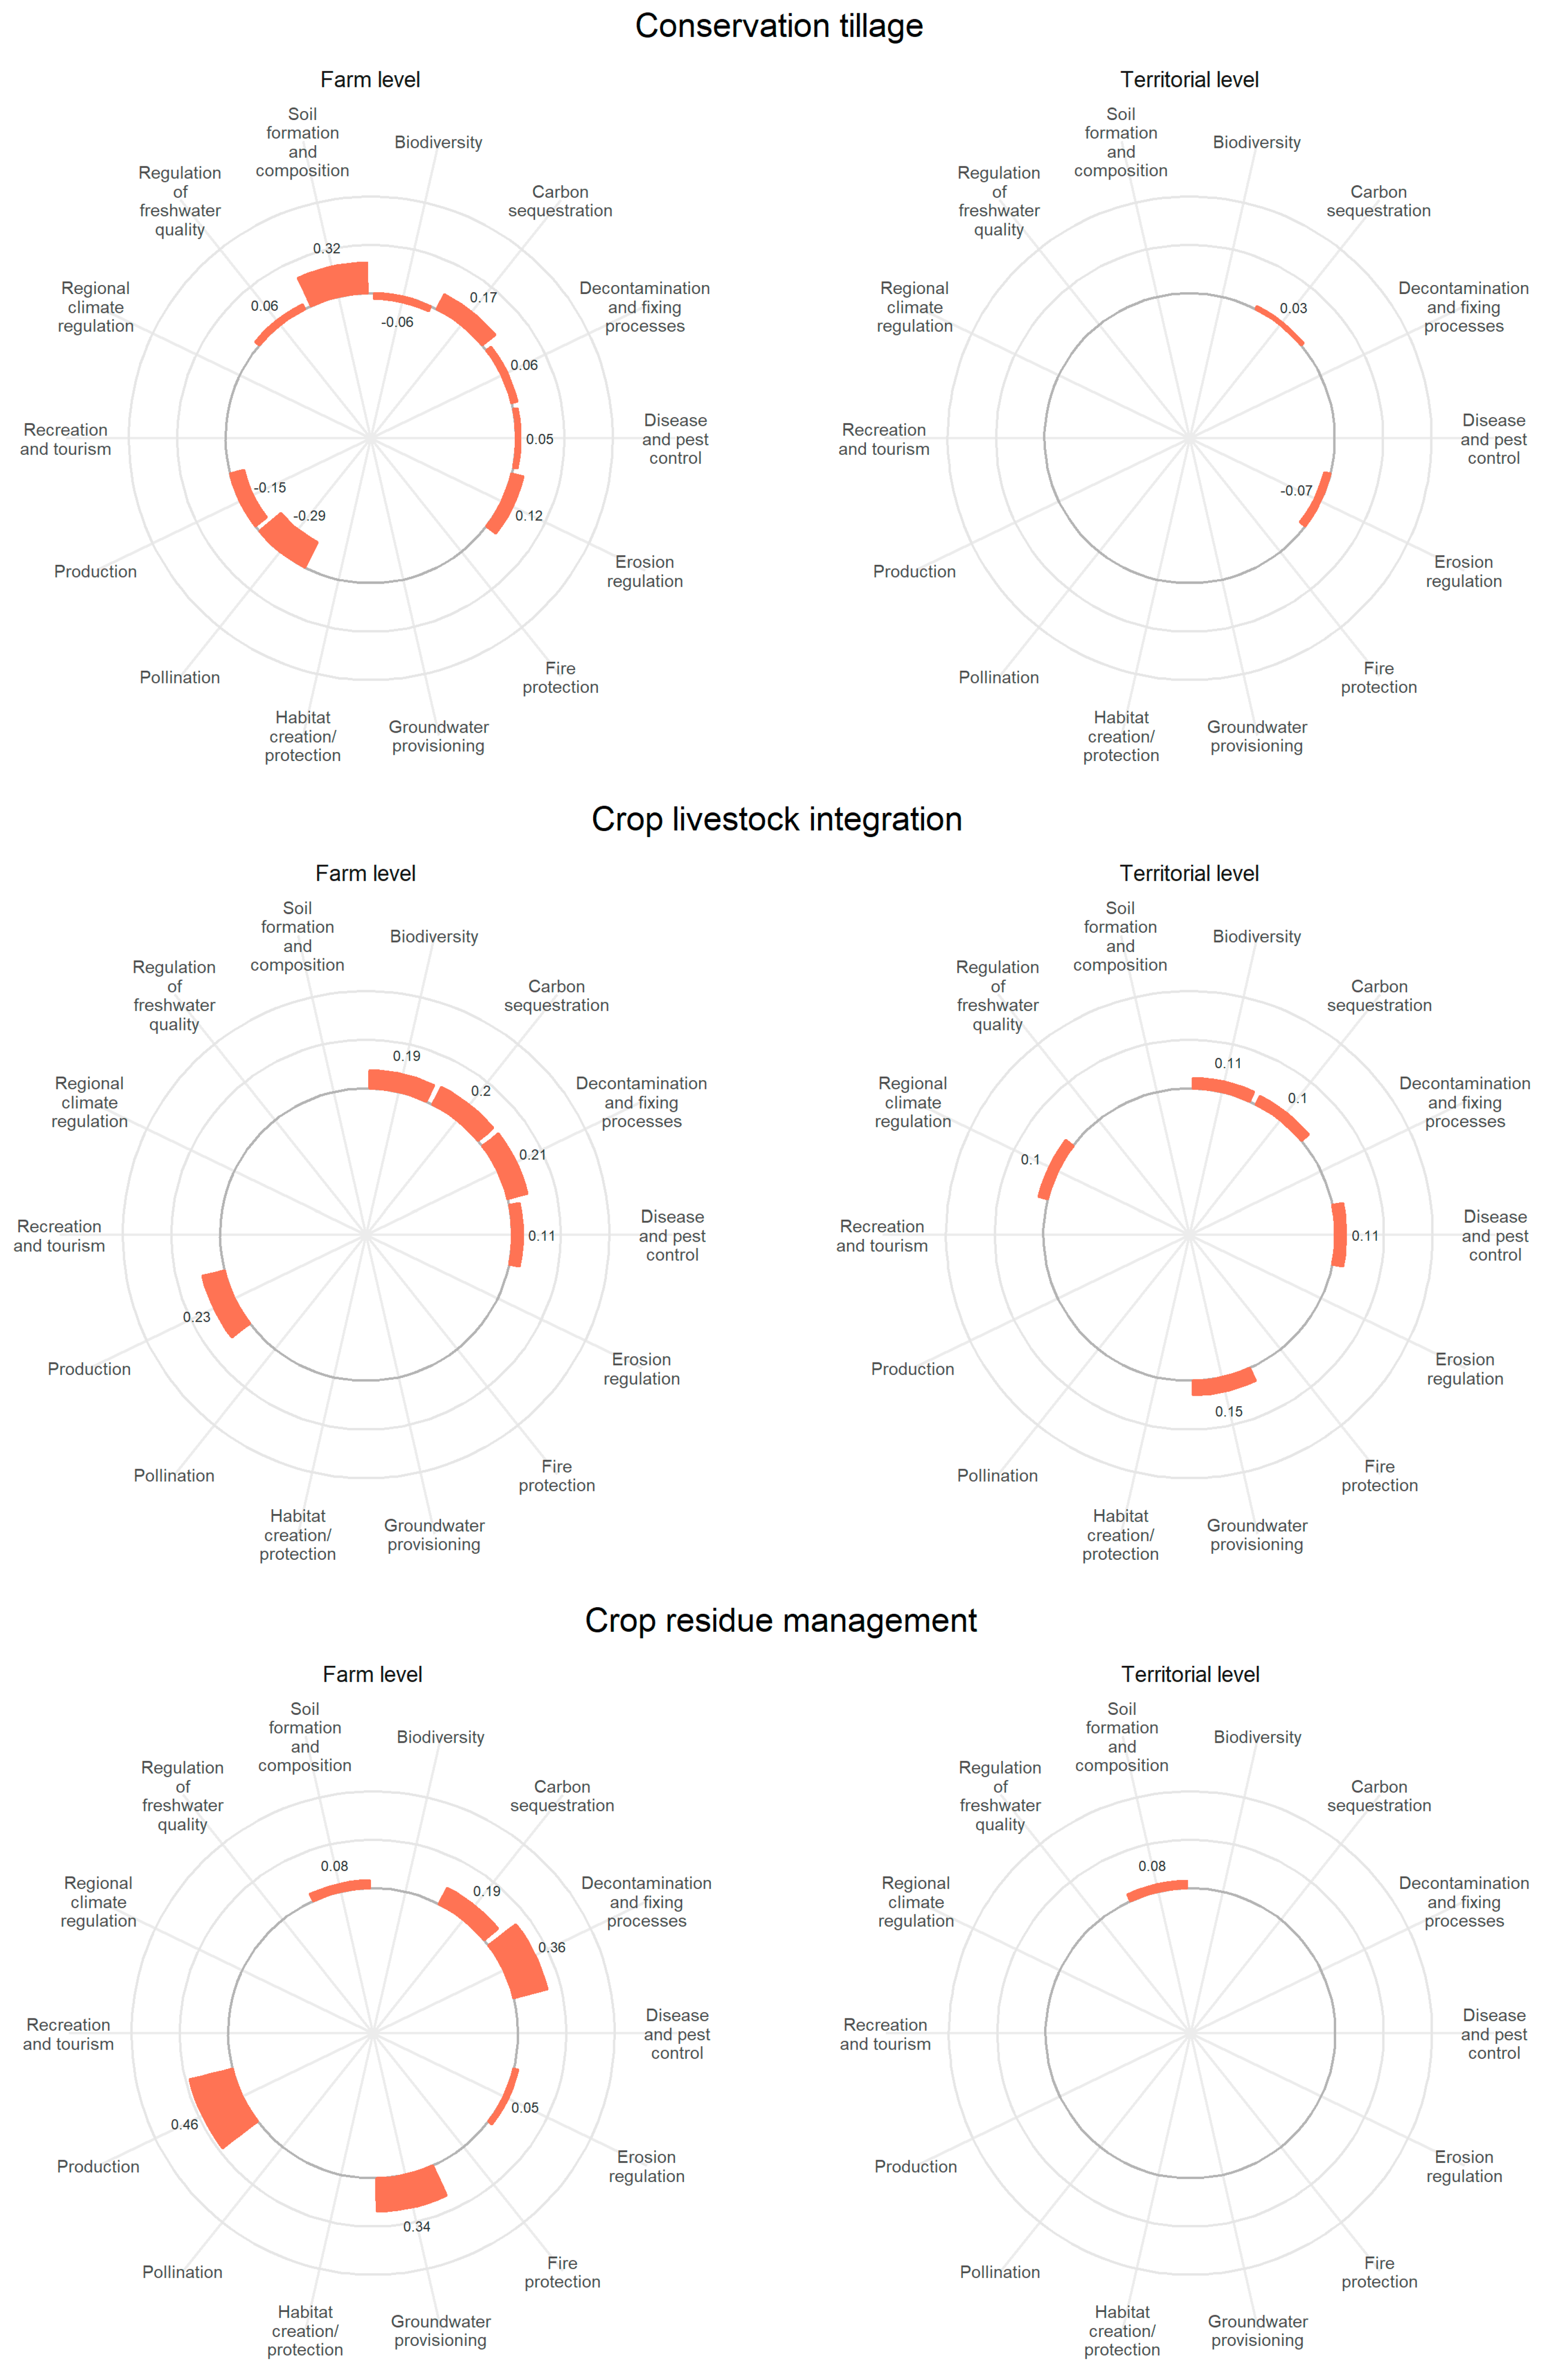
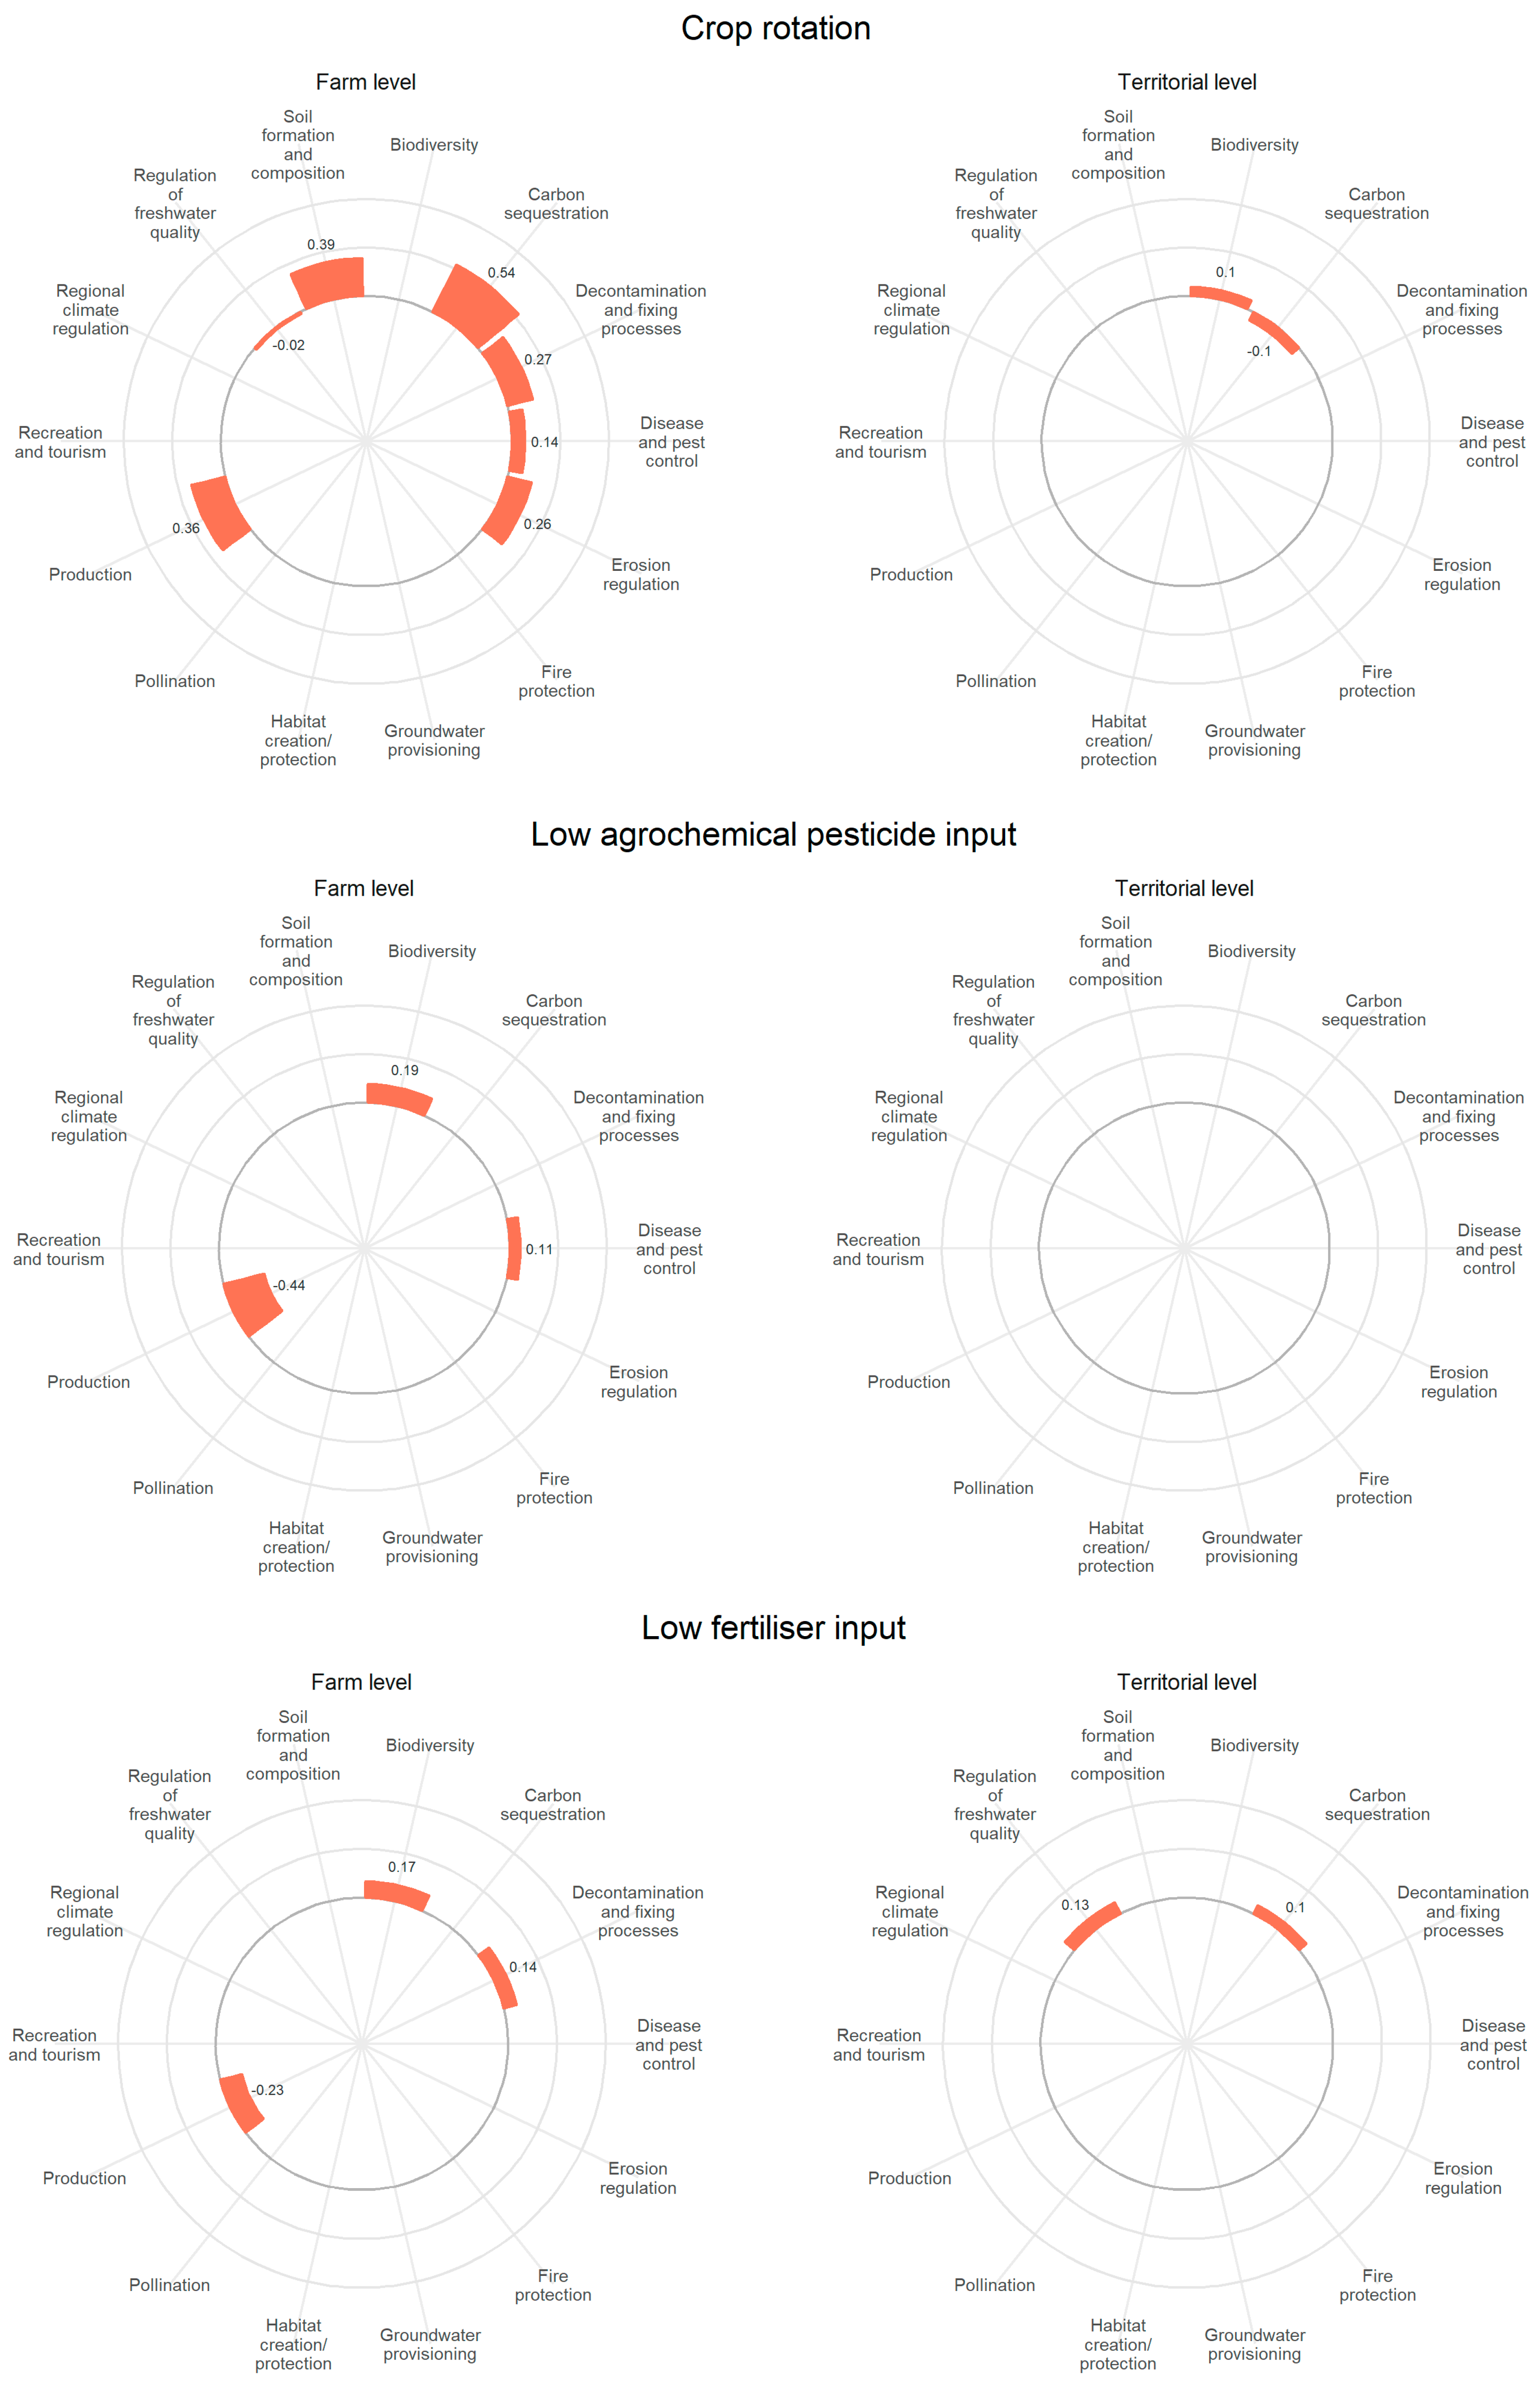
The calculations outlined in Section 2.3 are based on several key assumptions. Therefore, we carried out a sensitivity analysis, in which we relaxed some of these assumptions.
First, as the observations were derived from articles that synthesized results from a variety of primary articles, and because many of the ESs against which management practices were evaluated were quite broadly defined during data collection, we allowed for the extraction of multiple observations for the same management-practice–ES link from the same synthesis article. For this extraction, we performed a separate calculation of the indicators, this time allowing for the inclusion of only one observation per management-practice–ES link from a single article. To test for significant differences between the two sets of indicators, a Kruskal-Wallis test, was performed.
Second, we tested the assumption of the increased importance of evidence quality over quantity that was made in the correction factor ( w j k ). We did this by calculating indicators for each trade-off factor r , ranging from r = 0 to r = 1 , increasing r by 0.1 with each iteration. We carried out a one-way ANOVA to evaluate whether there was a significant difference between the indicators composed using the different values of the trade-off factor r. The results for all sensitivity analyses are presented in Section 3.1.

3. Results

A final corpus of 87 articles was used, linking 23 farm-management practices to 14 ESs across farm systems in Europe. The majority of the articles considered were non-systematic literature reviews (73.11%). A further 15.53% were meta-analyses, 10.04% were systematic reviews, and 1.33% were not considered to be a review of a specific type. Overall, the majority of the articles reported global results (64.58%), from which only results that were relevant for Europe were extracted. Of the articles that specifically considered European case studies, 14.96% considered Europe broadly and 4.93% reported results from northern and northwestern Europe combined. Comparatively, few articles reported results from southern or eastern Europe. The majority of the considered articles evaluated management practices in cropping systems; 13.17% of the articles specifically and singularly evaluated arable and horticultural systems; 8.98% of the articles evaluated permanent cropping systems; and 7.78% of the articles evaluated mixed livestock and cropping systems. Livestock systems (cattle 2.74%; dairy 0.26%) and non-cattle livestock (3.08%) were considered much less frequently.
Based on the database resulting from the rapid evidence assessment, 172 indicators were composed—119 at the farm level and 53 at the territorial level. (If evidence had been found for each management practice linked to each ES, a total of 644 indicators could have been calculated. Therefore, the 172 indicators calculated demonstrated that certain practice–ES linkages were not addressed in the corpus. This did not imply that no linkage existed, but merely that this linkage was not observed during the rapid evidence assessment). Each indicator was made up of three numbers: observations linking management practices to ESs, the article quality associated with each observation, and the correction factor incorporating evidence quality and quantity. Together, these numbers summarized crucial information regarding directionality, confidence, and available evidence in the literature linking a management practice to an ES.

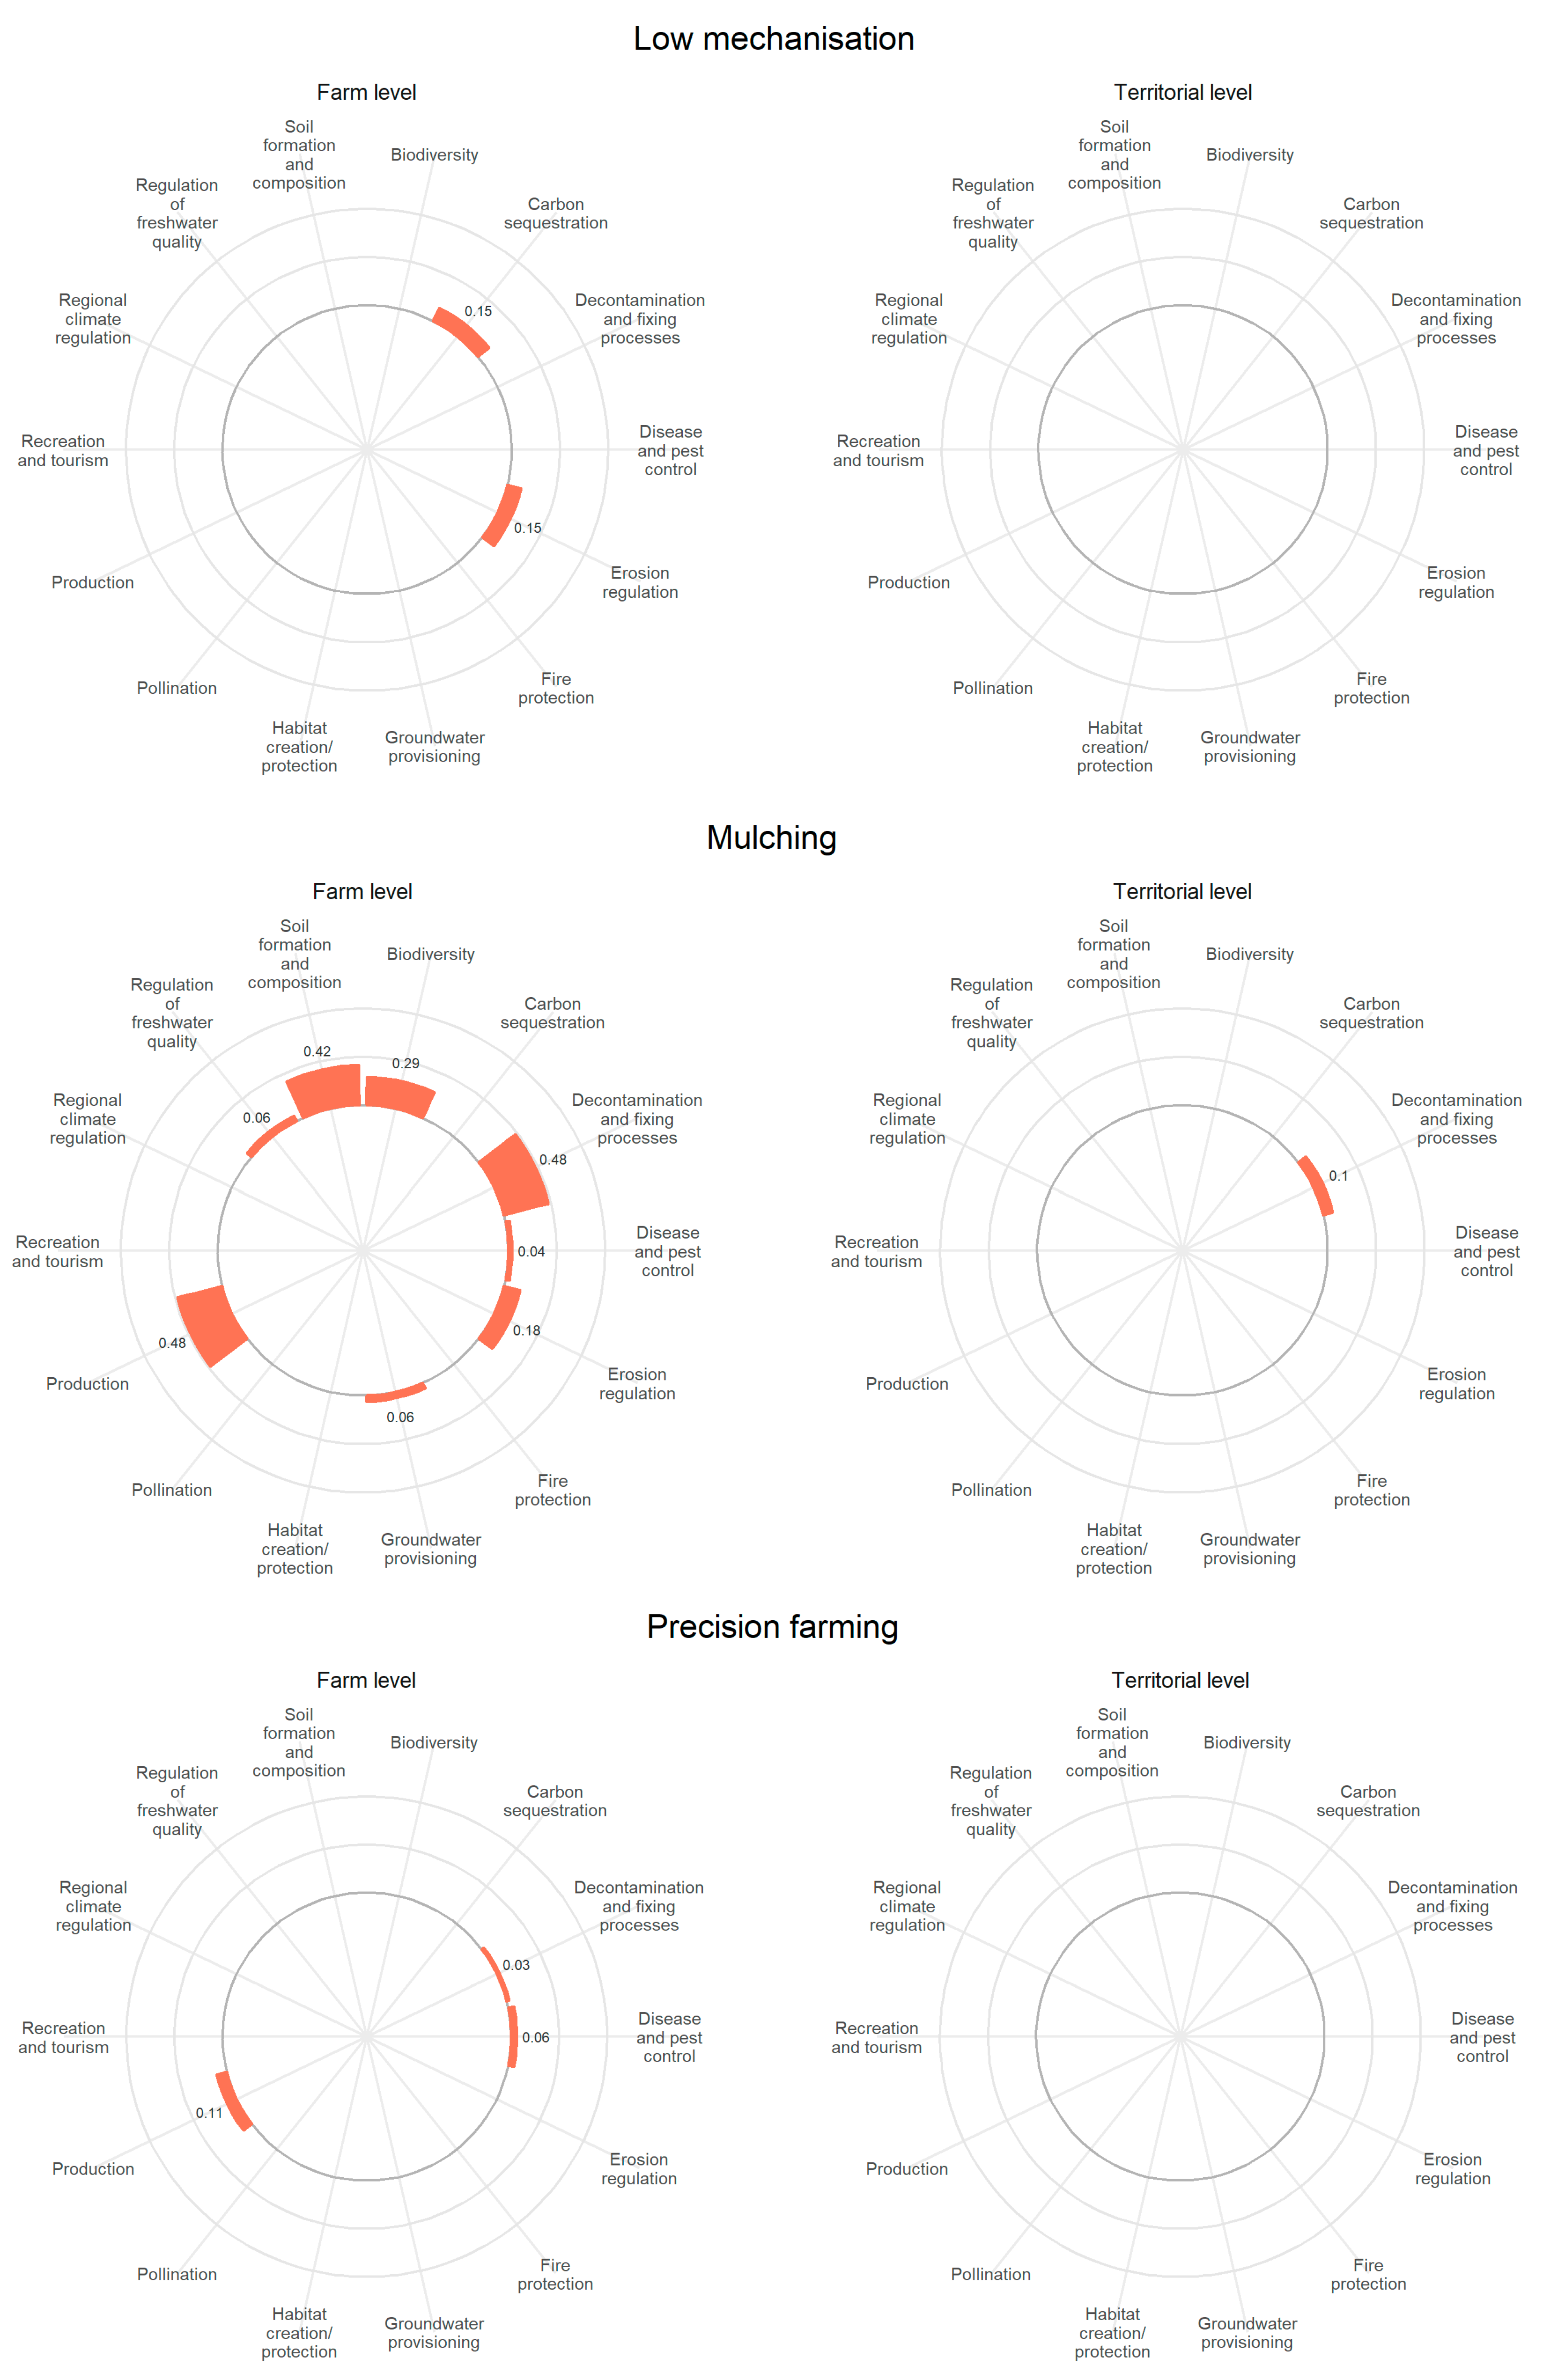
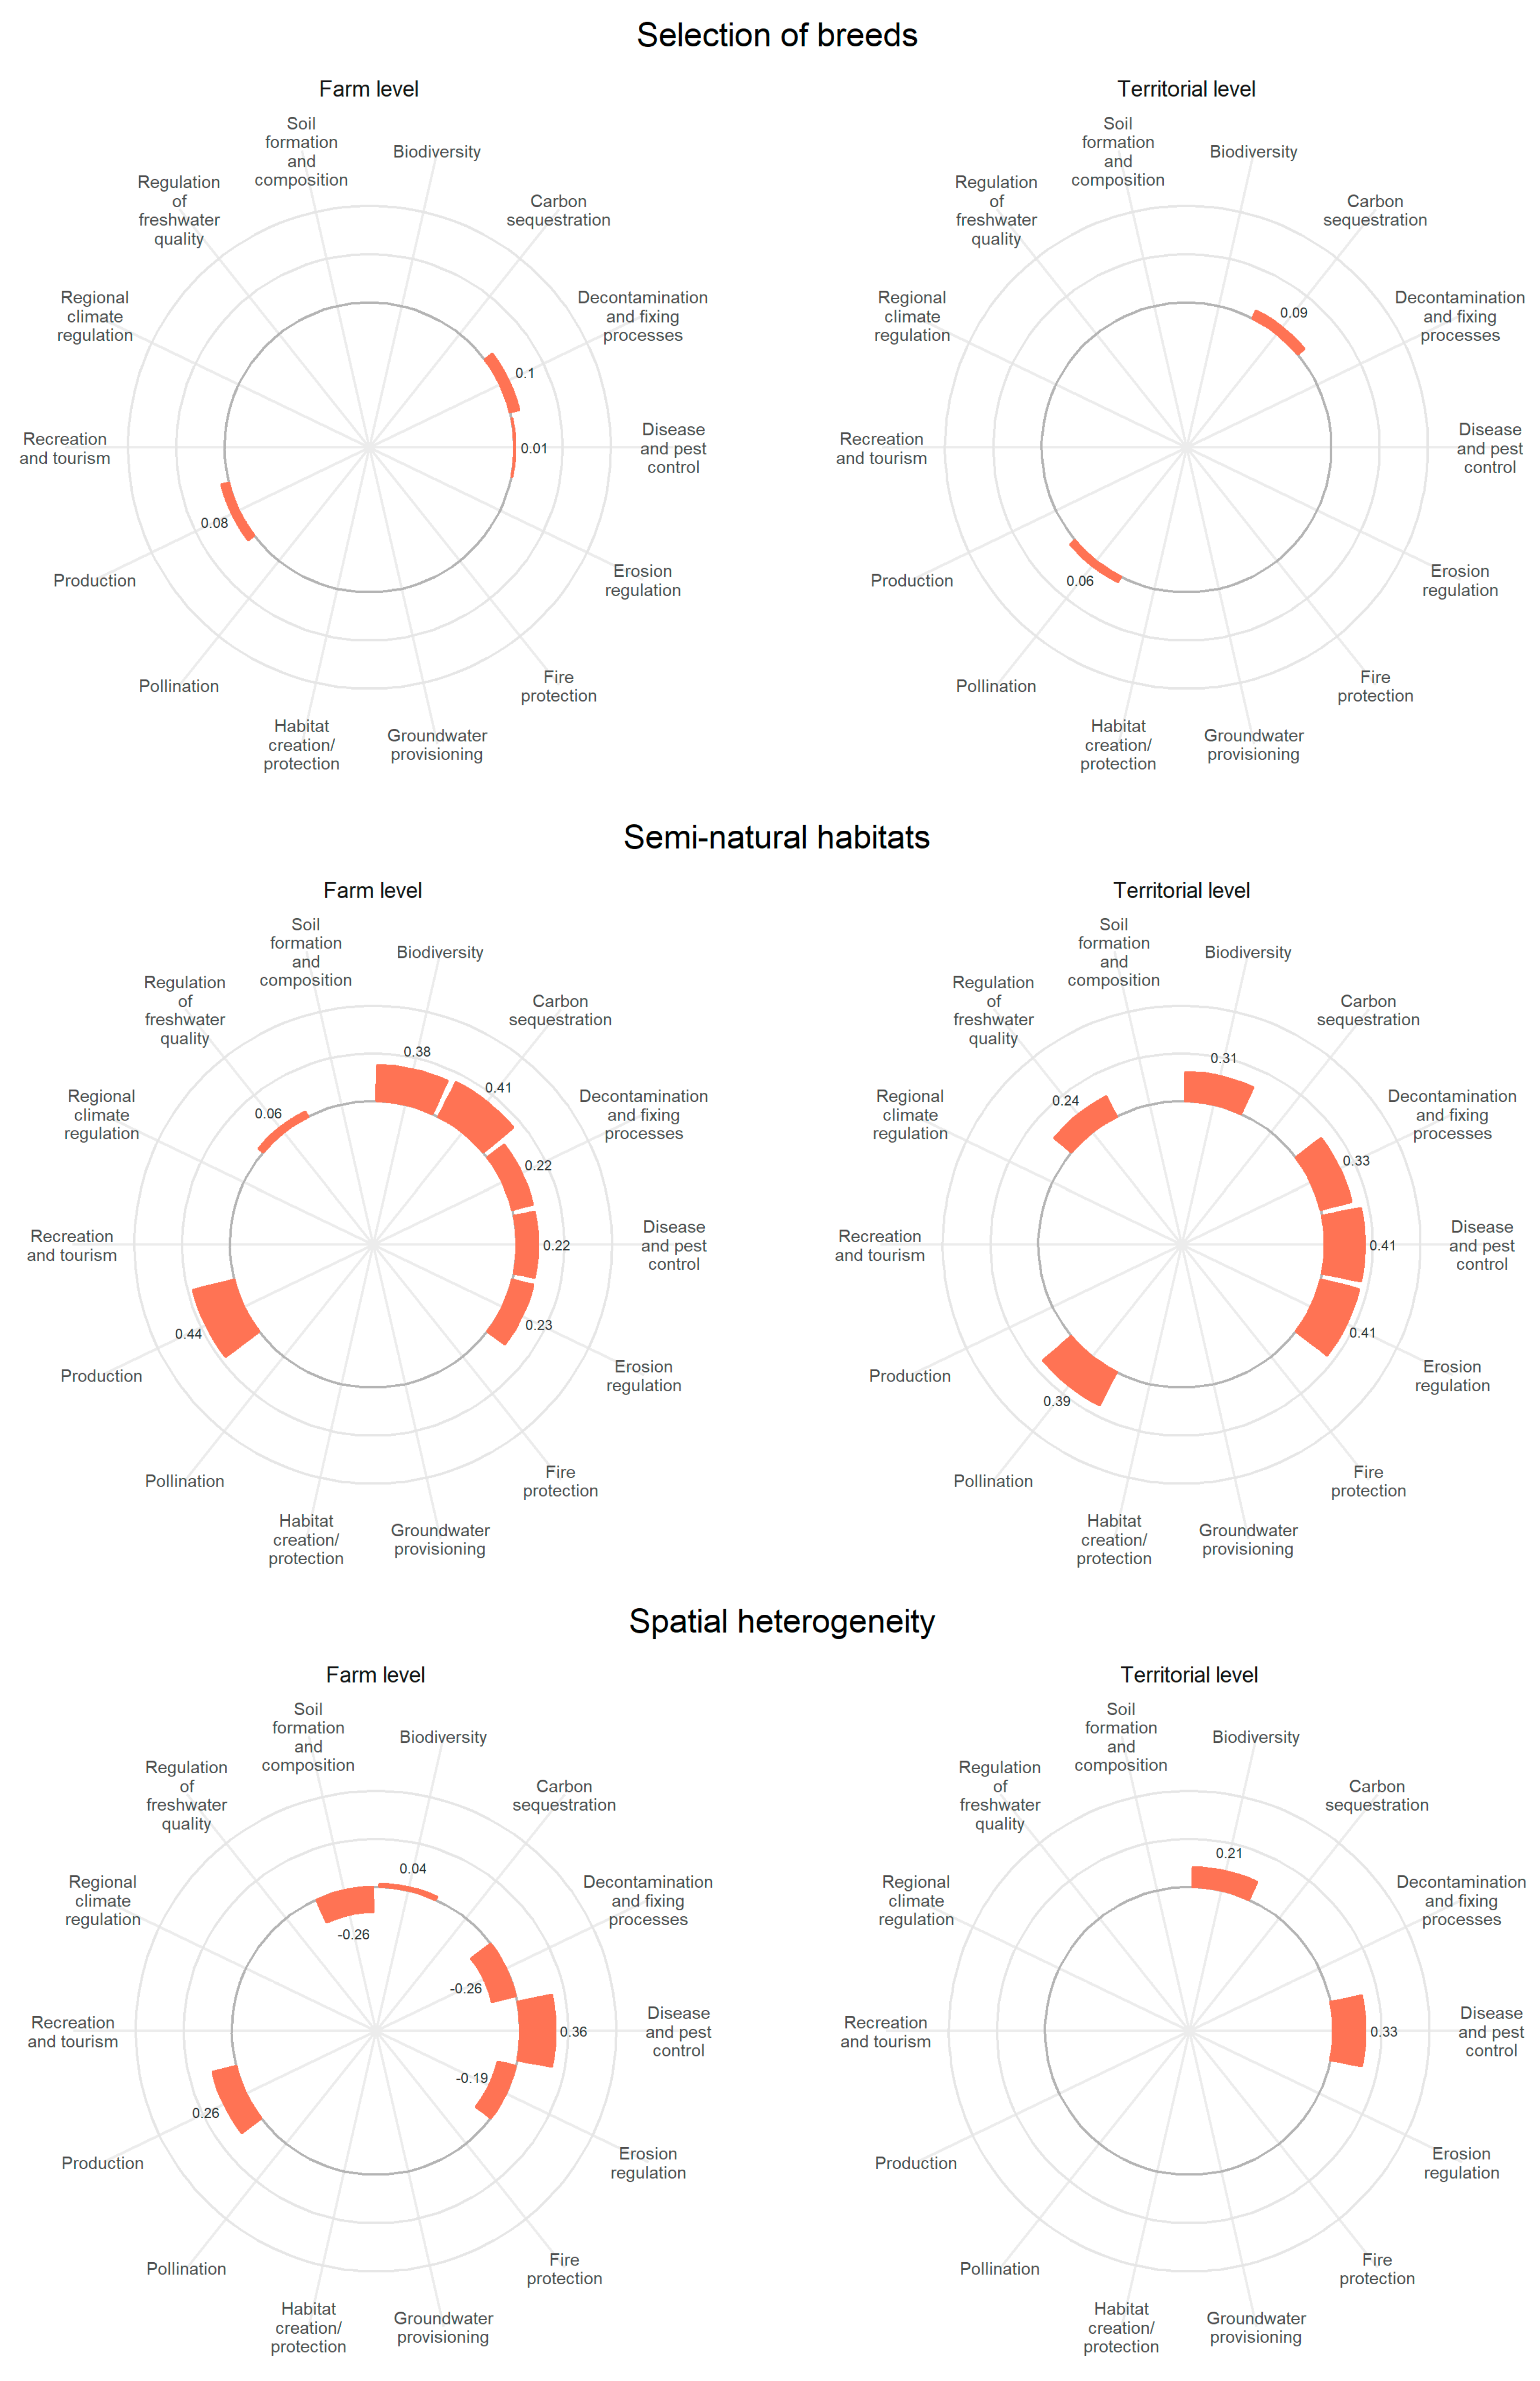
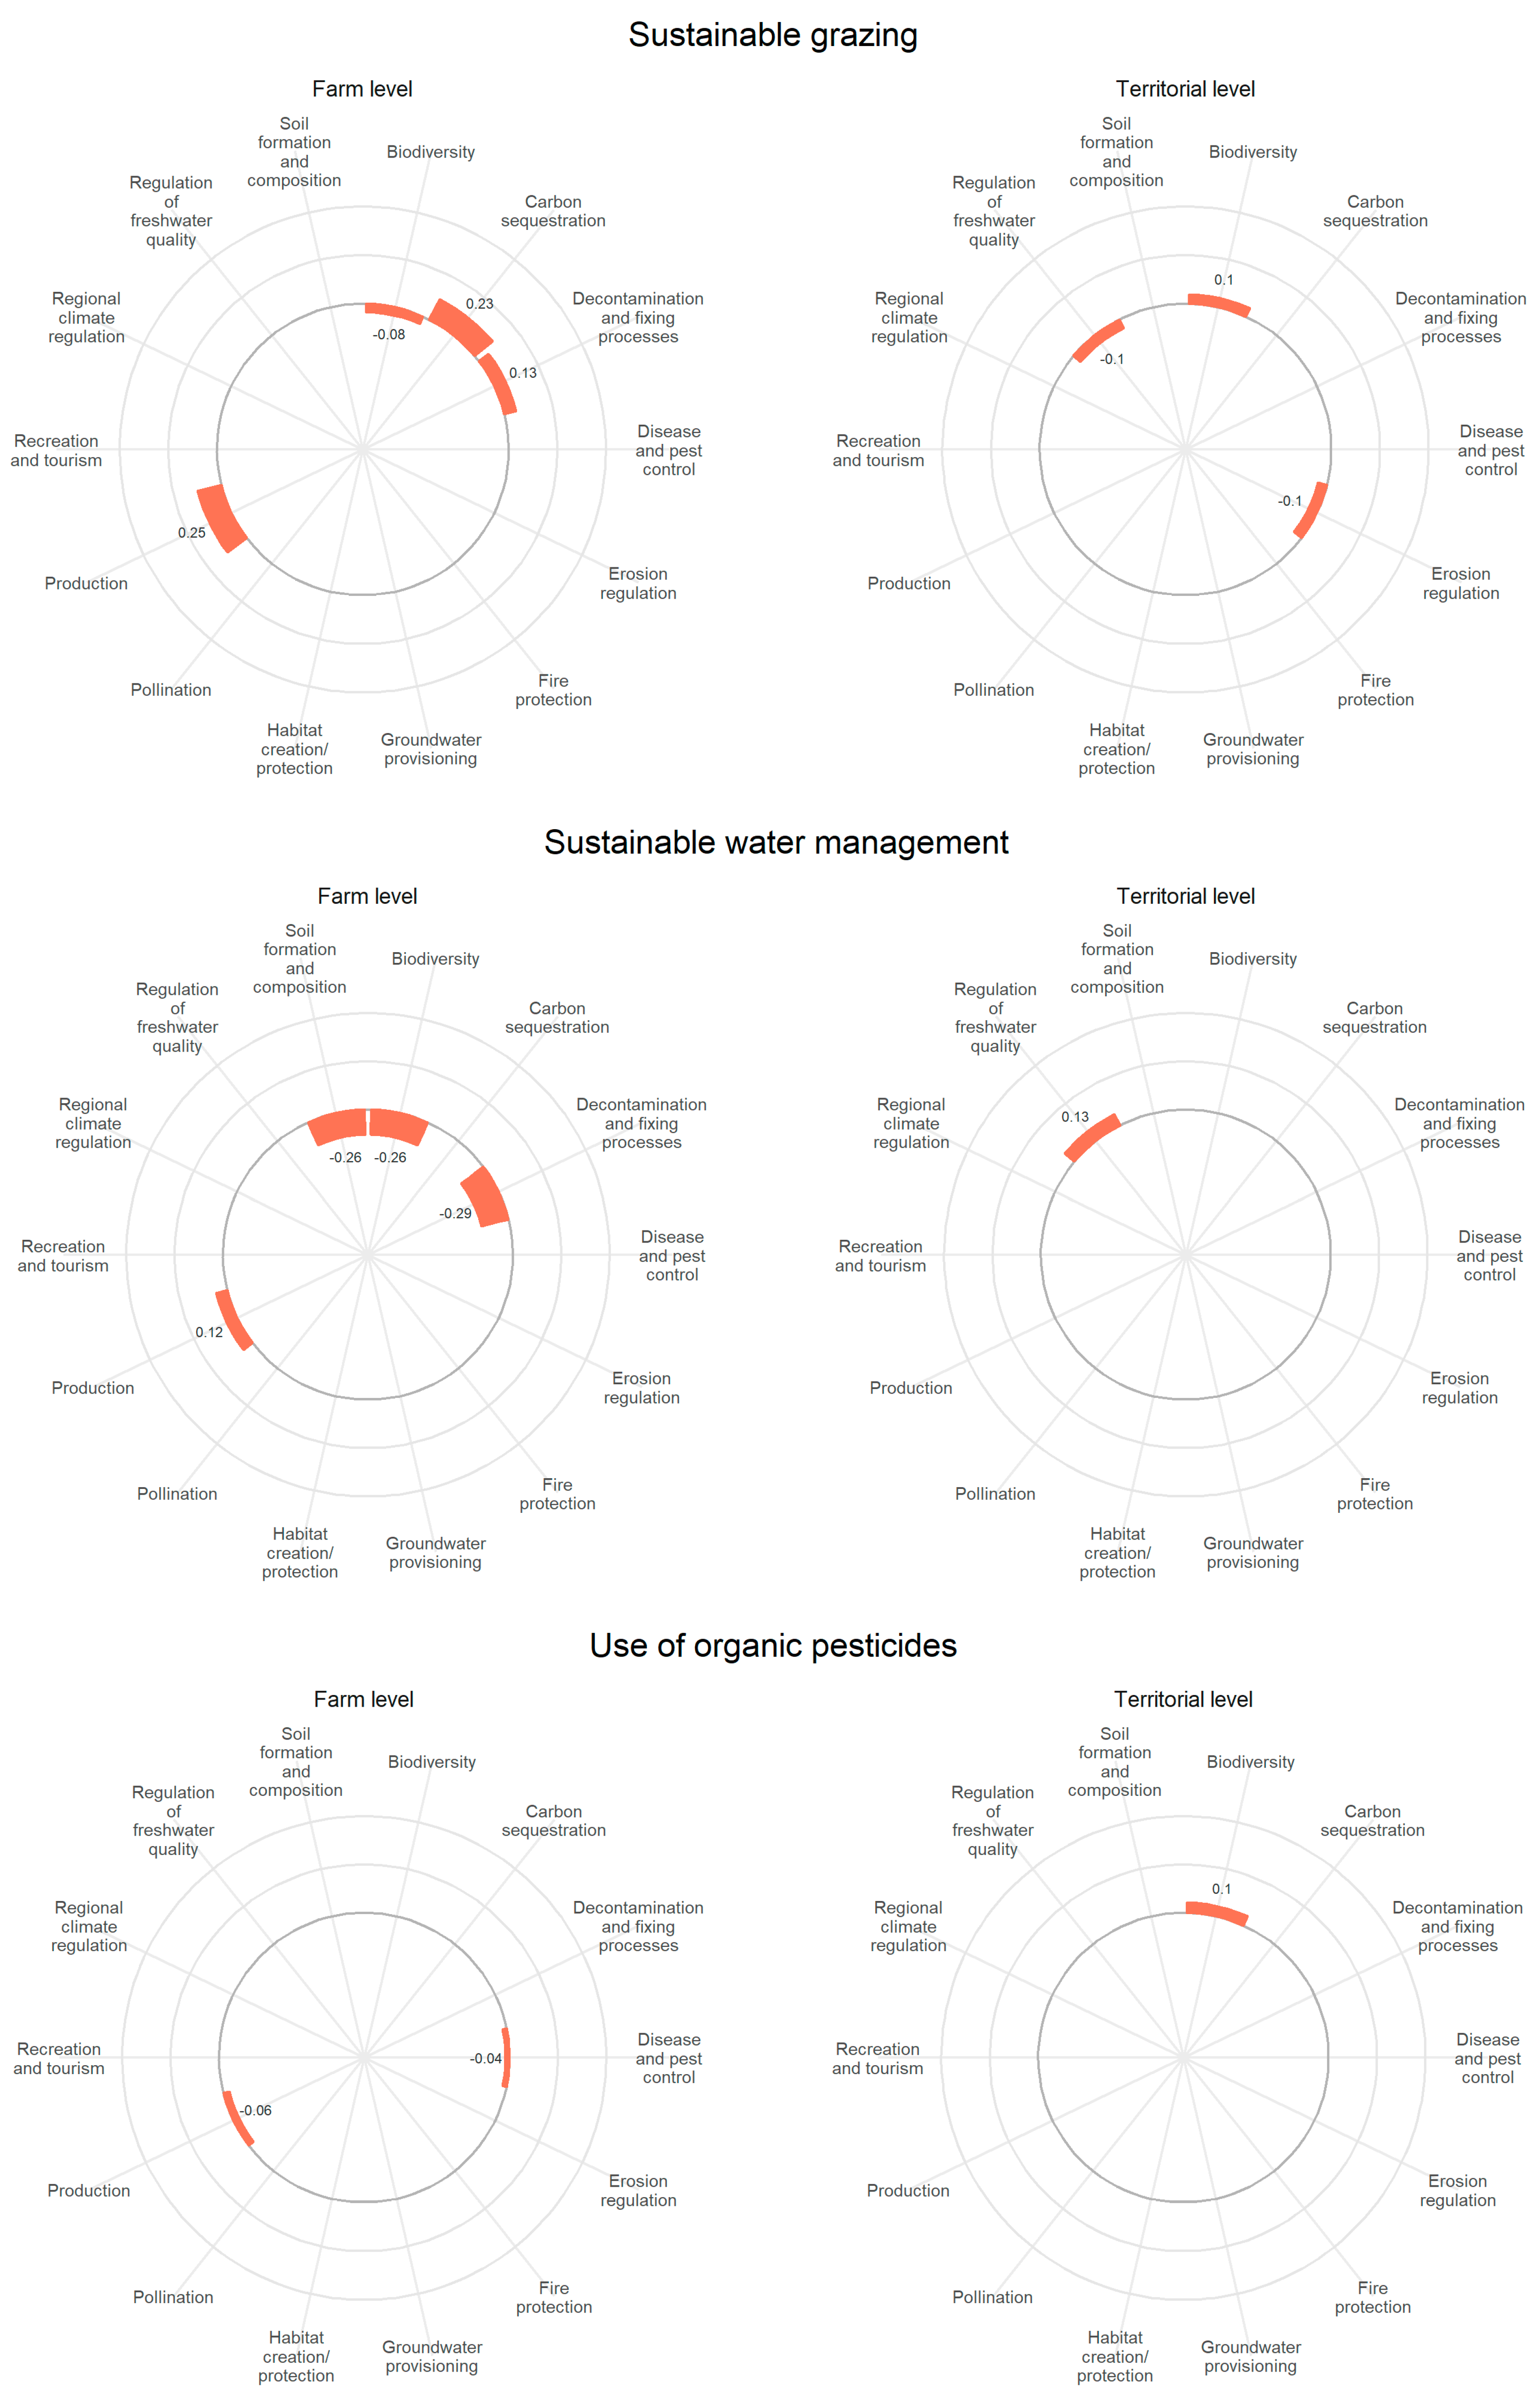
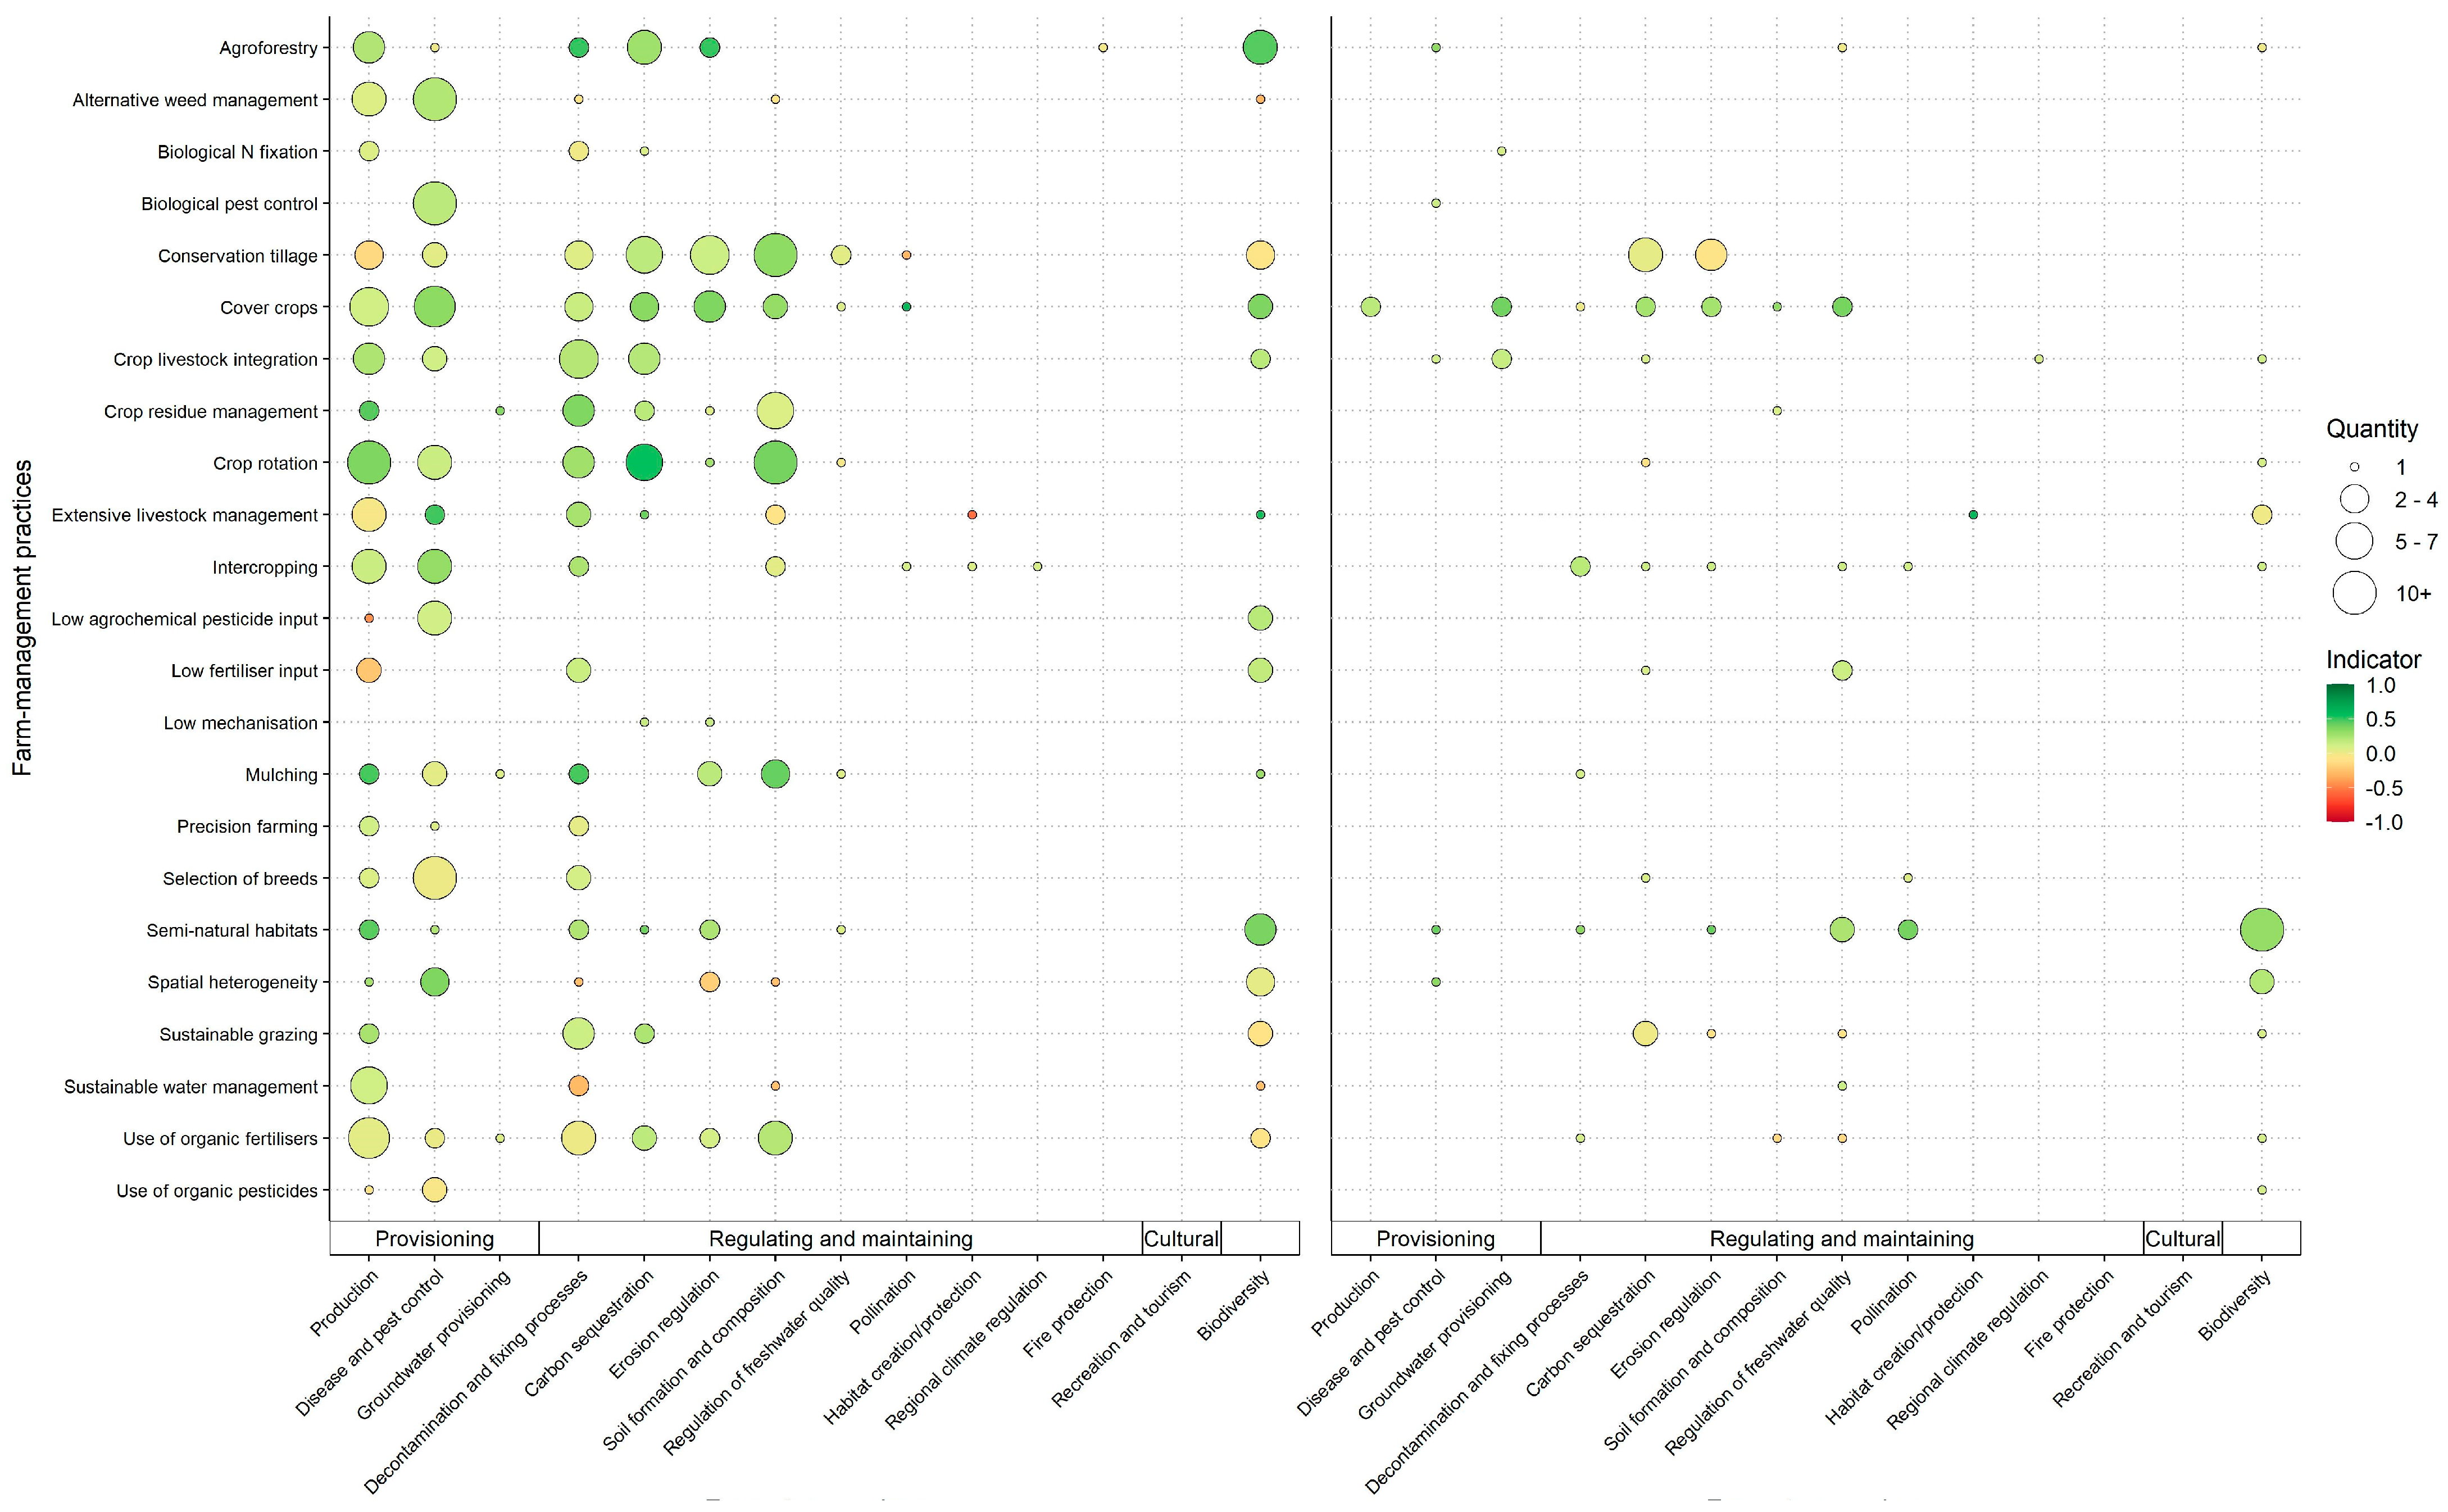
3.1. Interpreting and Visualizing the Literature through Indicators

Figure 2 illustrates the set of indicators calculated at the farm level (left) and the territorial level (right). The color of the circles indicates the directionality of the practice–ES link; a green circle represents a positive link and a red circle represents a negative link. The shade reflects the degree of confidence (i.e., the magnitude) in the indicated directionality, with a darker shade (of either green or red) reflecting a stronger degree of confidence in the proposed linkage. The size of a circle is reflective of the quantity of evidence for a particular linkage ( N o b s ) found in the literature; larger-sized circles equate to a larger number of observations incorporated in the indicator.
Overall, we found that management practices in European agroecosystems are often evaluated for their impact on the supply of provisioning ESs (with the exception of groundwater provisioning) and on certain regulation and maintenance ESs. On the other hand, the regulation of freshwater quality, pollination, habitat creation/protection, climate regulation, and fire protection seem to be studied far less frequently. Further, we found that most indicators reported a positive management-practice–ES link. Indeed, of the 172 indicators composed, 137 had a positive directionality, 31 had a negative directionality, and four had a magnitude of zero. Indicators with a positive directionality also tended to include more individual observations, compared to negative indicators. The highest number of observations included in a positive indicator was N o b s = 31 (for the indicator linking alternative weed management to disease and pest control at the farm level, I ¨ = 0.21 ,   w = 0.28 ,   c = 0.54 ,   N o b s = 31 ,   N a r t = 6 ), while for the negative indicators this was N o b s = 6 (for extensive livestock management and production at farm level, I ¨ = 0.03 ,   w = 0.49 ,   c = 0.17 ,   N o b s = 6 ,   N a r t = 3 ).
In addition to the differences in attention paid to positive compared to negative management practice–ES links, the indicators allowed us to observe discrepancies between the farm-level and the territorial-level findings (Figure 2). First, far more indicators were composed at the farm level, indicating a tendency in the literature to evaluate management-practice–ES linkages at smaller spatial levels. Second, territorial-level indicators incorporated far fewer observations ( N ¯ f a r m o b s = 3.64 , and N ¯ t e r r o b s = 1.68 ). Third, while provisioning ESs are frequently considered at the farm level, the territorial-level indicators are frequently composed for regulation and maintenance ESs.
Of the 23 management practices considered (detailed indicators at the farm level and the territorial level of which are presented in Appendix A), cover crops were found to have the highest consistently positive impact across the considered ESs at both the farm level and the territorial level. A total of nine indicators with a positive directionality were composed for cover crops at the farm level, and six at the territorial level (Figure 3). In addition, at the territorial level, six positive indicators were composed for intercropping. However, comparing the management-practice–ES indicators for cover crops and intercropping at the territorial level, as shown in Figure 3, we see that while the directionality of the indicators for intercropping were all positive, their magnitude was much lower than that of the cover crop indicators. This implies a lower degree of confidence in the positive directionality of the indicators calculated for intercropping, based on the quantity and quality of the evidence, compared to that for cover crops.
Across all indicators, we found the strongest positive link (i.e., the highest magnitude and the highest degree of confidence) for cover crops linked specifically to pollination at the farm level ( I = 0.59 ,   w = 0.59 ,   c = 1 ,   N o b s = 1 ,   N a r t = 1 ) and extensive livestock management linked to habitat creation/protection at the territorial level ( I = 0.59 ,   w = 0.59 ,   c = 1 ,   N o b s = 1 ,   N a r t = 1 ). Conversely, the strongest negative link was found for extensive livestock management and habitat creation/protection at the farm level ( I = 0.55 ,   w = 0.55 ,   c = 1 ,   N o b s = 1 ,   N a r t = 1 ), and for organic fertilizers and the regulation of freshwater quality at the territorial level ( I = 0.15 ,   w = 0.15 ,   c = 1 ,   N o b s = 1 ,   N a r t = 1 ) (Figure 3 and Figure 4). Consulting the rapid evidence assessment database (File S5) shed more light on the underlying reason for their strong impact.
Cover crops were linked to pollination at the farm level in a single article in our corpus. The study in [30] evaluated the effect of extensive vineyard inter-row vegetation management on a wide array of ESs (and biodiversity) through a hierarchical meta-analysis. As with pollination services, they found that reintroducing native plants within vineyards had a positive effect on pollinator diversity and abundance as a result of a greater number of plant species in inter-rows. The single observation used to calculate the indicator linking organic fertilizers to the regulation of freshwater quality at the territorial level was derived from [31], where the literature was reviewed for the impact of veterinary antibiotics in manure-fertilized agricultural soils. They found that through run-off and leaching, veterinary antibiotics may contaminate ground/surface waters. However, they stipulated that the degree of mobility of antibiotics in soils depends on their chemical properties, the weather conditions, the soil parameters, and the timing/amount of manure application.
Interestingly, we noted above that extensive livestock management linked to habitat creation/protection simultaneously provides the strongest negative link between a management practice and an ESs at the farm level and the strongest positive link the at territorial level. Furthermore, the same practice has a strong negative impact on the supply potential at the farm level of another related ES—namely, biodiversity. From the supplementary measures, we noted that all three indicators were derived from a single observation, and consulting the rapid evidence assessment database (Supplementary Materials, File S5), we found that these observations were derived from the same synthesis article [32].
In that article, the authors reported a positive impact of increased cattle grazing in agroforestry systems on the biodiversity in the herb layer, through a slowed rate of competitive exclusion, resulting in increased herb richness and diversity at the farm level. Simultaneously, they reported a decrease in habitat heterogeneity through the loss of litter and reduced understory cover from extensive grazing in such systems. However, the authors noted that through proper management of extensive grazing systems (e.g., reducing grazing intensity in certain areas) at the landscape level, variation in litter cover and understory density may increase habitat heterogeneity [32].
As the above-described indicators visualized a single observation, the confidence in the respective directionalities was, in this case, driven by the high quality of articles from which the observations were derived. This highlights the importance of considering all indicator components jointly before drawing any conclusions from their interpretation. Particularly, the magnitude of an indicator should be checked with the quantity of evidence to inform interpretations.
By using indicators to visualize information derived from the peer-reviewed literature, we identified general patterns as well as specific complexities. It is important, however, for the reader to be aware that conclusions were based on a limited corpus of 87 articles. (The mean number of observations we accounted for in the five considered articles per practice–ES linkage was quite low ( N ¯ f a r m o b s = 3.64 , and N ¯ t e r r o b s = 1.68 ). This was caused by the variety of evidence syntheses (i.e., both systematic and non-systematic) included in the rapid evidence assessment. As systematic evidence syntheses had a higher number of observations than non-systematic syntheses (as evidenced from the final corpus), we expected the mean number of observations to be mainly driven by the type of evidence syntheses included in the final corpus, rather than by the number of articles.) As with any study, increasing the sample size increases the representativeness and accuracy of the results. Increasing the corpus size introduces new evidence, potentially filling some of the knowledge gaps identified here. Furthermore, directionality for indicators that are calculated based on only a small number of observations may change. Finally, the magnitude across all indicators will likely increase as confidence in the directionality increases with increased observations, although this increase will be subject to the quality of newly introduced articles.

3.2. Sensitivity Analysis

In composing our indicators, we allowed for the extraction of multiple observations for the same practice–ES link from the same synthesis article. To test the impact of this on our conclusions, we performed a separate calculation of the indicators, this time allowing for the inclusion of only one observation per practice–ES link from a single article. A Kruskal–Wallis test found no significant difference between the composed indicators, based on multiple versus single observations.
Second, we tested the assumption of the increased importance attributed to evidence quality over quantity made in the correction factor ( w j k ). We did this by calculating indicators for each trade-off factor r ranging from r = 0 (complete emphasis on quality) to r = 1 (complete emphasis on quantity), systematically increasing r by 0.1. A one-way ANOVA found a significant difference (p < 0.001) in indicators calculated with these different values for r. Overall, performance indicator magnitude tended to decrease as r increased, although the relationship was not linear. However, a change in r was not found to change the ranking of the highest- and lowest-magnitude indicators. The magnitude of the intermediately ranked indicators was found to change with a change in r, although no change in directionality was observed. A Spearman correlation test found no evidence of correlation between article quality and the number of observations extracted. In the current study, we maintained the assumption made previously (setting r = 0.1) and favored evidence quality over quantity, positing that when considering a wide variety of secondary literature types as data sources, evidence quality more accurately captured confidence than the number of times a given practice–ES link was reviewed in the literature.

4. Discussion

The results described above demonstrate the complexity of the interaction between management practices and ES-supply potential within agroecosystems. Through the use of indicators, we illustrated that certain management practices may have a positive impact on a given ES, while simultaneously having a negative impact on another related ES. Further, while a positive impact may be observed at the farm level, the same linkage may be negative at the territorial level. This complexity is well reported in the literature [5,33,34] and highlights the importance of comprehensive assessments such as the one performed for this study.
While we were able to summarize and visualize this complexity using indicators in this work, we were not able to provide a nuanced description of the complexity using the indicators. For such a nuanced description, the extensive rapid evidence assessment database must be consulted (Supplementary Materials, File S5). Nonetheless, we argue that the indicators provide an elegant approach to obtaining a meaningful overview of the performance of a large amount of management practices to potentially inform policymaking decisions. Based on the literature considered here, we were able to identify cover crops, intercropping, and extensive livestock management as three practices that have a strong potential to deliver ESs at both the farm level and the territorial level in Europe.
In addition to summarizing the impact of farm-management practices on ES-supply potential, the indicators allowed us to identify noteworthy shortcomings in the literature. Particularly, we found a significant lack of evidence in the secondary literature linking practices to cultural ESs (similar evidence was found by [35]), as well as a greater focus on the positive, rather than the negative, impacts, as evidenced by the larger number of positive indicators calculated. We speculate that this may have been caused by inherent difficulties in linking cultural ESs to a single management practice and to difficulties in quantifying particular cultural ESs. This evidence gap illustrates a systematic trend in the secondary literature toward easily-synthesized results.
A third shortcoming in the literature was identified through inconsistencies in defining a comparator when evaluating the performance of farm-management practices across articles. The PICO described in Section 2.2 outlines the comparator (conventional, intensive farm-management practices) that was adopted in the rapid evidence assessment. The comparator was assumed to be embedded within the considered articles and was, therefore, not explicitly defined in the exclusion criteria. We noticed, however, that this assumption was not self-evident, with comparators often not clearly defined despite forming a major part of discussions and conclusions. This required significant cleaning of data when compiling the rapid evidence assessment database. Though common guidelines for systematic evidence syntheses exist (e.g., collaboration for environmental evidence [22]) and may help mitigate this shortcoming, many (non-systematic) synthesis studies were able to be more flexible in their definition of comparators, resulting in unclear conclusions. As we demonstrated in this work, evidence syntheses provide a powerful tool to summarize complex relationships in agroecosystems. Therefore, ensuring clarity and transparency has an important role in optimizing the use of evidence syntheses in the environmental/agricultural literature.
Furthermore, distinct but related management practices (e.g., management practices that are considered in CAP agri-environmental schemes’ payments) were often clustered in the literature into a single management-practice category (e.g., agri-environmental measures). This was found to be problematic for the composition of indicators. Agri-environmental measures may refer to a wide variety of management practices, such as set aside areas, crop rotation, genetic resource preservations, and conservation of historical features [36,37,38]. However, these practices were often evaluated and reported on by the secondary literature at a clustered level (i.e., as agri-environmental measures), rather than an individual management-practice level. As such, when information on the specific management practice was not available, observations were classified during the rapid evidence assessment under the relevant cluster, as reported in the synthesis article. As illustrated in Figure 3 and Figure 4, this may result in the indicators composed for clustered management practices being widely variable in directionality and magnitude, causing indicators for clustered management practices to be considered fuzzier than those for management practices that have been clearly delineated (e.g., crop rotation).
This may also be the case for those management practices that are clustered based on policy decisions rather than on biophysical traits, e.g., management practices that fall under agri-environmental schemes are determined by the CAP. As such, these practices have a highly temporal character that is subject to change, depending on current agricultural policies. This means that the relevance of certain indicators may be temporally explicit, and thus may need to be supplemented with other (primary or secondary) data prior to being used for any policy-related ends.

5. Conclusions

The work presented in this paper derived performance indicators that synthesized the existing peer-reviewed evidence of farm-management practices on ES-supply potential within the context of European agroecosystems. Those indicators shed light on both the potential of a management practice to supply a particular ES and the state of the literature evaluating such practice–ES in terms of the quality and the quantity of the evidence. Our indicators provided a first indication of correlation, but they should not be used to estimate marginal effects of management-practice implementation on ES-supply potential.
A secondary aim of this work was to inform the scientific community by quantifying the current scientific landscape and illustrating where research gaps remain and where more work is needed. We found that cover crops, intercropping, and extensive livestock management hold the highest potential to supply ESs, although complexity exists when considering different spatial levels. Further, we found that the secondary literature could benefit greatly from an increase in high-quality systematic research at the territorial level, as well as an increase in research into cultural ESs.
Primarily, we hoped to inform policymakers by demonstrating which management practices—based on the available evidence—are most interesting to focus attention on, considering their potential impact(s) on the supply of the considered ESs. We found that of the 23 considered management practices, cover crops and extensive livestock management have a tendency to have the highest consistently positive impact on potential ES supply at the farm level and the territorial level, respectively, as compared with conventional cropping and livestock systems.
The indicators presented here can also be used for planning purposes and to inform region-specific sustainability objectives. Regional sustainability objectives may aim to maximize the supply of a handful of ESs based on local geographical/socioeconomic characteristics. The proposed indicators may facilitate decision making by providing an overview of ES-supply potential associated with each farm-management practice, thereby informing policymakers about which farm-management practices are likely to maximize ES supply. The approach presented in this work can easily be adapted to various contexts, potentially expanding on the types of management practices, Ess, and/or geographic contexts considered. As such, this systematic evidence synthesis and its resulting indicators may be used as a tool to inform policymaking and help achieve sustainability objectives across Europe and beyond.

Supplementary Materials

The following supporting information can be downloaded at: https://www.mdpi.com/article/10.3390/su151712819/s1, File S1: REA protocol, File S2: Indicator interpretation, File S3: Practice baselines, File S4: Indicator database, File S5: REA full database. References [39,40,41,42] have been citated in Supplementary Materials.

Author Contributions

Conceptualization, K.V.R., J.G.F., K.M. and L.V.; methodology, K.V.R., J.G.F., K.M. and L.V.; software, K.V.R. and J.G.F.; validation, K.V.R. and K.M.; formal analysis, K.V.R.; investigation, K.V.R., J.G.F., V.D.G., J.K., G.M.-T., P.M., A.N., L.S., K.B. and K.M.; resources, L.V.; data curation, K.V.R.; writing—original draft preparation, K.V.R.; writing—review and editing, J.G.F., V.D.G., J.K., G.M.-T., P.M., A.N., L.S., K.B., K.M. and L.V.; visualization, K.V.R.; supervision, L.V.; project administration, L.V.; funding acquisition, L.V. All authors have read and agreed to the published version of the manuscript.

Funding

This research is part of the “Low-Input Farming and Territories—Integrating knowledge for improving ecosystem-based farming” (LIFT) project that received funding from the European Union’s Horizon 2020 research and innovation program under grant agreement no. 770747.

Institutional Review Board Statement

Not applicable.

Informed Consent Statement

Not applicable.

Data Availability Statement

Data supporting the reported results can be found in the Supplementary Materials.

Conflicts of Interest

The authors declare no conflict of interest.

Appendix A

Figure A1. Caption. Indicators visualizing the impact of 19 of the 23 farm-management practices on the supply potential across 14 ecosystem services (ESs) at the farm level (left) and the territorial level (right),in the context of European agroecosystems. Missing indicators illustrate an absence of evidence found in the considered corpus of our sample of literature for a given practice—ES link.
Sustainability 15 12819 g0a1aSustainability 15 12819 g0a1bSustainability 15 12819 g0a1cSustainability 15 12819 g0a1dSustainability 15 12819 g0a1eSustainability 15 12819 g0a1fSustainability 15 12819 g0a1g

References

  1. CICES. Revision Highlights. 2018. Available online: https://cices.eu/revision-highlights/ (accessed on 23 December 2020).
  2. Van Zanten, B.T.; Verburg, P.H.; Espinosa, M.; Gomez-Y-Paloma, S.; Galimberti, G.; Kantelhardt, J.; Kapfer, M.; Lefebvre, M.; Manrique, R.; Piorr, A.; et al. European agricultural landscapes, common agricultural policy and ecosystem services: A review. Agron. Sustain. Dev. 2014, 34, 309–325. [Google Scholar] [CrossRef]
  3. Sandhu, H.S.; Wratten, S.D.; Cullen, R. Organic agriculture and ecosystem services. Environ. Sci. Policy 2010, 13, 1–7. [Google Scholar] [CrossRef]
  4. Swinton, S.M.; Lupi, F.; Robertson, G.P.; Landis, D.A. Ecosystem services from agriculture: Looking beyond the usual suspects. Am. J. Agric. Econ. 2006, 88, 1160–1166. [Google Scholar] [CrossRef]
  5. Swinton, S.M.; Lupi, F.; Robertson, G.P.; Hamilton, S.K. Ecosystem services and agriculture: Cultivating agricultural ecosystems for diverse benefits. Ecol. Econ. 2007, 64, 245–252. [Google Scholar] [CrossRef]
  6. Pretty, J.; Bharucha, Z.P. Sustainable intensification in agricultural systems. Ann. Bot. 2014, 114, 1571–1596. [Google Scholar] [CrossRef]
  7. Bateman, I.; Brouwer, R.; Cranford, M. Valuing Environmental Impacts: Practical Guidelines for the Use of Value Transfer in Policy and Project Appraisal. Value Transf. Guidel. 2009, 44, 1–23. [Google Scholar]
  8. Nicholls, C.I.; Altieri, M.A.; Vazquez, L. Agroecological Principles for the Conversion of Farming Systems. In Agroecological Practices for Sustainable Agriculture: Principles, Application, and Making the Transition; World Scientific: Singapore, 2017; pp. 1–18. [Google Scholar]
  9. Pretty, J. Agricultural sustainability: Concepts, principles and evidence. Philos. Trans. R. Soc. B Biol. Sci. 2008, 363, 447–465. [Google Scholar] [CrossRef]
  10. Maes, J.; Teller, A.; Nessi, S.; Bulgheroni, C.; Konti, A.; Sinkko, T.; Tonini, D.; Pant, R. Mapping and Assessment of Ecosystems and Their Services: An EU Ecosystem Assessment; Publications Office of the European Union: Luxembourg, 2020; ISBN 9789276178330. [Google Scholar]
  11. Batáry, P.; Dicks, L.V.; Kleijn, D.; Sutherland, W.J. The role of agri-environment schemes in conservation and environmental management. Conserv. Biol. 2015, 29, 1006–1016. [Google Scholar] [CrossRef]
  12. Bartkowski, B.; Droste, N.; Ließ, M.; Sidemo-Holm, W.; Weller, U.; Brady, M.V. Payments by modelled results: A novel design for agri-environmental schemes. Land Use Policy 2021, 102, 105230. [Google Scholar] [CrossRef]
  13. Tancoigne, E.; Barbier, M.; Cointet, J.P.; Richard, G. The place of agricultural sciences in the literature on ecosystem services. Ecosyst. Serv. 2014, 10, 35–48. [Google Scholar] [CrossRef]
  14. Van Vooren, L.; Reubens, B.; Broekx, S.; De Frenne, P.; Nelissen, V.; Pardon, P.; Verheyen, K. Ecosystem service delivery of agri-environment measures: A synthesis for hedgerows and grass strips on arable land. Agric. Ecosyst. Environ. 2017, 244, 32–51. [Google Scholar] [CrossRef]
  15. Toivonen, M.; Huusela-Veistola, E.; Herzon, I. Perennial fallow strips support biological pest control in spring cereal in Northern Europe. Biol. Control 2018, 121, 109–118. [Google Scholar] [CrossRef]
  16. Van den Putte, A.; Govers, G.; Diels, J.; Gillijns, K.; Demuzere, M. Assessing the effect of soil tillage on crop growth: A meta-regression analysis on European crop yields under conservation agriculture. Eur. J. Agron. 2010, 33, 231–241. [Google Scholar] [CrossRef]
  17. Collins, A.; Miller, J.; Coughlin, D.; Kirk, S. The Production of Quick Scoping Reviews and Rapid Evidence Assessments: A How to Guide; 2015. Available online: https://www.gov.uk/government/publications/the-production-of-quick-scoping-reviews-and-rapid-evidence-assessments (accessed on 9 December 2019).
  18. Rigby, D.; Woodhouse, P.; Young, T.; Burton, M. Constructing a farm level indicator of sustainable agricultural practice. Ecol. Econ. 2001, 39, 463–478. [Google Scholar] [CrossRef]
  19. Cochrane. About Cochrane Reviews|Cochrane Library; John Wiley & Sons, Inc.: Hoboken, NJ, USA, 2022; Available online: https://www.cochranelibrary.com/about/about-cochrane-reviews (accessed on 24 February 2022).
  20. Rega, C.; Paracchini, M.L.; Mccraken, D.; Saba, A.; Zavalloni, M.; Raggi, M.; Viaggi, D.; Britz, W.; Frappier, L. LIFT-Deliverable D1.1 Review of the definitions of the existing ecological approaches. In LIFT—Low-Input Farming and Territories—Integrating Knowledge for Improving Ecosystem Based Farming; 2018; Available online: https://www.lift-h2020.eu/deliverables/ (accessed on 26 August 2022).
  21. Varker, T.; Forbes, D.; Dell, L.; Weston, A.; Merlin, T.; Hodson, S.; O’Donnell, M. Rapid evidence assessment: Increasing the transparency of an emerging methodology. J. Eval. Clin. Pract. 2015, 21, 1199–1204. [Google Scholar] [CrossRef]
  22. Collaboration for Environmental Evidence. Guidelines for Systematic Review and Evidence Synthesis in Environmental Management; Collaboration for Environmental Evidence: New York, NY, USA, 2013. [Google Scholar]
  23. Clarivate. Web of Science Core Collection. 2021. Available online: https://www.webofscience.com/wos/woscc/basic-search (accessed on 12 July 2021).
  24. Ottoy, S.; Angileri, V.; Gibert, C.; Paracchini, M.L.; Pointereau, P.; Terres, J.M.; Van Orshoven, J.; Vranken, L.; Dicks, L.V. Impacts of selected Ecological Focus Area options in European farmed landscapes on climate regulation and pollination services: A systematic map protocol. Environ. Evid. 2018, 7, 10. [Google Scholar] [CrossRef]
  25. Beillouin, D.; Ben-Ari, T.; Makowski, D. A dataset of meta-analyses on crop diversification at the global scale. Data Brief 2019, 24, 103898. [Google Scholar] [CrossRef]
  26. PRISMA. PRISMA: Transparent Reporting of Systematic Reviews and Meta-Analyses. 2015. Available online: http://www.prisma-statement.org/ (accessed on 3 March 2021).
  27. Beillouin, D.; Ben-ari, T.; Makoswki, D. Assessing the Quality and Results of Meta-Analyses on Crop Diversification Protocol for Systematic Review and Evidence Map; hal-01815485; HAL: Tokyo, Japan, 2018. [Google Scholar]
  28. Philibert, A.; Loyce, C.; Makowski, D. Assessment of the quality of meta-analysis in agronomy. Agric. Ecosyst. Environ. 2012, 148, 72–82. [Google Scholar] [CrossRef]
  29. Tastle, W.J.; Wierman, M.J. Consensus and dissention: A measure of ordinal dispersion. Int. J. Approx. Reason. 2007, 45, 531–545. [Google Scholar] [CrossRef]
  30. Winter, S.; Bauer, T.; Strauss, P.; Kratschmer, S.; Paredes, D.; Popescu, D.; Landa, B.; Guzmán, G.; Gómez, J.A.; Guernion, M.; et al. Effects of vegetation management intensity on biodiversity and ecosystem services in vineyards: A meta-analysis. J. Appl. Ecol. 2018, 55, 2484–2495. [Google Scholar] [CrossRef]
  31. Kuppusamy, S.; Kakarla, D.; Venkateswarlu, K.; Megharaj, M.; Yoon, Y.E.; Lee, Y.B. Veterinary antibiotics (VAs) contamination as a global agro-ecological issue: A critical view. Agric. Ecosyst. Environ. 2018, 257, 47–59. [Google Scholar] [CrossRef]
  32. Öllerer, K.; Varga, A.; Kirby, K.; Demeter, L.; Biró, M.; Bölöni, J.; Molnár, Z. Beyond the obvious impact of domestic livestock grazing on temperate forest vegetation—A global review. Biol. Conserv. 2019, 237, 209–219. [Google Scholar] [CrossRef]
  33. Zhang, W.; Ricketts, T.H.; Kremen, C.; Carney, K.; Swinton, S.M. Ecosystem services and dis-services to agriculture. Ecol. Econ. 2007, 64, 253–260. [Google Scholar] [CrossRef]
  34. Robertson, G.P.; Gross, K.L.; Hamilton, S.K.; Landis, D.A.; Schmidt, T.M.; Snapp, S.S.; Swinton, S.M. Farming for ecosystem services: An ecological approach to production agriculture. Bioscience 2014, 64, 404–415. [Google Scholar] [CrossRef] [PubMed]
  35. Boerema, A.; Rebelo, A.J.; Bodi, M.B.; Esler, K.J.; Meire, P. Are ecosystem services adequately quantified? J. Appl. Ecol. 2017, 54, 358–370. [Google Scholar] [CrossRef]
  36. Lastra-Bravo, X.B.; Hubbard, C.; Garrod, G.; Tolón-Becerra, A. What drives farmers’ participation in EU agri-environmental schemes?: Results from a qualitative meta-analysis. Environ. Sci. Policy 2015, 54, 1–9. [Google Scholar] [CrossRef]
  37. Villanueva, A.J.; Gómez-Limón, J.A.; Arriaza, M.; Rodríguez-Entrena, M. The design of agri-environmental schemes: Farmers’ preferences in southern Spain. Land Use Policy 2015, 46, 142–154. [Google Scholar] [CrossRef]
  38. Prager, K. Agri-environmental collaboratives for landscape management in Europe. Curr. Opin. Environ. Sustain. 2015, 12, 59–66. [Google Scholar] [CrossRef]
  39. Cooper, H.; Hedges, L.V.; Valentine, J.C. The Handbook of Research Synthesis and Meta-Analysis, 2nd ed.; Russell Sage Foundation: New York, NY, USA, 2009. [Google Scholar]
  40. McKenzie, J.; Brennan, S. Chapter 12: Synthesizing and presenting findings using other methods. In Cochrane Handbook for Systematic Reviews of Interventions Version 6.3; Higgins, J.P.T., Thomas, J., Chandler, J., Cumpston, M., Li, T., Page, M.J., Eds.; Updated February 2022; Cochrane: London, UK, 2022. [Google Scholar]
  41. Ouzzani, M.; Hammady, H.; Fedorowicz, Z.; Elmagarmid, A. Rayyan-a web and mobile app for systematic reviews. Syst. Rev. 2016, 5, 210. [Google Scholar] [CrossRef]
  42. Rayyan. Rayyan—Intelligent Systematic Review [WWW Document]. 2021. Available online: https://www.rayyan.ai/ (accessed on 7 December 2021).
Disclaimer/Publisher’s Note: The statements, opinions, and data contained in all publications are solely those of the individual author(s) and contributor(s) and not of MDPI and/or the editor(s). MDPI and/or the editor(s) disclaim responsibility for any injury to people or property resulting from any ideas, methods, instructions, or products referred to in the content.
Figure 1. Visual representation of the indicator linking the management-practice-to-ES ( I ¨ j k ) calculation process. The intermediate indicator ( I ˙ j k ) (the sum product across multiple observations ( I i j k ) and their respective article quality score ( q i )) is multiplied by the correction factor ( w j k ) to obtain I ¨ j k for each management practice j linked to ecosystem service k . The correction factor is composed of a measure of the quantity of observations ( N j k o b s ) and the average article quality ( Q ¯ j k ) across all synthesis articles included in I ¨ j k .
Sustainability 15 12819 g001
Figure 2. Indicators visualizing the impact of a farm-management practice on the supply potential of an ecosystem service (ES) at the farm level (left) and the territorial level (right), in the context of European agroecosystems. The color of an indicator illustrates the directionality of the impact, i.e., positive (green) or negative (red). The shade of an indicator illustrates the confidence in the directionality, i.e., the magnitude of I ¨ ; darker green implies a stronger confidence in a positive impact and light-green/yellow implies a weak confidence in a positive impact. The size of the dots reflects the quantity of evidence (number of observations N o b s ) used in calculating the indicator. Missing indicators illustrate an absence of evidence found in the considered corpus of our sample of literature for a given practice—ES link.
Sustainability 15 12819 g002
Figure 3. Indicators visualizing the impact of cover crops (top) and intercropping (bottom) on the supply potential across 14 ecosystem services (ESs) at the farm level (left) and the territorial level (right), in the context of European agroecosystems. Missing indicators illustrate an absence of evidence found in the considered corpus of our sample of literature for a given practice—ES link.
Sustainability 15 12819 g003
Figure 4. Indicators visualizing the impact of extensive livestock management (top) and the use of organic fertilizers (bottom) on the supply potential across 14 ecosystem services (ESs) at the farm level (left) and the territorial level (right),in the context of European agroecosystems. Missing indicators illustrate an absence of evidence found in the considered corpus of our sample of literature for a given practice—ES link.
Sustainability 15 12819 g004
Table 1. PICO (population, intervention, comparator, outcome) used to establish inclusion criteria for the rapid evidence assessment.
PICOComponentObjective
PopulationQuantitative or qualitative secondary literatureRobustly inform performance indicators using pre-existing literature reviews, quick scoping reviews, rapid evidence assessments, meta-analyses, systematic reviews, and reviews of reviews; quantitative and qualitative data were extracted to inform results.
PopulationEuropean agricultural landUse the most locally relevant data on practices and their effects.
Intervention/exposureFarm-management practicesCover the variety of practices to be included in the assessment.
ComparatorConventional, intensive management practicesCompare conventional approaches to agriculture with more ecological approaches. The comparator is assumed to be embedded in the secondary literature.
OutcomeEcosystem servicesMeasure, through the use of indicators, proxies, or qualitative data, the impact of adoption of farm-management practices on ES supply.
Disclaimer/Publisher’s Note: The statements, opinions and data contained in all publications are solely those of the individual author(s) and contributor(s) and not of MDPI and/or the editor(s). MDPI and/or the editor(s) disclaim responsibility for any injury to people or property resulting from any ideas, methods, instructions or products referred to in the content.

