Article

Multi-Hazard Population Exposure in Low-Elevation Coastal Zones of China from 1990 to 2020

1
School of Environment and Geographical Sciences, Shanghai Normal University, Shanghai 200234, China
2
School of Science, Technology and Engineering, University of the Sunshine Coast, Sunshine Coast, QLD 4556, Australia
3
The College of Information, Mechanical and Electrical Engineering, Shanghai Normal University, Shanghai 200234, China
*
Authors to whom correspondence should be addressed.
Sustainability 2023, 15(17), 12813; https://doi.org/10.3390/su151712813
Submission received: 12 July 2023 / Revised: 21 August 2023 / Accepted: 23 August 2023 / Published: 24 August 2023

Abstract

:
China’s low-elevation coastal zone (LECZ) is characterized by multiple hazards and high impacts. How to quantitatively portray the spatiotemporal characteristics of the exposed population to multi-hazards in the LECZ is an important subject of risk reduction. In this study, the overall characteristics, spatial patterns, and main impact hazard in the LECZ from 1990 to 2020 were investigated using a multi-hazard population exposure model, spatial autocorrelation method, and principal component analysis (PCA) method. The results show that among the four hazards (earthquake, tropical cyclones (TCs), flood, and storm surge), TCs cover the largest area, accounting for 90.1% of the total LECZ area. TCs were also the hazard with the largest average annual growth rate of the exposed population (2.36%). The central region of China’s LECZ is the cluster of exposed populations and the main distribution area with the largest increase in exposed populations. Therefore, the central region is a hotspot for multi-hazard risk management. Additionally, flood contributes the most to the multi-hazard population exposure index; thus, flood is a key hazard of concern in the LECZ. This study identifies the hotspot areas and priority hazards of multi-hazard exposed populations in the LECZ and provides important policy recommendations for multi-hazard risk management in the LECZ, which is important for LECZ to enhance the resilience of hazards.

1. Introduction

Low-elevation coastal zone (LECZ) is defined as the contiguous area along the coast that is less than 10 m above sea level [1,2,3,4,5]. These zones are distributed widely around the world, covering approximately 2% of the global land area. However, they are home to 10% of the world’s total population and 13% of the urban population [1,6]. LECZs are characterized not only by high population density and economic development but also by a rapidly changing environment, vulnerable ecological systems, a high frequency of natural hazards, and inadequate risk management capacities [5,7,8,9,10,11,12]. As coastal cities expand and the population and economy grow rapidly, the LECZs experience an increasing accumulation of population and assets, leading to a rise in multi-hazard exposure and broader impacts [13]. Climate change and sea-level rise will increase the intensity and frequency of natural hazards, posing an increasingly serious threat to the population in LECZs [5,12,14,15,16,17,18,19]. Among the threats posed by sea-level rise to coastal areas, flooding is considered to be the most serious, especially in China’s coastal areas [20]. Rising sea levels superimposed on an increasing number of strong typhoon events in the northwestern Pacific will lead to a high frequency of storm surges [21]. Storm surges are also recognized as major hazards causing loss of life and property in China’s LECZ and hindering local economic development [22]. In addition, China’s LECZ is located in the transition zone between the Pacific and Asian–European plates and is seismically active. It will cause serious economic losses for LECZ [23]. Therefore, four hazards, TCs, earthquakes, floods, and storm surges, were selected to assess the exposure characteristics of multi-hazard populations in the LECZ of China. Monitoring and understanding changes in population exposure over time can help assess hazard risks and manage extreme events [24,25]. Therefore, the development of a multi-hazard population exposure assessment for LECZs can provide a foundation for decision-making in disaster management within these areas.
Exposure, the number of people, and the value of property located in hazard-affected areas are significant drivers of disaster risk [26,27]. In recent years, scholars have conducted extensive research on multi-hazard exposure in various regions worldwide. Novelo-Casanova and Suarez [28] studied the exposure of critical infrastructure in the Cayman Islands to natural and man-made disasters. Ehrlich et al. [29] evaluated the global built-up areas and population densities exposed to earthquakes, tsunamis, tropical cyclones (TCs), storm surges, and floods through remote sensing monitoring. Chen et al. [30] used the Getis-Ord Gi* statistic tool to assess the changes in population and land use affected by storm surges, droughts, earthquakes, floods, and landslides from 1995 to 2015, identifying hotspot areas for each hazard. Rahmati et al. [31] utilized machine learning methods to develop an accurate multi-hazard exposure map for the Asara watershed in Iran.
Regarding exposure assessments for hazards in the LECZs, some scholars have analyzed population exposure to individual hazards. For example, Liu et al. [32] and Neumann et al. [33] analyzed the flood-exposed population of China’s LECZ based on the ArcGIS environment and four different sea level and socio-economic scenarios, respectively, and found that China is the country with the largest flood-exposed population in Asia. Yuan et al. [34] conducted exposure assessments for storm surges in China’s LECZs, using 12 indicators such as population, GDP, and cultivated land area, and identified Guangdong Province as having the highest exposure level. Feng et al. [23] analyzed the spatial and temporal characteristics of population exposure in high seismic hazard areas (HSHA) in the LECZ of China from 1990 to 2015 based on CoastalDEM, Worldpop population, and China’s ground motion parameter zoning data. There are fewer studies focusing on seismic population exposure in the LECZ of China. Previous research has mainly focused on the spatiotemporal variations of the population in most seismically hazardous areas [35,36,37] and the correlation between exposed populations and death in earthquake-prone areas [38]. In studies on multi-hazard exposure in China’s LECZs, Yuan [39] analyzed population exposure to floods and storm surges in the Yangtze River Delta region, while Liu [40] examined the spatial and temporal characteristics of population exposure to TCs and floods.
Overall, previous studies on exposure in China’s LECZ have primarily focused on a single hazard or conducted separate exposure analyses for two types of hazards, which fail to capture the comprehensive exposure characteristics of multi-hazards in LECZ. This study selected earthquakes, floods, storm surges, and TCs as the representative hazards in China’s LECZ (excluding Hong Kong, Macao, and Taiwan). The temporal change characteristics and spatial patterns of multi-hazard population exposure were more systematically and comprehensively analyzed, and hotspot areas of multi-hazard population exposure were identified. Meanwhile, the key hazards for risk management in China’s LECZ were identified. This study provides a foundation for the analysis and management of multi-hazard risks in the LECZ of China.

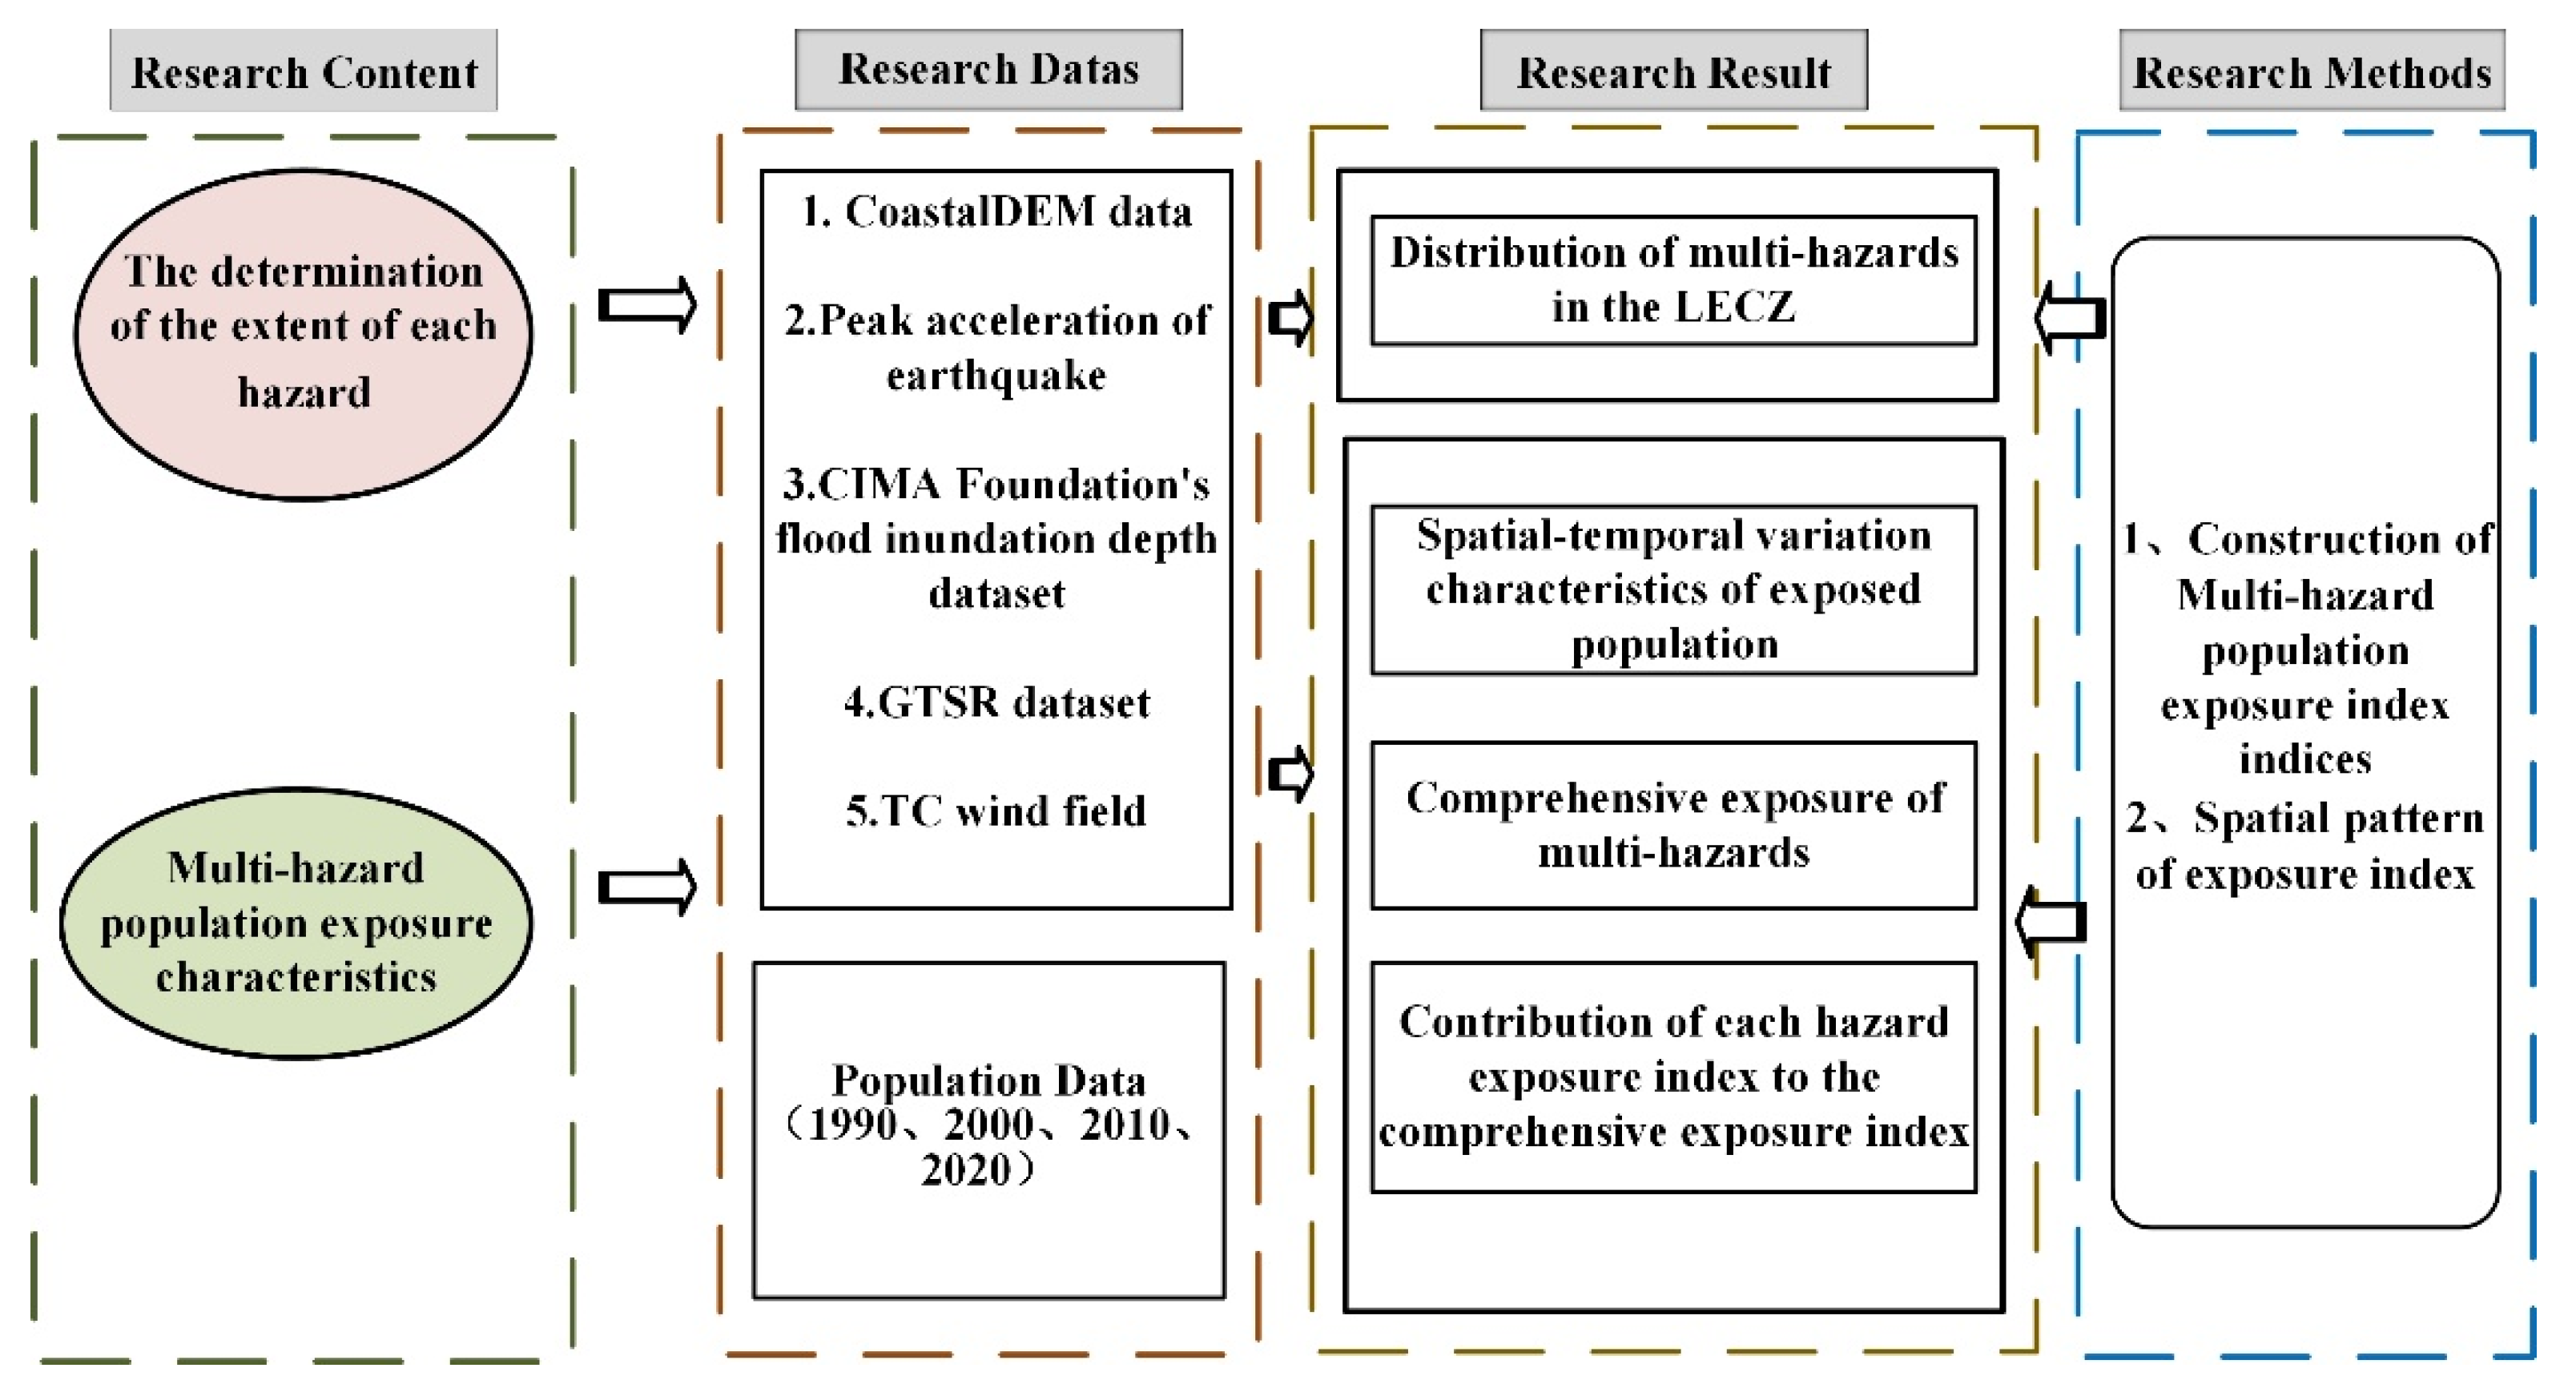
2. Data and Methodology
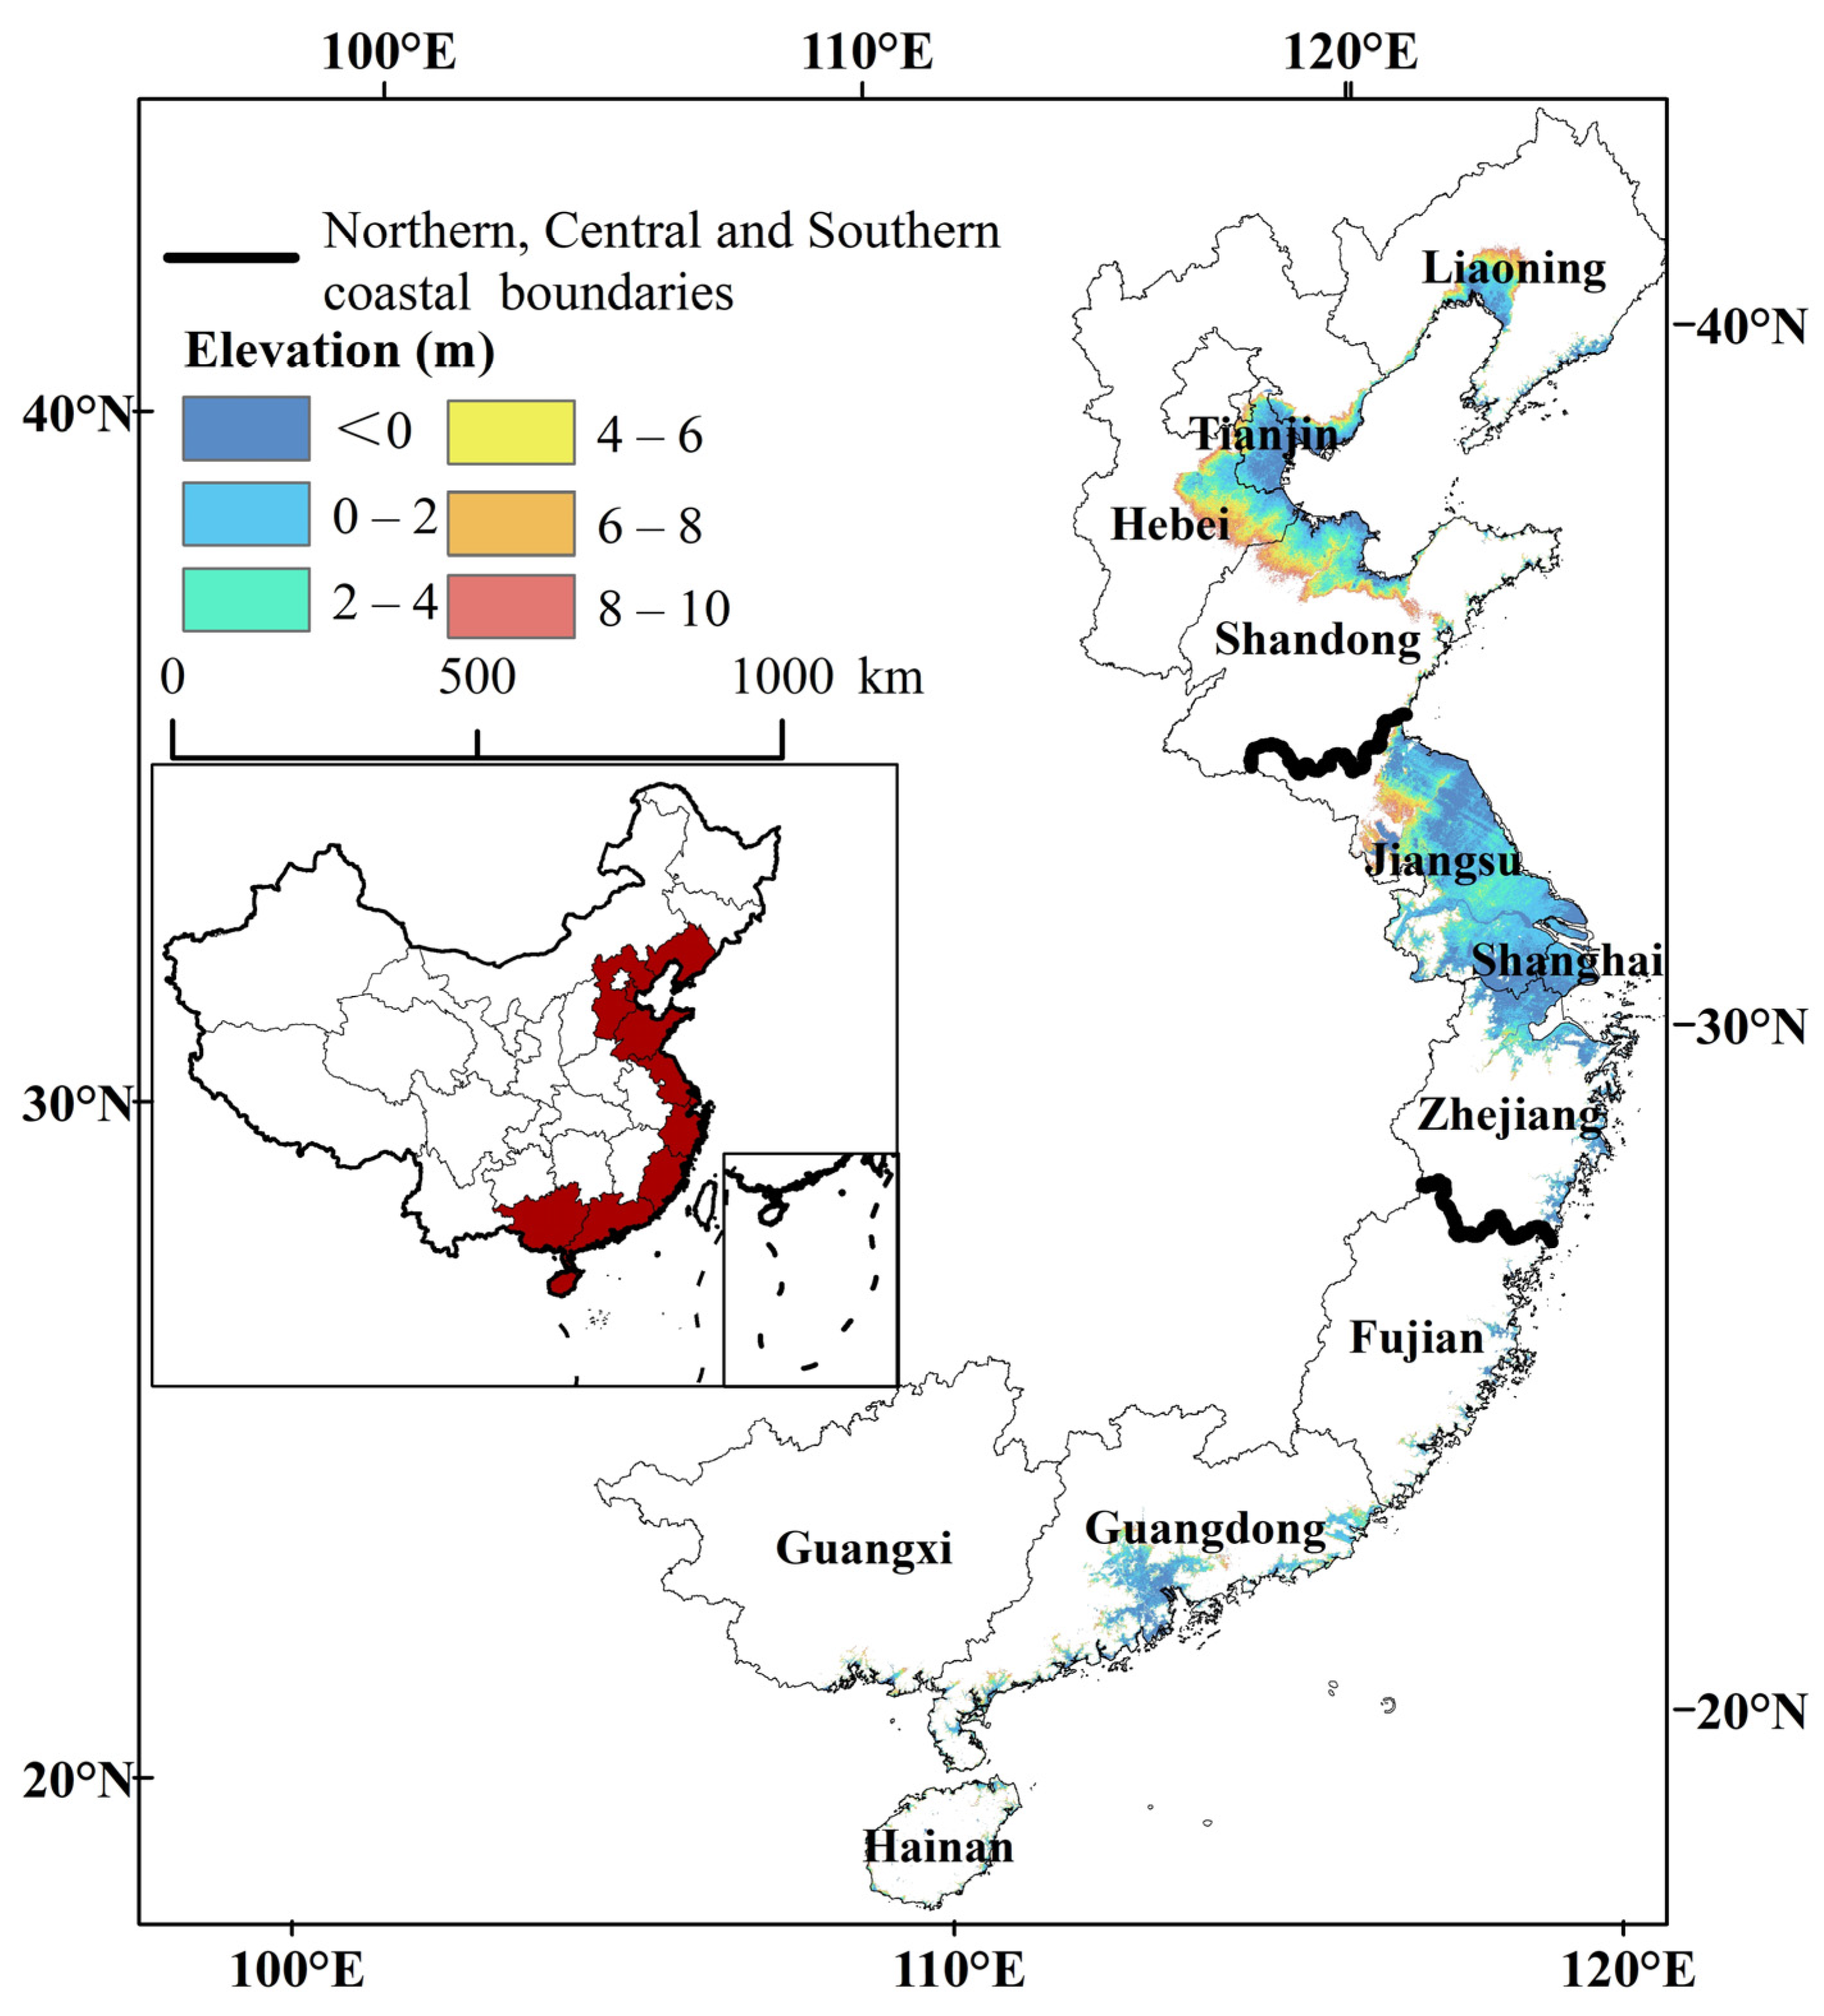
2.1. Study Area

The LECZs of China mainly involve eleven provincial administrations, including Liaoning, Hebei, Tianjin, Shandong, Jiangsu, Shanghai, Zhejiang, Fujian, Guangxi, Guangdong and Hainan (see Figure 1). For ease of spatial description and analysis, the LECZ is divided into three regions: the northern, central, and southern regions (Table 1). The total area of China’s LECZs is about 19.4 × 10⁴ km2, accounting for 2% of the total land area [3]. China has the largest population in LECZ in the world [31], with a total population of 164 million, representing 28.7% of the population in the coastal provincial administrations and 12.3% of the total population of China [3]. Due to sustained and rapid economic growth and urbanization, there has been significant population migration to the LECZ [25]. In the context of climate change and sea-level rise, the impact of natural hazards in LECZs is increasing significantly and becoming a huge challenge to sustainable development in coastal regions [41,42].

2.2. Data

The data used in this paper include CoastalDEM, population data, the seismic ground motion parameter zonation map of China, inundation depth data, extreme water level data, and TC wind field data. These data were resampled to 100 m to maintain a consistent resolution.
CoastalDEM data were employed to determine the extent of LECZ in China. The data were significantly improved from NASA Shuttle Radar Topography Mission (SRTM) using an artificial neural network model with 23 input variables specifically designed for elevation reconstruction in coastal areas [43]. These data have a spatial resolution of 100 m and are available on the Climate Central website (https://go.climatecentral.org/coastaldem/ (accessed on 20 May 2023)).
Population data were obtained from the population raster data published by Worldpop for the years 1990–2020 (http://www.worldpop.org (accessed on 20 May 2023)), covering four periods of 1990, 2000, 2010, and 2020. The spatial resolution of this data is 100 m [44].
The data on the peak acceleration of earthquakes were obtained from the seismic ground motion parameter zonation map of China (GB 18306-2015) [45]. The zoning map indicates the earthquake parameters with a probability of exceeding 10% in 50 years, including the peak acceleration and the characteristic period of the earthquake response spectrum.
Flood inundation extent and depth were obtained from the CIMA Foundation’s flood inundation depth dataset (http://preview.grid.unep.ch/ (accessed on 20 May 2023)). This dataset was produced based on hydrological and hydraulic models at a resolution of 1 km, which were validated against historical floods [46]; the flood inundation depth data under a 1/100-year return period were used in this study.
The Global Tide and Surge Reanalysis (GTSR) dataset is the first global reanalysis of storm surges and sea-level extremes based on hydrodynamic models [47,48]. The GTSR covers the global coastline and provides estimates of extreme sea levels for a 100-year return period (http://data.4tu.nl/ (accessed on 20 May 2023)).
The TC range was mapped based on the TC wind field, which used a probabilistic model to generate data for a 1/250-year return period with a spatial resolution of 1 km. These data can be found in the Global Assessment Report on Disaster Risk Reduction (GAR2015) (https://risk.preventionweb.net/index.html (accessed on 20 May 2023)).

2.3. Methods

In this study, the extent of hazard in the LECZ was defined, and the exposed population for each hazard was then extracted from 1990 to 2020. Second, concerning the index for risk management (INFORM) model [49], a comprehensive exposure index of multi-hazards (earthquake, flood, storm surge, and TCs) was constructed to analyze the spatiotemporal change of the exposed population to multi-hazards in the LECZs of China. Finally, the spatial statistics method was applied to determine the spatial pattern of the exposed population to multi-hazards in the LECZs (Figure 2).

2.3.1. Defining the Hazard Extent in the LECZ

In this project, the hazard extent was determined based on various data. In the INFORM model [49], flood and storm surge exposure are extracted according to the extent of inundation, while the seismic and TC exposure indexes are aggregated from the exposure indexes under different hazard levels. Therefore, the seismic and TC need to be classified into different levels.
The potential inundation extent of the LECZ flood was extracted from the global 1/100-year inundation scenario dataset published by the CIMA. Based on the GTSR extreme water level data, the area elevation method was used to extract the LECZ storm surge extent.
The area with peak ground acceleration greater than or equal to 0.1 g in the LECZ region is extracted as the high seismic hazard (HSH) area. We classify peak ground accelerations of 0.1 g and 0.15 g as seismic intensities of VII level and peak ground accelerations of 0.2 g and 0.3 g as seismic intensities of VIII level according to the seismic ground motion parameter zonation map of China (GB 18306-2015) [23,45] (Table 2). Using the 1/250-year TC wind field data in GAR2015, the area with wind speed greater than or equal to 119 km/h is extracted as the range of tropical cyclones. According to the Saffir–Simpson TC wind speed scale [50], TCs are classified into five scales: SS1 (119–153 km/h), SS2 (154–177 km/h), SS3 (178–208 km/h), SS4 (209–251 km/h), and SS5 (252 km/h or higher). In this work, the TC intensity was classified into two different scales, SS1-2 and SS3-5.

2.3.2. Characteristics of Temporal Changes in Population Exposure

To calculate the temporal evolution characteristics of the population exposed to multi-hazards in the LECZs from 1990 to 2020, the average annual rate of change was introduced:
R = x t 2 x t 1 t 2 t 1 1 × 100 %
where x represents the number of people in the coastal lowlands; t 1 and t 2 are the years of the beginning and end times, respectively.

2.3.3. Multi-Hazard Population Exposure Index for LECZ

A comprehensive multi-hazard exposure index for LECZ in China was established with reference to the INFORM exposure assessment model [49]. This model is an open-source risk evaluation tool that covers 191 countries and applies to global, regional, national, and sub-national subdivisions. It includes three main dimensions: hazard and exposure, vulnerability, and coping capacity [49]. The INFORM model analyzes exposure to five natural hazards (earthquakes, storm surges, TCs, floods, and droughts), except for droughts, all four of which are included in this work (http://www.inform-index.org (accessed on 4 April 2023)). The specific steps are as follows:

Data Processing

Data preprocessing of exposed populations under different levels of each hazard by transformation, outlier identification, normalization, and inversion.
(1)
Transformation
The log transformation was used to reduce the positive skewness of data, making the index conform to or closely resemble a normal distribution.
(2)
Outlier identification
Outliers are samples in which some values deviate significantly from the remaining values [51]. In this study, kurtosis and skewness were used to identify outliers [52].
(3)
Normalisation
To make the indicators comparable with each other, the absolute and relative indicators were normalized to 0.0–10. The formula is as follows:
x i , n o r m j = x i j x i , m i n x i , m a x x i , m i n × 10
where x i , m a x is the maximum value of the sample data, and x i , m i n is the minimum value of the sample data.
(4)
Inversion
In the model, all values are presented with the notion that higher is worse. Thus, whenever higher values of the indicator would contribute to a lower comprehensive exposure index, the indicator needs to be inverted. The formula is as follows:
x i , n o r m , i n v j = 10 x i , n o r m j
where x i , n o r m j represents the i -th normalized exposure indicator.

Multi-Hazard Population Exposure Index

(1)
Absolute and relative indicator construction
The absolute exposure indicator and relative exposure indicator were adopted to comprehensively analyze the characteristics of multi-hazard population exposure in the LECZ. Absolute indicators indicate the number of exposed people at different risk levels for each hazard type, and relative indicators indicate the proportion of exposed population to total population at different hazard levels for each hazard.
(2)
Indicator aggregation
Aggregation of absolute and relative exposure indicators for each hazard into a multi-hazard population exposure index using geometric averaging.
G = i = 1 m y i 1 m
where G is the multi-hazard population exposure index. A higher value indicates a higher level of exposure. y i represents the exposure index of the i-th hazard type (i = 1, 2, 3…, n); m is the number of hazard types.

Classification of Multi-Hazard Population Exposure Index

As shown in Table 3, the multi-hazard population exposure index was classified into five levels: very high, high, medium, low, and very low [49].

2.3.4. Spatial Pattern of Exposure Index

The global Moran’s I and Moran’s I can both be calculated to reveal the spatial distribution of the space relationship [53]. In this project, we introduce the global Moran’s I index (Equations (5) and (6)) and the Anselin local Moran’s I index (LISA) (Equation (7)) to analyze the spatial distribution patterns of multi-hazard exposure index in LECZ with the following equations:
M o r a n s   I = n i = 1 n j = 1 n w i j ( x i x ¯ ) ( x j x ¯ ) i = 1 n j = 1 n w i j i = 1 n ( x i x ¯ ) 2 = i = 1 n j 1 n w i j ( x i x ¯ ) ( x j x ¯ ) s 2 i = 1 n j 1 n w i j
s 2 = 1 n j ( x i - x ¯ ) 2 x ¯ = 1 n i = 1 n x i
where n is the number of affected counties in the LECZ x i , the multi-hazard exposure index of county i; x j is the exposure index of its neighboring counties centered on-site j; w i j ,   is the column-normalized proximity matrix. The value of Moran’s I is between −1 and 1. If I is greater than 0, it indicates a positive spatial correlation, and the spatial entities are clustered; conversely, if I is less than 0, it indicates a negative spatial correlation and the spatial entities are dispersed.
The LISA index can spatially display the clustering distribution of the exposure index with the following equation:
I I = z i j w i j z j
where I I is the LISA index; z i and z j represent the deviations from the average; w i j is the weight that defines the domain structure. The results of the LISA index are divided into four different patterns: “High-High” cluster, “Low-Low” cluster, “High-Low” outlier, and “Low-High” outlier. “High-High” cluster means that the values of a cell and its neighbors are both high and constitute a hotspot, while “Low-Low” cluster refers to the cold spot region where the values of a cell and its neighboring cells are both low.

3. Results

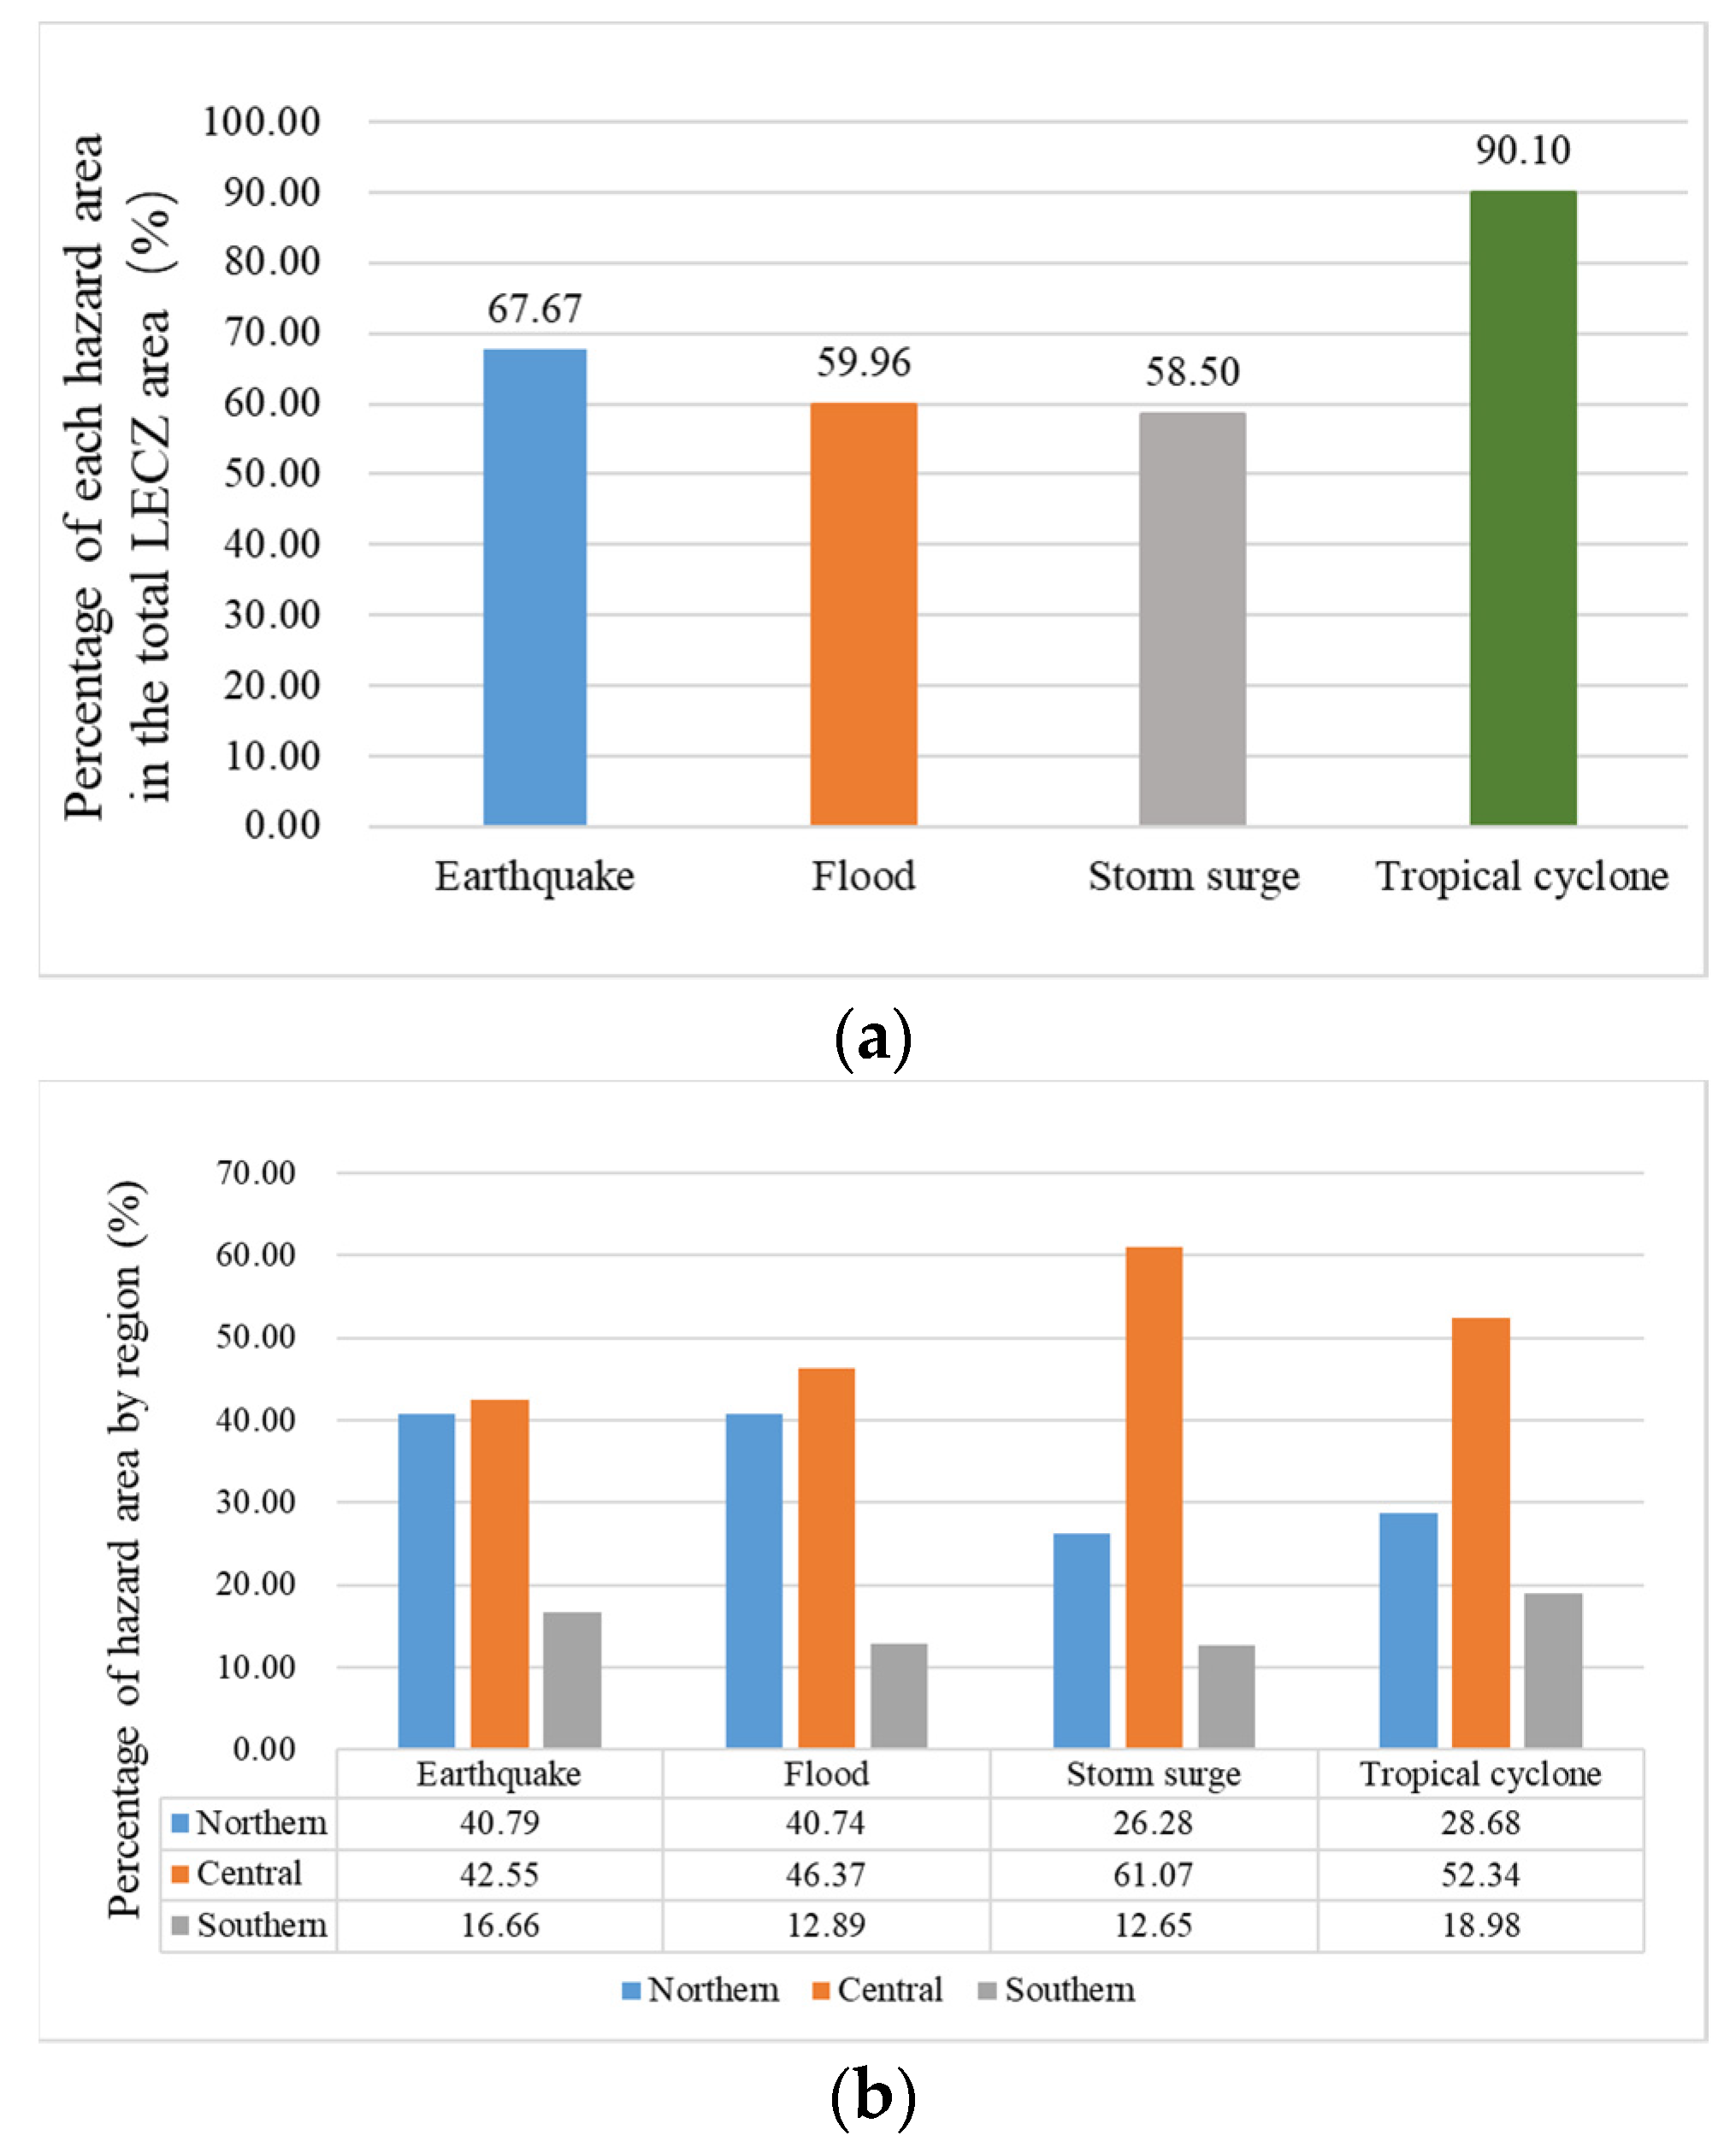
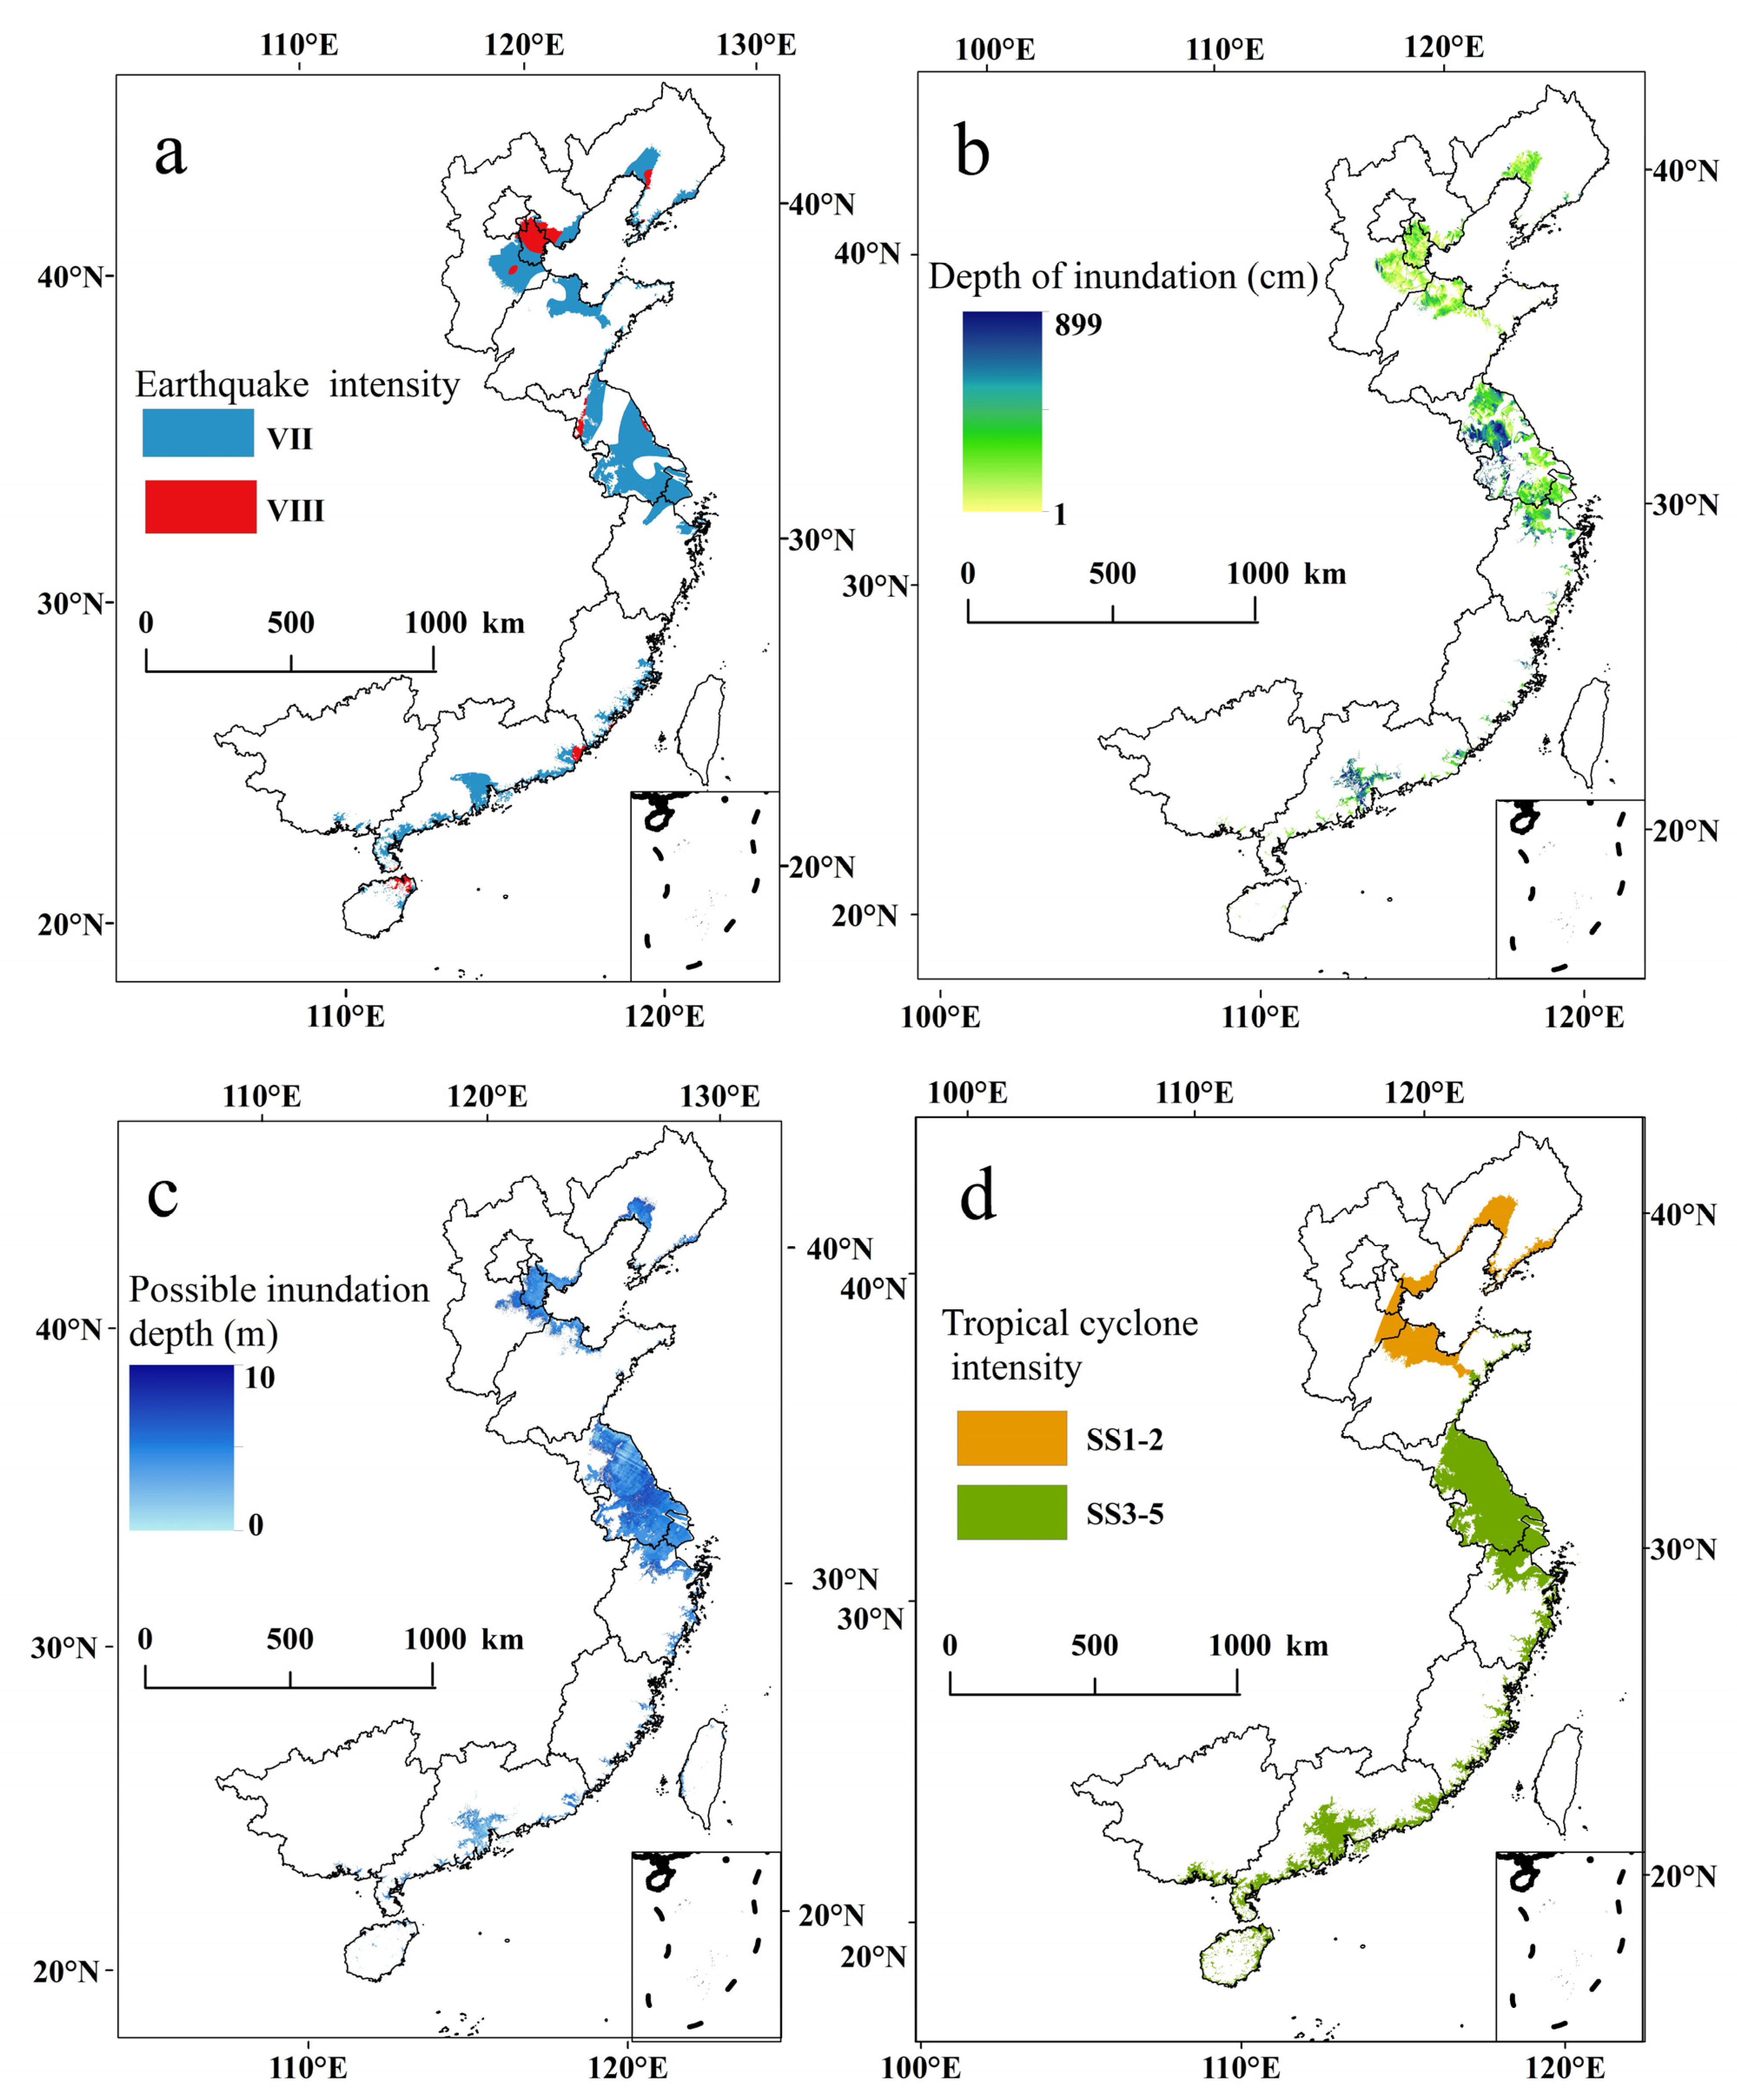
3.1. Distribution of Multi-Hazards in the LECZ

The total area of LECZ in China was 20.97 × 10⁴ km2, which is 1.57 × 10⁴ km2 more than the extent extracted by Liu et al. [3], who used the advanced space-borne thermal emission and reflection radiometer global digital elevation model version 1 (ASTER GDEMv1) (http://www.gdem.aster.ersdac.or.jp (accessed on 25 May 2023)).
The HSH area of the LECZ was 14.19 × 10⁴ km2, accounting for 67.67% of the total LECZ area (Figure 3a). Among them, the VII zone was larger (12.67 × 10⁴ km2), accounting for 89.29% of the area of HSH areas. The VIII zone accounted for 10.71% and was mainly located in Tianjin and the northwest of Jiangsu Province (Figure 4a). The central region of the LECZ had the largest HSH area (6.04 × 10⁴ km2), accounting for 42.55% of the total HSH area (Figure 3b).
The flood-prone area of China’s LECZ was 12.57 × 10⁴ km2, accounting for 59.94% (Figure 3a) of the total area of the LECZ. The floodplain in the central LECZ had the largest area (5.83 × 10⁴ km2), accounting for 46.37% of the total floodplain area (Figure 3b and Figure 4b). The storm surge area was 12.26 × 10⁴ km2, accounting for 58.5% of the total area of the LECZ (Figure 3a). Among each region of the LECZ, the central region had the largest possible inundation area (7.69 × 10⁴ km2), accounting for 61.07% of the total inundation area (Figure 3b and Figure 4c).
The affected area of TC in China’s LECZ was 18.89 × 10⁴ km2, accounting for 90.1% of the total area of the LECZ (Figure 3a). SS3-5 scale had a larger area (13.81 × 10⁴ km2), accounting for 73.11% of the total TC hazard area. SS1-2 scale was mainly distributed in the northern LECZ, and SS3-5 was distributed in the central and southern parts of the LECZ. The area of TC hazard in the central LECZ was the largest (9.89 × 10⁴ km2), accounting for 52.34% of the total TC-affected area (Figure 3b and Figure 4d). Overall, TCs have the largest area and wide impact among the hazards in China’s LECZ, and the hazards were mainly distributed in the central region.

3.2. Exposed Population Characteristics of Multi-Hazards in the LECZ

3.2.1. Distribution of Exposed Population in the LECZ in 2020

In 2020, the total number of population exposed to HSH in China’s LECZ was 201 million. The exposed population of earthquakes in 2020 was mainly concentrated in the VII zone, with 178 million people exposed, accounting for 65.5% of the total population exposed to HSH in the LECZ. The central region of the LECZ had the largest exposed population (78 million people), accounting for 51.86% of the total exposed population of earthquakes (Figure 5a).
The total exposed population to floods in China’s LECZ in 2020 was 162 million. The largest exposed population (up to 85 million) was in the center of the LECZ, accounting for 52.31% of the total flood-exposed population (Figure 5b). In 2020, the total population exposed to storm surges in the LECZ of China was 173 million. The central region had the largest exposed population of 111 million, accounting for 64.37% of the total storm surge exposure (Figure 5c).
In 2020, the total number of population exposed to TCs in China’s LECZ was 249 million. The number of people exposed to SS3-5 levels was even higher (223 million), accounting for 89.41% of the total population exposed to TCs. The central region had the largest (137 million) population exposed to TCs, accounting for 55.20% of the total population exposed to TCs in the LECZ (Figure 5d).

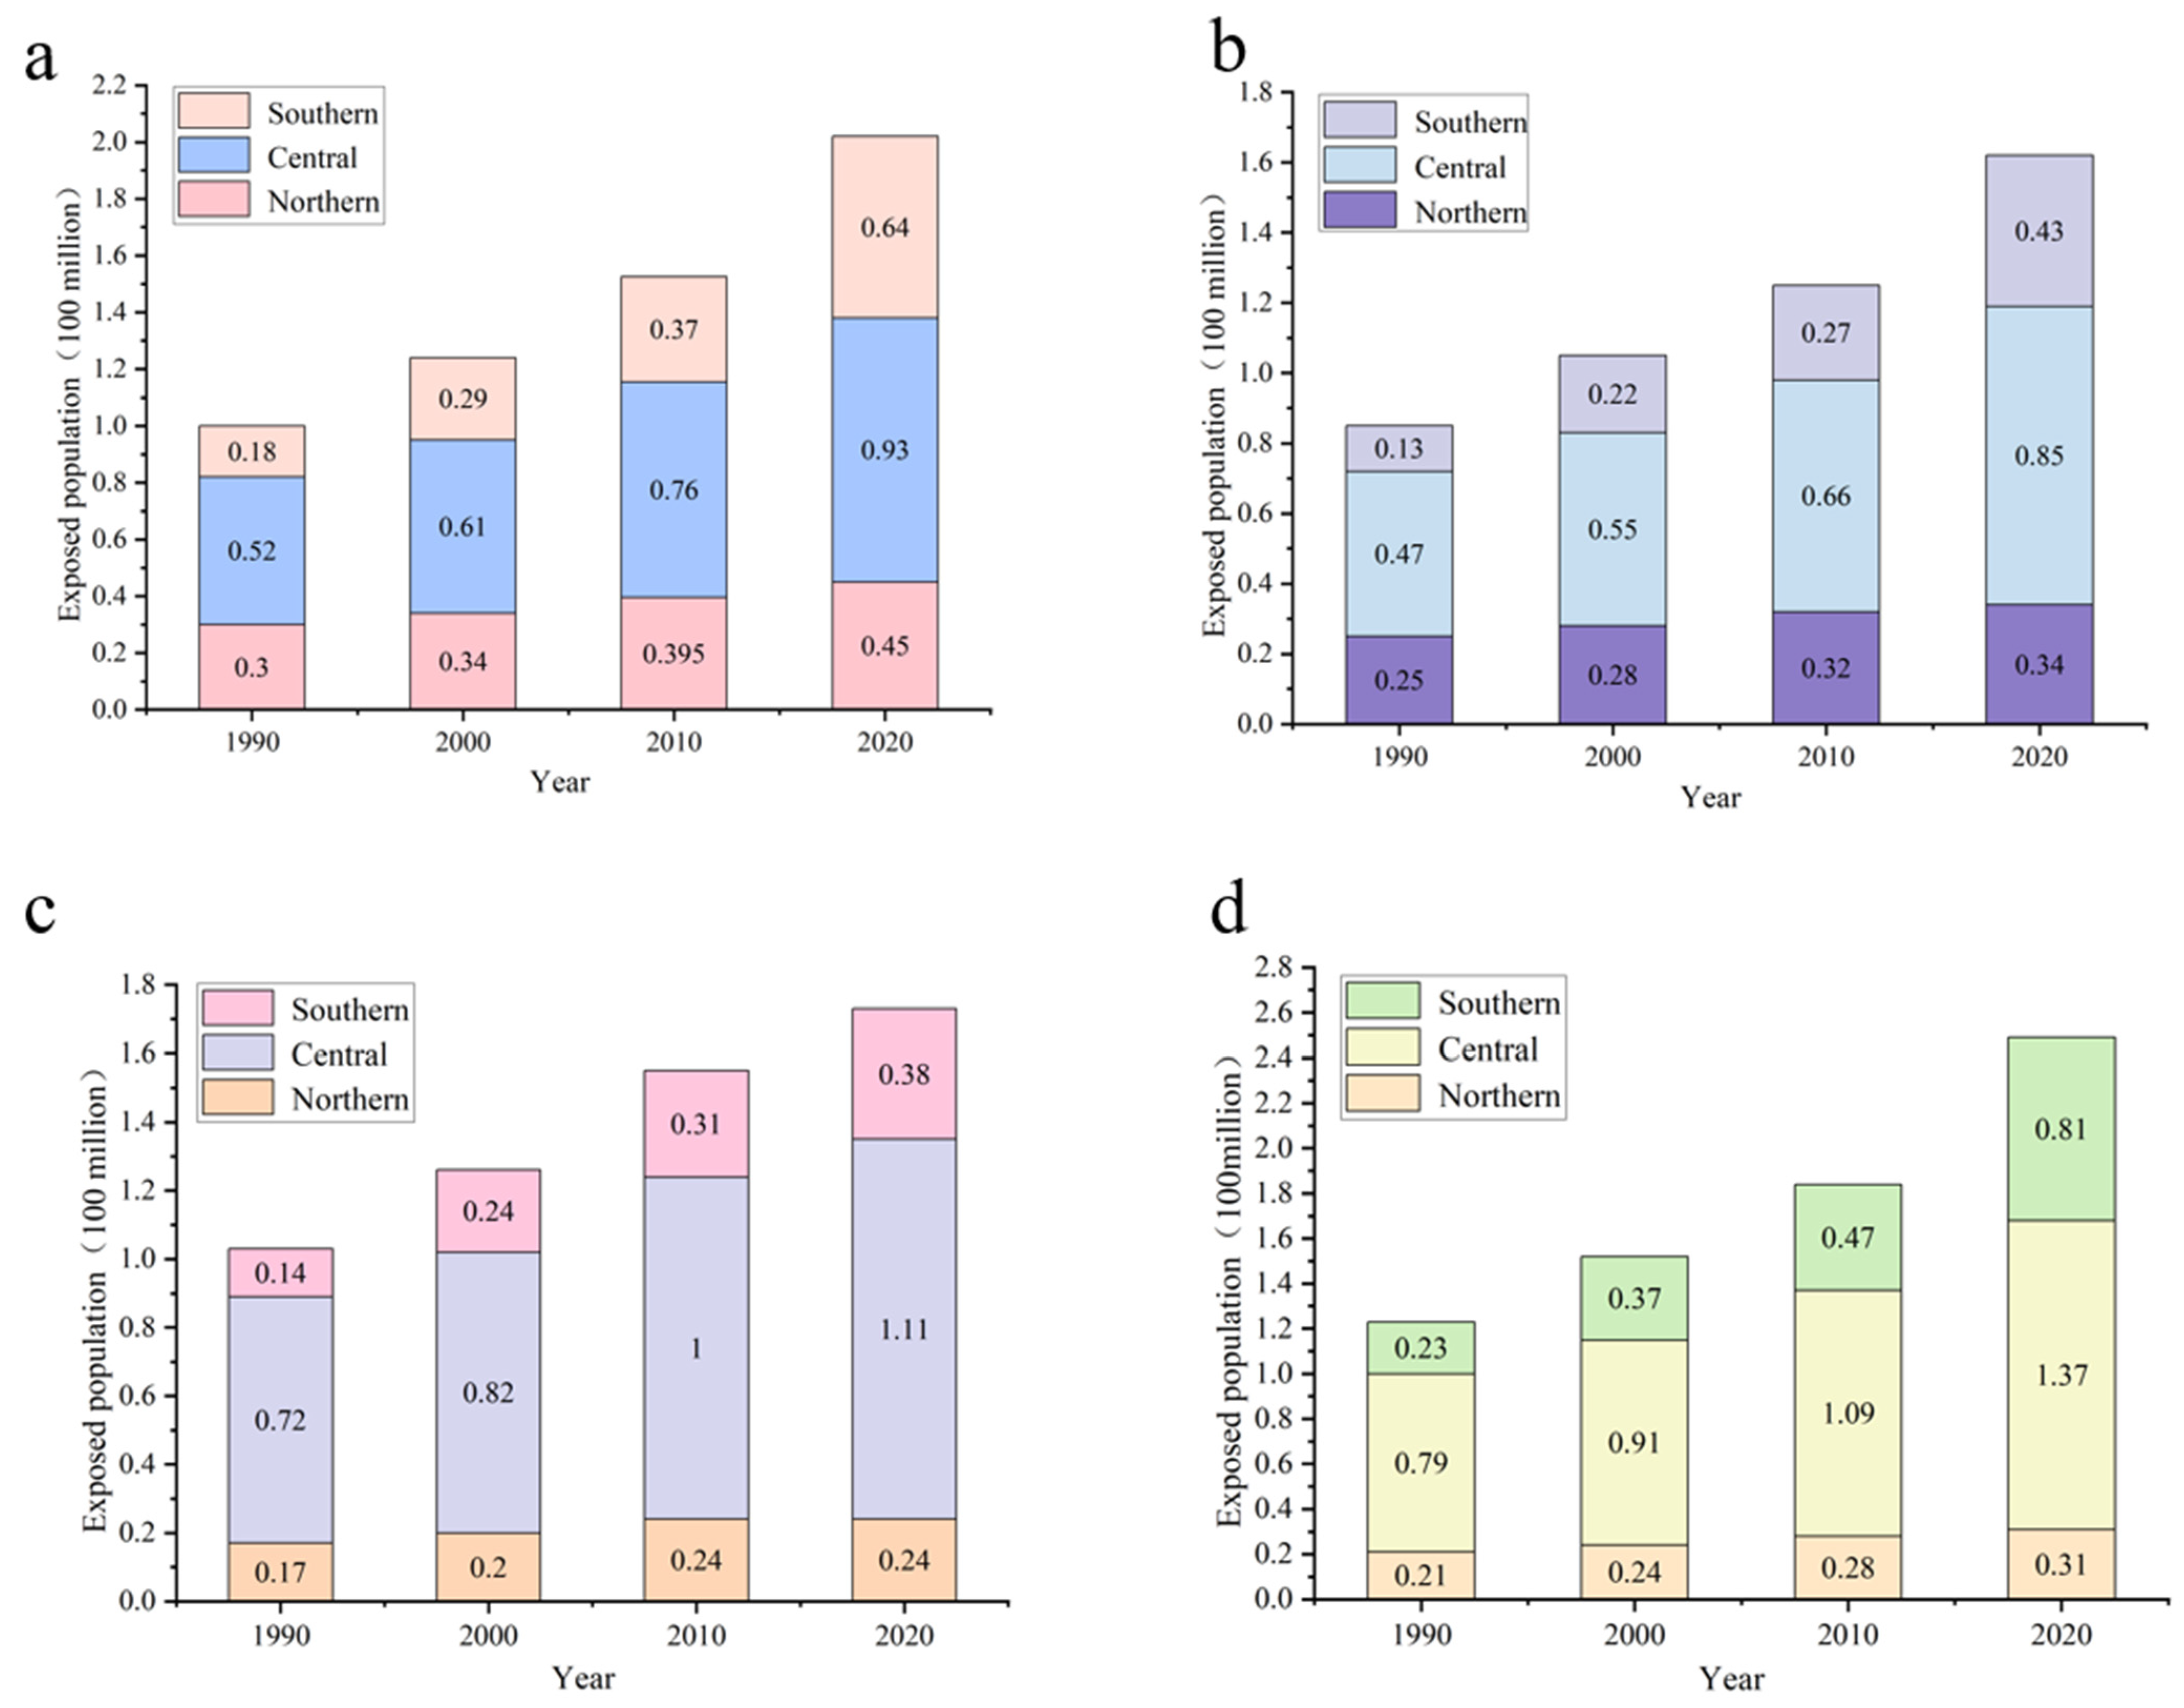
3.2.2. Spatial–Temporal Variation Characteristics of Exposed Population in 1990–2020

From 1990 to 2020, the total population of China’s LECZ increased by 134 million, and the population in the central LECZ increased by 60 million, accounting for 44.53% of the total population increase (Figure 5). The average annual growth rate was 2.29%, with the southern region having the highest average annual growth rate of 5.84%.
Population exposure to earthquakes increased by 100 million from 1990 to 2020, with an average annual growth rate of 2.32%. The southern region of the LECZ had the highest average annual growth rate of 4.22%. The central region had the largest increase (26 million people), accounting for 45.12% of the total increase in population.
From 1990 to 2020, the number of exposed people in LECZ floodplains increased by 76 million, with an average annual growth rate of 2.15%. The southern region had the largest annual growth rate of exposed population at 4.07%. The largest increase in population (38 million people) occurred in the central region, accounting for 49.2% of the total increase in the population exposed.
Population exposure to storm surges increased by 69 million people from 1990 to 2020. The largest increase in population exposure was in the central region, with 39 million, accounting for 56.38% of the total increase in population exposure. The average annual growth rate of population exposure to storm surges was 1.72%, while the average annual growth rate of population exposure in the southern region was 3.37%.
Population exposure to TCs in the LECZ increased by 125 million between 1990 and 2020. The central region of the LECZ had the largest increase in the exposed population, with 58 million, accounting for 46.22% of the total increase in the exposed population of TCs. The average annual growth rate of population exposure to TCs was 2.36%. The southern region had the highest average annual growth rate (4.29%) of the population exposed to TCs. Population exposure was mainly concentrated in the SS3-5 region, and the proportion of the exposed population to the total population exposure of TCs continued to increase, from 89.41% in 1990 to 94.24% in 2020.
Overall, the growth rates of the exposed population to earthquakes and TCs from 1990 to 2020 were higher than the population growth rate of the LECZ as a whole. In the LECZ sub-regions, the central region had the largest exposed population, and the southern region had the fastest population growth rate.

3.3. Comprehensive Exposure of Multi-Hazards in the LECZ

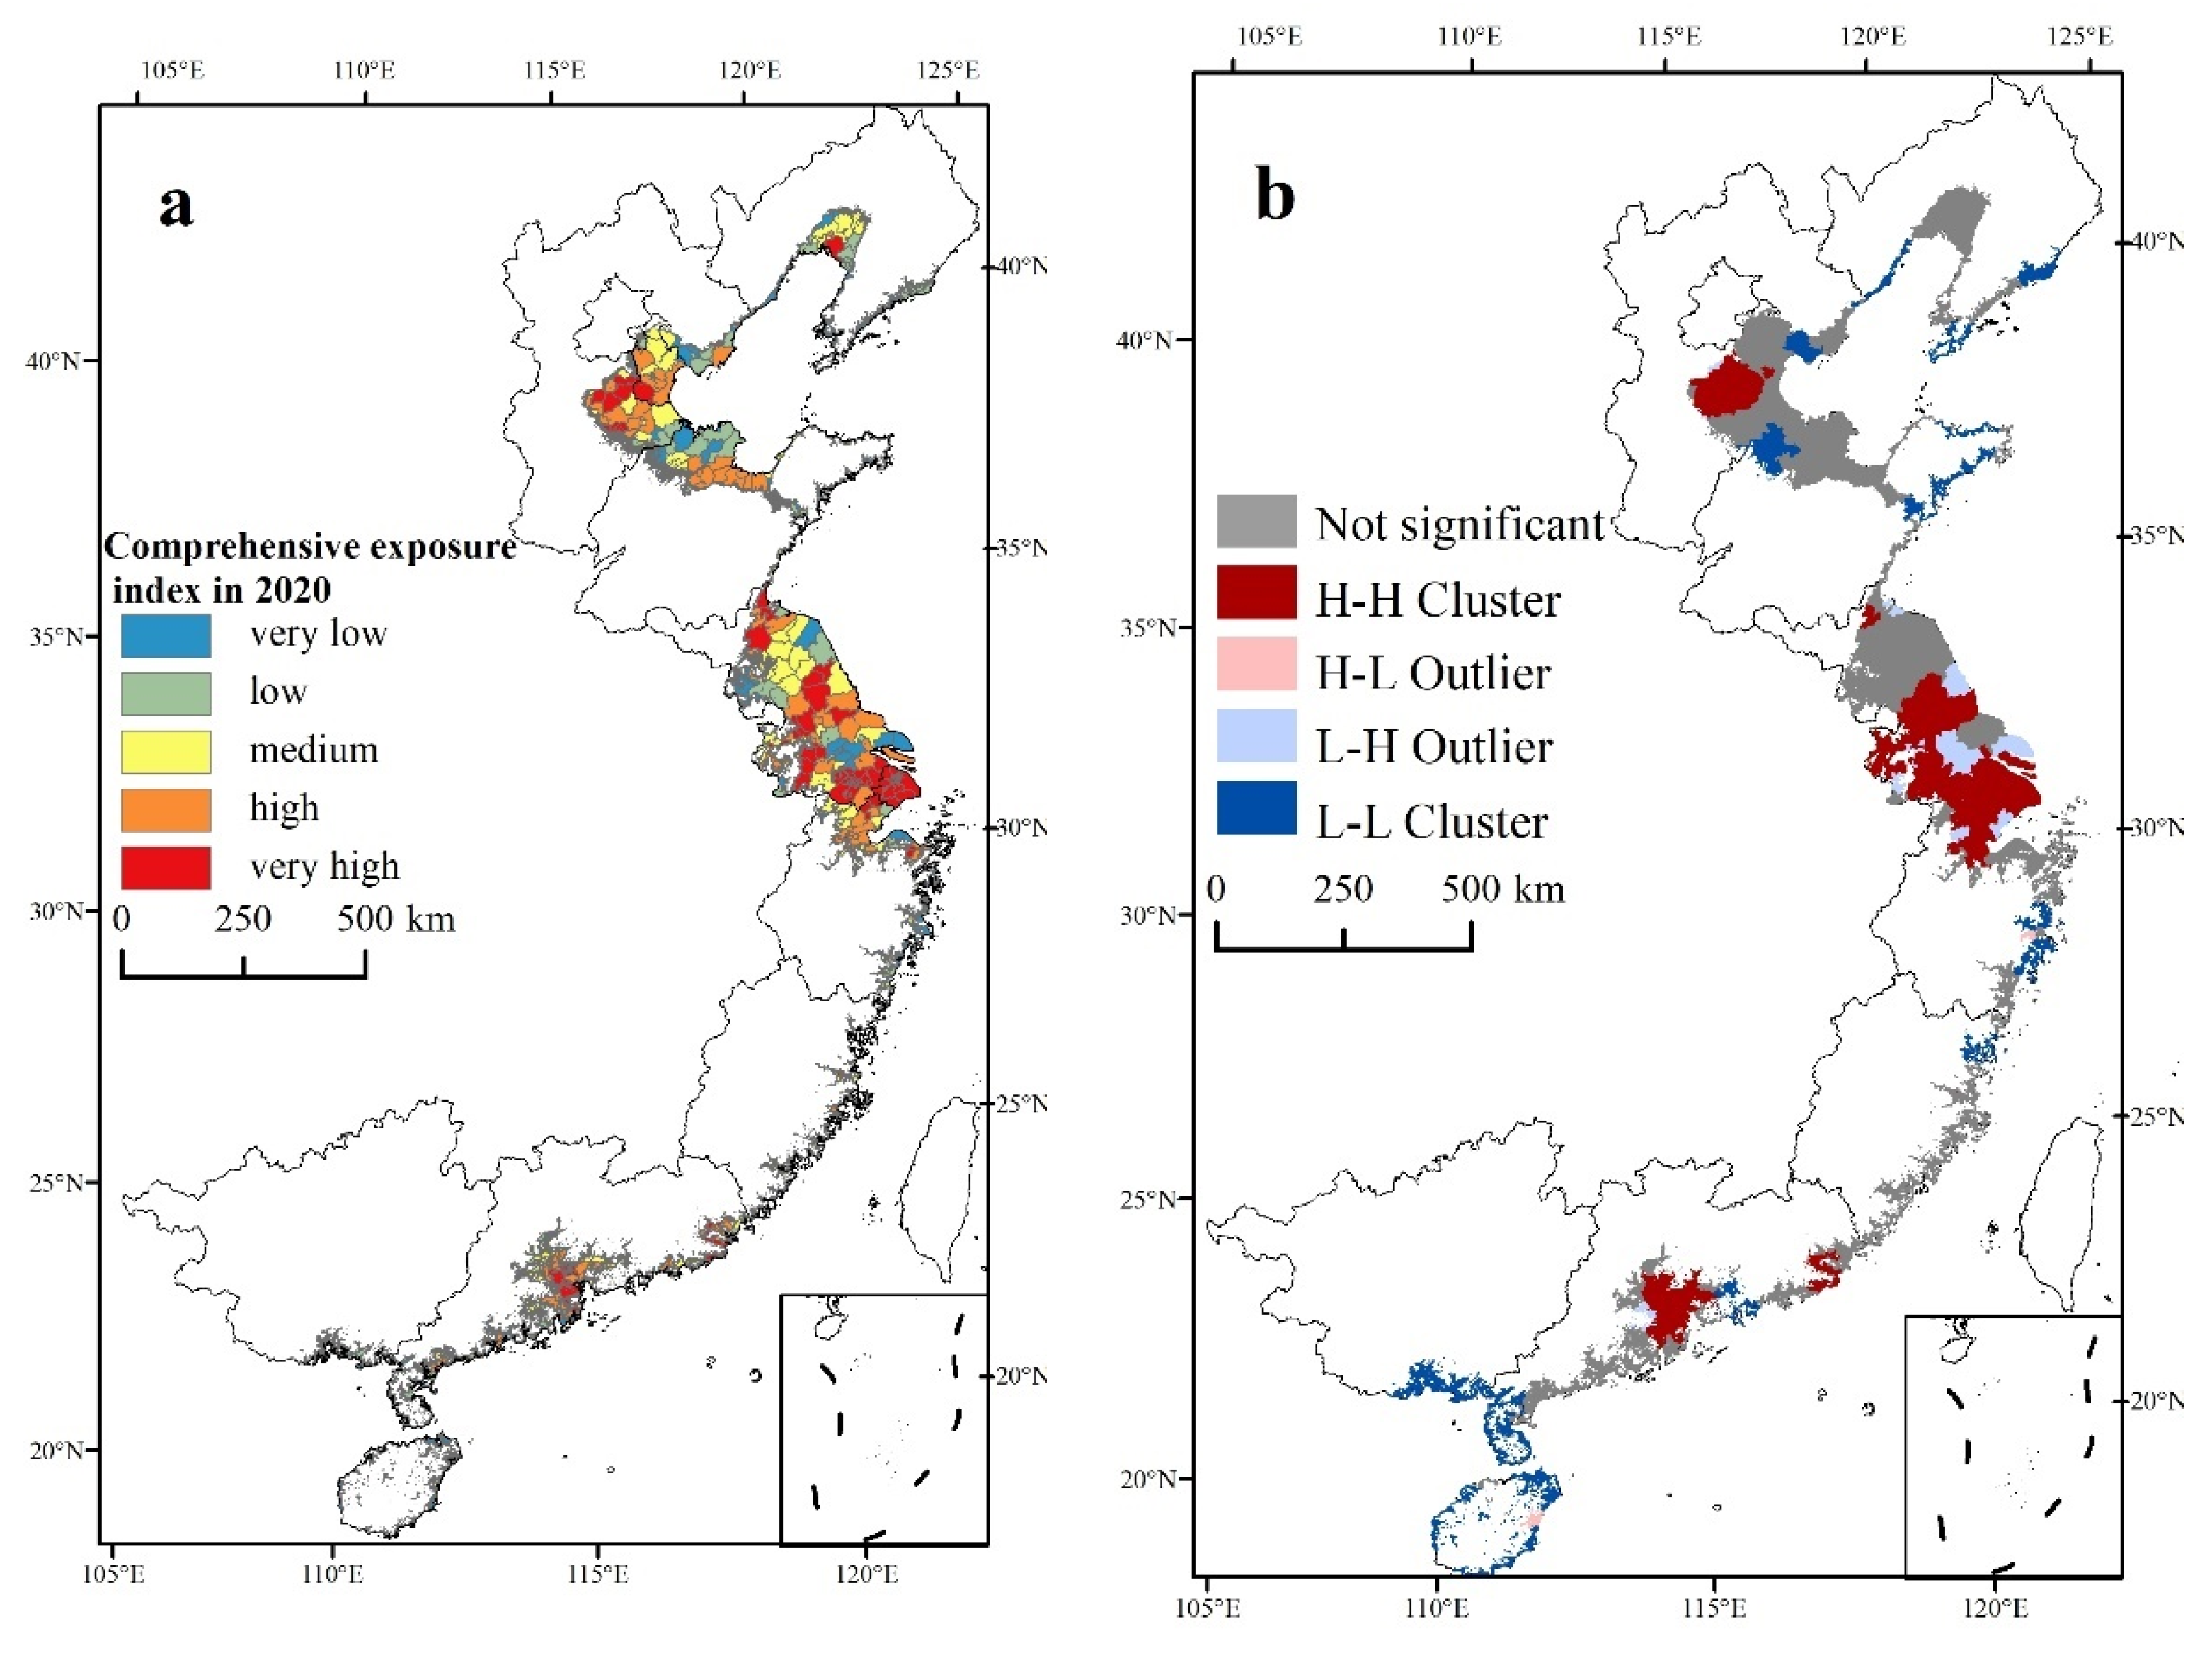
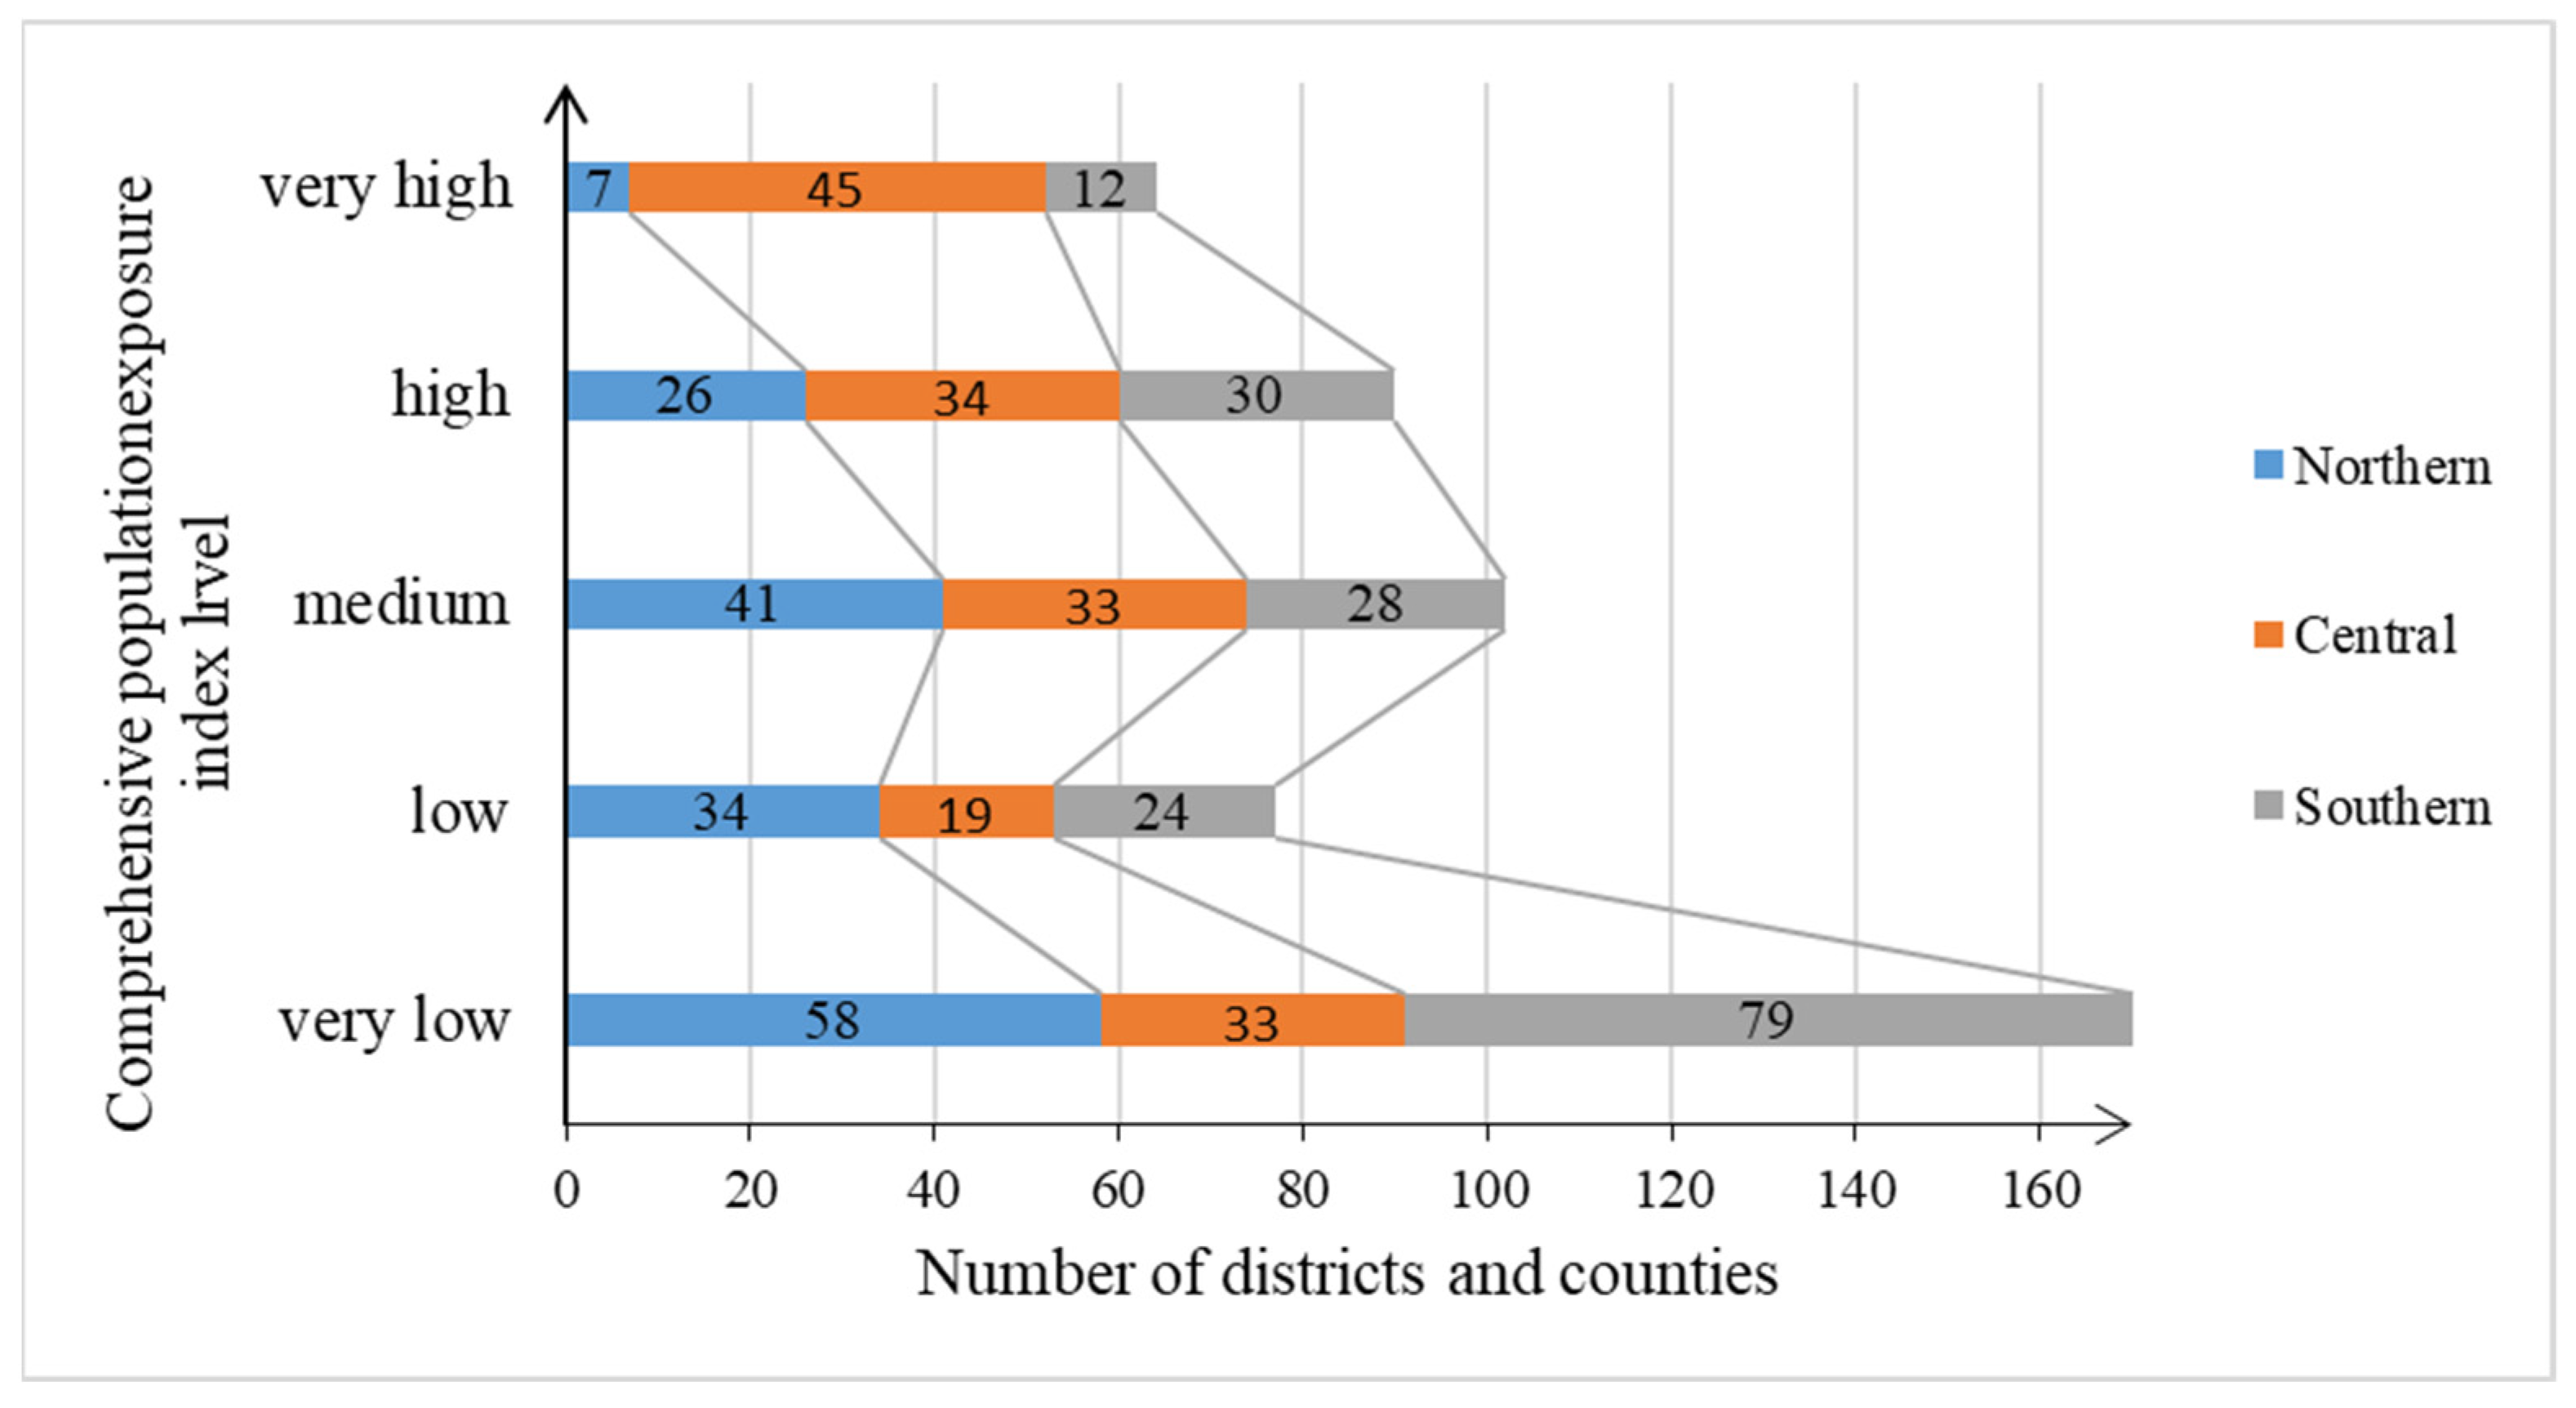
3.3.1. Spatial Distribution of Comprehensive Exposure to Multi-Hazards in the LECZ in 2020

The spatial distribution of comprehensive exposure to multi-hazards in the LECZ in 2020 was analyzed according to the exposure index model. The total number of districts and counties for index calculation after excluding outliers was 503. The exposure index was divided into five levels: very high, high, medium, low, and very low. The number of districts and counties is 64, 90, 102, 77, and 170, respectively (Figure 6).
Districts and counties with a very low level of exposure were mainly located in the southern region (79), accounting for 46.47% of the total number of districts and counties at this level (Figure 7a). The low level was mainly distributed in the northern region (34 districts and counties), accounting for 44.16% of the total number of counties in the low level. The medium level was concentrated in the northern region (41), accounting for 40.2% of the total number of districts and counties in the medium level. The high level (34) and very high level (45) were mainly distributed in the central region, accounting for 37.78% and 70.31% of the number of districts and counties in the two levels, respectively.
The spatial characteristics of the multi-hazard exposure index in 2020 were analyzed, and Moran’s I index value was 0.71 (p < 0.01), indicating a spatial clustering of the exposed population. The spatial clustering pattern of the multi-hazard exposure index was analyzed by the LISA index (Figure 7b). High–high clusters were mainly distributed in the southern part of Liaoning Province, the eastern part of Hebei Province, the central part of Jiangsu Province, Shanghai, and the Guangdong Province. Low–low clusters were mainly distributed in eastern Zhejiang Province, southern Guangxi Province, and Hainan Province. The number of high–high cluster counties was the largest (115), accounting for 22.86% of the total number of counties in the LECZ. The central LECZ had the largest number of 74 districts and counties, accounting for 64.35% of the total number of high–high cluster counties. The number of low–low cluster counties was 98, accounting for 19.48% of the total number of counties in LECZ. The northern region had the largest number of 46, accounting for 46.94% of the total number of low–low cluster counties.
In summary, the exposure index is high in the central region, and population exposure is also mainly concentrated in Jiangsu Province and Shanghai in this region. The above regions are the hotspots of multi-hazard exposure and the key areas for disaster risk management.

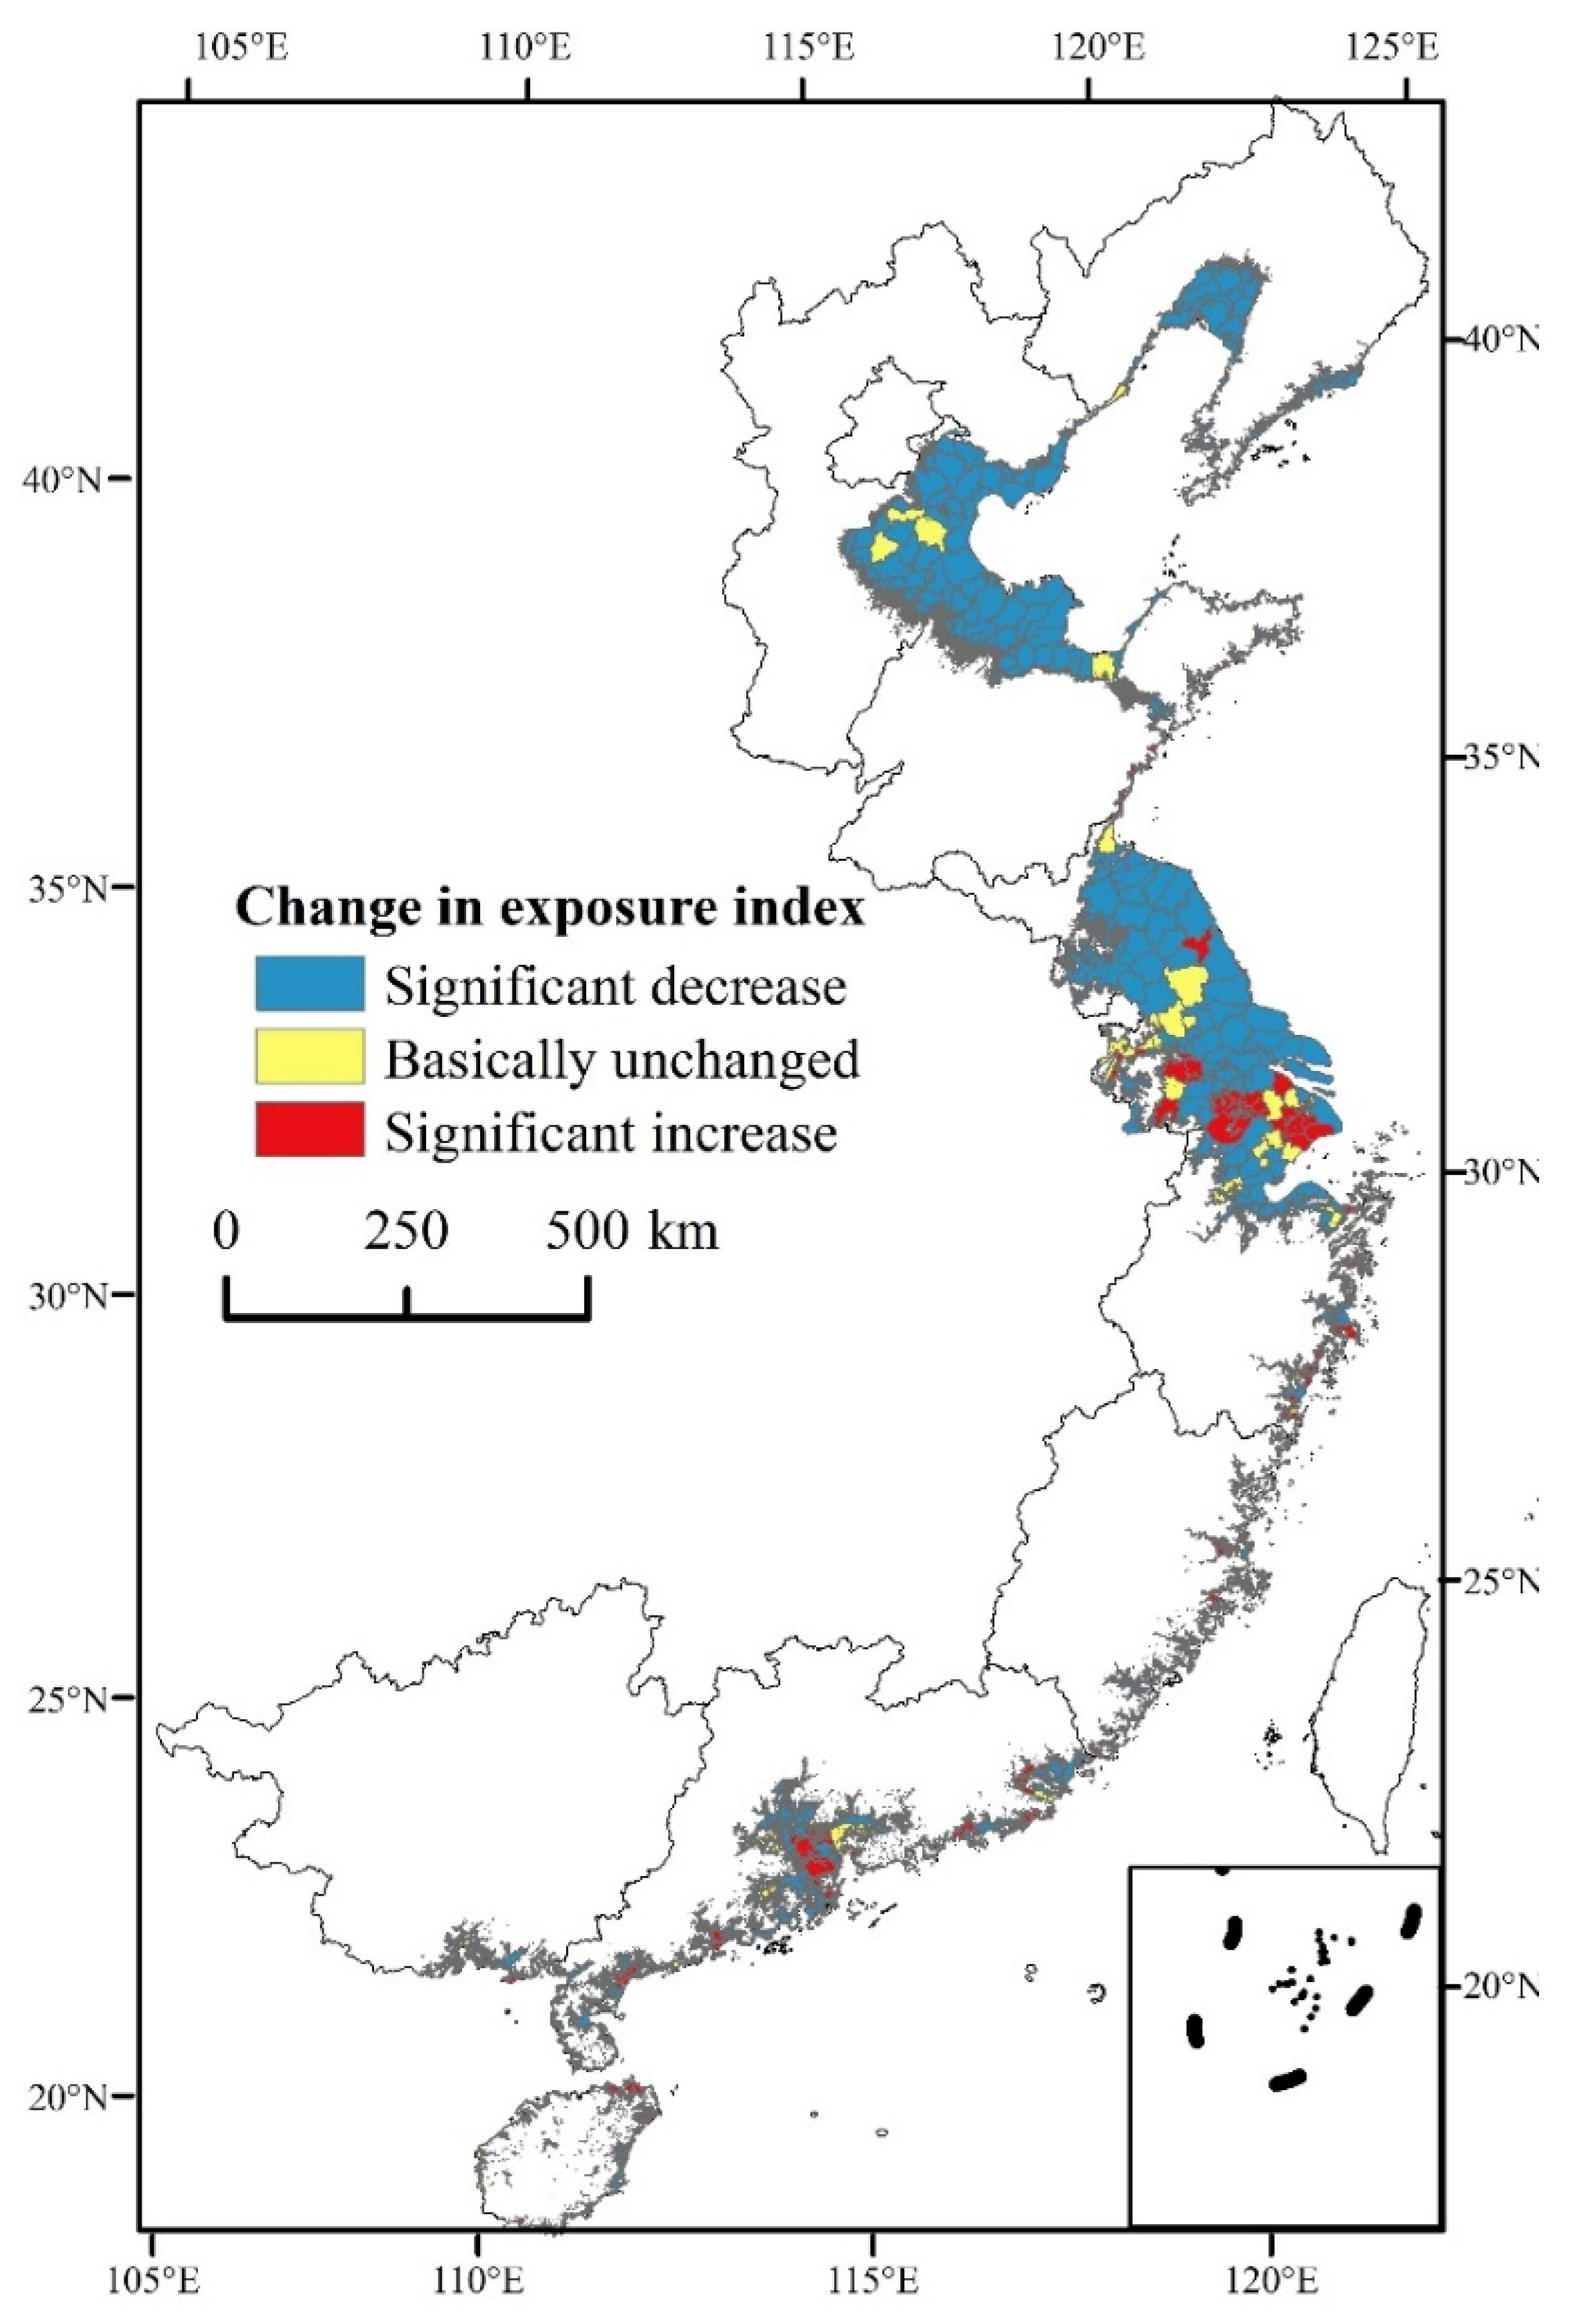
3.3.2. Changes in the Comprehensive Exposure to Multi-Hazards in the LECZ from 1990 to 2020

The ratio of the exposure index in 2020 to that in 1990 was applied to measure the change in the multi-hazard comprehensive exposure index from 1990 to 2020. The exposure index ratio was divided into three grades according to the method of Mao et al. [54]: significant increase (≥1.1), basically unchanged (0.91–1.0), and significant decrease (≤0.90). The areas with a significant increase were mainly located in Shanghai and Guangdong Provinces. The regions with basically unchanged exposure index are mainly located in Hebei and Jiangsu Province. The significant decrease was mainly observed in Shandong Province (Figure 8).
Districts and counties (316) with significant decreases in the exposure index were mainly located in the northern region, accounting for 62.82% of the total number of significantly decreased counties. Districts and counties with a significant increase were mainly distributed in the southern region (101), accounting for 20.08% of the total number of districts and counties that experienced an increase.
In terms of provinces, Guangdong Province had the largest number of districts and counties with an increase in exposure index (24), accounting for 23.76% of the total number of districts and counties with an increased index. Jiangsu Province had the largest number of districts and counties with a decrease in exposure index (58), accounting for 18.35% of the total number of districts and counties in the significantly reduced region.
The rapid urbanization and economic development are the main reasons for population migration. Shanghai and Guangdong Province are located in the highly urbanized and economically developed regions of the Yangtze River Delta and the Pearl River Delta, respectively. Therefore, the population is moving to Shanghai and Guangdong Province, making these two regions the main areas with an increased exposure index. This also results in a clustered distribution of the exposed population in these two regions. Regions with high levels of development, like Shanghai and Guangdong Province, will also experience higher numbers of affected populations and economic losses when facing disasters. Therefore, Shanghai and Guangdong Province are key areas for multi-hazard risk management, and reasonable urbanization planning should be carried out to reduce disaster risks.

4. Discussion

4.1. Contribution of Each Hazard Exposure Index to the Comprehensive Exposure Index

Principal component analysis (PCA) is a common method used to analyze multivariate problems, and in this study, PCA was used to analyze the contribution of the exposure indicators of each hazard to the comprehensive exposure index in the form of weights [55]. The cumulative contribution rate of the first three principal components was 93.83%, obtained by PCA, which can effectively explain the influence of each hazard exposure indicator on the comprehensive exposure index. The three principal component expressions were derived based on the contribution rate and coefficients (Table 4 and Table 5):
F 1 = 0.3 h 1 + 0.6 h 2 + 0.62 h 3 + 0.39 h 4
  F 2 = 0.31 h 1 + 0.66 h 2 0.49 h 3 0.48 h 4
F 3 = 0.88 h 1 + 0.44 h 2 0.09 h 3 + 0.13 h 4
The comprehensive principal component expression is as follows:
F = 0.63 F 1 + 0.18 F 2 + 0.12 F 3
The formula is obtained by substituting Equations (8)–(10) into Equation (11):
F = 0.14 h 1 + 0.56 h 2 + 0.29 h 3 + 0.17 h 4
where F represents the integrated principal component; h 1 represents the seismic exposure indicators; h 2 is the flood exposure indicators; h 3 is the storm surge exposure indicators; h 4 is the TC exposure indicators.
The weight of each hazard exposure indicator on the multi-hazard exposure index was calculated using Equation (12). The results showed that the degree of influence of each hazard on the multi-hazard exposure index, in descending order, is flooding (0.56), storm surge (0.29), TC (0.17), and earthquake (0.17). Among the hazards in the LECZ, flooding has the highest contribution to the multi-hazard comprehensive exposure index. Therefore, the LECZ needs to focus on flooding.

4.2. Policy Implications

The rising sea level in China is higher than the global average [56], leading to an increasing intensity of TCs and storm surges. At the same time, there is a rapid increase in the exposed population, with a concentration of population distribution. These factors will exacerbate disaster risks [57]. Risk adaptation strategies should consider the impacts of various disasters. Currently, adapting to climate change and reducing disaster losses are urgent challenges faced by LECZ.
Overall flooding has the greatest impact on the multi-hazard exposure index in the LECZ. Therefore, risk management of floods is key to reducing multi-hazard losses in the LECZ. Measures to cope with disasters include structural and nonstructural mitigation measures [58], and for coastal areas, seawall project is the first line of defense against disasters along the coast [59], which is one of the structural measures. Meanwhile, with the increase in exposed population, the seawall flood protection standard should be dynamically adjusted according to its population size. In addition, measures such as elevating houses can also be taken. Nonstructural measures include emphasizing flood risk knowledge, raising public awareness, and conducting training and education [60].
In terms of changes in the exposure of the multi-hazard population in the LECZ, the areas with increased exposure indexes are mainly Shanghai and Guangdong Province, which are the centers of China’s economic development and the distribution areas of megacities. Emergency evacuation is a key tool for risk management in megacities [61,62].

4.3. Limitations

In this study, a multi-hazard population exposure analysis of LECZ was conducted based on a large amount of data. The errors and uncertainties associated with this data need to be discussed.
Firstly, the CoastalDEM elevation dataset is an improvement over the SRTM dataset, with a global average error ranging from 0.29 m to 1.88 m. The accuracy of the dataset is lower when the elevation is below 10 m [12]. The storm surge data in this project are derived from the GTSR dataset, and there are differences in the number of exposed populations under different storm surge models. Muis et al. [46] showed that the exposed population under the GTSR dataset increased by 39% globally, compared to the results derived from the DINAS-COAST Extreme Sea Levels (DCESL) dataset.
Finally, the types of hazards faced by the LECZ of China are diverse, and this study selected the four major hazards for population exposure assessment. In subsequent research, more hazards can be included in the exposure assessment in the LECZ.

5. Conclusions

In this work, the population exposure to earthquakes, floods, storm surges, and TCs was analyzed in the LECZ of China from 1990 to 2020. Moreover, a comprehensive exposure index of multi-hazards was constructed to analyze the temporal variation and spatial patterns of multi-hazard exposure in the LECZ of China, yielding the following main findings:
(1)
Among the hazards, TCs have the largest area, accounting for 90.08% of the LECZ of China. The population exposure to TC has the fastest growth rate, with an average annual growth rate of 2.36%, which is higher than that of the LECZ (2.29%). The central LECZ has the largest area exposed to each hazard. Additionally, with the increase in earthquake population exposure, the risk of earthquake hazards will be more severe in the future.
(2)
The central region of LECZ is the region with the largest number of increased exposure populations for each hazard, the area with very high and high levels of exposure index, and the region with the largest number of districts and counties with high–high clustering of exposure index from 1990 to 2020. The southern region of LECZ has the fastest increase in exposed population for each hazard type. Among the LECZ regions, the central LECZ is the hotspot with a high population concentration and a large exposed population, while the southern region of LECZ is facing greater disaster risk due to the fastest rate of population growth.
(3)
Overall, the flood exposure indicator contributed the most to the multi-hazard risk index among the hazards in the LECZ. Therefore, floods are the focus of multi-hazard risk management in LECZ.

Author Contributions

Data curation, K.Y. and Y.Y.; funding acquisition, L.Y.; methodology, J.W.; visualization, L.Z.; writing—original draft, S.F.; writing—review and editing, J.L. and C.W. All authors have read and agreed to the published version of the manuscript.

Funding

This research was funded by the Ministry of Natural Resources (KLLSMP20230X), and the National Natural Science Foundation of China (Grants No. 42171080, 42105125).

Institutional Review Board Statement

Not applicable.

Informed Consent Statement

Not applicable.

Data Availability Statement

Not applicable.

Conflicts of Interest

The authors declare no conflict of interest.

References

  1. McGranahan, G.; Balk, D.; Anderson, B. The rising tide: Assessing the risks of climate change and human settlements in low elevation coastal zones. Environ. Urban. 2007, 19, 17–37. [Google Scholar] [CrossRef]
  2. Lichter, M.; Vafeidis, A.T.; Nicholls, R.J.; Kaiser, G. Exploring data-related uncertainties in analyses of land area and population in the “Low-Elevation Coastal Zone”(LECZ). J. Coast.Res. 2011, 27, 757–768. [Google Scholar] [CrossRef]
  3. Liu, J.; Wen, J.; Huang, Y.; Shi, M.; Meng, Q.; Ding, J.; Xu, H. Human settlement and regional development in the context of climate change: A spatial analysis of low elevation coastal zones in China. Mitig. Adapt. Strateg. Glob. Chang. 2015, 20, 527–546. [Google Scholar] [CrossRef]
  4. Pan, S.; Du, S.; Xu, H.; Wu, Y.; Wang, L.; Zong, W.; Wen, J. Spatio-Temporal Analysis on Low Elevation Coastal Zone and Its Population in the Yangtze River Delta Region. Areal Res. Dev. 2016, 35, 161–165. [Google Scholar]
  5. Oppenheimer, M.; Glavovic, B.; Hinkel, J.; van de Wal, R.; Magnan, A.K.; Abd-Elgawad, A.; Cai, R.; Cifuentes-Jara, M.; Deconto, R.M.; Ghosh, T. Sea Level Rise and Implications for Low Lying Islands, Coasts and Communities; Cambridge University Press: Cambridge, UK; New York, NY, USA, 2019; pp. 321–445. [Google Scholar] [CrossRef]
  6. Vafeidis, A.; Neumann, B.; Zimmerman, J.; Nicholls, R.J. MR9: Analysis of Land Area and Population in the Low-Elevation Coastal Zone (LECZ); Migration and Global Environmental Change, Government Office for Science: London, UK, 2011; pp. 12–26.
  7. Nicholls, R.J.; Cazenave, A. Sea-level rise and its impact on coastal zones. Science 2010, 328, 1517–1520. [Google Scholar] [CrossRef] [PubMed]
  8. Brown, S.; Nicholls, R.J.; Woodroffe, C.D.; Hanson, S.; Hinkel, J.; Kebede, A.S.; Neumann, B.; Vafeidis, A.T. Sea-level rise impacts and responses: A global perspective. In Coastal Hazards; Springer: Berlin/Heidelberg, Germany, 2013; pp. 117–149. [Google Scholar]
  9. Diaz, D.B. Estimating global damages from sea level rise with the Coastal Impact and Adaptation Model (CIAM). Clim. Change 2016, 137, 143–156. [Google Scholar] [CrossRef]
  10. Wahl, T.; Haigh, I.D.; Nicholls, R.J.; Arns, A.; Dangendorf, S.; Hinkel, J.; Slangen, A.B. Understanding extreme sea levels for broad-scale coastal impact and adaptation analysis. Nat. Commun. 2017, 8, 16075. [Google Scholar] [CrossRef]
  11. Fang, J.; Shi, P. A review of coastal flood risk research under global climate change. Prog. Geogr. 2019, 38, 625–636. [Google Scholar]
  12. Kulp, S.A.; Strauss, B.H. New elevation data triple estimates of global vulnerability to sea-level rise and coastal flooding. Nat. Commun. 2019, 10, 4484. [Google Scholar]
  13. Xu, S.; Wang, J.; Shi, C.; Yan, J. Research of the Natural Disaster Risk on Coastal Cities. Acta Geogr. Sinica 2006, 61, 127–138. [Google Scholar]
  14. Sheik Mujabar, P.; Chandrasekar, N. Coastal erosion hazard and vulnerability assessment for southern coastal Tamil Nadu of India by using remote sensing and GIS. Nat. Hazards 2013, 69, 1295–1314. [Google Scholar] [CrossRef]
  15. Lu, Y.; Hou, Y.; Guo, L.; Zhao, Y.; Chen, L. Preliminary Study on Integrated Assessment for Multi-hazard of Coastal City: Case Study of Quanzhou, Fujian Province. J. Catastrophology 2015, 30, 211–216. [Google Scholar]
  16. Jongman, B.; Ward, P.J.; Aerts, J.C. Global exposure to river and coastal flooding: Long term trends and changes. Glob. Environ. Change 2012, 22, 823–835. [Google Scholar] [CrossRef]
  17. Clark, P.U.; Shakun, J.D.; Marcott, S.A.; Mix, A.C.; Eby, M.; Kulp, S.; Levermann, A.; Milne, G.A.; Pfister, P.L.; Santer, B.D. Consequences of twenty-first-century policy for multi-millennial climate and sea-level change. Nat. Clim. Chang. 2016, 6, 360–369. [Google Scholar] [CrossRef]
  18. Cai, R.; Li, B.; Fang, W.; Fu, S.; Han, Z.; Han, J.; Tan, H. An Integrated Risk Study of Global Change in China’s Coastal Zone and Coastal Areas. China Basic Sci. 2017, 19, 24–29. [Google Scholar]
  19. IPCC. Summary for Policymakers. In Climate Change 2023: Synthesis Report. A Report of the Intergovernmental Panel on Climate Change. Contribution of Working Groups I, II and III to the Sixth Assessment Report of the Intergovernmental Panel on Climate Change; Core Writing Team, Lee, H., Romero, J., Eds.; IPCC: Geneva, Switzerland, 2023; p. 36. [Google Scholar]
  20. Xu, H.; Hou, X.; Li, D.; Zheng, X.; Fan, C. Projections of coastal flooding under different RCP scenarios over the 21st century: A case study of China’s coastal zone. Estuar. Coast. Shelf Sci. 2022, 279, 108155. [Google Scholar] [CrossRef]
  21. Hoyos, C.D.; Agudelo, P.A.; Webster, P.J.; Curry, J.A. Deconvolution of the factors contributing to the increase in global hurricane intensity. Science 2006, 312, 94–97. [Google Scholar] [CrossRef]
  22. Gao, Y.; Wang, H.; Liu, G.M.; Sun, X.Y.; Fei, X.Y.; Wang, P.T.; Lv, T.T.; Xue, Z.S.; He, Y.W. Risk assessment of tropical storm surges for coastal regions of China. J. Geophys. Res. Atmos. 2014, 119, 5364–5374. [Google Scholar] [CrossRef]
  23. Feng, S.; Wu, Q.; Shen, L.; Wang, H.; Wen, J. Population Expousure in the High Seismic Hazard AREA of Low-elevation Coastal Zone in China from 1990 to 2015. Technol. Earthq. Disaster Prev. 2022, 17, 719–726. [Google Scholar]
  24. Liang, Y.; Wen, J.; Du, S.; Xu, H.; Yan, J. Spatial—Temporal distribution modeling of population and its applications in disaster and risk management. J. Catastrophology 2015, 30, 220–228. [Google Scholar]
  25. Yang, X.; Yao, C.; Chen, Q.; Ye, T.; Jin, C. Improved estimates of population exposure in low-elevation coastal zones of China. Int. J. Environ. Res. Public Health 2019, 16, 4012. [Google Scholar] [CrossRef]
  26. IPCC. Climate Change 2014 Impacts, Adaptation, and Vulnerability Part A: Global and Sectoral Aspects. In Contribution of Working Group II to the Fifth Assessment Report of the Intergovernmental Panel on Climate Change; Cambridge University: Cambridge, UK; New York, NY, USA, 2014. [Google Scholar]
  27. Hoque, M.A.; Phinn, S.; Roelfsema, C.; Childs, I. Assessing tropical cyclone risks using geospatial techniques. Appl. Geogr. 2018, 98, 22–33. [Google Scholar] [CrossRef]
  28. Novelo-Casanova, D.A.; Suarez, G. Exposure of main critical facilities to natural and man-made hazards in Grand Cayman, Cayman Islands. Nat. Hazards 2012, 61, 1277–1292. [Google Scholar] [CrossRef]
  29. Ehrlich, D.; Melchiorri, M.; Florczyk, A.J.; Pesaresi, M.; Kemper, T.; Corbane, C.; Freire, S.; Schiavina, M.; Siragusa, A. Remote sensing derived built-up area and population density to quantify global exposure to five natural hazards over time. Remote Sens. 2018, 10, 1378. [Google Scholar] [CrossRef]
  30. Chen, Y.; Xie, W.; Xu, X. Changes of population, built-up land, and cropland exposure to natural hazards in China from 1995 to 2015. Int. J. Disaster Risk Sci. 2019, 10, 557–572. [Google Scholar] [CrossRef]
  31. Rahmati, O.; Yousefi, S.; Kalantari, Z.; Uuemaa, E.; Teimurian, T.; Keesstra, S.; Pham, T.D.; Tien Bui, D. Multi-hazard exposure mapping using machine learning techniques: A case study from Iran. Remote Sens. 2019, 11, 1943. [Google Scholar] [CrossRef]
  32. Liu, J.; Wen, J.; Yang, K.; Shang, Z.; Zhang, H. GIS-Based analysis of flood disaster risk in LECZ of China and population exposure. In Proceedings of the 2011 19th International Conference on Geoinformatics, Shanghai, China, 24–26 June 2011; pp. 1–4. [Google Scholar]
  33. Neumann, B.; Vafeidis, A.T.; Zimmermann, J.; Nicholls, R.J. Future coastal population growth and exposure to sea-level rise and coastal flooding-a global assessment. PLoS ONE 2015, 10, e118571. [Google Scholar] [CrossRef]
  34. Yuan, S.; Zhao, X.; Li, L. Combination evaluation and case analysis of vulnerability of storm surge in coastal provinces of China. Haiyang Xuebao 2016, 38, 16–24. [Google Scholar]
  35. He, C.; Huang, Q.; Dou, Y.; Tu, W.; Liu, J. The population in China’s earthquake-prone areas has increased by over 32 million along with rapid urbanization. Environ. Res. Lett. 2016, 11, 074028. [Google Scholar] [CrossRef]
  36. Dou, Y.; Huang, Q.; He, C.; Meng, S.; Zhang, Q. Rapid population growth throughout Asia’s earthquake-prone areas: A multiscale analysis. Int. J. Environ. Res. Public Health 2018, 15, 1893. [Google Scholar] [CrossRef]
  37. Freire, S.; Aubrecht, C. Integrating population dynamics into mapping human exposure to seismic hazard. Nat. Hazards Earth Syst. Sci. 2012, 12, 3533–3543. [Google Scholar] [CrossRef]
  38. He, C.; Huang, Q.; Bai, X.; Robinson, D.T.; Shi, P.; Dou, Y.; Zhao, B.; Yan, J.; Zhang, Q.; Xu, F. A global analysis of the relationship between urbanization and fatalities in earthquake-prone areas. Int. J. Disaster Risk Sci. 2021, 12, 805–820. [Google Scholar] [CrossRef]
  39. Yuan, S. Analysis of Spatial and Temporal Population Changes and Disaster Exposure in the Coastal Lowlands of the Yangtze River Delta, 1990–2015; Shanghai Normal University: Shanghai, China, 2019. [Google Scholar]
  40. Liu, J. Spatial and Temporal Population Distribution and Hazard Exposure Assessment in Low-Elevation Coastal Zones of China; Shanghai Normal University: Shanghai, China, 2010. [Google Scholar]
  41. Zhang, H. Vulnerability Assessment of Coastal Cities to Natural Hazards in the Context of Sea Level Rise; Shanghai Normal University: Shanghai, China, 2011. [Google Scholar]
  42. Fitton, J.M.; Lehmann, M.; Major, D.C. Identifying coastal towns and small cities in Denmark using global population data to support climate change adaptation. Int. J. Digit. Earth 2020, 13, 1040–1054. [Google Scholar] [CrossRef]
  43. Kulp, S.A.; Strauss, B.H. CoastalDEM: A global coastal digital elevation model improved from SRTM using a neural network. Remote Sens. Environ. 2018, 206, 231–239. [Google Scholar] [CrossRef]
  44. Stevens, F.R.; Gaughan, A.E.; Linard, C.; Tatem, A.J. Disaggregating census data for population mapping using random forests with remotely-sensed and ancillary data. PLoS ONE 2015, 10, e107042. [Google Scholar] [CrossRef]
  45. GB 18306—2015; Seismic ground motion parameters zonation map of China. China Standards Press: Beijing, China, 2016. (In Chinese)
  46. Rudari, R.; Silvestro, F.; Campo, L.; Rebora, N.; Boni, G.; Herold, C. Improvement of the Global Flood Model for the GAR 2015; United Nations Office for Disaster Risk Reduction (UNISDR), Centro Internazionale in Monitoraggio Ambientale (CIMA), UNEP GRID-Arendal (GRID-Arendal): Geneva, Switzerland, 2015; p. 69. [Google Scholar]
  47. Muis, S.; Verlaan, M.; Nicholls, R.J.; Brown, S.; Hinkel, J.; Lincke, D.; Vafeidis, A.T.; Scussolini, P.; Winsemius, H.C.; Ward, P.J. A comparison of two global datasets of extreme sea levels and resulting flood exposure. Earths Future 2017, 5, 379–392. [Google Scholar] [CrossRef]
  48. Gao, C.; Wang, L.; Chen, C.; Luo, G.; Sun, Y. Population and economic risk exposure in coastal region of China under sea level rise. Acta Geogr. Sin. 2019, 74, 1590–1604. [Google Scholar]
  49. Marin-Ferrer, M.; Luca, V.; Karmen, P. INFORM Index for Risk Management: Concept and Methodology, Version 2017; EUR 28655 EN; Publications Office of the European Union: Luxembourg, 2017. [Google Scholar] [CrossRef]
  50. Taylor, H.T.; Ward, B.; Willis, M.; Zaleski, W. The Saffir-Simpson Hurricane Wind Scale; Atmospheric Administration: Washington, DC, USA, 2010.
  51. Li, W.; Yi, P.; Li, L. Outliers Recognition and the Dimensionless Method in Comprehensive Evaluation. Oper. Res. Manag. Sci. 2018, 27, 173–178. [Google Scholar]
  52. Saisana, M. 13th JRC Annual Training on Composite Indicators & Scoreboards; Joint Research Centre: Ispra, Italy, 2015. [Google Scholar]
  53. Anselin, L.; Syabri, I.; Kho, Y. GeoDa: An Introduction to Spatial Data Analysis. In Handbook of Applied Spatial Analysis: Software Tools, Methods and Applications; Springer: Berlin/Heidelberg, Germany, 2009; pp. 73–89. [Google Scholar]
  54. Mao, Q.; Long, Y.; Wu, K. Spatio-temporal changes of population density and exploration on urbanization pattern in China: 2000–2010. Plan. Stud. 2015, 39, 38–43. [Google Scholar]
  55. Abdi, H.; Williams, L.J. Principal component analysis. Wiley Interdiscip. Rev. Comput. Stat. 2010, 2, 433–459. [Google Scholar] [CrossRef]
  56. He, X.; Zhang, J.; Zhang, T.; Zhong, P.; Wang, W. Study on the sea level rising in the China coast and its adaptation strategy. Mar. Forecast. 2012, 29, 84–91. [Google Scholar]
  57. Kötter, T. Prevention of Environmental Disasters by Spatial Planning and Land Management. In Proceedings of the 2nd FIG Regional Conference, Marrakesh, Morocco, 13–17 April 2003; Volume 2003, pp. 2–5. [Google Scholar]
  58. Saravanan, D. Structural and nonstructural mitigation measures in coastal area threats. Int. J. Ocean. Oceanogr. 2016, 10, 141–148. [Google Scholar]
  59. Wang, J.; Lei, Y.; Zhou, H.; Yin, Y.; Chang, S.; Li, Q. Regional Features and Adaptation Countermeasures of Typhoon Disaster Chains in Southeast Coastal Regions of China. J. Beijing Norm. Univ. (Soc. Sci.) 2012, 2, 130–138. [Google Scholar]
  60. Buchori, I.; Pramitasari, A.; Sugiri, A.; Maryono, M.; Basuki, Y.; Sejati, A.W. Adaptation to coastal flooding and inundation: Mitigations and migration pattern in Semarang City, Indonesia. Ocean Coast Manag. 2018, 163, 445–455. [Google Scholar] [CrossRef]
  61. Fuchs, R.J. Cities at Risk: Asia’s Coastal Cities in an Age of Climate Change. Available online: http://hdl.handle.net/10125/17646 (accessed on 20 May 2023).
  62. Nawrotzki, R.J.; DeWaard, J. Putting trapped populations into place: Climate change and inter-district migration flows in Zambia. Reg. Env. Change 2018, 18, 533–546. [Google Scholar] [CrossRef]
Figure 1. Map of the study area.
Sustainability 15 12813 g001
Figure 2. Research Framework.
Sustainability 15 12813 g002
Figure 3. The ratio of the area of each hazard to the total area of the LECZ (a); percentage of the area of different hazards in each region about its total area of hazards (b).
Sustainability 15 12813 g003
Figure 4. Spatial distribution of each hazard in LECZ. High seismic hazard area (a); flood hazard area (b); storm surge inundation area (c); TC intensity (d).
Sustainability 15 12813 g004
Figure 5. Multi-hazard population exposure in three coastal lowland sub-regions from 1990–2020. Population exposure to earthquake (a); population exposure to flood (b); population exposure to storm surge (c); population exposure to TCs (d).
Sustainability 15 12813 g005
Figure 6. Number of districts and counties with multi-hazard exposure index at different levels in 2020.
Sustainability 15 12813 g006
Figure 7. Spatial distribution of comprehensive exposure index of multi-hazards in the LECZ in 2020. Spatial distribution of multi-hazard exposure index levels (a); LISA clustering pattern of population exposure index (b).
Sustainability 15 12813 g007
Figure 8. Distribution of changes in exposure index in the LECZ from 1990 to 2020.
Sustainability 15 12813 g008
Table 1. LECZ regions.
LECZ RegionsProvincial Administration
NorthernLiaoning, Hebei, Tianjin, Shandong
CentralJiangsu Province, Shanghai, Zhejiang
SouthernFujian, Guangdong, Guangxi, Hainan
Table 2. Correspondence between seismic intensity and peak ground acceleration.
Seismic IntensityVII LevelVIII Level
Peak ground acceleration0.1 g0.15 g0.2 g0.3 g
Table 3. The multi-hazard population exposure index rating.
LevelMaxMin
Very high106.9
High 6.94.7
Medium4.62.8
Low2.71.3
Very low1.20
Table 4. The variance and cumulative variance coefficient of each component.
ComponentContribution RateCumulative Contribution Rate
163.47%63.47%
218.35%81.83%
312.00%93.83%
Table 5. The component coefficient of each hazard.
HazardComponent Coefficient
123
Earthquake0.30.31−0.88
Flood0.610.660.44
Storm surge0.62−0.49−0.09
TC0.39−0.480.13
Disclaimer/Publisher’s Note: The statements, opinions and data contained in all publications are solely those of the individual author(s) and contributor(s) and not of MDPI and/or the editor(s). MDPI and/or the editor(s) disclaim responsibility for any injury to people or property resulting from any ideas, methods, instructions or products referred to in the content.

