
Impact of Green Finance on Carbon Emissions Based on a Two-Stage LMDI Decomposition Method


Abstract
:1. Introduction
2. Theoretical Analysis and Research Hypotheses
2.1. The Theoretical Analysis
2.2. Literature Review and Research Hypotheses
3. Research Methods and Variable Selection
3.1. Two-Stage LMDI Method
3.2. Spatial Measurement
3.3. Variable Selection
3.3.1. Explained Variables
3.3.2. Explanatory Variables
3.3.3. Control Variables
3.4. Model Setting
4. Empirical Analysis
4.1. Data Sources
4.2. Factor Analysis
- (1)
- Contribution analysis of energy structure
- (2)
- Contribution share analysis of economic development
- (3)
- Contribution share analysis of energy efficiency
- (4)
- Contribution share analysis of industrial structure
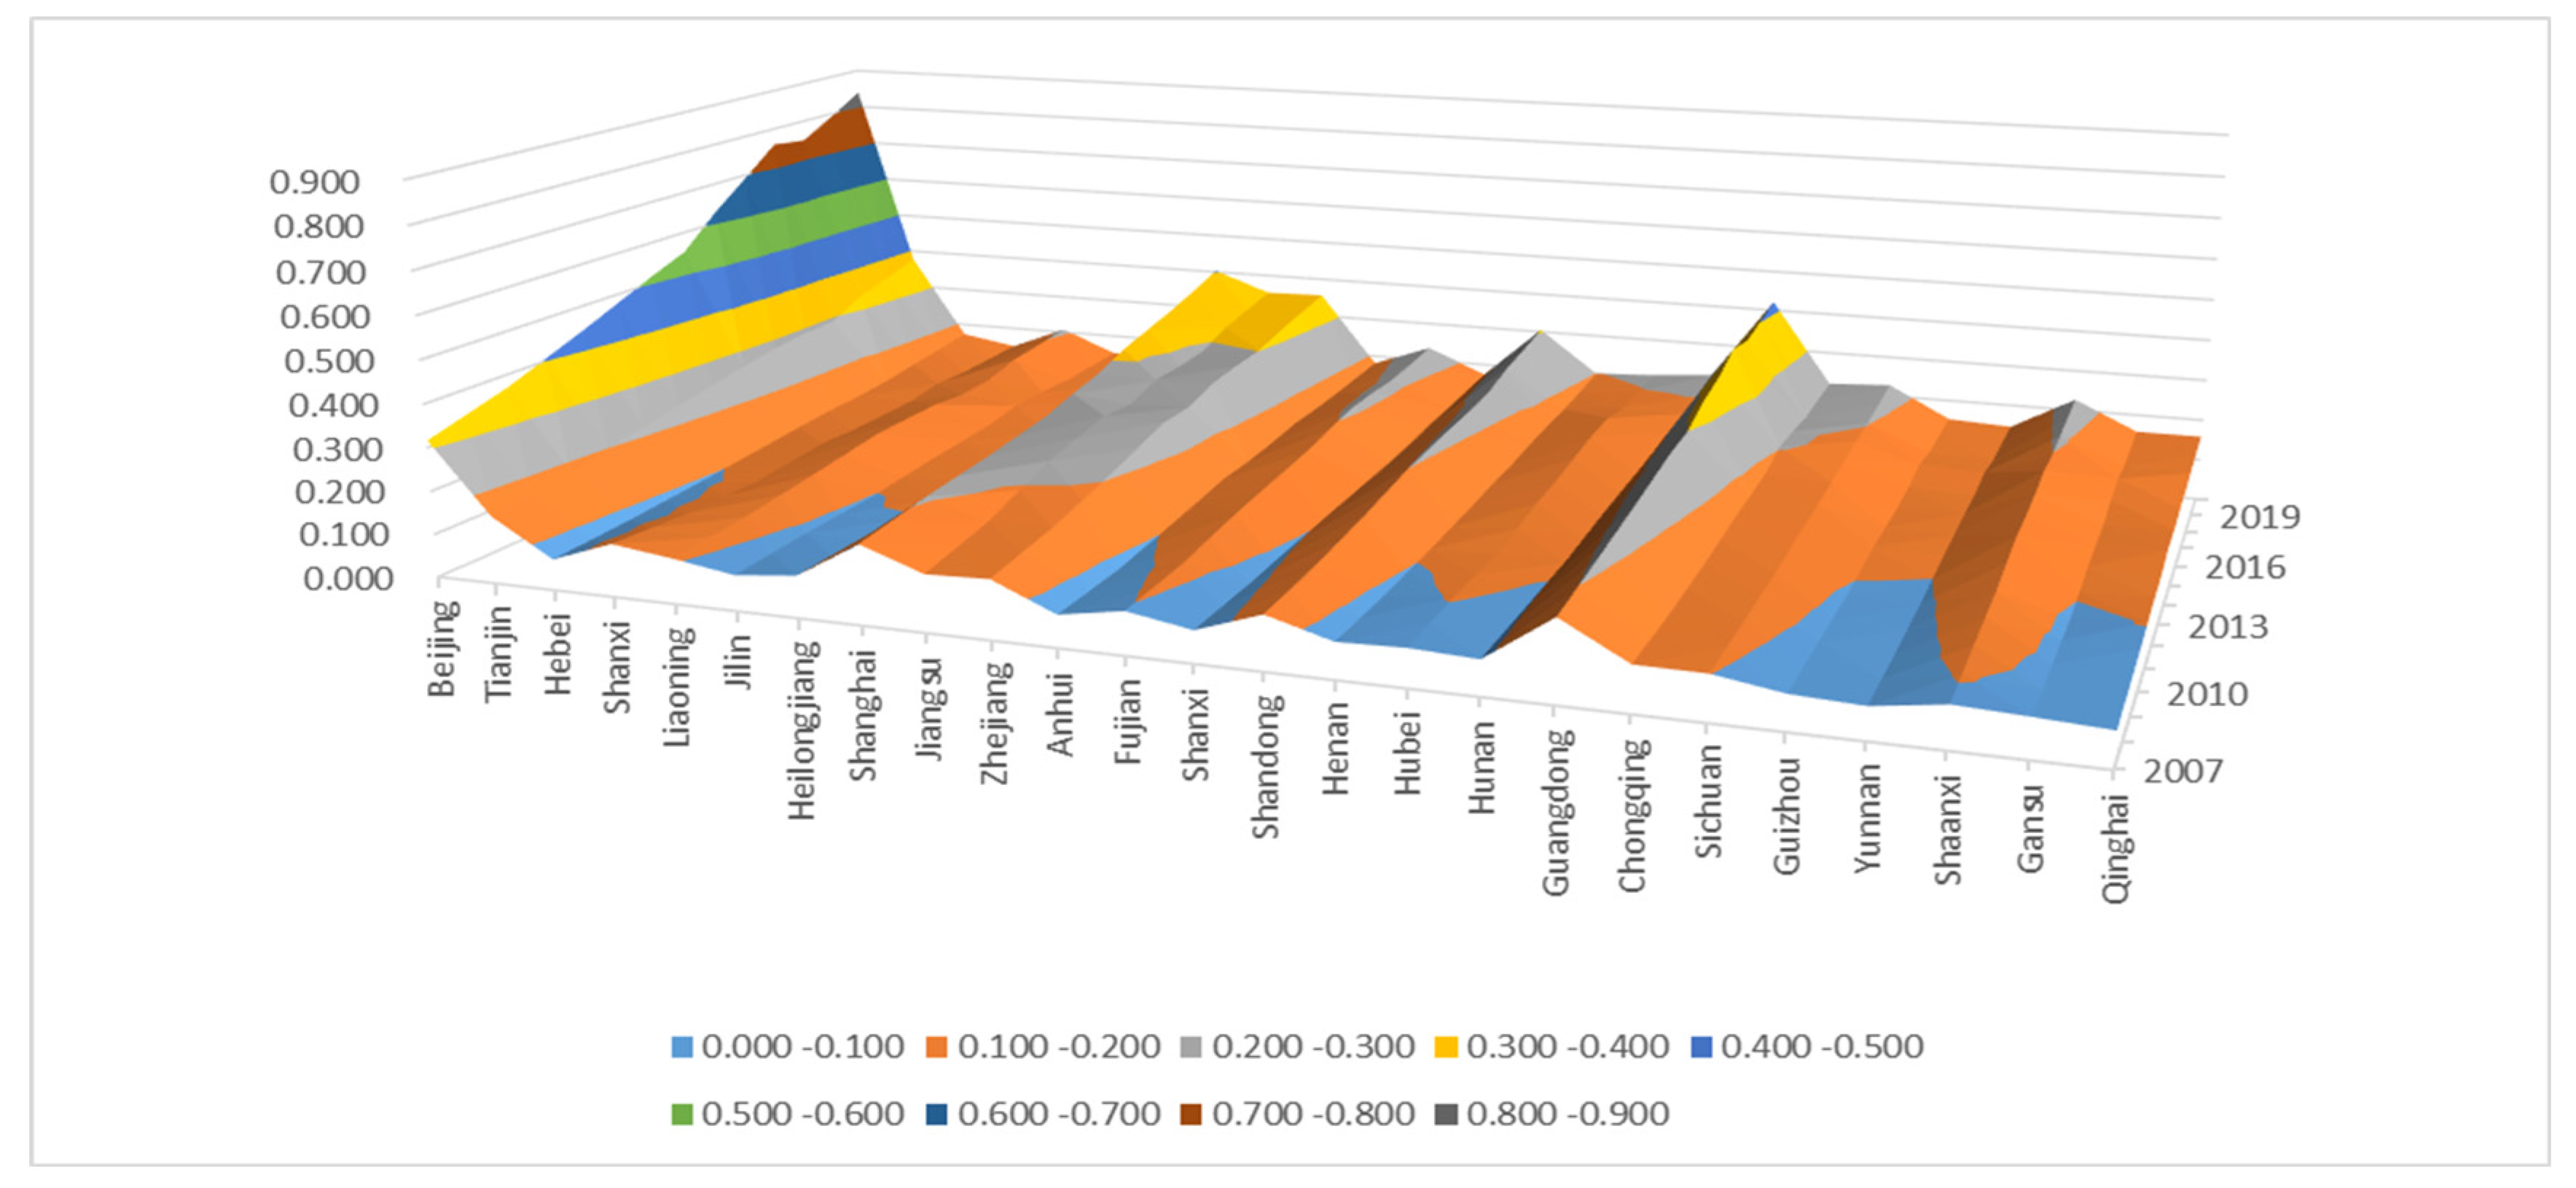
4.3. Results of the Green Finance Development Index
4.4. Empirical Results of Green Finance on Carbon Emissions
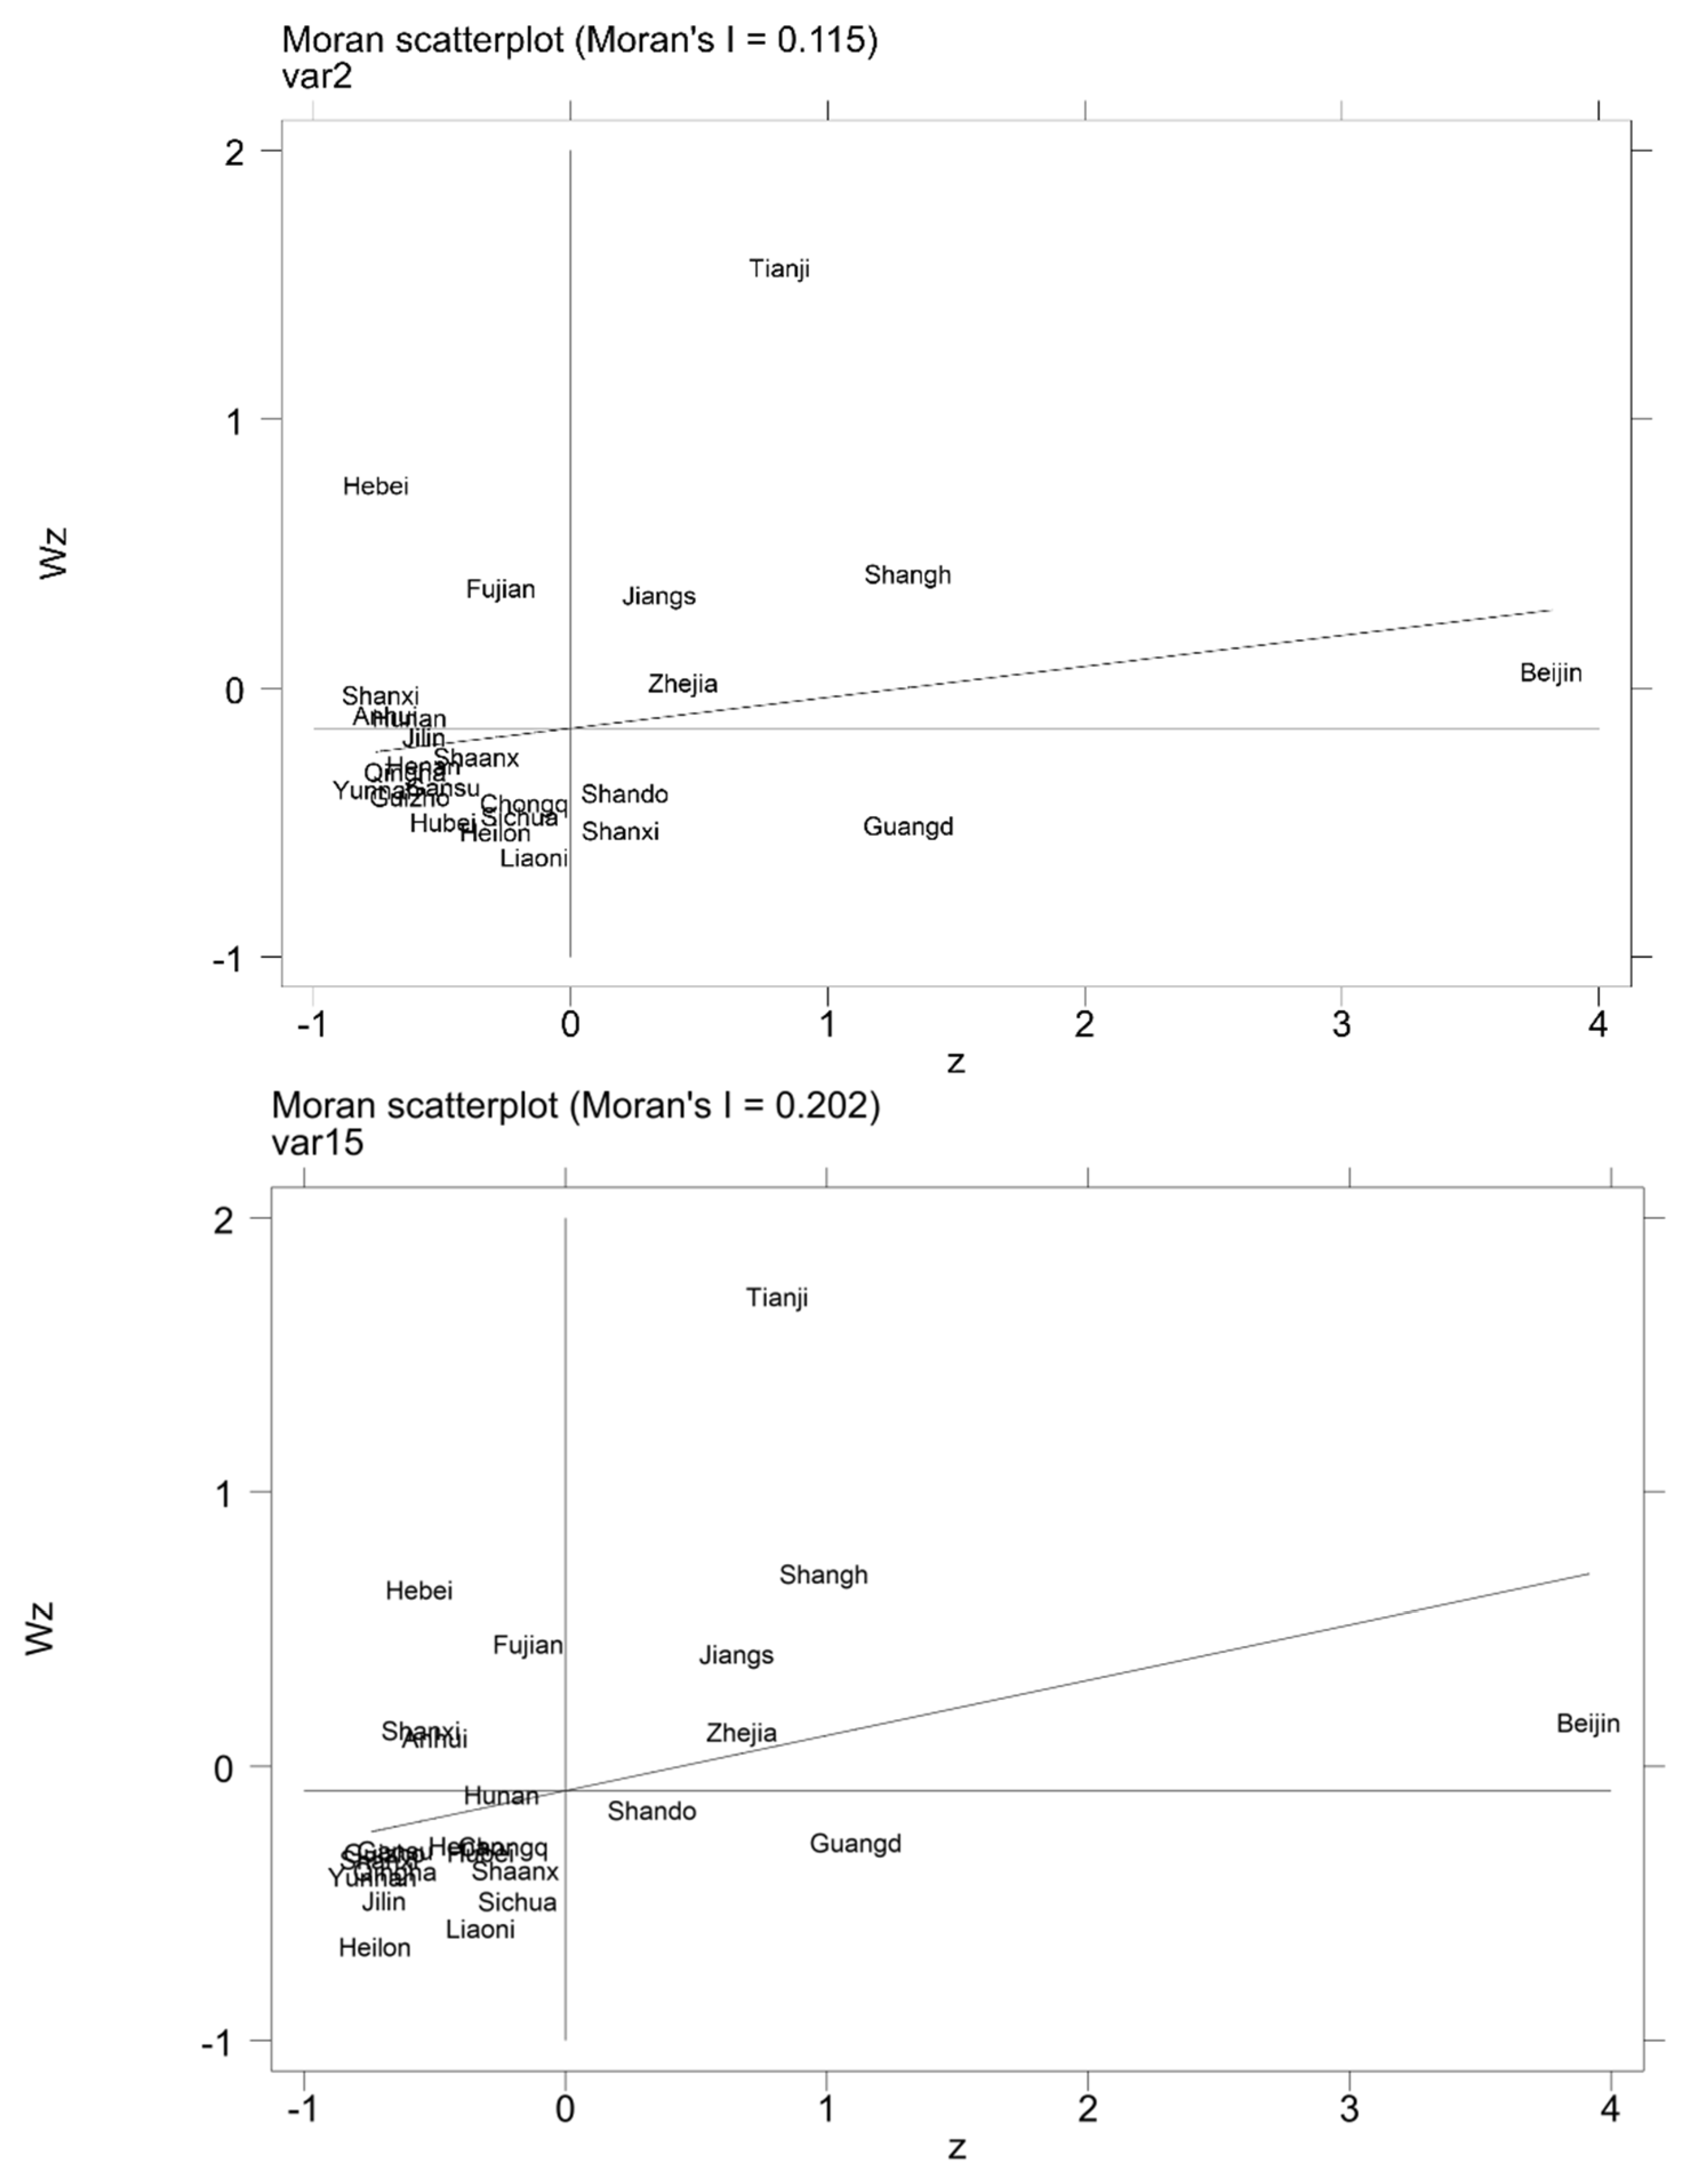
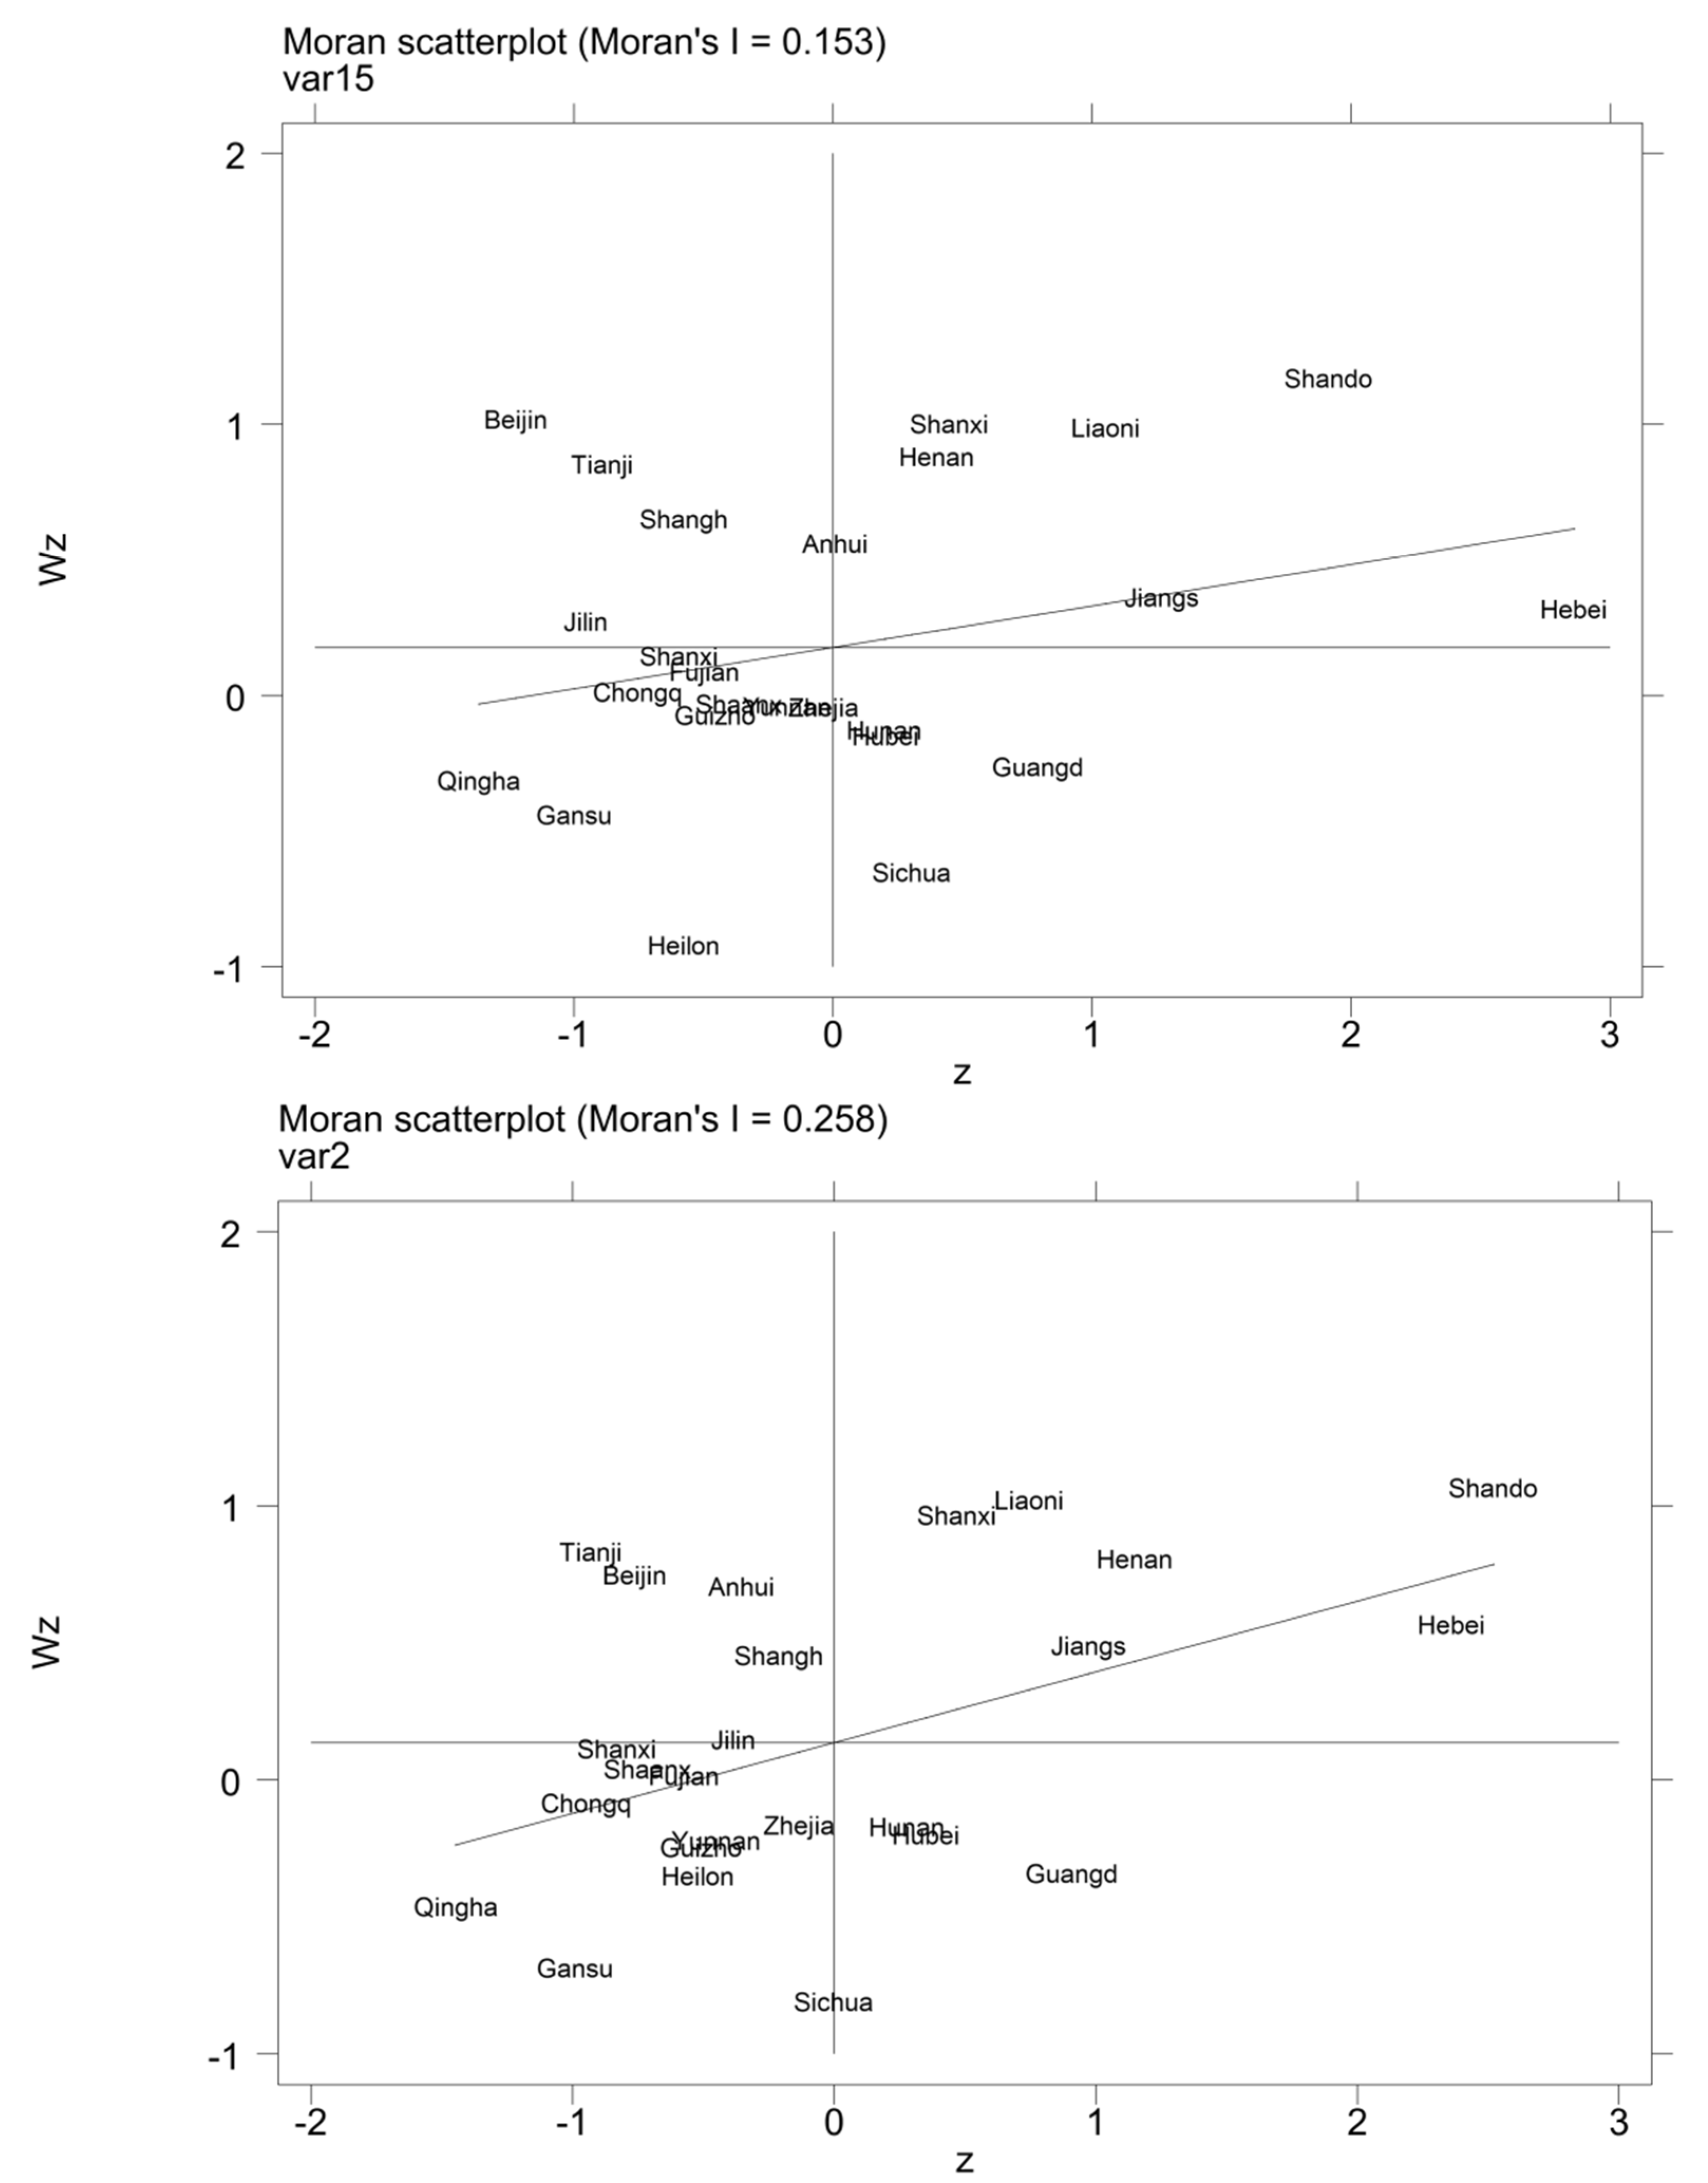
4.4.1. Spatial Autocorrelation Test
4.4.2. Regression Results of Green Finance on Carbon Emissions
4.4.3. Spatial Econometric Regression Results Based on Two-Stage LMDI
4.4.4. Spillover Effect Analysis Based on Two-Stage LMDI
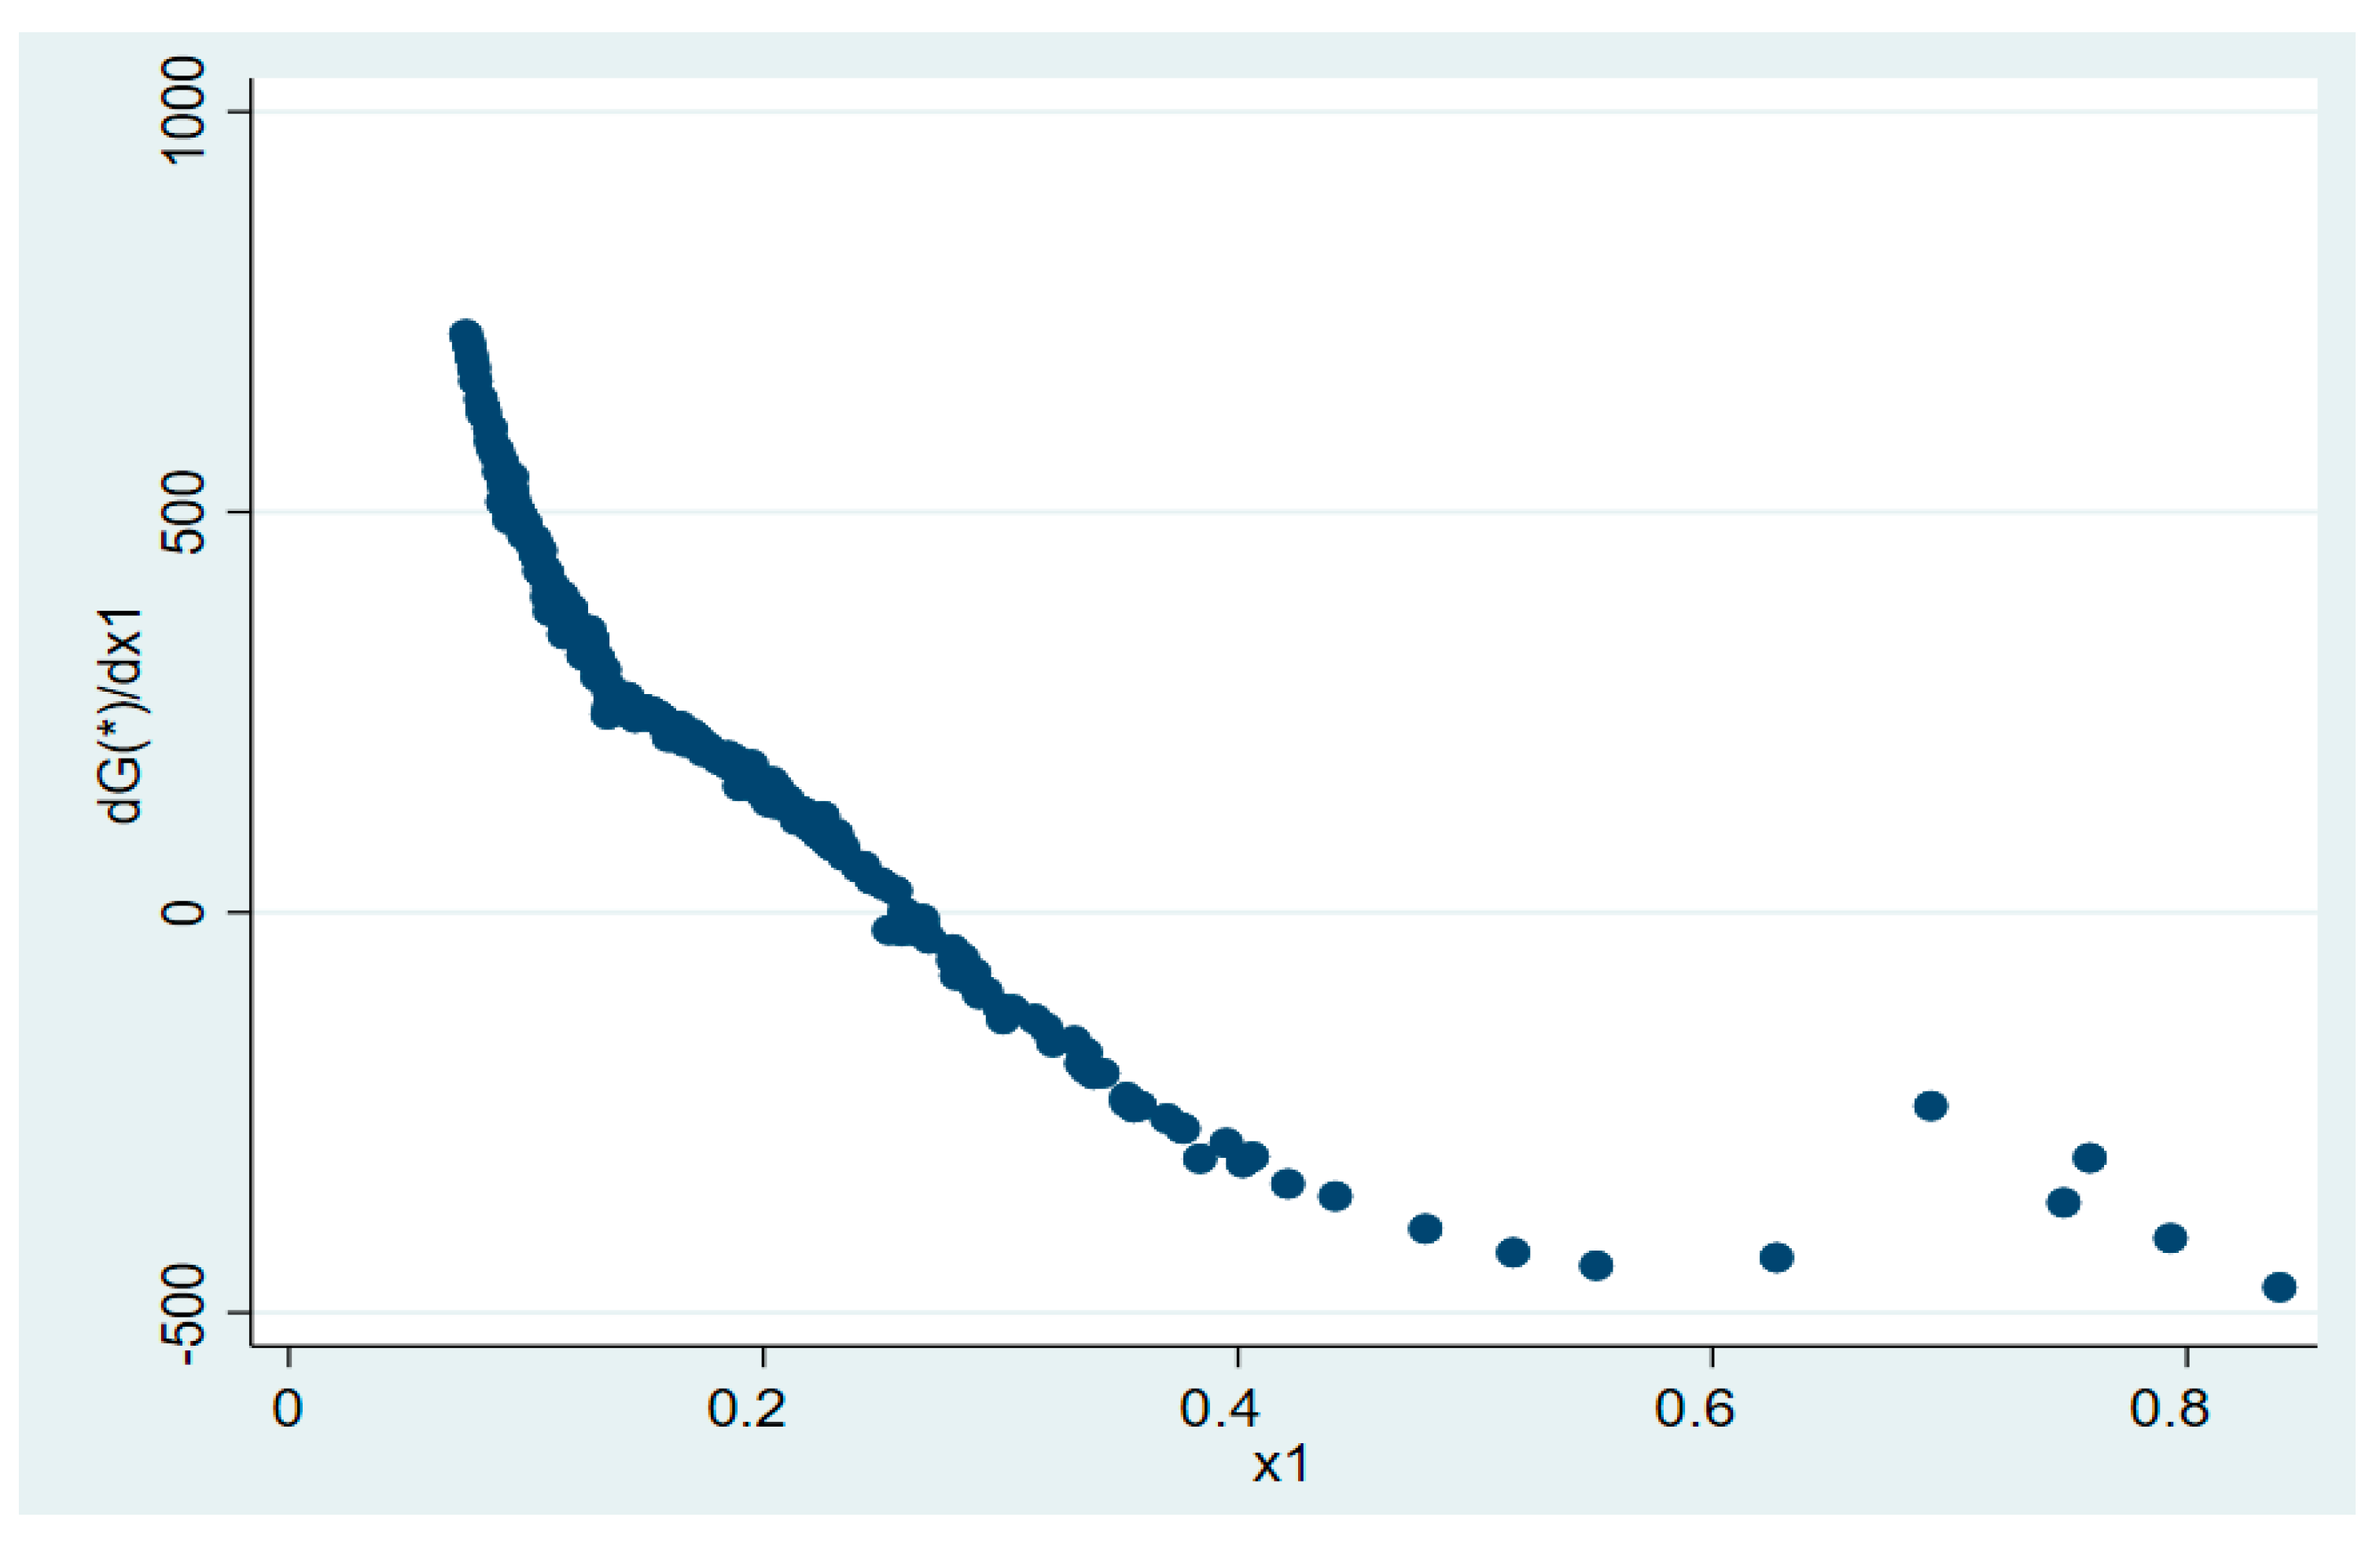
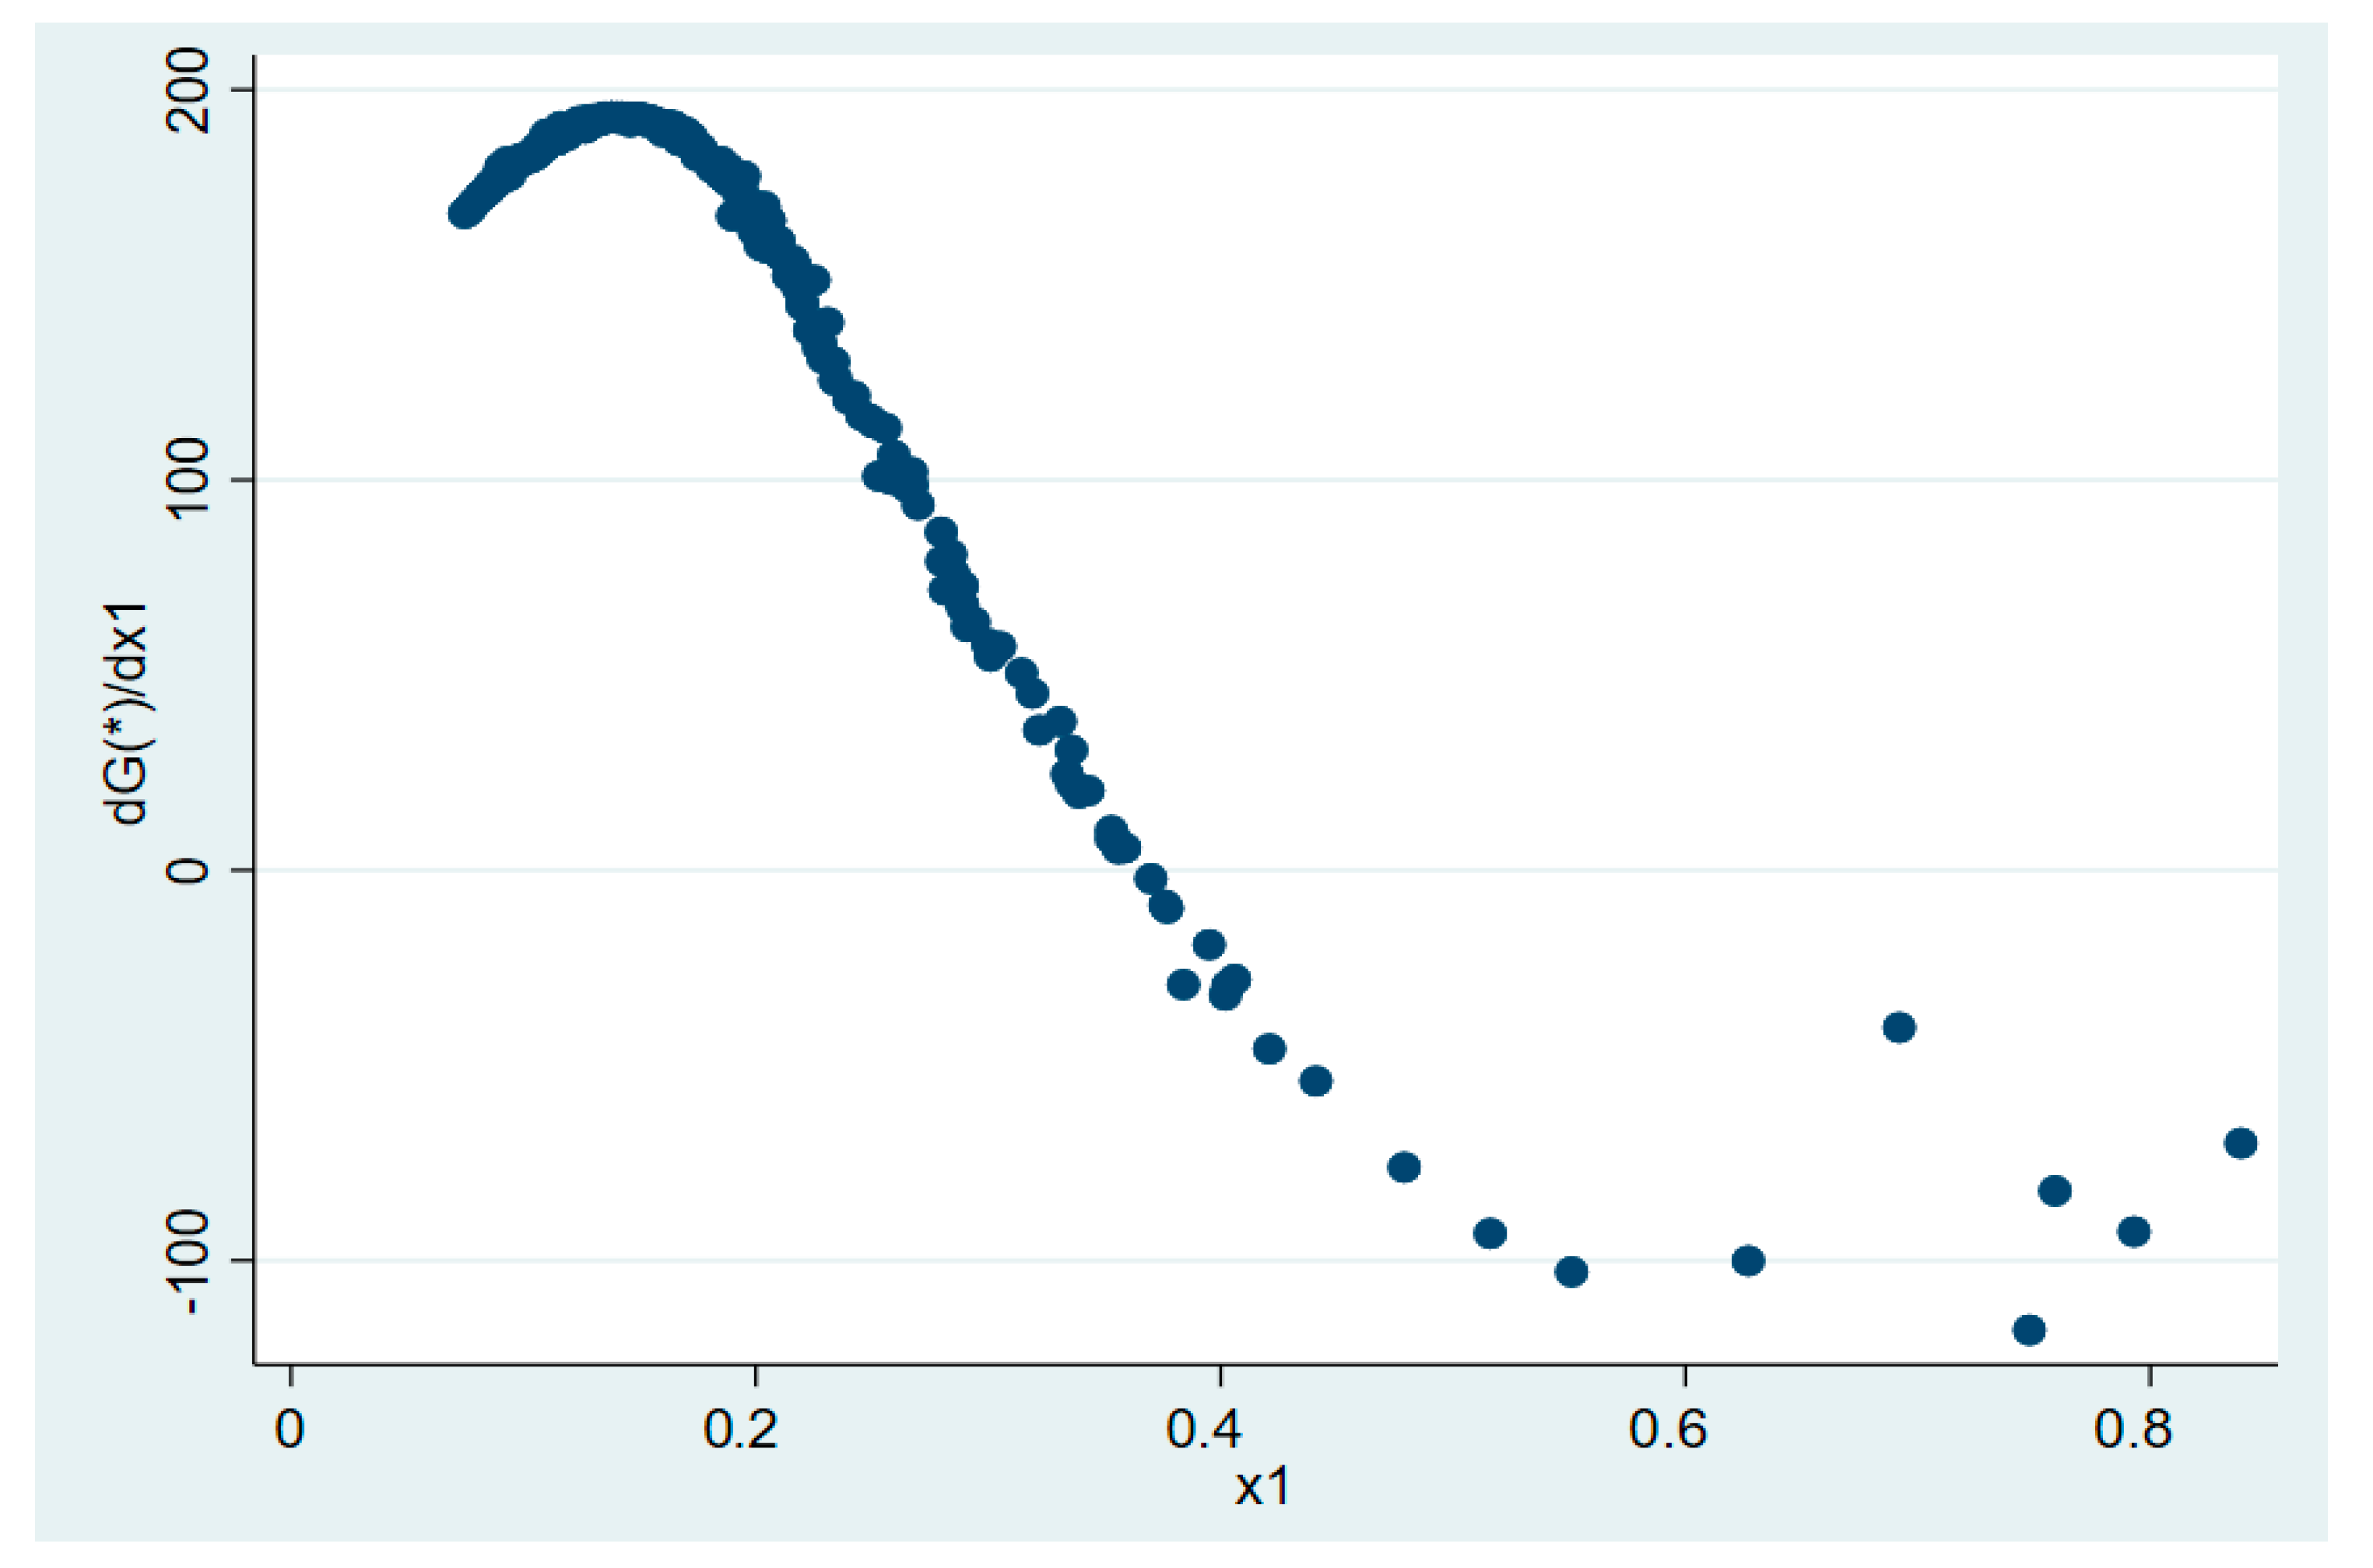
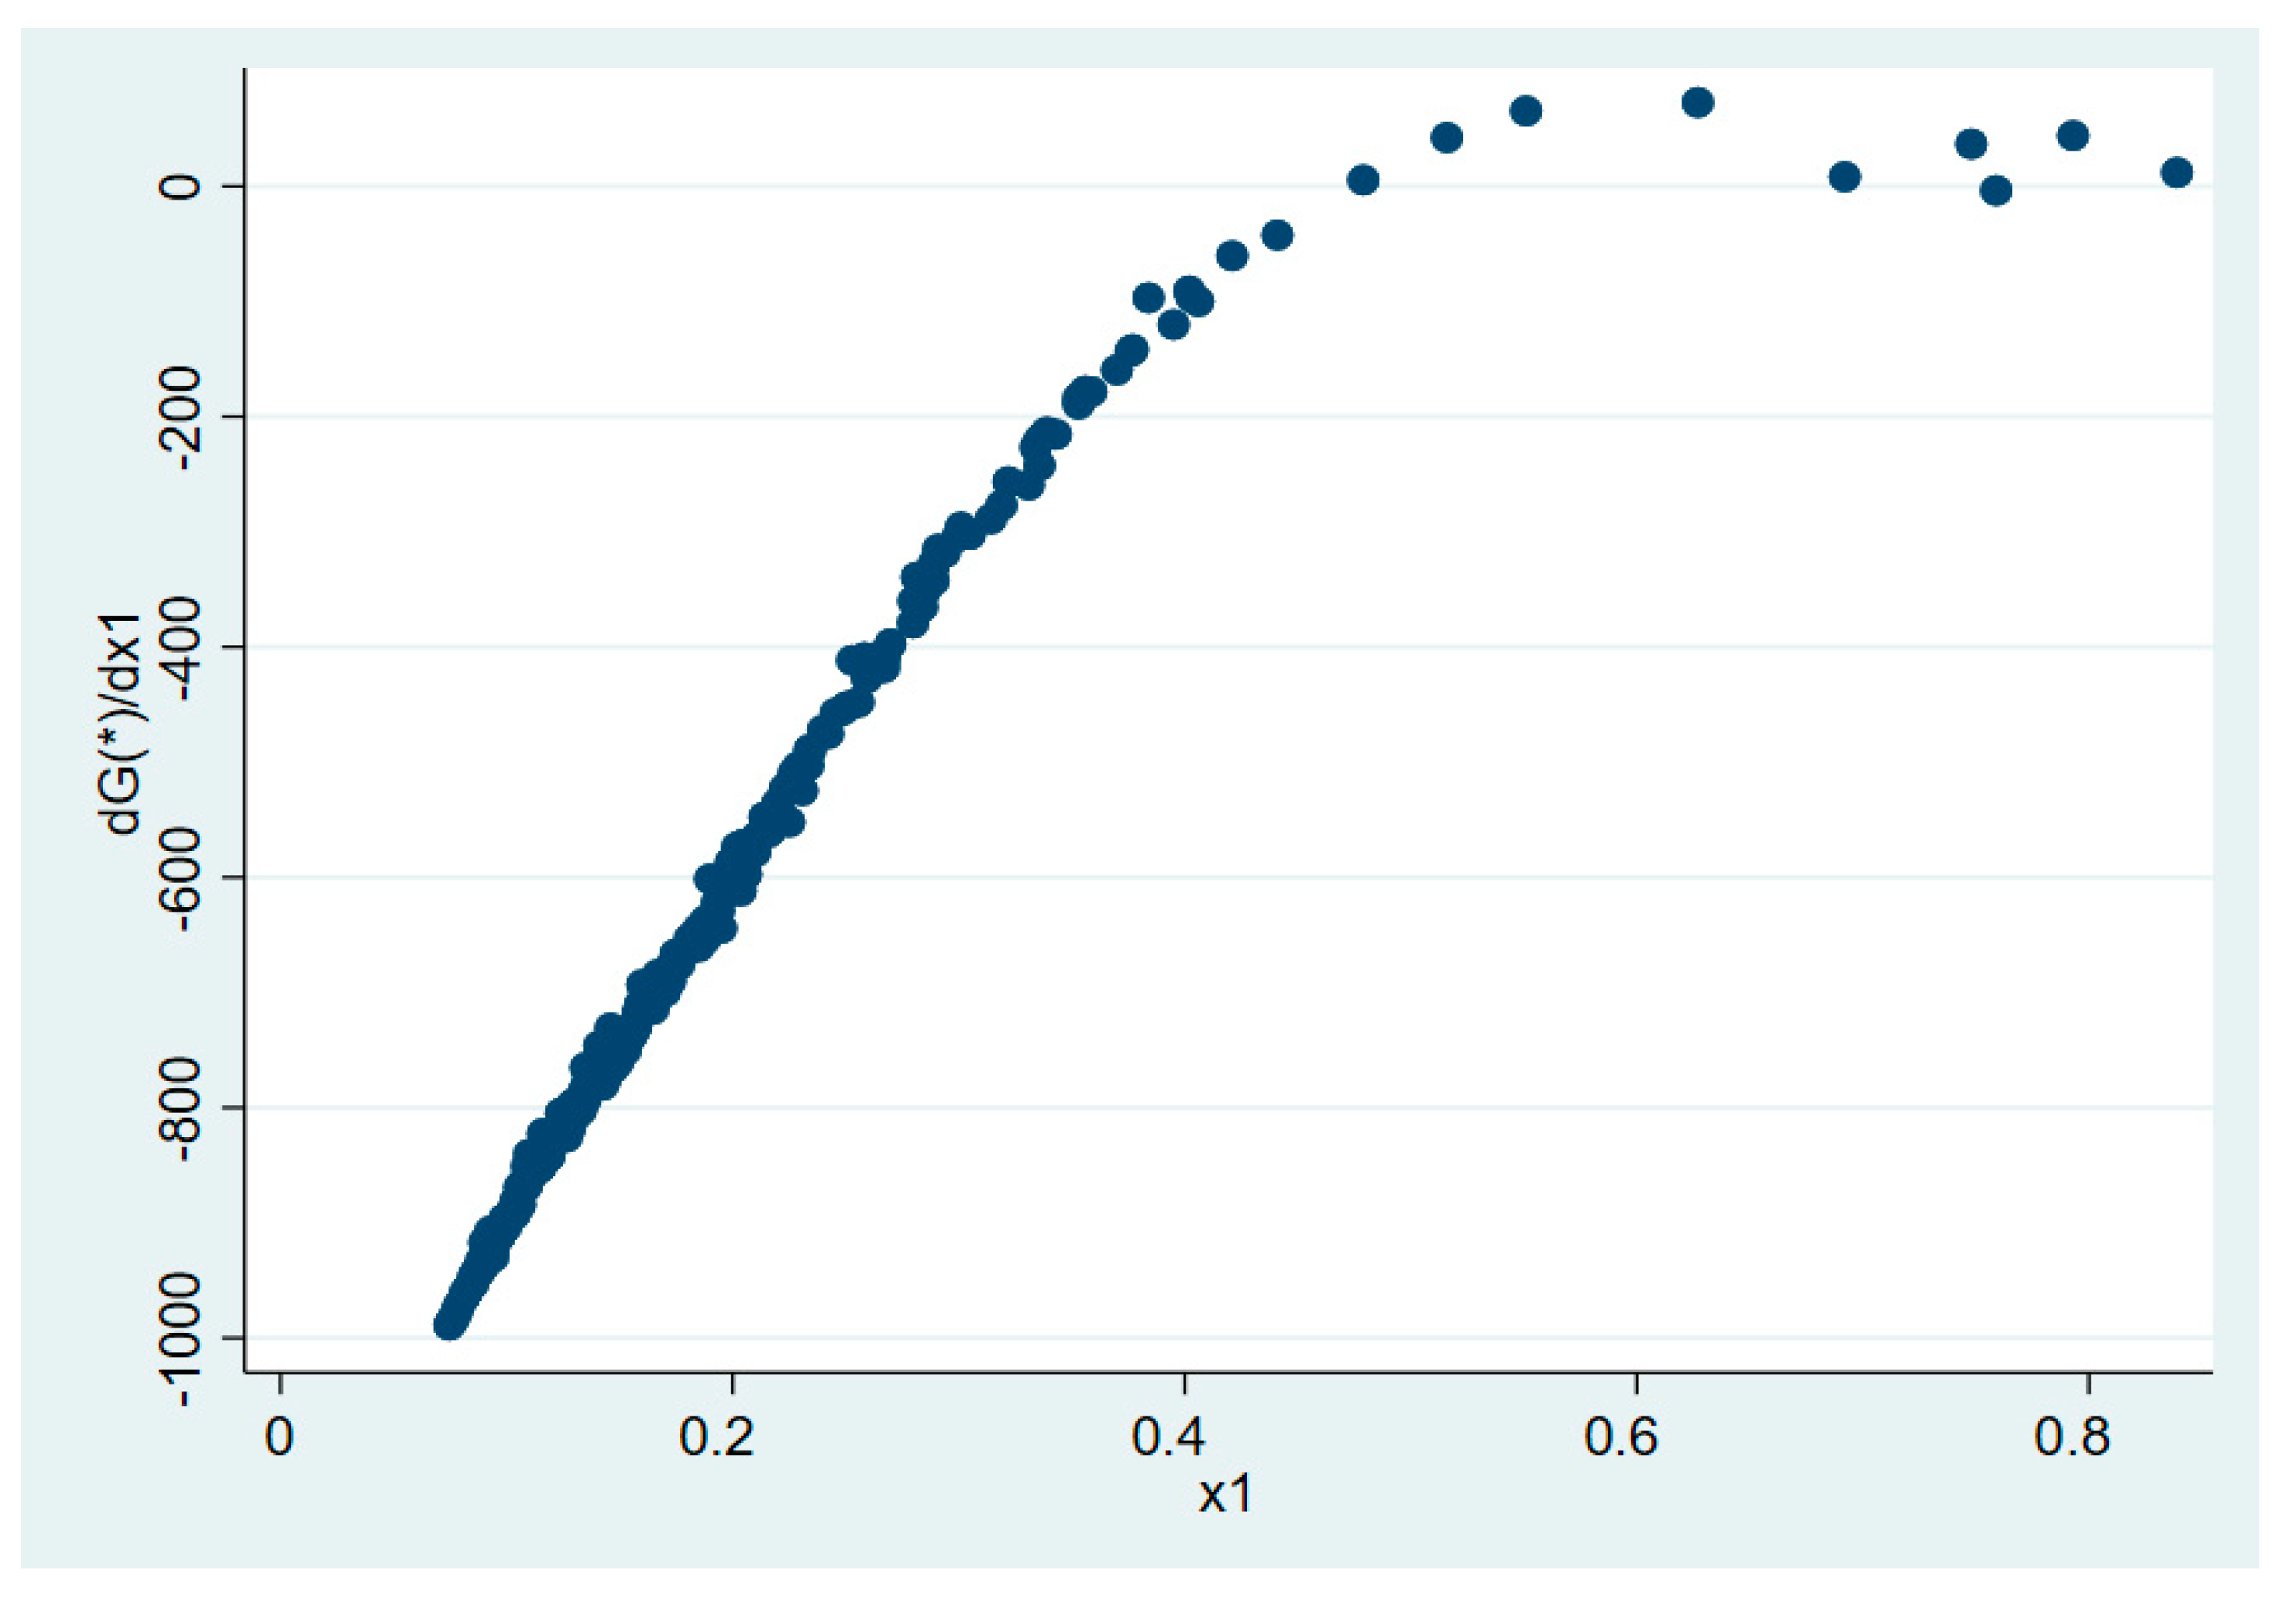
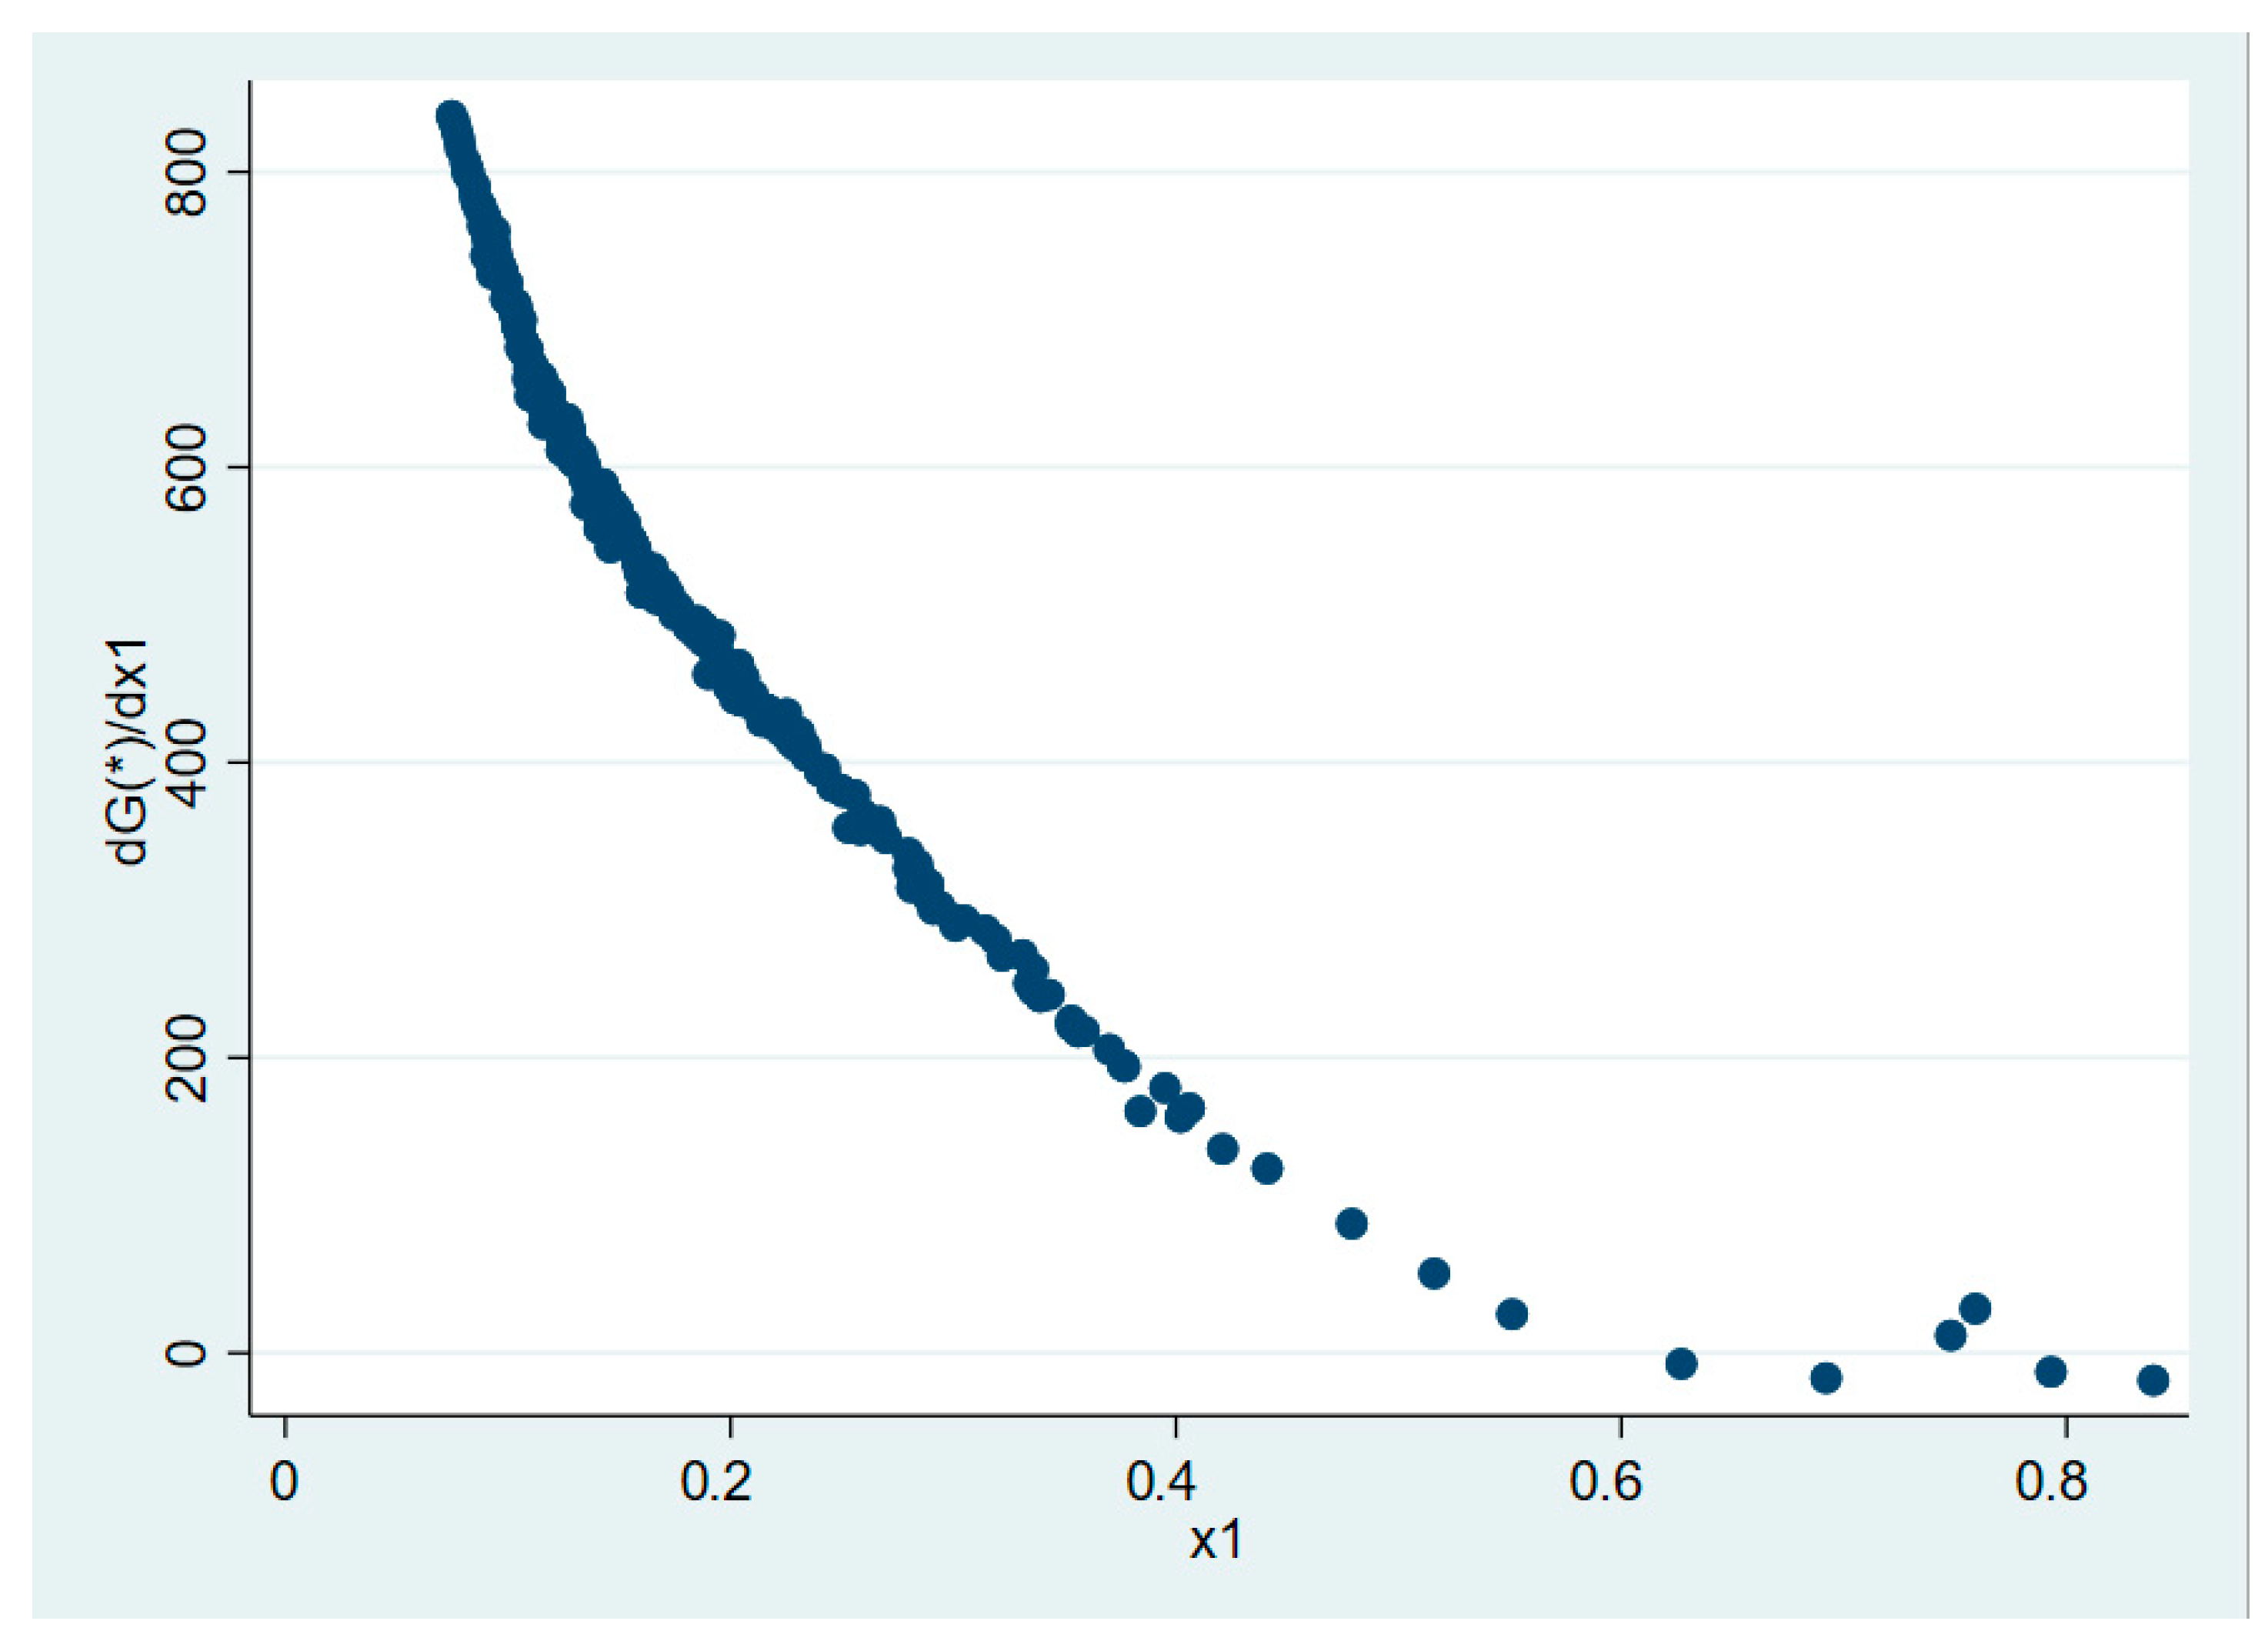
4.4.5. Analysis of Non-Linear Effects of Green Finance Development on Energy Consumption
4.5. Robustness Test
5. Conclusions and Recommendations
Author Contributions
Funding
Institutional Review Board Statement
Informed Consent Statement
Data Availability Statement
Acknowledgments
Conflicts of Interest
References
- Zhao, W. China’s goal of achieving carbon neutrality before 2060: Experts explain how. Natl. Sci. Rev. 2022, 8, nwac115. [Google Scholar] [CrossRef]
- Li, X.; Yang, Y. Does Green Finance Contribute to Corporate Technological Innovation? The Moderating Role of Corporate Social Responsibility. Sustainability 2022, 14, 5648. [Google Scholar] [CrossRef]
- Chu, Z.; Cheng, M.; Yu, N.N. A smart city is a less polluted city. Technol. Forecast. Soc. Change 2021, 172, 121037. [Google Scholar] [CrossRef]
- Cowan, E. Topical Issues in Environment Finance. Research Paper Was Commissioned by the Asia Branch of the Canadian International Development Agency (CIDA). 1999. Available online: https://citeseerx.ist.psu.edu/document?repid=rep1&type=pdf&doi=659de0ffb8f54b89ea32f0619160eee1426bfe20 (accessed on 15 May 2003).
- Wang, H.; Jiang, L.; Duan, H.; Wang, Y.; Jiang, Y.; Lin, X. The Impact of Green Finance Development on China’s Energy Structure Optimization. Discret. Dyn. Nat. Soc. 2021, 2021, 2633021. [Google Scholar] [CrossRef]
- Ren, X.; Shao, Q.; Zhong, R. Nexus between green finance, non-fossil energy use, and carbon intensity: Empirical evidence from China based on a vector error correction model. J. Clean. Prod. 2020, 277, 122844. [Google Scholar] [CrossRef]
- Zhou, X.; Tang, X.; Zhang, R. Impact of green finance on economic development and environmental quality: A study based on provincial panel data from China. Environ. Sci. Pollut. Res. 2020, 27, 19915–19932. [Google Scholar] [CrossRef] [PubMed]
- Ning, Y.; Cherian, J.; Sial, M.S.; Álvarez-Otero, S.; Comite, U.; Zia-Ud-Din, M. Green bond as a new determinant of sustainable green financing, energy efficiency investment, and economic growth: A global perspective. Environ. Sci. Pollut. Res. 2022, 30, 61324–61339. [Google Scholar] [CrossRef]
- Peng, J.; Zheng, Y. Does Environmental Policy Promote Energy Efficiency? Evidence From China in the Context of Developing Green Finance. Front. Environ. Sci. 2021, 9, 3349. [Google Scholar] [CrossRef]
- Hu, J.; Zhang, H. Has green finance optimized the industrial structure in China? Environ. Sci. Pollut. Res. 2022, 30, 32926–32941. [Google Scholar] [CrossRef]
- Ge, T.; Cai, X.; Song, X. How does renewable energy technology innovation affect the upgrading of industrial structure? The moderating effect of green finance. Renew. Energy 2022, 197, 1106–1114. [Google Scholar] [CrossRef]
- Li, W.; Lin, X.; Wang, H.; Wang, S. High-quality economic development, green credit and carbon emissions. Front. Environ. Sci. 2022, 10, 992518. [Google Scholar] [CrossRef]
- Chen, X.; Chen, Z. Can Green Finance Development Reduce Carbon Emissions? Empirical Evidence from 30 Chinese Provinces. Sustainability 2021, 13, 12137. [Google Scholar] [CrossRef]
- Sun, C. The correlation between green finance and carbon emissions based on improved neural network. Neural Comput. Appl. 2021, 34, 12399–12413. [Google Scholar] [CrossRef]
- Zhang, W.; Zhu, Z.; Liu, X.; Cheng, J. Can green finance improve carbon emission efficiency? Environ. Sci. Pollut. Res. 2022, 29, 68976–68989. [Google Scholar] [CrossRef] [PubMed]
- Gan, C.; Voda, M. Can green finance reduce carbon emission intensity? Mechanism and threshold effect. Environ. Sci. Pollut. Res. 2022, 30, 640–653. [Google Scholar]
- Guo, L.L.; Zhao, S.; Song, Y.T.; Tang, M.Q.; Li, H.J. Green Finance, Chemical Fertilizer Use and Carbon Emissions from Agricultural Production. Agriculture 2022, 12, 313. [Google Scholar] [CrossRef]
- Xiaoyan, G.; Zhiguo, W. Analysis of coupling mechanism between green finance and new energy industry. Jianghan Forum 2017, 11, 42–47. [Google Scholar]
- Liu, R.; Wang, D.; Zhang, L.; Zhang, L. Can green financial development promote regional ecological efficiency? A case study of China. Nat. Hazards 2019, 95, 325–341. [Google Scholar] [CrossRef]
- Linjing, Y.; Zhigao, L. Green finance, structural adjustment and carbon emission: Based on the moderated mediation effect test. Financ. Econ. 2021, 12, 31–39. [Google Scholar] [CrossRef]
- Sun, H.; Chen, F. The impact of green finance on China’s regional energy consumption structure based on system GMM. Resour. Policy 2022, 76, 102588. [Google Scholar] [CrossRef]
- Wang, X.; Wang, Q. Research on the impact of green finance on the upgrading of China’s regional industrial structure from the perspective of sustainable development. Resour. Policy 2021, 74, 102436. [Google Scholar] [CrossRef]
- Zhu, Y.; Zhang, J.T.; Duan, C.Q. How does green finance affect the low-carbon economy? Capital allocation, green technology innovation and industry structure perspectives. Econ. Res. Ekon. Istraz. 2022, 36, 2110138. [Google Scholar] [CrossRef]
- Ciegis, R.; Streimikiene, D.; Pareigis, R.; Gineitiene, D. Environmental kuznets curves: Economic implications. Environ. Technol. Resour. Proc. Int. Sci. Pr. Conf. 2007, 1, 235–243. [Google Scholar] [CrossRef]
- Shahbaz, M.; Mahalik, M.K.; Shah, S.H.; Sato, J.R. Time-Varying Analysis of CO2 Emissions, Energy Consumption, and Economic Growth Nexus: Statistical Experience in Next 11 Countries. Energy Policy 2016, 98, 33–48. [Google Scholar]
- Zhang, Y.J. The impact of financial development on carbon emissions: An empirical analysis in China. Energy Policy 2011, 39, 2197–2203. [Google Scholar] [CrossRef]
- Rasoulinezhad, E.; Taghizadeh-Hesary, F. Role of green finance in improving energy efficiency and renewable energy development. Energy Effic. 2022, 15, 14. [Google Scholar] [PubMed]
- Fang, Z.; Yang, C.; Song, X.W. How Do Green Finance and Energy Efficiency Mitigate Carbon Emissions without Reducing Economic Growth in G7 Countries? Front. Psychol. 2022, 13, 879741. [Google Scholar]
- Zhang, D.; Awawdeh, A.E.; Hussain, M.S.; Ngo, Q.-T.; Hieu, V.M. Assessing the nexus mechanism between energy efficiency and green finance. Energy Effic. 2021, 14, 85. [Google Scholar]
- Liang, Y. The Study of Pattern and Measures on Green Finance Promoting Low-carbon Economical Development. Manag. Eng. 2014, 16, 85–89. [Google Scholar]
- Huang, S.Z. Do green financing and industrial structure matter for green economic recovery? Fresh empirical insights from Vietnam. Econ. Oper. Anal. Policy 2022, 75, 61–73. [Google Scholar] [CrossRef]
- Gao, L.; Tian, Q.; Meng, F. The impact of green finance on industrial reasonability in China: Empirical research based on the spatial panel Durbin model. Environ. Sci. Pollut. Res. 2022, 36, 61394–61410. [Google Scholar] [CrossRef] [PubMed]
- Liu, C.Z.; Ren, Y. Research on the impact of green credit on the low-carbon energy consumption structure. Wuhan Financ. 2019, 11, 66–70. [Google Scholar]
- Liu, Z.; Xu, J.; Wei, Y.; Hatab, A.A.; Lan, J. Nexus between green financing, renewable energy generation, and energy efficiency: Empirical insights through DEA technique. Environ. Sci. Pollut. Res. 2023, 30, 61290–61303. [Google Scholar] [CrossRef] [PubMed]
- Kaya, Y. Impact of Carbon Dioxide Emission on GNP Growth: Interpretation of Proposed Scenarios. Prias: IPCC Energy and Industry Subgroup. 1989. Available online: https://cir.nii.ac.jp/crid/1570291225678384256 (accessed on 15 May 2003).
- Guan, H.; Sun, Z.; Zhao, A. Spatio-temporal evolution and influencing factors of net carbon sink in marine aquaculture in China. Front. Environ. Sci. 2022, 10, 978073. [Google Scholar] [CrossRef]
- Zilong, W.; Xinbin, W. Research on the impact of green finance on energy efficiency in different regions of China based on the DEA-Tobit model. Reserve Policy 2022, 77, 102695. [Google Scholar]


| Level Indicators | The Secondary Indicators | Level 3 Indicators | Index Definition | Index Attribute |
|---|---|---|---|---|
| Level of green finance development | Green credit | Proportion of interest from energy-intensive industries | High energy consumption industrial interest/industrial interest | - |
| Green securities | Share of market capitalization of energy-intensive industries | Six high-energy consumption A stock market values/total market value of A shares | - | |
| Green investment | Proportion of investment in environmental pollution | Investment in pollution control/GDP | + | |
| Green insurance | Agricultural insurance size ratio | Agricultural insurance income/gross agricultural output | + | |
| Carbon finance | Carbon intensity | Carbon dioxide emissions/GDP | - |
| Variable Name | Variable Meaning | Construction Method |
|---|---|---|
| RDI | R and D funding input | Log of R and D spending |
| LGV | Fiscal spending | Log of government fiscal expenditure |
| LOP | Economic openness | Log of total imports and exports by province and city |
| LGP | Degree of economic development | Log of GDP per capita |
| Variable | Definition | Sample | Average | Standard Deviation | Minimum | Maximum | |
|---|---|---|---|---|---|---|---|
| Explained variable | CEN | Carbon emission level | 350 | 3.625 | 0.261 | 2.715 | 4.153 |
| ESE | Energy Mix Factors | 350 | 83.424 | 71.772 | 386.373 | 1.314 | |
| EDT | Economic Development factor | 350 | 52.007 | 43.340 | 1.284 | 216.780 | |
| EEN | Energy efficiency Factor | 350 | 568.306 | 474.419 | 30.297 | 2158.516 | |
| ISE | Industrial structure factors | 350 | 197.656 | 138.550 | 19.142 | 641.24.1 | |
| Explaining variable | GFI | Green Finance Development Index | 350 | 0.415 | 0.078 | 0.201 | 0.662 |
| Control variable | RDI | R and D funding input | 350 | 0.017 | 0.011 | 0.003 | 0.075 |
| LGV | Fiscal spending | 350 | 3.562 | 0.307 | 2.183 | 4.242 | |
| LOP | Economic openness | 350 | 2.693 | 0.702 | 0.518 | 4.038 | |
| LGP | Degree of economic development | 350 | 4.602 | 0.261 | 3.896 | 5.217 |
| Province | Total Carbon Emissions | Energy Structure | Economic Development | Energy Efficiency | Industrial Structure |
|---|---|---|---|---|---|
| Beijing | 203.476 | −3.446 | 3.828 | 136.670 | 66.424 |
| Tianjin | 252.839 | −2.496 | 1.914 | 184.392 | 69.029 |
| Hebei | 1495.158 | −18.106 | 10.994 | 1177.366 | 324.904 |
| Shanxi | 892.018 | −22.207 | 4.536 | 541.138 | 368.551 |
| Liaoning | 1103.831 | −18.675 | 11.831 | 802.527 | 308.148 |
| Jilin | 486.365 | −7.181 | 2.452 | 378.166 | 112.928 |
| Heilongjiang | 740.175 | −8.419 | 4.823 | 572.275 | 171.496 |
| Shanghai | 363.436 | −5.881 | 8.137 | 230.373 | 130.807 |
| Jiangsu | 1242.764 | −18.463 | 10.865 | 966.927 | 283.435 |
| Zhejiang | 747.086 | −12.861 | 4.343 | 564.523 | 191.081 |
| Anhui | 590.834 | −7.382 | 2.921 | 471.467 | 123.828 |
| Fujian | 303.956 | −5.207 | 2.417 | 223.567 | 83.179 |
| Jiangxi | 265.568 | −4.964 | 2.094 | 200.785 | 67.653 |
| Shandong | 2245.685 | −34.073 | 15.376 | 1794.213 | 470.169 |
| Henan | 1575.895 | −18.998 | 0.746 | 1304.663 | 289.484 |
| Hubei | 575.412 | −8.674 | 2.363 | 442.045 | 139.678 |
| Hunan | 567.048 | −10.711 | 7.956 | 434.957 | 134.846 |
| Guangdong | 765.754 | −17.136 | 8.920 | 519.986 | 253.984 |
| Chongqing | 227.937 | −2.566 | 0.547 | 178.053 | 51.903 |
| Sichuan | 552.219 | −8.987 | 3.010 | 437.306 | 120.890 |
| Guizhou | 209.635 | −8.927 | 1.116 | 93.574 | 123.872 |
| Yunnan | 206.043 | −6.913 | 3.008 | 103.332 | 106.616 |
| Shaanxi | 464.825 | −9.401 | −1.285 | 357.333 | 118.178 |
| Gansu | 305.635 | −6.017 | 4.236 | 223.928 | 83.488 |
| Qinghai | 53.835 | −1.314 | 0.021 | 35.985 | 19.143 |
| Province | Total Carbon Emissions | Energy Structure | Economic Development | Energy Efficiency | Industrial Structure |
|---|---|---|---|---|---|
| Beijing | 90.949 | −26.161 | 38.523 | 30.298 | 48.289 |
| Tianjin | 245.536 | −43.237 | 38.427 | 168.019 | 82.327 |
| Hebei | 1681.219 | −220.68 | 162.13 | 1343.988 | 395.781 |
| Shanxi | 1495.24 | −385.329 | 82.225 | 1157.103 | 641.241 |
| Liaoning | 1162.073 | −205.367 | 124.576 | 858.52 | 384.344 |
| Jilin | 529.63 | −76.801 | 63.292 | 422.541 | 120.598 |
| Heilongjiang | 868.605 | −101.829 | 62.737 | 713.367 | 194.33 |
| Shanghai | 348.011 | −69.79 | 76.496 | 201.115 | 140.19 |
| Jiangsu | 1465.606 | −244.869 | 181.651 | 1173.035 | 355.789 |
| Zhejiang | 800.868 | −142.844 | 112.442 | 608.546 | 222.724 |
| Anhui | 781.174 | −145.493 | 84.908 | 663.097 | 178.662 |
| Fujian | 403.543 | −93.444 | 54.269 | 318.752 | 123.966 |
| Jiangxi | 320.021 | −70.677 | 45.788 | 253.871 | 91.039 |
| Shandong | 2625.227 | −386.373 | 216.78 | 2158.516 | 636.304 |
| Henan | 1363.189 | −188.545 | 187.424 | 1073.935 | 290.375 |
| Hubei | 577.337 | −137.276 | 108.104 | 441.635 | 164.874 |
| Hunan | 575.095 | −122.897 | 111.641 | 437.406 | 148.945 |
| Guangdong | 927.779 | −171.361 | 146.509 | 645.893 | 306.738 |
| Chongqing | 161.984 | −49.413 | 39.168 | 110.678 | 61.551 |
| Sichuan | 475.808 | −109.486 | 87.071 | 361.674 | 136.549 |
| Guizhou | 218.145 | −133.88 | 107.499 | 99.437 | 145.089 |
| Yunnan | 162.61 | −89.899 | 74.954 | 62.897 | 114.658 |
| Shaanxi | 1023.016 | −171.669 | 55.551 | 924.777 | 214.357 |
| Gansu | 389.315 | −69.085 | 48.409 | 307.589 | 102.402 |
| Qinghai | 70.809 | −16.458 | 11.145 | 52.087 | 24.035 |
| 2007 | … | 2017 | 2018 | 2019 | 2020 | |
|---|---|---|---|---|---|---|
| Beijing | 0.287 | … | 0.759 | 0.748 | 0.793 | 0.839 |
| Tianjin | 0.148 | … | 0.291 | 0.331 | 0.353 | 0.376 |
| Hebei | 0.068 | … | 0.138 | 0.150 | 0.161 | 0.172 |
| Shanxi | 0.110 | … | 0.143 | 0.141 | 0.145 | 0.149 |
| Liaoning | 0.103 | … | 0.166 | 0.188 | 0.197 | 0.207 |
| Jilin | 0.078 | … | 0.144 | 0.142 | 0.147 | 0.152 |
| Heilongjiang | 0.081 | … | 0.134 | 0.138 | 0.142 | 0.147 |
| Shanghai | 0.165 | … | 0.334 | 0.354 | 0.377 | 0.403 |
| Jiangsu | 0.122 | … | 0.289 | 0.319 | 0.336 | 0.353 |
| Zhejiang | 0.126 | … | 0.301 | 0.322 | 0.339 | 0.356 |
| Anhui | 0.066 | … | 0.159 | 0.165 | 0.173 | 0.181 |
| Fujian | 0.100 | … | 0.214 | 0.214 | 0.224 | 0.234 |
| Jiangxi | 0.068 | … | 0.143 | 0.152 | 0.162 | 0.173 |
| Shandong | 0.115 | … | 0.240 | 0.267 | 0.285 | 0.305 |
| Henan | 0.077 | … | 0.166 | 0.174 | 0.186 | 0.199 |
| Hubei | 0.084 | … | 0.198 | 0.190 | 0.198 | 0.207 |
| Hunan | 0.075 | … | 0.176 | 0.188 | 0.202 | 0.219 |
| Guangdong | 0.176 | … | 0.395 | 0.384 | 0.402 | 0.421 |
| Chongqing | 0.097 | … | 0.205 | 0.202 | 0.211 | 0.220 |
| Sichuan | 0.096 | … | 0.193 | 0.202 | 0.215 | 0.228 |
| Guizhou | 0.075 | … | 0.149 | 0.141 | 0.147 | 0.152 |
| Yunnan | 0.070 | … | 0.142 | 0.135 | 0.140 | 0.145 |
| Shaanxi | 0.090 | … | 0.199 | 0.208 | 0.218 | 0.227 |
| Gansu | 0.080 | … | 0.155 | 0.146 | 0.152 | 0.158 |
| Qinghai | 0.075 | … | 0.138 | 0.144 | 0.151 | 0.158 |
| Year | Green Finance | Carbon Emissions |
|---|---|---|
| 2007 | 0.115 * (0.119) | 0.218 ** (0.140) |
| 2008 | 0.137 * (0.119) | 0.191 ** (0.140) |
| 2009 | 0.153 * (0.120) | 0.186 * (0.141) |
| 2010 | 0.179 ** (0.120) | 0.162 * (0.140) |
| 2011 | 0.197 ** (0.122) | 0.189 * (0.140) |
| 2012 | 0.185 ** (0.121) | 0.147 * (0.141) |
| 2013 | 0.176 ** (0.121) | 0.130 * (0.142) |
| 2014 | 0.182 ** (0.118) | 0.138 * (0.142) |
| 2015 | 0.171 ** (0.116) | 0.124 * (0.143) |
| 2016 | 0.144 ** (0.111) | 0.128 * (0.143) |
| 2017 | 0.118 * (0.107) | 0.118 * (0.143) |
| 2018 | 0.185 ** 0.114) | 0.142 ** (0.144) |
| 2019 | 0.193 ** (0.114) | 0.137 * (0.144) |
| 2020 | 0.202 ** (0.115) | 0.144 * (0.144) |
| Statistic | Model (1) | |
|---|---|---|
| Statistic | p Values | |
| LM (error) | 374.686 *** | 0.000 |
| R-LM (error) | 367.652 *** | 0.000 |
| LM (lag) | 10.313 *** | 0.001 |
| R-LM (lag) | 3.278 *** | 0.070 |
| Wald_lag | 34.520 *** | 0.000 |
| Wald_error | 35.040 *** | 0.000 |
| LR_lag | 36.470 *** | 0.000 |
| LR_error | 36.330 *** | 0.000 |
| Hausman | 45.270 *** | 0.000 |
| Joint significance test (ind) | 93.090 *** | 0.000 |
| Joint significance test (time) | 933.670 *** | 0.000 |
| Variable | Model (1) |
|---|---|
| L.GFI | 0.709 *** (0.036) |
| GFI | 0.361 *** (0.073) |
| RDI | 3.608 *** (1.141) |
| LGV | 0.033 (0.021) |
| LOP | 0.010 (0.019) |
| LGP | 0.071 ** (0.028) |
| Spa-rho | 0.193 *** (0.066) |
| R2 | 0.990 |
| (2) | (3) | (4) | (5) | |
|---|---|---|---|---|
| GFI | −122.267 *** (39.804) | 17.419 (2113.027) | −338.543 ** (143.381) | −147.566 *** (40.325) |
| RDI | 12.798 (625.824) | 2113.027 *** (485.997) | 4528.245 ** (2264.006) | 955.758 (636.034) |
| LGV | 7.454 (36.395) | 12.847 (9.036) | 39.420 (41.928) | 20.236 * (11.787) |
| LOP | 36.395 *** (10.665) | 5.774 (8.251) | 63.713 * (38.272) | 35.952 *** (10.840) |
| LGP | 74.948 *** (15.207) | 36.933 *** (11.896) | 57.788 (55.050) | 46.319 *** (15.494) |
| Spa-rho | 0.566 *** (0.0057) | 0.170 ** (0.0768) | 0.129 (0.114) | 0.177 ** (0.077) |
| R2 | 0.414 | 0.043 | 0.05 | 0.049 |
| Variable | Model (2) | Model (3) | ||||
|---|---|---|---|---|---|---|
| Direct effect | Indirect effect | Total effect | Direct effect | Indirect effect | Total effect | |
| GFI | 225.108 *** (48.370) | 934.007 *** (232.747) | 1159.116 *** (14,014.350) | 27.804 (31.398) | 288.505 *** (73.586) | 256.310 *** (83.577) |
| RDI | −1427.698 *** (661.378) | 12,586.650 *** (2667.148) | 14,014.350 *** (3115.332) | 2214.757 *** (425.243) | 3220.527 *** (990.655) | 5435.274 *** (1165.275) |
| LGV | 5.113 (15.610) | 29.513 (55.079) | 24.400 (66.566) | 12.677 (9.874) | 19.570 (22.302) | 6.893 (26.810) |
| LOP | 8.343 (20.035) | 264.758 *** (49.506) | 256.415 *** (56.157) | 6.152 * (8.780) | 8.203 (17.898) | 2.050 (19.038) |
| LGP | 106.105 *** (20.035) | 308.495 ** (91.3333) | 414.601 *** (102.481) | 37.075 *** (13.450) | 41.776 (34.776) | 4.701 (35.868) |
| Variable | Model (4) | Model (5) | ||||
|---|---|---|---|---|---|---|
| Direct effect | Indirect effect | Total effect | Direct effect | Indirect effect | Total effect | |
| GFI | 325.960 ** (146.474) | 323.138 (262.715) | 649.098 ** (273.434) | 155.153 *** (40.995) | 161.371 * (95.574) | 316.524 *** (109.054) |
| RDI | 5291.790 *** (1952.816) | 14,706.040 *** (3370.878) | 9414.236 ** (3718.686) | 758.990 (556.861) | 5545.053 *** (1251.862) | 4786.062 *** (1486.796) |
| LGV | 36.528 (44.643) | 4.984 (81.170) | 31.543 (91.229) | 18.009 (12.873) | 28.404 (29.309) | 10.394 (35.174) |
| LOP | 70.305 * (42.730) | 277.213 *** (69.358) | 206.543 (66.586) | 27.240 ** (11.755) | 164.550 *** (26.652) | 137.309 *** (29.337) |
| LGP | 55.997 (66.559) | 313.731 ** (129.885) | 369.729 *** (122.002) | 58.213 *** (18.457) | 193.670 *** (47.797) | 251.884 *** (52.022) |
| Variable | Model (1) |
|---|---|
| LGFI | 0.710 *** (0.036) |
| GFI | 0.355 *** (0.073) |
| RDI | 2.872 *** (1.112) |
| LGV | 0.041 * (0.021) |
| LOP | 0.027 (0.021) |
| LGP | 0.085 ***(0.028) |
| Spa-rho | 0.324 *** (0.091) |
| R2 | 0.990 |
| (1) | (2) | (3) | (4) | |
|---|---|---|---|---|
| GFI | −166.210 *** (46.285) | 29.995 (31.378) | −373.718 ** (146.047) | −184.42.876 *** (42.876) |
| RDI | 707.633 (706.532) | 2254.857 *** (478.180) | 2620.741 (2237.018) | 192.900 (658.405) |
| LGV | 3.399 (13.292) | 11.038 (9.020) | 12.802 (42.279) | 4.053 (12.440) |
| LOP | 19.596 (13.556) | 5.757 (9.178) | 30.736 (42.645) | 8.678 (12.602) |
| LGP | 80.380 *** (17.945) | 42.717 *** (12.248) | 33.758 (57.138) | 44.321 *** (16.823) |
| Spa-rho | 0.462 *** (0.879) | 0.079 (0.104) | 0.190 (0.112) | 0.109 (0.109) |
| R2 | 0.452 | 0.567 | 0.052 | 0.152 |
Disclaimer/Publisher’s Note: The statements, opinions and data contained in all publications are solely those of the individual author(s) and contributor(s) and not of MDPI and/or the editor(s). MDPI and/or the editor(s) disclaim responsibility for any injury to people or property resulting from any ideas, methods, instructions or products referred to in the content. |
© 2023 by the authors. Licensee MDPI, Basel, Switzerland. This article is an open access article distributed under the terms and conditions of the Creative Commons Attribution (CC BY) license (https://creativecommons.org/licenses/by/4.0/).
Share and Cite
Lin, Z.; Wang, H.; Li, W.; Chen, M. Impact of Green Finance on Carbon Emissions Based on a Two-Stage LMDI Decomposition Method. Sustainability 2023, 15, 12808. https://doi.org/10.3390/su151712808
Lin Z, Wang H, Li W, Chen M. Impact of Green Finance on Carbon Emissions Based on a Two-Stage LMDI Decomposition Method. Sustainability. 2023; 15(17):12808. https://doi.org/10.3390/su151712808
Chicago/Turabian StyleLin, Zirong, Hui Wang, Wei Li, and Min Chen. 2023. "Impact of Green Finance on Carbon Emissions Based on a Two-Stage LMDI Decomposition Method" Sustainability 15, no. 17: 12808. https://doi.org/10.3390/su151712808
APA StyleLin, Z., Wang, H., Li, W., & Chen, M. (2023). Impact of Green Finance on Carbon Emissions Based on a Two-Stage LMDI Decomposition Method. Sustainability, 15(17), 12808. https://doi.org/10.3390/su151712808