1. Introduction
The array of ecological and environmental issues triggered by global climate change, specifically due to the emission of greenhouse gases like carbon dioxide, pose significant challenges to the multifaceted sustainable development of human society, especially the environmental dimension [
1]. Reducing carbon emissions and responding to global climate change has become a universal goal worldwide. The “Climate Change 2022: Mitigation of Climate Change” report issued by the Intergovernmental Panel on Climate Change (IPCC) proposes that global carbon emissions must be reduced by 40% before 2030 [
1]. As the world’s second-largest economy and a major carbon emitter, China faces serious issues with high carbon emissions, which severely impact its high-quality economic development and ecological civilization construction. In 2019, China’s carbon emissions reached 10.71 billion tons, ranking first globally, as reported by the World Resources Institute (WRI). Facing the severe carbon emissions situation, China has proposed striving to peak carbon dioxide emissions before 2030 and achieve carbon neutrality by 2060. The successful implementation of these targets, in line with its Nationally Determined Contributions (NDCs) under the Paris Agreement, would not only spur the transition to a low-carbon economy within China but also contribute significantly to global carbon emissions reduction, thereby aiding in the worldwide effort to mitigate climate change.
International trade, which includes goods trade and service trade, plays a vital role in carbon reduction. While the overarching consensus underscores the potential of trade activities in facilitating carbon reduction, the precise mechanisms through which this occurs have been a subject of considerable debate. Various channels, such as the diffusion of cleaner technologies, improvements in energy efficiency, and the transition toward less carbon-intensive sectors, are often cited. However, the intricacies of these dynamics and their relative contributions to carbon reduction are topics that continue to invite exploration. In 2019, service trade contributed more than 20% to world trade and accounted for over 65% of the world’s GDP, becoming a new engine for world economic growth. Since 2005, the share of developing economies, including China, in world service trade has grown by more than 10% [
2], reflecting the increasing role of developing countries in global service trade growth. The rapid development of China’s service trade is evident. As per the World Bank Dataset in 2019, the gross value of China’s service trade was about 5.3% of the nation’s GDP. Simultaneously, figures of the Ministry of Commerce of the People’s Republic of China indicated that this accounted for nearly 14.9% of China’s total volume of foreign trade. Service trade has become a key area for promoting China’s high-level openness and an important driver of carbon reduction.
The pollution and carbon emissions of the service industry itself are more covert compared to the industry, and therefore it has been regarded as a green industry for an extended duration [
3]. In the trade field, service trade is far smaller in volume compared to goods trade, with characteristics of intangibility and transaction synchronicity. This has led to a long-term lack of attention to the research on pollution and carbon emissions in service trade [
4,
5]. Carbon emissions are one of the environmental impacts caused by production activities, and the environmental impacts of international trade, including carbon emissions, can be determined by scale, structural, and technological effects [
6]. As an increasingly important part of international trade, the impact of service trade on the environment, particularly on carbon emissions, cannot be ignored. Consequently, what is the impact of service trade on carbon emissions? Is the relationship between service trade and carbon emissions non-linear? Can service trade effectively promote carbon emission reduction? What is the essential influencing mechanism in this process? Is there heterogeneity? The answers to these questions have significant practical significance for achieving China’s “dual carbon” goal.
Despite the burgeoning recognition of service trade’s role in carbon mitigation, there is a discernible void in the scholarly discourse pertaining to the non-linear characteristics, the transmission mechanisms, and the heterogeneous effects of service trade on carbon emissions, notably within China’s unique context. This research endeavors to fill this lacuna mentioned above, thereby fostering a more nuanced comprehension of the impact exerted by service trade on carbon emissions. The significance of this research is manifold. Firstly, it reveals the non-linear characteristics, transmission mechanisms, and heterogeneity of the impact of service trade on carbon emissions. Secondly, it offers fresh insights that could guide policy formulations for enhancing carbon reduction through service trade. Thirdly, it proposes innovative approaches that are critical to achieving China’s “dual carbon” goal and are potentially beneficial in confronting global warming on a broader, international scale.
The rest of the paper is structured as follows.
Section 2 contains a literature review.
Section 3 contains a theoretical analysis of the direct and indirect effects and presents the research hypotheses.
Section 4 contains the research design, including the model design and variable description.
Section 5 introduces the empirical results and analysis.
Section 6 presents the results of the robustness tests and endogeneity treatments.
Section 7 contains a further analysis, including a heterogeneity analysis of the geographical location and a heterogeneity analysis of the different levels of carbon emissions.
Section 8 summarizes our research conclusions and puts forward corresponding policy recommendations. The specific research framework is shown in
Figure 1.
2. Literature Review
2.1. Environmental Effects of the Service Sector
The service industry’s impact on carbon emissions has been a topic of increasing interest in recent years. Zheng et al. (2021) [
7] conducted a study on the moderating effect of energy service companies (ESCOs) on the relationships between urbanization, industrialization, and CO
2 emissions, finding that ESCOs significantly moderate these relationships. Roberts et al. (2021) [
8] suggested that tackling service emissions requires additional efficiency measures for energy use and goods use and consideration of the emission intensities of exporting countries for imports. Shi et al. (2021) [
9] used nighttime light data to evaluate carbon dioxide emissions from the service industry, traffic, and the secondary industry, finding that nighttime lights revealed up to 51.2% of traffic carbon emissions and 22.7% of service industry carbon emissions.
Several studies specifically concentrated on the impact of producer services on carbon emissions. Utilizing spatial econometric methods, Han and Xie (2017) [
10] found that the specialized and diversified agglomeration of the financial sector, scientific research, technical services, and environmental governance and public facilities management hold significant spatial effects in reducing carbon emissions. A study by Li et al. (2019) [
11] explored the impact of the collaborative agglomeration between the producer service industry and the manufacturing industry on carbon intensity, finding that industrial co-agglomeration can promote carbon intensity reduction. Yan et al. (2022) [
12] found that producer services agglomeration (PSA) significantly inhibits CO
2 emissions, but heterogeneous influences exist in different regions, time nodes, and sub-industries.
These studies highlight the potential of the service industry to contribute to carbon emission reduction through effective resource allocation, technological innovation, and industrial structure upgrading. However, further research is needed to fully understand the complex relationships between the service industry and carbon emissions.
The existing research on the relationship between service trade and carbon emissions mainly focuses on the following aspects.
2.2. Environmental Effects of Service Trade
Some scholars argue that the service industry is relatively clean, resulting in less pollution. They believe that service trade benefits environmental protection and has a positive impact on the environment. For instance, Tang and Ma (2009) [
13] stated that the high degree of trade globalization in the service sector helps reduce environmental pollution. Fernandez (2010) [
14] found that the liberalization of transportation service trade within the scope of the North American Free Trade Agreement can significantly reduce air pollution emissions. Levinson (2010) [
5] revealed that American service trade exports primarily concentrate on low-pollution industries, contributing to reduced pollution levels in the U.S. service industry. This has allowed the U.S. to maintain a low level of pollution emissions. Steenblik and Grosso (2011) [
15] further emphasized that international service trade plays a crucial role in enabling the adoption of energy utilization and low-carbon technologies.
Other scholars have found through research that the service industry and service trade have a negative impact on the environment in terms of pollution emissions. Salzman (1999) [
16] divided the impact of service trade on the environment into direct and indirect effects, with chimney services and cumulative services having a direct impact on the environment and chimney services causing significant environmental pollution. Horner et al. [
17] suggested that digital technology has altered business and consumption habits. The growth of e-commerce and online platforms has lessened reliance on physical stores and heavy industry, furthering the green transition of the economy.
2.3. Carbon Emission Effects of Service Trade
The multiple impacts of service trade on the environment have received significant attention in academia, yet studies focusing on the effects of service trade on carbon emissions are relatively rare. Zhang et al. (2015) [
18] noted that the final demand for services in some countries leads to substantial emissions in other countries. Hu et al. (2018) [
19] found that the expansion of commercial service trade can effectively promote carbon reduction. Zhang and Zhang (2018) [
20] empirically found that the growth in service trade and improvements in trade structure can suppress carbon emissions. Sun and Ma (2019) [
21] pointed out that the opening of service trade, especially the globalization of emerging service industries, can enhance energy utilization efficiency and carbon emission efficiency. Huo et al. (2021) [
3] found that the carbon emissions implicit in service trade account for 30% of the total carbon emissions of global trade, with the Southern Hemisphere having a higher growth rate and carbon emission intensity in service trade. Feng et al. (2022) [
22] found that service trade significantly improves carbon efficiency.
In reviewing the existing literature, we found that studies on the overall environmental effects of service trade are abundant, while research on the impact of service trade on carbon emissions is relatively scarce. Existing studies mainly focus on analyzing the linear impact of service trade on carbon emissions, paying less attention to non-linear characteristics, transmission mechanisms, and heterogeneous analysis of these impacts, and the research conclusions are not consistent. Based on these existing studies, this paper took China as the research object, used panel data from 30 provincial administrative regions in China from 2009 to 2019, and applied various econometric methods to explore the impact of service trade on carbon emissions. The main innovative points of this paper are as follows. Firstly, it explores the non-linear relationship between China’s service trade and carbon emissions, finding an inverted U-shaped characteristic; secondly, it empirically tests the transmission path of the impact of China’s service trade on carbon emissions, analyzing the potential operating mechanisms; thirdly, it analyzes the heterogeneous impacts of service trade on carbon emissions in different regions in China as well as at different levels of carbon emissions; and finally, it proposes policy suggestions on how China should further leverage the carbon-reducing role of service trade.
3. Theoretical Analysis and Research Hypotheses
Based on the direct and indirect impacts of service trade on the environment, service trade can be divided into “chimney services”, “cumulative services”, and “leverage services” [
16], which are also applicable to categorizing them according to the different impacts they bring to carbon emissions. In service trade, “chimney services” encompass activities like transportation, power services, warehousing, and postal services, which directly emit carbon dioxide. On the other hand, “cumulative services” involve aggregating individual services with minimal environmental impact, like catering and automobile services, leading to significant carbon emissions. Additionally, “leverage services” pertain to service providers using their market positions to influence the environmental behaviors of producers, consumers, or participants in the supply chain. Services like consulting, financial services, advertising, and provision of intellectual property rights indirectly impact the behaviors of different market participants, resulting in varying degrees of carbon emissions.
The earliest research on the impact of international trade on the environment was carried out by Grossman and Krueger (1991) [
6]. They explicitly divided the effect of international trade on the environment into three aspects: scale effect, technological effect, and structural effect. In other words, E = E1 + E2 + E3, where E represents the overall environmental effect of trade, and E1, E2, and E3 respectively represent the scale effect, technological effect, and structural effect. This “Three Effects” theory laid the foundation for the theoretical analysis of the environmental effects of international trade.
Recognizing that service trade is an important part of trade activities and carbon emissions are one of the significant factors affecting the environment and climate change, this research posits that the impact of service trade on carbon emissions can also be analyzed within the basic framework of the “Three Effects”. Additionally, this study considers the potential non-linear relationship between service trade and carbon emissions, leading to an examination of the potential non-linear effects of service trade on carbon emissions.
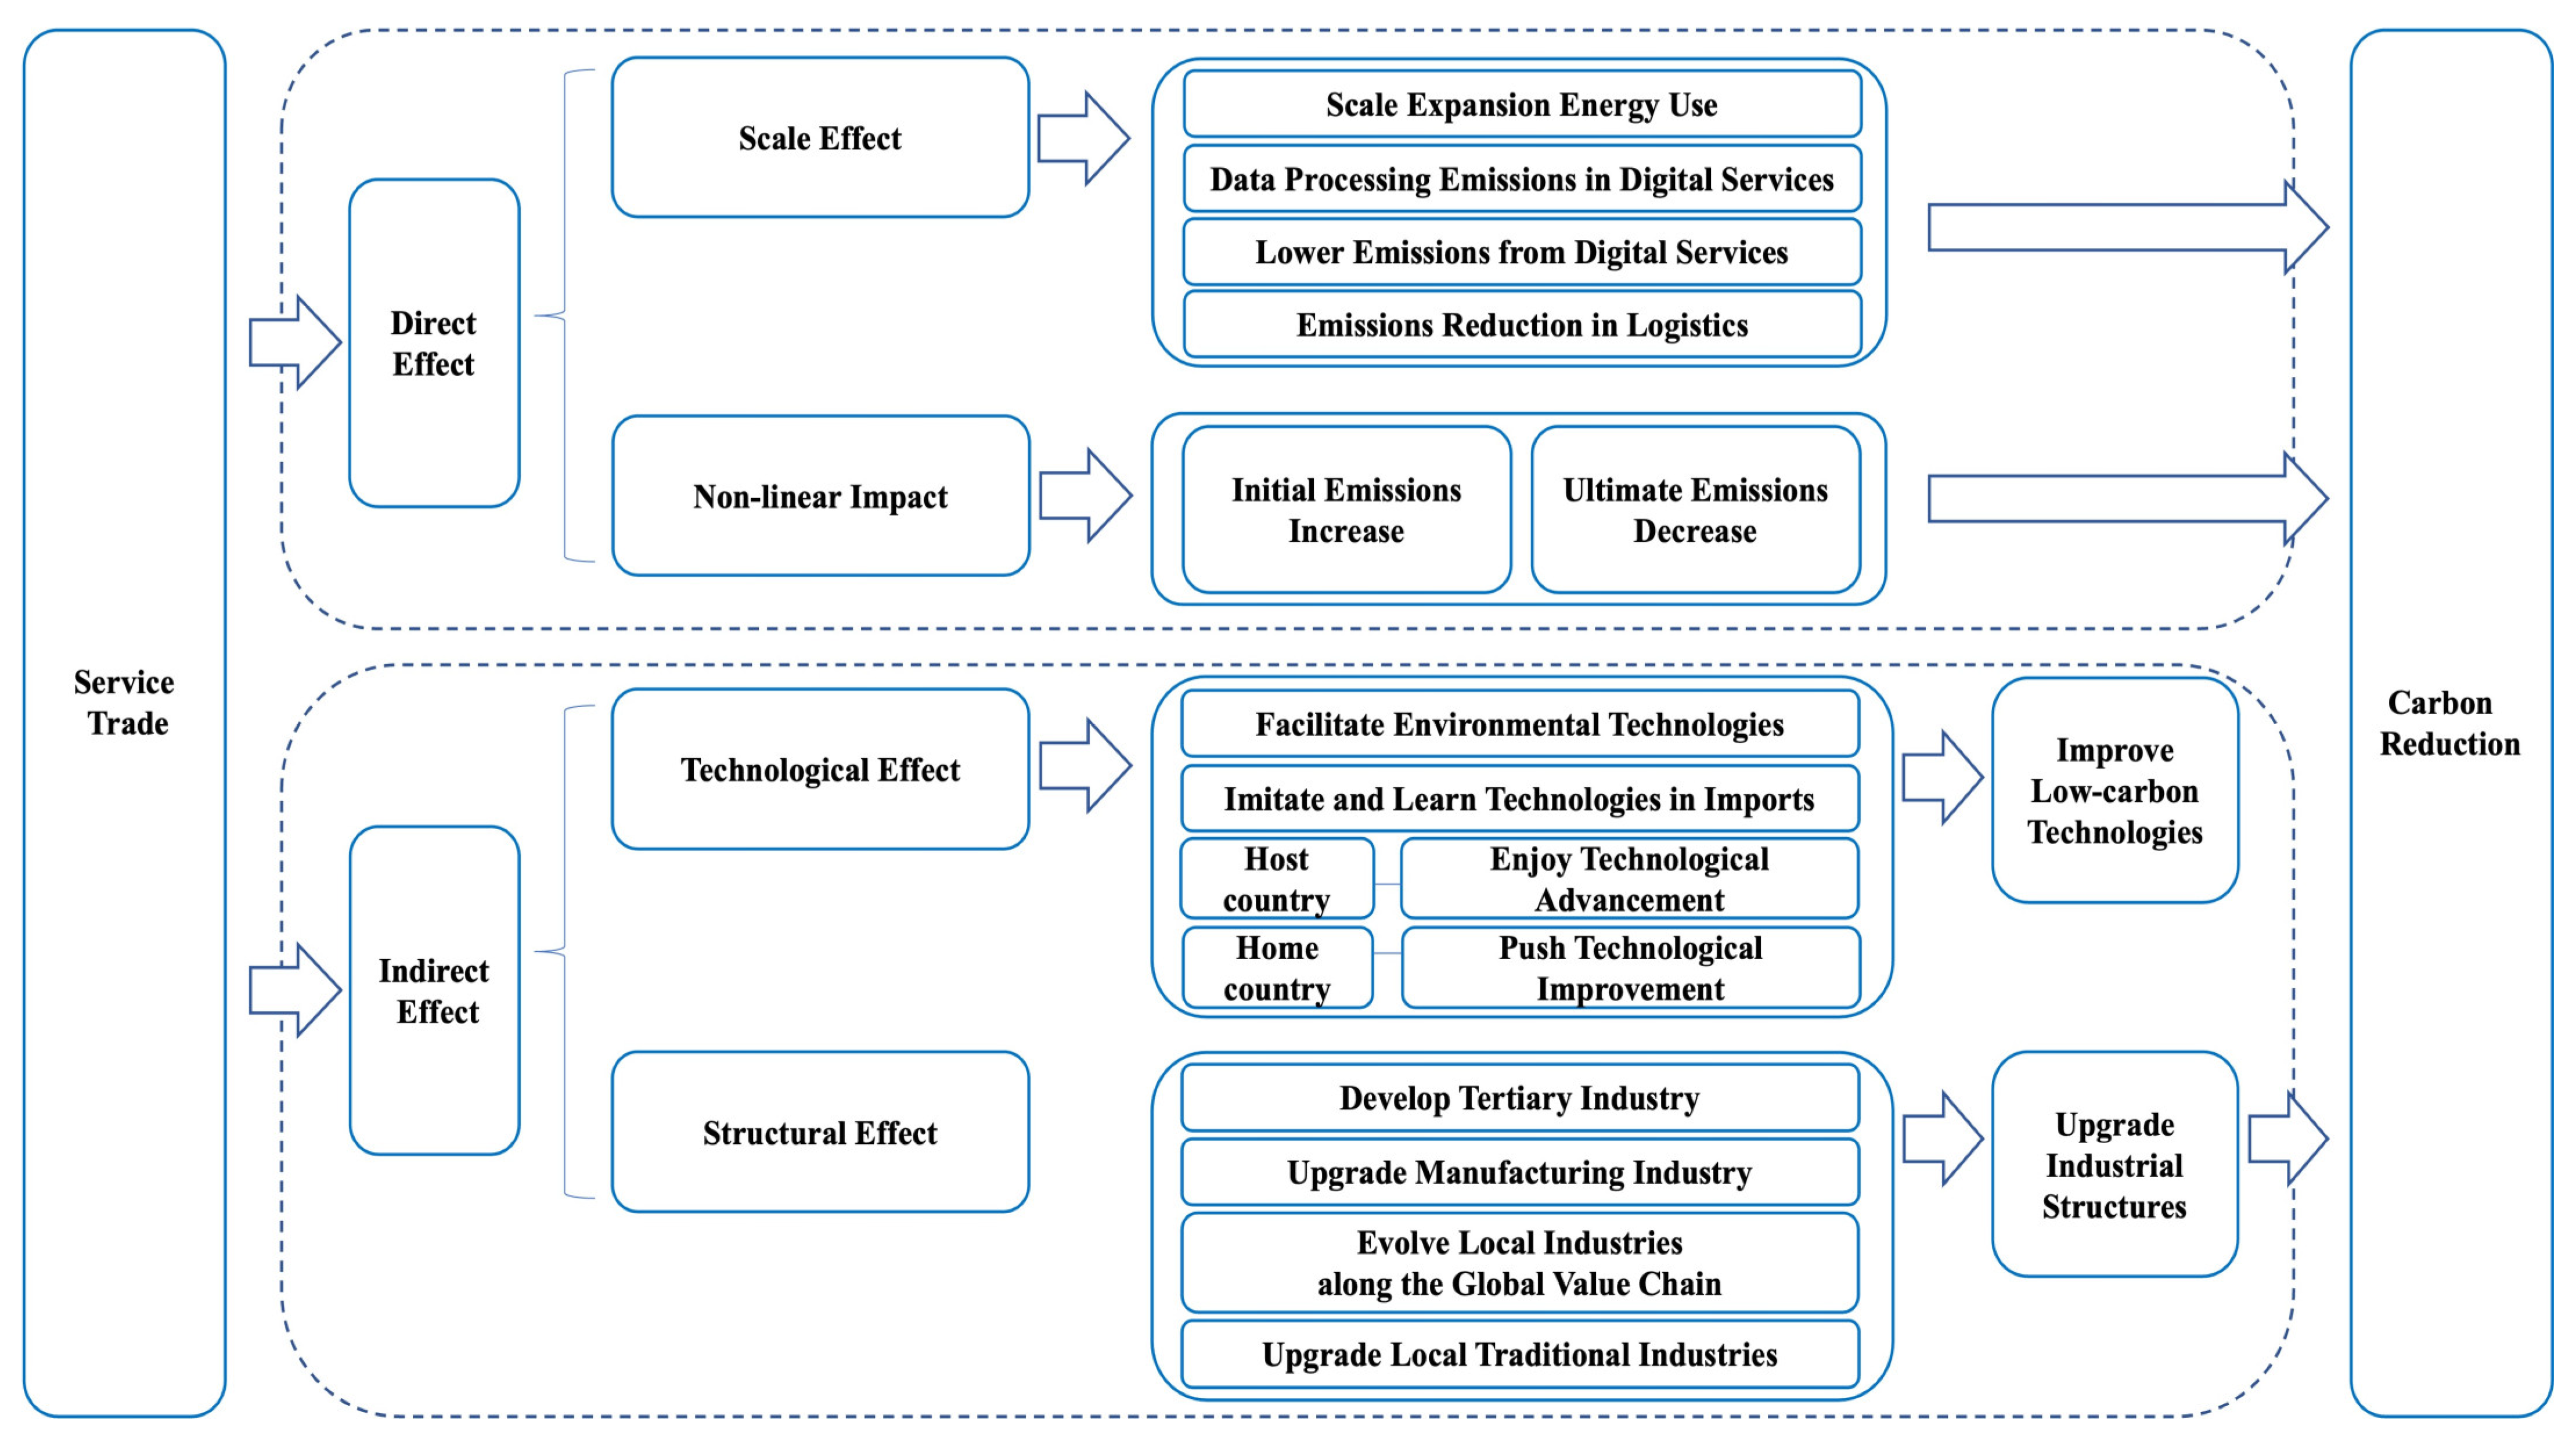
Based on these considerations, this paper discusses the complex impact of service trade on carbon emissions from two major aspects (direct effect and indirect effect) and four sub-aspects.
3.1. Direct Effect
3.1.1. Scale Effect
The direct effect (which is also the scale effect) of service trade on carbon emissions mainly exists in three aspects. First, the overall scale expansion of service trade objectively requires the use of more production factors, consumes more energy resources, and thus leads to more carbon emissions, which are mainly produced by “chimney services” and “cumulative services”. Second, digital service trade will have a significant impact on carbon emissions. On one hand, digital service trade relies on many data centers for data processing, which will directly produce carbon emissions. On the other hand, the carbon emission level of the digital service trade sector during its production process is lower than that of other industry sectors [
23,
24]. As the scale of digital service trade expands, it is very likely to promote green economic growth and carbon reduction [
25,
26]. Third, traditional logistics methods are a major source of carbon emissions in goods trade. Compared to goods trade, service trade can greatly reduce the dependence on traditional logistics methods which generate significant carbon dioxide, thus reducing carbon emissions. Therefore, this paper puts forward the following hypothesis:
Hypothesis 1: Service trade can have direct impacts on carbon emissions by exerting scale effects.
3.1.2. Non-Linear Impact of Service Trade on Carbon Emissions
Grossman and Krueger (1995) [
27] first proposed the Environmental Kuznets Curve (EKC), according to which environmental pollution increases before decreasing as the economy grows, showing an inverted “U”-shaped curve characteristic. As a crucial part of foreign economic activities, the impact of service trade on carbon emissions may also follow an order of increasing before decreasing [
28]. Specifically for many developing countries, including China, at the early stage of service trade development, the home country tends to introduce or provide more “chimney services” with lower technology levels that are usually characterized by high consumption and high emissions, such as transportation services, communications, postal services, etc. The growth of these services will increase energy demand and produce more carbon emissions. At this time, “leverage services” will cater to the rapid development trend of other industries and choose to provide services that sacrifice low-carbon emission development methods, thereby indirectly intensifying the overall economy’s energy input and carbon emission levels.
Secondly, as service trade gradually matures, many high-value-added and low-emission services gradually become the main content of service trade, such as sales services, education services, health and social services, etc. As people gradually become aware of environmental issues during development, whether it is service imports or service exports, they will face stricter environmental protection requirements. This will also make service trade lean toward low-pollution and low-emission services, even for “leverage services” such as production services affecting industrial development, which will also have a positive indirect impact on carbon reduction. Therefore, this paper proposes the following hypothesis:
Hypothesis 2: Service trade has a non-linear impact on carbon emissions, showing an inverted U-shaped relationship. The development of service trade can ultimately promote carbon reduction.
3.2. Indirect Effects
3.2.1. Technological Effect
The implementation of service trade fosters an environmentally beneficial technological spillover, thereby increasing energy use efficiency and supporting energy-saving and emission-reduction practices, which is the technological effect.
Initially, the progression of service trade, through the import of services, can directly facilitate energy-efficient and emission-reducing technologies for the producer service sector, such as environmental services like pollution and waste treatment. Furthermore, to enhance their competitiveness, service-exporting companies can demonstrate and encourage higher productivity levels within the service sector. They can also significantly improve the efficiency of manufacturing firms that employ service products as intermediate inputs, thereby boosting the total factor productivity of the national economy [
29]. This inevitably leads to enhanced carbon efficiency and reduced carbon emissions.
Secondly, the advancement of service trade encourages domestic producers to imitate and learn from more advanced energy-saving and emission-reducing technologies present in imported services [
30], thereby accelerating green, low-carbon technological innovation in related service sectors. The service sector further promotes the employment of technical talents across various industries, leading to technological spillovers. This in turn indirectly propels the progress of green, low-carbon technologies in other industries, elevating the overall level of low-carbon technologies used in economic activities, reducing per unit energy of output, and facilitating carbon reduction in the production process.
Lastly, with the growth in both service import and export trades, they increasingly face the constraints of stringent environmental trade barriers. On one side, for service import trade, this constraint paves the way for host countries to enjoy the benefits of more low-carbon and environmentally friendly technological advancements. Conversely, for service export trade, it imposes pressure on service providers in the home country to improve their energy-saving and emission-reduction levels [
31,
32], adapting to the environmental protection regulations and market demands of foreign countries [
33].
In conclusion, the expansion of service trade can strongly propel the enhancement of energy use efficiency. Increases in energy efficiency can effectively curb carbon emissions [
34,
35], marking a crucial pathway toward achieving energy conservation and emission reduction [
36]. Thus, this study proposes the following hypothesis:
Hypothesis 3: Service trade can exert technological effects by influencing the level of low carbon technology, ultimately leading to carbon reduction.
3.2.2. Structural Effect
Service trade can exert influence on carbon emissions by playing a role in the optimization and upgrading of industrial structures, which is the structural effect.
Firstly, for the tertiary industry, the enhancement of service trade scale and quality can directly drive its development. The import of services trade can positively contribute to the social investment, human capital accumulation, and institutional innovation of the service industry, thus promoting the upgrade of domestic services. On the other hand, the development of service export trade can enhance the complexity of export technology [
37], thereby promoting the expansion of service export competitiveness, driving the development of the service industry in the exporting country, and stimulating the transformation and upgrading of the industry structure in the exporting country.
Secondly, as for the manufacturing industry, service trade drives the development of producer service industries, which can increase the efficiency of the manufacturing industry by reducing transaction costs [
38]. The growth of service trade can bring advanced technology, experience, and management from abroad to the manufacturing industry, aiding its transformation toward a more high-end and service-oriented direction.
Thirdly, the growth of service trade advances the openness of the service industry, igniting competition, demonstration, and investment effects, and promotes local traditional industries’ upgrade while driving the evolution of industries along the global value chain [
39]. The structural optimization increases the low-energy-intensity service, which mitigates carbon emissions compared to equivalent industrial growth, contributing to a slower rate and lower intensity of carbon emissions [
40]. Furthermore, this upgrade stimulates high-value-added and ‘clean’ industries, diminishing the proportion of polluting and high-energy-consuming sectors in the economy, thereby inhibiting carbon emissions [
41,
42,
43]. Hence, the following hypothesis is proposed:
Hypothesis 4: Service trade can exert structural effects by influencing the upgrading of industrial structures, ultimately leading to carbon reduction.
The mechanism analysis diagram is illustrated in
Figure 2.
4. Research Design
4.1. Model Setup
4.1.1. Benchmark Regression Model
The IPAT model can be used to examine the impacts of human activities on the environment. Building on this, Dietz and Rosa (1994) [
44] improved the IPAT model to create the STIRPAT model. The general form of this model is as follows:
In Formula (1),
represents the environmental impact caused by human activities,
denotes population size,
represents the economic level,
signifies technology level, and
indicates error. In practical applications, we usually take the natural logarithm on both sides to get Formula (2):
To study the impact of service trade on carbon emissions, this paper drew on Shahbaz (2016) et al. [
45] to set the environmental impact
as the level of carbon emissions. Their research intentionally integrates trade openness into their extended STIRPAT model, providing an empirical examination of the impact of trade openness on carbon emissions. The third section of this study carries out a comprehensive theoretical analysis and discusses the direct effect as well as the indirect effects of service trade on carbon emissions.
The direct effect includes the scale effect and the non-linear impact. Conversely, the indirect effects focus on environmentally friendly technological spillovers brought about by service trade, driving the technological effect on carbon emissions as well as the structural effect on carbon emissions through influencing industrial structure upgrade via service trade.
Therefore, within the framework of the STIRPAT model, after designating carbon emissions as the dependent variable, this study incorporated service trade as the core explanatory variable. In addition, considering the potential non-linear impact of service trade on carbon emissions, this paper also introduces a squared term of service trade into the model. Secondly, the per capita value added in the tertiary sector, total regional population, and green technology efficiency in the service sector are used to represent
,
, and
respectively. Furthermore, considering that the level of service sector industrial structure [
46] and environmental regulation [
47] may also affect the level of carbon emissions, to minimize model specification error, these factors were included in the model as additional control variables. Ultimately, the empirical model was specified as follows:
In Formula (3), represents region; represents time; represents the level of carbon emissions in various provinces of China; represents service trade; represents control variables (including levels of economic development, population, technology, industrial structure, and environmental regulation); is the intercept; , , and are parameters to be estimated; represents regional fixed effects; and is a random disturbance term.
4.1.2. Mechanism Impact Model
To analyze the indirect effects of service trade on carbon emissions, which consist of the technological effect (bringing environmentally friendly technological spillovers) and structural effect (influencing industrial structure upgrade) as the potential mediating mechanism, the mechanism impact model was set as Formula (4). This model was also used to verify the two research hypotheses relating to the two effects discussed above.
In Formula (4), represents the mediating mechanism variables, i.e., the paths through which China’s service trade influences carbon emissions, including improvements in energy efficiency (EF), level of industry structure sophistication (TS), and level of industry structure rationalization (TL). EF is the mediating variable that represents the technological effect, while TS and TL are the mediating variables that represent the structural effect. is the intercept, and and are the parameters of interest.
As the discussion based on the theoretical analyses and research hypotheses suggests, many studies have convincingly argued that industrial upgrading, which includes sophistication and rationalization of industry structure as well as improvements in energy efficiency (the three mediating mechanism variables), significantly contributes to reductions in carbon emissions (the dependent variable). Therefore, following the approach of Jiang (2022) [
48], this study conducted an impact mechanism analysis by only examining the effect of the core explanatory variable (service trade) on the mediating mechanism variables. If service trade significantly influences energy efficiency and the levels of industrial structure sophistication and rationalization, which are the three mediating mechanism variables, it would suggest that service trade can influence carbon emissions through the mediating mechanism variables.
and
represent the fixed effects of the region and time, respectively, and
is the random disturbance term.
4.1.3. Panel Quantile Regression Model
Quantile regression can fit explanatory variable functions under different conditional distributions of the dependent variable. This paper uses the panel quantile regression model with fixed effects proposed by Koenker (2004) [
49] to establish the following model for the impact of service trade on carbon emissions:
In Formula (4), is the quantile of the natural logarithm of carbon emissions; is the intercept at the quantile ; and are the parameters of interest in this study, estimated at the quantile ; is the individual fixed effect at the quantile ; and is a random disturbance term. The range of the quantile is .
4.2. Variable Description and Data Explanation
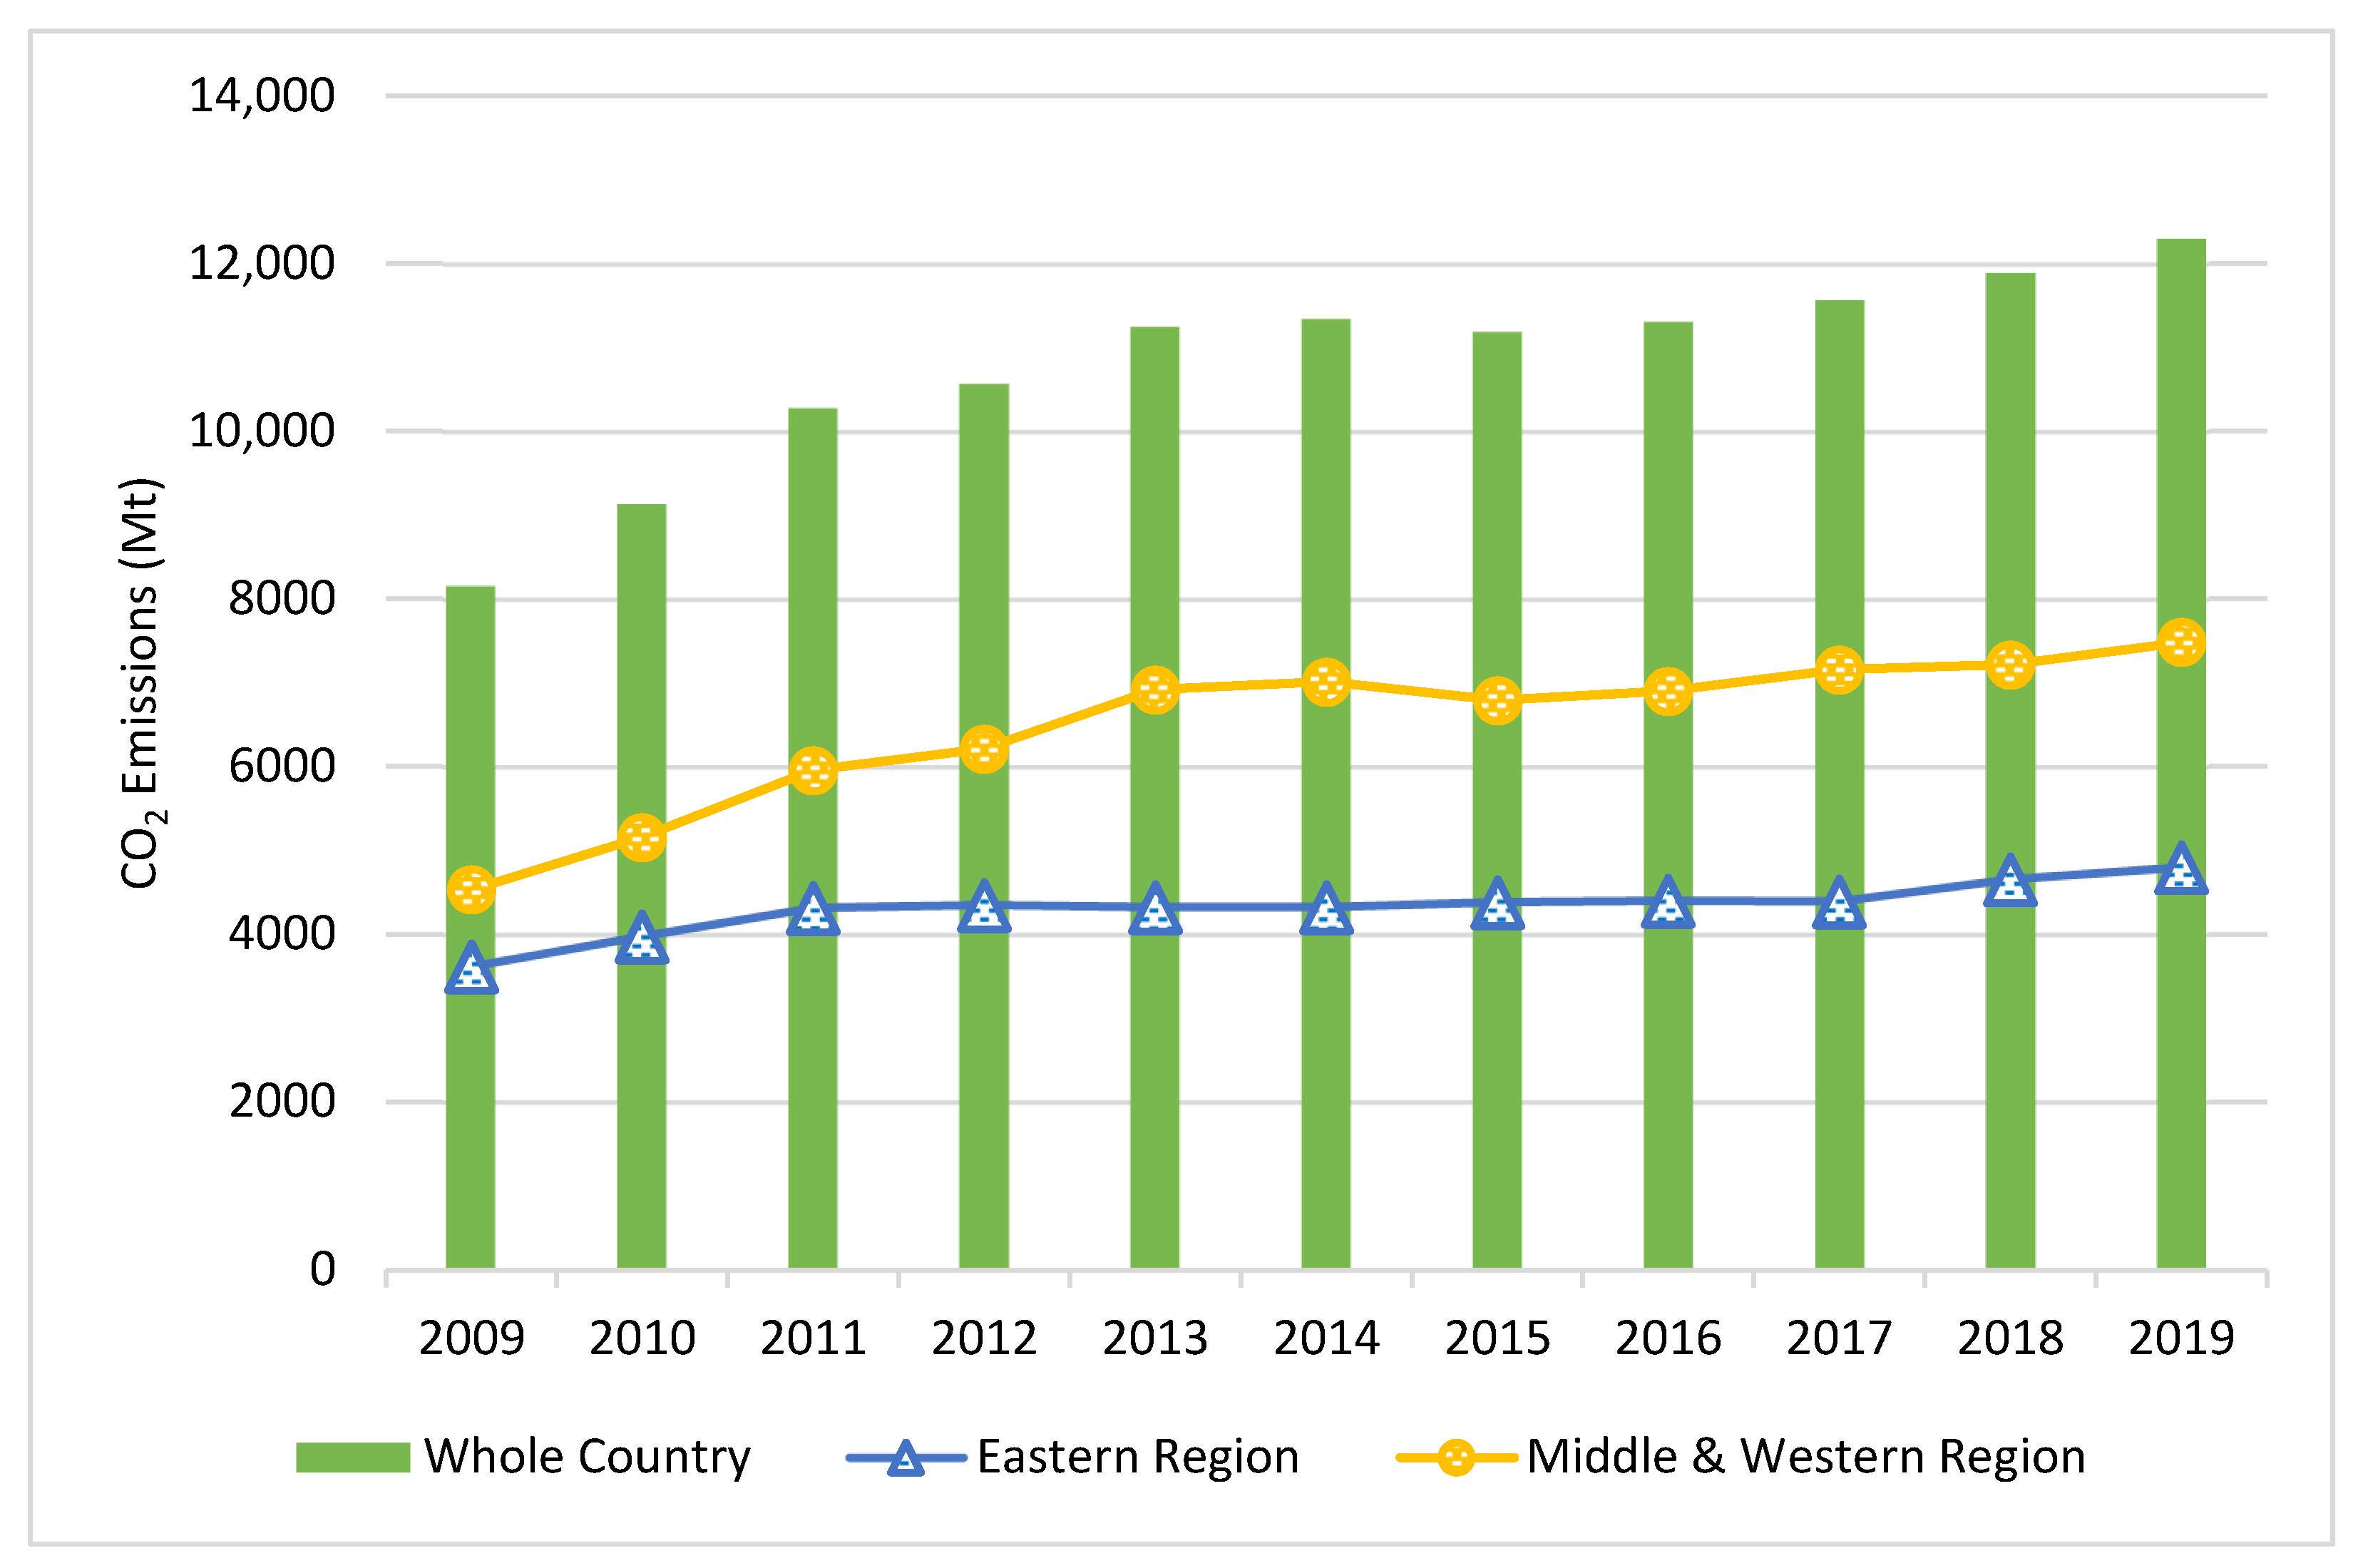
4.2.1. Dependent Variable
Carbon Emissions (C). The total amount of CO
2 emissions was used to represent carbon emissions in this paper.
Figure 3 illustrates the carbon emissions from 2009 to 2019 in China, including the whole country as well as the Eastern and Central–Western regions in China. Carbon emissions nationwide surged 51% from 2009’s 8153.4 million tons to 12,289.75 million tons in 2019. The Central and Western regions saw an approximate 65% hike (from 4537.15 to 7488.982 million tons), whereas the Eastern region grew around 32.8% (from 3616.25 to 4800.77 million tons). Overall, carbon emissions rose across China during this period, with more pronounced and swift increases in the Central and Western regions and more moderate growth in the Eastern region.
4.2.2. Core Explanatory Variable
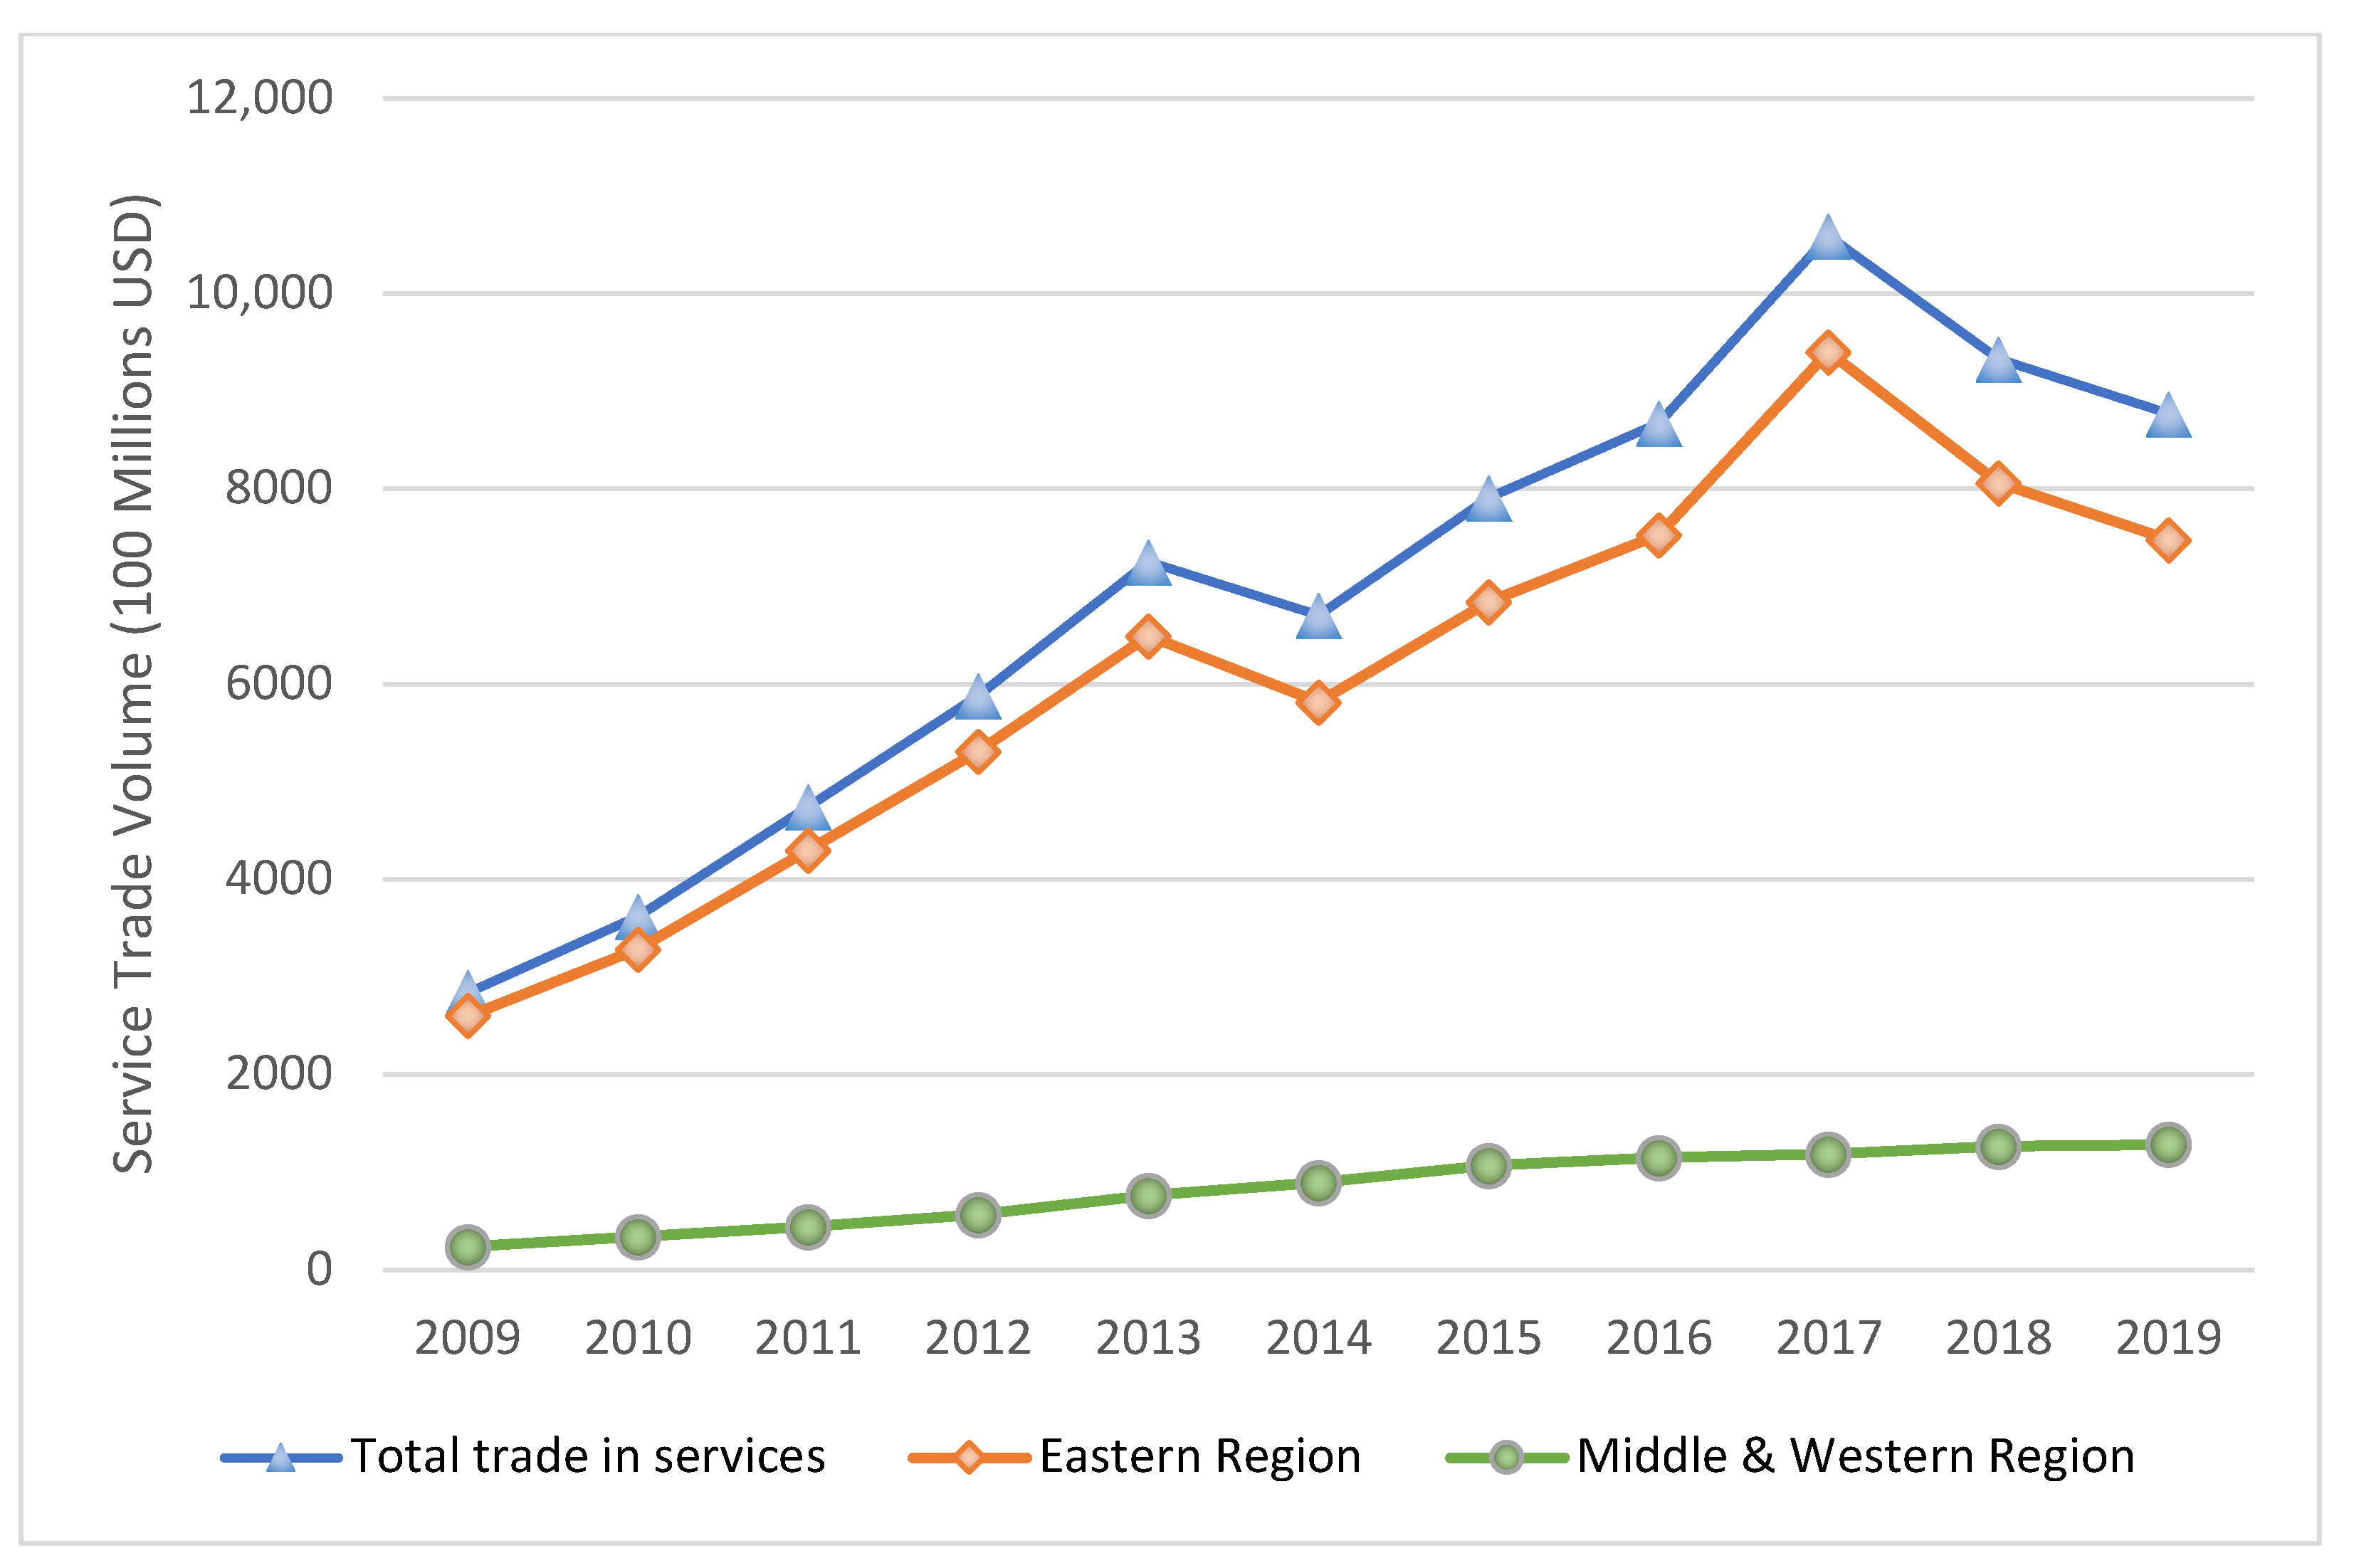
Service Trade (trade). This paper uses the total amount of service imports and exports to represent service trade.
Figure 4 charts the course of service trade totals for China and its regions from 2009 to 2019. The national and Eastern totals initially followed an oscillating growth trend, peaking in 2017 at USD 1.0593 trillion and USD 940.56 billion, a dramatic escalation from their 2009 figures of USD 284.31 billion and USD 260.45 billion, respectively. These totals then descended to USD 876.6 billion and USD 747.99 billion by 2019, respectively. Conversely, the Central and Western regions in China, although smaller in total scale, sustained an upward trajectory, swelling from USD 23.85 billion in 2009 to USD 128.61 billion in 2019—a substantial surge of about 539%.
4.2.3. Control Variables
- (1)
Population Level (pop). This paper uses the number of permanent residents at the end of each year in each province to represent the population level.
- (2)
Level of Service Industry Development (dls). The level of service industry development can reflect the overall development of the service industry in which service imports and exports are located. This paper uses the per capita added value of the tertiary industry in each province to represent the level of economic development.
- (3)
Service Industry Technology Level (tech). This paper, referring to Teng (2020) [
50], measures the green total factor productivity of the service industry in each province and decomposes it into the index of changes in green technology efficiency and the index of changes in green technological progress of the service industry, selecting the index of changes in green technology efficiency to represent the service industry technology level.
- (4)
Service Industry Structure Level (stru). This paper first divides the service industry into environmentally friendly services and non-environmentally friendly services. Non-environmentally friendly services specifically include wholesale and retail, transportation, storage and postal services, accommodation and catering services, and real estate. The rest are environmentally friendly services. This paper uses the proportion of the added value of environmentally friendly services in the added value of the tertiary industry to represent the level of the service industry structure.
- (5)
Environmental Regulation (regu). This paper selects local public fiscal expenditure on environmental protection to represent environmental regulation.
4.2.4. Mechanism Variables
- (1)
Energy Efficiency (EF). Following the practice of Lyubich et al., (2018) [
51], this paper selects energy productivity, i.e., the ratio of regional GDP to standard coal energy consumption, to represent energy efficiency.
- (2)
The upgrading of the industrial structure is mainly measured from the aspects of the sophistication and rationalization of the industrial structure. Industrial structure sophistication is carried out with the deepening of division of labor and specialization. So, following the practice of Li and Wu (2012) [
52], this paper constructs the level of industrial structure sophistication (TS) with the calculation formula as follows:
In Formula (6), represents the labor productivity of each industry, which is represented by dividing the added value of primary, secondary, and tertiary industries by the number of employees in each industry. represents the proportion of each industry’s added value of GDP.
Rationalization of industrial structure is a comprehensive reflection of the degree of coordination between industries and the utilization of resources. The level of industrial structure rationalization (TL) draws on the ideas of Gan et al. (2011) [
53] but adjusts it as follows:
In Formula (7), represents the gross production value, represents the number of employees in each industry, and represents the industry. The closer is to zero, the less rational the industrial structure is.
4.2.5. Data Source
This study took 30 provincial regions in China (excluding Tibet, Hong Kong, Macao, and Taiwan) as research objects. Referencing the research of Shen et al. (2021) [
54], this paper grouped China’s 30 provincial-level administrative areas into the Eastern and Central–Western regions according to geographic locations. Specifically, the Eastern region encompassed Beijing, Tianjin, Hebei, Liaoning, Shanghai, Jiangsu, Zhejiang, Fujian, Shandong, Guangdong, and Hainan (11 regions). The Central–Western region comprised Inner Mongolia, Chongqing, Sichuan, Guangxi, Guizhou, Yunnan, Shaanxi, Gansu, Qinghai, Ningxia, Xinjiang, Shanxi, Jilin, Heilongjiang, Henan, Hubei, Hunan, Anhui, and Jiangxi (19 regions). The research period was 2009 to 2019. Carbon emission data were sourced from CEADs.net (Carbon Emission Accounts and Datasets for emerging economies) [
55,
56,
57,
58]; service trade data, expressed in US dollars at the average annual exchange rate, were primarily drawn from the
China Business Statistics Yearbook, provincial commerce departments, and provincial statistical yearbooks. Some data were estimated through growth rates in the
Yearbook or linear interpolation for missing values. The remaining data were primarily drawn from the
China Environmental Statistics Yearbook,
China Energy Statistics Yearbook,
China Tertiary Industry Statistics Yearbook,
Wind Dataset, various provincial statistical yearbooks, and the National Bureau of Statistics of China, with missing values estimated using a fitting method. The service industry technology level (variable tech) accounted for price variable data deflated to the year 2000. Descriptive statistics of main variables are displayed in
Table 1.
This paper then proceeds to preliminary data screening. To avoid spurious regression in the empirical analysis, the stationarity of the data was initially examined. We adopted three different methods of unit root tests—the LLC, Fisher-ADF, and Fisher-PP tests. Both the LLC and Fisher-PP tests were significantly passed, leading us to consider the variables in this study as stationary. Subsequently, the Kao test was employed, and the results suggested a long-term high-level cointegration relationship between the dependent and explanatory variables. Finally, we applied the Variance Inflation Factor (VIF) test to examine potential multicollinearity among the independent variables of the benchmark regression model. The VIF test results revealed that all VIF values were less than 10, as shown in
Table 2, indicating the absence of multicollinearity among the variables.
5. Empirical Analysis
5.1. Benchmark Regression
To consider the differences in the effects estimated via different estimation methods, the existence of individual effects in the research object, and the possible omission of variables that do not change with time, as well as to eliminate heteroscedasticity and autocorrelation problems, this paper used a panel fixed-effects model with cluster robust standard errors for regression analysis.
Table 3 reports the benchmark regression results of the impact of service trade on carbon emissions. The regression results from Column (1) to Column (4) show that with unincluded and gradually included control variables, the first-order term of service trade was positive, the second-order term was negative, and both were significant at least at the 10% significance level. As shown in Column (6), after all control variables were included, the coefficients of the first-order and second-order terms of service trade were 0.152 and −0.017, respectively, and were significant at the 1% significance level. This indicated that: first, service trade can have scale effects and directly affect carbon emissions, which verified Hypothesis 1; second, the impact of service trade on carbon emissions has non-linear characteristics, and there is an inverted U-shaped relationship between service trade and carbon emissions that first promotes and then suppresses, which verified Hypothesis 2.
In line with these findings, a more detailed examination of the changing coefficients revealed some intriguing insights. From model (1) to model (6) in
Table 3, the coefficient of the first-order term of service trade (lntrade) decreased from 0.218 to 0.152 as we sequentially included control variables. This suggests a diminishing direct carbon emission effect as the scale of service trade increases, given the consideration of more control variables. The largest decrease in the coefficient occurred after introducing the population control variable (lnpop), potentially signifying a certain mitigating effect on carbon emissions due to the expanding population size.
On the other hand, the coefficient of the second-order term of service trade (lntrade) saw an increase from −0.013 to −0.017 when more control variables were gradually included. This indicates that the suppressing effect on carbon emissions becomes more prominent when the scale of service trade reaches a certain level, and even more so when additional control variables are considered. The absolute increase in the second-order term coefficient, especially after the inclusion of service industry technology level (lntech) and population (lnpop), could reflect that service technological progress and population growth might further strengthen the reduction in service trade carbon emissions as its scale expands.
The reason why service trade can exert scale effects and directly affect carbon emissions may be due to its overall scale changes, which lead to changes in the use of production factors and the consumption of energy resources, mainly through “chimney services” and “cumulative services”, which directly impact carbon emissions. In addition, the development of digital service trade changes energy consumption and subsequent carbon emissions, and service trade partly changes and replaces the traditional logistics methods of goods trade, which will also directly affect carbon emissions.
Service trade initially escalates carbon emissions due to early dominance of high-consumption, high-emission “chimney services” and “leverage services” driving high-carbon production activities. Over time, with more stringent environmental regulations and service trade reaching a certain level, the focus shifts to high-value, low-emission services, and “leverage services” encourage industries to move toward lower emissions, thus initiating a “carbon emission reduction effect”.
5.2. Mechanism Analysis
Table 4 presents the regression structure of the influence mechanism analysis.
As per
Table 4, the significant negative linear and positive quadratic coefficients of service trade in Columns (1), (2), and (3) signify a U-shaped relationship between service trade and both energy efficiency and industrial structure refinement. This supports Hypotheses 3 and 4, which suggested that service trade can affect carbon emissions by exerting structural and technological effects, respectively. At the initial stages, service trade could not enhance industrial upgrading or energy efficiency, likely because its dividend effects on industrial upgrades and improved energy utilization were overshadowed.
5.2.1. Technical Effect
Column (1) of
Table 4 shows how service trade influences low-carbon technology level, thus enabling carbon reduction.
In the initial stages of service trade development, advanced clean technologies are introduced. However, a larger technology gap makes low-tech sectors reliant on foreign technologies, curbing the motivation for green innovation. High-tech industries are further dissuaded from their own green innovation due to cheaper foreign services replacing costly domestic R&D.
Once service trade surpasses a certain threshold, the narrowing gap between domestic and foreign technology, coupled with decreased domestic R&D costs, allows domestically less-technology-intensive industries to enhance their capabilities by integrating advanced clean production technologies, reducing dependence on foreign technology. For high-tech industries, there is a shift toward domestic R&D over foreign services. At this juncture, service trade’s green, low-carbon tech spillover begins playing a positive role, rekindling domestic enterprises’ autonomous green, low-carbon innovation abilities.
In this phase, service import trade aids in domestic green technology imitation. Service export trade sees domestic enterprises learning from market leaders with green advantages, leading to a “learning in export” effect and a reverse technology spillover. The quest for greener services also prompts host countries to assist service export enterprises with green tech, boosting home-country technological progress.
As theoretically analyzed, augmenting energy efficiency effectively lowers carbon emissions. Thus, service trade can, beyond a specific development stage, enhance energy efficiency and reduce carbon emissions, demonstrating service trade’s technological effect in promoting carbon reduction.
5.2.2. Structural Effect
As illustrated in Columns (2) and (3) of
Table 4, service trade influences industrial structure upgrade through structural effects, ultimately inducing carbon reduction.
During initial service trade phases, developing countries typically import capital-intensive services and export labor-intensive services [
59], creating dual effects. On the one hand, due to the intangible nature of service trade, most of the effects related to service trade need physical carriers, so it largely relies on the exertion of the employment effect to promote industrial structure upgrading. However, an increased deficit in capital-intensive services may offset employment gains from a labor-intensive service surplus, hindering technology spillover and adversely impacting industrial structure upgrading. On the other hand, low-profit labor-intensive services exported by developing nations contrast with high-value capital-intensive services from developed countries, impairing capital accumulation in developing nations. The capital accumulation is critical for regional industrial growth and structural enhancement. Thus, early service trade phases can suppress industrial structure upgrading due to diminished or negative effects on capital accumulation.
Over time, service trade in developing countries has grown, and capital-intensive service sectors have made significant strides. Domestic capital-intensive service sectors are now capable of partially substituting foreign services and venturing into exports, reducing the deficit in capital-intensive services. This promotes both capital accumulation and overall employment growth. Ultimately, it significantly contributes to the upgrading and rationalization of the industrial structure.
The theoretical analysis suggested that industrial structure upgrading effectively reduces carbon emissions. Hence, past a certain development level, service trade can stimulate industrial structure upgrading and reduce carbon emissions, thereby exerting structural effects and ultimately promoting carbon reduction.
6. Robustness Test
6.1. Robustness Test
In the robustness test, we first replaced the core explanatory variable with service trade dependence (tra), the ratio of service trade volume to GDP. The rationale for selecting this variable lies in its ability to link service trade with the overall scale of economic activity. This allowed our research to consider the relationship between service trade and carbon emissions from a broader perspective and scope not solely restricted to the service trade itself. The results are shown in Column (1) of
Table 5.
Next, we employed the bootstrap resampling method for additional robustness testing. By setting the sample size to 330 and running 100 iterations, this method offered reliable parameter estimates, accounting for potential variance and bias. The essence behind this step was leveraging the capability of bootstrapping to simulate possible data distributions, thereby exploring inherent uncertainties within the data. The resampling process yielded significant results, as evident in Column (2) of
Table 5.
Furthermore, we replaced the dependent variable with per capita carbon emissions (lnPC) and carbon emissions per square kilometer (lnLandC). The actual cause behind this replacement lies in the different aspects of carbon emissions that each variable emphasizes: per capita carbon emissions reflect the impact of population size and individual consumption, whereas carbon emissions per square kilometer underscore the spatial density of carbon emissions. These substitutions allowed us to better measure the effects of service trade on carbon emissions from distinct angles, thereby providing a more robust confirmation of our results. The results are shown in Columns (3) and (4) of
Table 5.
A uniformity can be observed across all columns of
Table 5. We can observe that the coefficients of lntrade in Columns (1), (2), and (3) of
Table 5 were all positive and statistically significant at the 1% level. This consistency across different robustness checks further underscored the stability of these variables’ relationship with carbon emissions regardless of the changes in dependent variables or the application of bootstrap resampling, which also validated the robustness of the benchmark regression results.
6.2. Endogeneity Treatment
To address the influence of time-varying omitted variables, this study employed time-fixed effects, Two-Stage Least Squares (2SLS), and the System Generalized Method of Moments (System GMM) for robustness and endogeneity mitigation. Adding time-fixed effects allowed for the handling of variables that changed over time but not with entity changes, with the results shown in Column (1) of
Table 6. Using the method of Wang and Li (2015) [
60], the one-period lag of the core explanatory variable (L.lntrade) was used as the instrumental variable for the 2SLS regression, with the results shown in Column (2) of
Table 6. Furthermore, adopting the method by Feng et al. [
22], we introduced the lagged dependent variable (L.lnC) as the proxy for omitted variables and employed System GMM to address potential endogeneity, as seen in Column (3) of
Table 6. After addressing potential endogeneity issues, all regression results confirmed the inverted U-shaped relationship, signifying that the impact of service trade on carbon emissions first intensifies, then weakens.
7. Further Analysis
7.1. Heterogeneity Analysis Based on Geographic Locations
Considering that the level of service trade development may vary due to different resource endowments, the disparate endowments caused by geographical locations could potentially influence the impact of service trade on carbon emissions. Accordingly, this paper divided the sample into the east and central west in China according to geographical location for regression.
Table 7 shows the regression results after sample division. The results for both the Eastern and Central–Western regions of China are discussed in Columns (1) and (2), respectively.
In Columns (1) and (2), it can be observed that the linear term for service trade was positive, the quadratic term was negative for both the east and the central west, and both were significant at least the 10% level of significance, indicating that the relationship between service trade and carbon emissions is an inverted U-shaped curve in these regions.
Regarding the level of service trade development corresponding to the turning point, the Eastern region (turning point at 5.70) was considerably higher than the Central–Western region (turning point at 3.48). This discrepancy may be attributed to the Eastern region’s head-start in liberalization and early-stage development of service trade, which initially centered on high carbon-emitting “chimney services”. Furthermore, “cumulative services”, in which an individual service’s carbon emissions are easily overlooked, constituted a significant proportion in early service trade due to their high economic benefits and concealed emissions. As service trade evolves, “chimney services” and “cumulative services” tend to exert considerable resistance against the shift of service trade toward sectors with lower carbon emissions, thus inhibiting the transition of service trade toward having a carbon reduction effect.
In terms of the magnitude of carbon reduction effect of service trade post-turning point, there is a phenomenon in which the development of service trade in the central west has a greater inhibitory effect on carbon emissions than in the east. The regression results showed that after surpassing the turning point, for every 1% increase in service trade, the carbon emissions in the central west were directly reduced by 0.048%, while those of the east were reduced by 0.046%. That is, at the same level of service trade, the development of service trade of the central west in China brings about a greater marginal benefit in carbon reduction.
The reason for this could be that, compared to the Eastern region, the carbon reduction effect of service trade in the Central–Western region exhibits a “latecomer advantage”. The Central–Western region’s economic development relies more heavily on energy resources, resulting in higher energy consumption and emissions. Once service trade develops considerably, it stimulates the rapid development of the service industry, which has a lower level of carbon emissions compared to the local traditional industries. Moreover, “leverage services” could expedite the evolution of producer services, swiftly exerting influence on industries that are relatively larger and more reliant on energy inputs. This could indirectly foster the reduction in carbon emissions.
7.2. Heterogeneity Analysis Based on Varying Levels of Carbon Emissions
Considering the likely variances in service trade preferences at different levels of carbon emissions, focusing solely on the average impact of service trade on carbon emissions levels may yield a skewed perception. To delve deeper into the heterogeneity arising at different carbon emissions levels, this paper employed a panel quantile regression model to estimate the specific impact of service trade on different levels of carbon emissions.
The results of the panel quantile regression are shown in
Table 8.
Firstly, it can be seen in
Table 8 that the inverted-U relationship between service trade and carbon emissions varied at different emission levels. According to the regression results in Column (1) to Column (5) in
Table 8, before the turning point, each 1% increase in service trade would exacerbate carbon emissions by 0.073% to 0.106%, all of which were lower than the benchmark regression of 0.118%. After the turning point, each 1% increase in service trade would reduce carbon emissions by 0.036% to 0.066%, all of which were higher than the benchmark regression of 0.034%. This suggests that at different carbon emissions levels, service trade could exert a weaker influence on exacerbating carbon emissions and a stronger one on curbing carbon emissions.
Secondly, for each quantile in the panel fixed-effects model in the benchmark regression, according to Column (6) in
Table 8, the turning point at which the effect of service trade on carbon emissions transitions from positive to negative was calculated to be 4.47. However, according to the panel quantile regression results from Column (1) to Column (5) in
Table 7, the calculated turning point was between 2.1 and 3.83, significantly lower than 4.47. The standard panel fixed-effects model might overestimate the period in which service trade exacerbates carbon emissions, meaning that as service trade grows, its impact on carbon emissions will transition to negative at a higher level. However, the panel quantile regression results suggest that in some provincial-level administrative regions, service trade has already begun to curb carbon emissions, entering a stage that promotes carbon emission reduction.
Thirdly, the impact of service trade on carbon reduction shows a clear “W”-shaped trend. According to the results of the panel quantile regression (Columns (1) to (5) in
Table 8), it can be calculated that for each 1% increase in service trade, carbon emissions were reduced by 0.038%, 0.036%, 0.046%, 0.036%, and 0.066% at the five quantiles, respectively. This indicates a “W”-shaped trend—a contraction–expansion–retraction–resurgence trajectory for the carbon reduction effect of service trade as the level of carbon emissions increases.
A potential reason for this trend could be that in the globalized market, the competition in the international market may lead to a “W”-shaped impact of service trade on carbon emissions. During phases of carbon reduction expansion, enterprises leverage low-carbon services to bolster environmental competitiveness, amplifying the carbon reduction ability of service trade. Conversely, under competitive stress, enterprises might loosen carbon emission limitations of their services to decrease their cost of environmental protection, reducing service trade’s carbon mitigation capability, thus creating a “W”-shaped trend.
8. Conclusions and Policy Recommendations
The research conclusions are as follows: (1) The impact of service trade on carbon emissions exhibits non-linear characteristics, revealing an inverted U-shaped relationship between the two; (2) service trade can directly impact carbon emissions by exerting a scale effect (it can also indirectly affect carbon emissions through technological and structural effects, eventually leading to carbon reduction; and (3) the impact of service trade on carbon emissions has obvious heterogeneity in China, with service trade in the central west achieving an earlier shift in carbon emission reduction and a stronger reduction effect.
Based on theoretical analysis and empirical research, this paper proposes the following policy recommendations.
Firstly, enhancing the speed and quality of service trade development is vital. While its early acceleration might initially raise carbon emissions, service trade will eventually contribute to emission reduction. Therefore, investment and policy support should be increased in key sectors such as education, healthcare, and tourism to boost the transition to a low-carbon economy. It is crucial to eschew extensive growth and instead optimize service trade’s content and structure. Environmental governance can improve enterprise performance while balancing corporate environmental responsibility [
61]. Enterprises should be guided to select services that balance economic gains with carbon emissions, hastening carbon mitigation via service trade. Talent, being the primary “physical carriers” of service trade, are integral to this process. Emphasis should be placed on cultivating technical personnel proficient in energy saving and emission reduction in the service import and export sectors. The ripple effect of their services can further encourage carbon reduction across economic activities.
Secondly, enhancing service trade agglomeration that marries scale with quality; optimizes regional industrial structures; and bolsters green, low-carbon tech innovation is key. Service trade can cut carbon emissions through scale, technological, and structural effects. We should increase the concentration of efficient, low-carbon services and trade; elevate resource and energy utilization efficiency; maximize scale effects; and achieve carbon reduction. Moreover, emphasis should be placed on optimizing the industrial structure and fostering green, low-carbon technology. Policy measures should be used to adjust and optimize the structure of service trade and industry while guiding the transition and upgrade of industrial structures. Companies should be motivated to boost green, low-carbon technology development while ensuring eco-friendly innovation inputs and minimizing resource wastage. Lastly, the combined leverage of service trade’s scale, structural, and tech effects is crucial. Their synergy should drive enhanced carbon reduction, fostering harmonious, sustainable development across the economy, society, and the environment.
Thirdly, a regionally tailored service-trade-led carbon reduction strategy should be implemented that can bridge the gap between Eastern and Western China. This strategy includes the following. (1) For the Central and Western regions, targeted policies should be introduced to achieve early carbon reduction and robust results by leveraging the “latecomer advantage” of service trade in emission reduction. This involves offering tax incentives, financial support, and promoting technology research and development in energy-saving and emission reduction. Collaboration with domestic and international partners for adopting advanced green, low-carbon technologies will foster a transformation towards a more eco-friendly and sustainable economy. (2) For the Eastern regions, a focus on invigorating green service trade innovation and diversification is essential, encouraging the import of advanced green services and supporting green technology innovation in service-export companies. Technology collaboration and sharing between domestic and international firms should be fostered, enabling the transfer of advanced, green, low-carbon technologies to domestic firms, thus amplifying the overall impact of emission reduction efforts. (3) Establish and refine market-based mechanisms like carbon emission taxation and emission rights trading in regions with varying emission levels. This will encourage firms to consider domestic emission reduction alongside international competition, steering service trade toward a greener, low-carbon direction. By implementing these region-specific strategies and further market-based mechanisms, China can address the disparity between Eastern and Western regions in service trade and carbon reduction. It will foster a more balanced and harmonious development across the country, contributing to the overall achievement of the “dual carbon” goals and combating global warming effectively.
In light of the above findings, as China’s service trade continues to develop and with the ongoing progress of “carbon peaking” and “carbon neutrality” goals, the key direction for future research could be to construct variables that more comprehensively reflect the level of service trade development. Further exploration of potential indirect mechanisms through which service trade promotes carbon emission reduction is also suggested.
Additionally, many of our empirical results have demonstrated a significant positive regression coefficient for the control variable of population, indicating that population growth indeed propels carbon emissions to some extent. However, the influence of population on carbon emissions is intricate and multifactorial. The focus of this study remained on the relationship between service trade and carbon emissions. As China transitions from a one-child to a two-child policy, changes in population structure and growth are inevitable. These alterations’ impacts on carbon emissions necessitates further in-depth research. The population issue might suggest another direction for future research: exploring greener and more sustainable development paths for service trade to accommodate evolving population dynamics and environmental conditions. It will facilitate the better incorporation of future population changes into the development and implementation of population policies for carbon reduction.
Author Contributions
Conceptualization, H.L.; Methodology, H.L.; Software, H.L.; Validation, H.L.; Formal analysis, H.L.; Data curation, H.L.; Writing—original draft, H.L.; Writing—review & editing, X.H.; Supervision, X.H.; Project administration, H.L.; Funding acquisition, X.H. All authors have read and agreedto the published version of the manuscript.
Funding
This research was funded by the Social Science Fund of Xinjiang: 21BJY049; High-end Think Tank Cultivation Project of Xinjiang University Philosophy and Social Sciences Training Program, 2023 Autonomous Region Postgraduate Education Teaching Reform Project: XJ2023GY08; 2023 Autonomous Region Postgraduate Innovation Project: XJ2023G059.
Institutional Review Board Statement
Not applicable.
Informed Consent Statement
Not applicable.
Data Availability Statement
All sources have been provided in the paper.
Conflicts of Interest
The authors declare no conflict of interest.
References
- Riahi, K.; Schaeffer, R.; Arango, J.; Calvin, K.; Guivarch, C.; Hasegawa, T.; Jiang, K.; Kriegler, E.; Matthews, R.; Peters, G. IPCC, 2022: Climate Change 2022: Mitigation of Climate Change; Contribution of Working Group III to the Sixth Assessment Report of the Intergovernmental Panel on Climate Change; Cambridge University Press: Cambridge, UK, 2022. [Google Scholar]
- Comercio, O.M.D. World Trade Report 2019: The Future of Services Trade; World Trade Organization: Geneva, Switzerland, 2019.
- Huo, J.; Meng, J.; Zhang, Z.; Gao, Y.; Zheng, H.; Coffman, D.M.; Xue, J.; Li, Y.; Guan, D. Drivers of fluctuating embodied carbon emissions in international services trade. One Earth 2021, 4, 1322–1332. [Google Scholar]
- Fourcroy, C.; Gallouj, F.; Decellas, F. Energy consumption in service industries: Challenging the myth of non-materiality. Ecol. Econ. 2012, 81, 155–164. [Google Scholar]
- Levinson, A. Pollution and international trade in services. Int. Environ. Agreem. Polit. Law Econ. 2010, 10, 93–105. [Google Scholar]
- Grossman, G.M.; Krueger, A.B. Environmental Impacts of a North American Free Trade Agreement; National Bureau of Economic Research: Cambridge, MA, USA, 1991. [Google Scholar]
- Zheng, S.; Wang, R.; Mak, T.M.; Hsu, S.-C.; Tsang, D.C. How energy service companies moderate the impact of industrialization and urbanization on carbon emissions in China? Sci. Total Environ. 2021, 751, 141610. [Google Scholar]
- Roberts, S.H.; Foran, B.D.; Axon, C.J.; Stamp, A.V. Is the service industry really low-carbon? Energy, jobs and realistic country GHG emissions reductions. Appl. Energy 2021, 292, 116878. [Google Scholar]
- Shi, K.; Shen, J.; Wu, Y.; Liu, S.; Li, L. Carbon dioxide (CO2) emissions from the service industry, traffic, and secondary industry as revealed by the remotely sensed nighttime light data. Int. J. Digit. Earth 2021, 14, 1514–1527. [Google Scholar]
- Han, F.; Xie, R. Does the agglomeration of producer services reduce carbon emissions. J. Quant. Techn. Econ 2017, 34, 40–58. [Google Scholar]
- Li, T.; Han, D.; Feng, S.; Liang, L. Can industrial co-agglomeration between producer services and manufacturing reduce carbon intensity in China? Sustainability 2019, 11, 4024. [Google Scholar]
- Yan, J.; Yang, X.; Nie, C.; Su, X.; Zhao, J.; Ran, Q. Does government intervention affect CO2 emission reduction effect of producer service agglomeration? Empirical analysis based on spatial Durbin model and dynamic threshold model. Environ. Sci. Pollut. Res. 2022, 29, 61247–61264. [Google Scholar]
- Tang, Y.; Ma, F. The effect of international vertical specialization on the employment structure of Chinese labor market. Financ. Trade Econ. 2009, 4, 94–98. [Google Scholar]
- Fernandez, L. Environmental implications of trade liberalization on North American transport services: The case of the trucking sector. Int. Environ. Agreem. Politics Law Econ. 2010, 10, 133–145. [Google Scholar]
- Steenblik, R.; Grosso, M.G. Trade in Services Related to Climate Change: An Exploratory Analysis; OECD iLibrary: Paris, France, 2011. [Google Scholar]
- Salzman, J. Beyond the smokestack: Environmental protection in the service economy. UCLA Law Rev. 1999, 47, 411. [Google Scholar] [CrossRef]
- Horner, N.C.; Shehabi, A.; Azevedo, I.L. Known unknowns: Indirect energy effects of information and communication technology. Environ. Res. Lett. 2016, 11, 103001. [Google Scholar]
- Zhang, W.; Peng, S.; Sun, C. CO2 emissions in the global supply chains of services: An analysis based on a multi-regional input–output model. Energy Policy 2015, 86, 93–103. [Google Scholar]
- Hu, H.; Xie, N.; Fang, D.; Zhang, X. The role of renewable energy consumption and commercial services trade in carbon dioxide reduction: Evidence from 25 developing countries. Appl. Energy 2018, 211, 1229–1244. [Google Scholar]
- Zhang, Y.; Zhang, S. The impacts of GDP, trade structure, exchange rate and FDI inflows on China’s carbon emissions. Energy Policy 2018, 120, 347–353. [Google Scholar]
- Sun, C.; Ma, T.; Ouyang, X.; Wang, R. Does service trade globalization promote trade and low-carbon globalization? Evidence from 30 countries. Emerg. Mark. Financ. Trade 2021, 57, 1455–1473. [Google Scholar] [CrossRef]
- Feng, R.; Shen, C.; Huang, L.; Tang, X. Does trade in services improve carbon efficiency?—Analysis based on international panel data. Technol. Forecast. Soc. Change 2022, 174, 121298. [Google Scholar]
- Wang, J.; Dong, X.; Dong, K. How digital industries affect China’s carbon emissions? Analysis of the direct and indirect structural effects. Technol. Soc. 2022, 68, 101911. [Google Scholar]
- Dong, F.; Hu, M.; Gao, Y.; Liu, Y.; Zhu, J.; Pan, Y. How does digital economy affect carbon emissions? Evidence from global 60 countries. Sci. Total Environ. 2022, 852, 158401. [Google Scholar]
- Hao, X.; Li, Y.; Ren, S.; Wu, H.; Hao, Y. The role of digitalization on green economic growth: Does industrial structure optimization and green innovation matter? J. Environ. Manag. 2023, 325, 116504. [Google Scholar]
- Hao, X.; Wen, S.; Xue, Y.; Wu, H.; Hao, Y. How to improve environment, resources and economic efficiency in the digital era? Resour. Policy 2023, 80, 103198. [Google Scholar]
- Grossman, G.M.; Krueger, A.B. Economic growth and the environment. Q. J. Econ. 1995, 110, 353–377. [Google Scholar]
- Wang, Q.; Zhang, F.; Li, R. Revisiting the environmental kuznets curve hypothesis in 208 counties: The roles of trade openness, human capital, renewable energy and natural resource rent. Environ. Res. 2023, 216, 114637. [Google Scholar]
- Görg, H.; Greenaway, D. Much ado about nothing? Do domestic firms really benefit from foreign direct investment? World Bank Res. Obs. 2004, 19, 171–197. [Google Scholar] [CrossRef]
- Bloom, N.; Draca, M.; Van Reenen, J. Trade induced technical change? The impact of Chinese imports on innovation, IT and productivity. Rev. Econ. Stud. 2016, 83, 87–117. [Google Scholar] [CrossRef]
- Zahler, A.; Iacovone, L.; Mattoo, A. Trade and innovation in services: Evidence from a developing economy. World Econ. 2014, 37, 953–979. [Google Scholar]
- Su, C.-W.; Naqvi, B.; Shao, X.-F.; Li, J.-P.; Jiao, Z. Trade and technological innovation: The catalysts for climate change and way forward for COP21. J. Environ. Manag. 2020, 269, 110774. [Google Scholar]
- Tong, X.; Xu, F.; Zhang, W. How does producer services export affect productivity growth? Empirical test based on OECD country data. Nankai Econ. Stud. 2015, 4, 44–66. [Google Scholar]
- Akram, R.; Chen, F.; Khalid, F.; Ye, Z.; Majeed, M.T. Heterogeneous effects of energy efficiency and renewable energy on carbon emissions: Evidence from developing countries. J. Clean. Prod. 2020, 247, 119122. [Google Scholar]
- Zhang, L.; Mu, R.; Zhan, Y.; Yu, J.; Liu, L.; Yu, Y.; Zhang, J. Digital economy, energy efficiency, and carbon emissions: Evidence from provincial panel data in China. Sci. Total Environ. 2022, 852, 158403. [Google Scholar] [PubMed]
- Jin, L.; Duan, K.; Shi, C.; Ju, X. The impact of technological progress in the energy sector on carbon emissions: An empirical analysis from China. Int. J. Environ. Res. Public Health 2017, 14, 1505. [Google Scholar] [CrossRef] [PubMed]
- Stojkoski, V.; Utkovski, Z.; Kocarev, L. The impact of services on economic complexity: Service sophistication as route for economic growth. PLoS ONE 2016, 11, e0161633. [Google Scholar]
- Su, X.; Anwar, S.; Zhou, Y.; Tang, X. Services trade restrictiveness and manufacturing export sophistication. N. Am. J. Econ. Financ. 2020, 51, 101058. [Google Scholar] [CrossRef]
- Markusen, J.R. Trade in producer services and in other specialized intermediate inputs. Am. Econ. Rev. 1989, 79, 85–95. [Google Scholar]
- Zheng, J.; Mi, Z.; Coffman, D.M.; Milcheva, S.; Shan, Y.; Guan, D.; Wang, S. Regional development and carbon emissions in China. Energy Econ. 2019, 81, 25–36. [Google Scholar]
- Wu, L.; Sun, L.; Qi, P.; Ren, X.; Sun, X. Energy endowment, industrial structure upgrading, and CO2 emissions in China: Revisiting resource curse in the context of carbon emissions. Resour. Policy 2021, 74, 102329. [Google Scholar] [CrossRef]
- Mao, G.; Dai, X.; Wang, Y.; Guo, J.; Cheng, X.; Fang, D.; Song, X.; He, Y.; Zhao, P. Reducing carbon emissions in China: Industrial structural upgrade based on system dynamics. Energy Strategy Rev. 2013, 2, 199–204. [Google Scholar] [CrossRef]
- Jiang, T.; Huang, S.; Yang, J. Structural carbon emissions from industry and energy systems in China: An input-output analysis. J. Clean. Prod. 2019, 240, 118116. [Google Scholar] [CrossRef]
- Dietz, T.; Rosa, E.A. Rethinking the environmental impacts of population, affluence and technology. Hum. Ecol. Rev. 1994, 1, 277–300. [Google Scholar]
- Shahbaz, M.; Loganathan, N.; Muzaffar, A.T.; Ahmed, K.; Jabran, M.A. How urbanization affects CO2 emissions in Malaysia? The application of STIRPAT model. Renew. Sustain. Energy Rev. 2016, 57, 83–93. [Google Scholar]
- Yu, J.; Yu, Y.; Jiang, T. Structural factors influencing energy carbon emissions in China’s service industry: An input–output perspective. Environ. Sci. Pollut. Res. 2022, 29, 49361–49372. [Google Scholar]
- Wu, H.; Xu, L.; Ren, S.; Hao, Y.; Yan, G. How do energy consumption and environmental regulation affect carbon emissions in China? New evidence from a dynamic threshold panel model. Resour. Policy 2020, 67, 101678. [Google Scholar]
- Jiang, T. Mediating effects and moderating effects in causal inference. China Ind. Econ. 2022, 5, 100–120. [Google Scholar]
- Koenker, R. Quantile regression for longitudinal data. J. Multivar. Anal. 2004, 91, 74–89. [Google Scholar]
- Teng, Z. Spatial differentiation and driving factors of green total factor productivity in China’s service industry. Quant. Tech. Econ. 2020, 37, 23–41. [Google Scholar]
- Lyubich, E.; Shapiro, J.S.; Walker, R. Regulating mismeasured pollution: Implications of firm heterogeneity for environmental policy. In AEA Papers and Proceedings, 2018; American Economic Association: Nashville, TN, USA, 2018; pp. 136–142. [Google Scholar]
- Li, F.; Wu, Q. The industrial upgrading effect of home countries’ outward foreign direct investment: An empirical study from provincial panel of China. J. Int. Trade 2012, 6, 124–134. [Google Scholar]
- Gan, C.; Zheng, R.; Yu, D. An empirical study on the effects of industrial structure on economic growth and fluctuations in China. Econ. Res. J. 2011, 46, 4–16. [Google Scholar]
- Shen, X.; Chen, Y.; Lin, B. The impacts of technological progress and industrial structure distortion on China’s energy intensity. Econ. Res. J 2021, 56, 157–173. [Google Scholar]
- Guan, Y.; Shan, Y.; Huang, Q.; Chen, H.; Wang, D.; Hubacek, K. Assessment to China’s recent emission pattern shifts. Earth’s Future 2021, 9, e2021EF002241. [Google Scholar]
- Shan, Y.; Huang, Q.; Guan, D.; Hubacek, K. China CO2 emission accounts 2016–2017. Sci. Data 2020, 7, 54. [Google Scholar] [PubMed]
- Shan, Y.; Guan, D.; Zheng, H.; Ou, J.; Li, Y.; Meng, J.; Mi, Z.; Liu, Z.; Zhang, Q. China CO2 emission accounts 1997–2015. Sci. Data 2018, 5, 170201. [Google Scholar] [PubMed]
- Shan, Y.; Liu, J.; Liu, Z.; Xu, X.; Shao, S.; Wang, P.; Guan, D. New provincial CO2 emission inventories in China based on apparent energy consumption data and updated emission factors. Appl. Energy 2016, 184, 742–750. [Google Scholar]
- Bhagwati, J.N. Why are services cheaper in the poor countries? Econ. J. 1984, 94, 279–286. [Google Scholar] [CrossRef]
- Wang, Z.; Li, C. The impact of asset-light strategy on firms’ profit margin—Evidence from China’s manufacturing firms. China Ind. Econ. 2015, 6, 108–121. [Google Scholar]
- Hao, X.; Wen, S.; Li, K.; Wu, J.; Wu, H.; Hao, Y. Environmental governance, executive incentive, and enterprise performance: Evidence from Chinese mineral enterprises. Resour. Policy 2023, 85, 103858. [Google Scholar]
| Disclaimer/Publisher’s Note: The statements, opinions and data contained in all publications are solely those of the individual author(s) and contributor(s) and not of MDPI and/or the editor(s). MDPI and/or the editor(s) disclaim responsibility for any injury to people or property resulting from any ideas, methods, instructions or products referred to in the content. |
© 2023 by the authors. Licensee MDPI, Basel, Switzerland. This article is an open access article distributed under the terms and conditions of the Creative Commons Attribution (CC BY) license (https://creativecommons.org/licenses/by/4.0/).


