Article

Understanding Innovation Resistance on the Use of a New Learning Management System (LMS)

1
Faculty of Liberal Education, Seoul National University, Seoul 08826, Republic of Korea
2
Division of Convergence Talent Development, College of Future Convergence, Pukyong National University, Busan 48513, Republic of Korea
*
Author to whom correspondence should be addressed.
Sustainability 2023, 15(16), 12627; https://doi.org/10.3390/su151612627
Submission received: 5 June 2023 / Revised: 14 August 2023 / Accepted: 16 August 2023 / Published: 21 August 2023

Abstract

:
As innovation barriers and inertia work against the application of new technologies in educational settings, reducing them will help overcome innovation resistance and increase the acceptance and adoption of this technology. This study aims to examine what types of innovation barriers and inertia there are (as perceived by users), how the types of users who perceive innovation resistance could be divided, and which characteristics differ depending on the type of user in a situation where a university adopts a new LMS as a learning technology tool for innovation. This study derived risk barriers, usage/value/tradition barriers, image barriers, and inertia as four factors that affect innovation resistance. The results of the study suggest that new LMS-related personalized support and training programs should be developed according to the specific needs and characteristics of each user cluster.

1. Introduction

New technologies are being rapidly introduced to educational settings, and the introduction of these technologies is contributing to educational change and innovation. With the advent of new technologies or media in the educational setting, researchers have been optimizing end-point usage, such as Davis’ [1,2] Technology Acceptance Model (TAM), in terms of acceptance to promote the use of new technologies. Davis’ [1,2] TAM not only briefly describes users’ perceived ease of use and the impact of perceived ease of use on technical containment but also the transformation or fusion of models with other models. In order to find out whether users accept a specific technology or innovation in the process of spreading new and innovative technologies, most previous studies have used or partially modified the TAM. Due to its ease of use, many researchers have utilized this model for more than 30 years in various studies [3]. These studies have explored factors that influence the intention to use, under the assumption that the intention to use proposed in the technology acceptance model predicts actual use. If it is not possible to predict, the meaning of the results presented in previous studies will decline [4]. The TAM studies tend to focus on factors that drive the acceptance and use of technology, but they often overlook the crucial aspect of resistance to change. The introduction of an innovative technology might face resistance from users or stakeholders due to concerns about compatibility with existing systems or perceived threats to traditional methods.
The use of the latest innovative technology is also expanding in the field of education, and a majority of research is being conducted from the perspective of accepting innovation, such as the intention to use such technology. However, while these studies may briefly help explain the spread of innovative new educational technologies, they have considerable difficulty in properly explaining user resistance to these technologies by potential users. However, a model of innovation resistance, with in-depth research on user resistance to new technology, does explain this resistance. Criticizing existing studies that focus on innovation adoption and diffusion as suffering from innovation bias, Ram [5] first proposed an innovation resistance model. The innovation resistance model refers to the idea that individuals may resist or hesitate to adopt new technologies or systems because of a variety of factors, such as uncertainty, lack of familiarity, fear of change, and perceived complexity [6,7]. Since resistance can also be seen as a process for acceptance, innovation resistance is not a concept opposite to acceptance but a concept of attitude that emerges in the process of acceptance [5]. According to Zaltman and Wallendorf [8], innovation resistance arises from change caused by innovation because resistance refers to all actions toward maintaining the status quo under pressure for change. Also, Rogers [9] argued that acceptance and diffusion occur when this resistance to innovation is subdued. Rogers [9] regarded innovation as an idea, product, process, or service that individuals or organizations accept as new. In other words, innovation resistance to a new educational technology that is adopted or accepted is not against the new educational technology itself, but individual or organizational support measures are needed to accommodate the new educational technology.
Ram and Sheth [10] suggested there are five barriers to innovation, including usage barriers, value barriers, risk barriers, tradition barriers, and image barriers. Usage barriers, value barriers, and risk barriers can be categorized as functional barriers, while tradition barriers and image barriers can be categorized as psychological barriers [9,11,12]. Among these barriers, the usage barrier is the degree to which you perceive that users have to invest effort and time to use it. The usage barrier can increase as the number of behavioral changes requested by users increases, and it can also increase when the innovation is inconsistent with previous experiences or desires [12,13]. The value barrier is the degree to which a product is perceived to have low use value, and the risk barrier is the degree to which it is perceived to have risk factors. In the case of value barriers, no matter how innovative a service may be, it can occur when users do not recognize the value of the service [10,14,15]. In particular, the value barrier is related to the perceived usefulness of the TAM and to the relative advantage of the innovation resistance model [12]. The risk barrier occurs when the uncertainty of innovation and unpredictable side effects of innovation are recognized (Joachim et al., 2018). Furthermore, the tradition barrier is the degree to users’ perceptions of the inability to enhance efficacy, and the image barrier is the degree to users’ negative attitudes towards the technology. In the case of tradition barriers, they can increase when the innovation requires a departure from the environment or traditions to which the user is currently accustomed and can also increase when the innovation requires behavior that is contrary to social norms or family values [10,12,15]. Image barriers can be reduced when humorous elements are added to innovation and can be subdued when combined with positive public images or brands with positive images [10,15]. In many studies, these sub-barriers to innovation have been found to exist even in online and mobile system environments. For example, in a study examining innovation barriers to online banking systems [16], users perceived usage barriers, value barriers, risk barriers, tradition barriers, and image barriers in the environment using the systems. Lian and Yen [15] investigated innovation barriers for online shopping systems and found that users perceive usage barriers, value barriers, risk barriers, tradition barriers, and image barriers differently depending on their age in the system environments. According to a study conducted by Jung [17], who looked at user behavior in a booth recommendation system environment, these functional and psychological barriers increased resistance to innovation. In a study by Laukkanen [12] examining the intention to accept mobile banking systems, it was found that value barriers and image barriers increased innovation resistance and acted as obstacles to acceptance.
In addition to these barriers, there is inertia as another major component of innovation resistance. Inertia can be defined as a user’s propensity and attitude to maintain the status quo [18]. Inertia is a concept that is different from the loyalty of continuously using a specific service based on user preference. Users with high inertia show a tendency to continue the current state even if the current state is not satisfactory [19]. Inertia can be divided into two distinct measures: first, cognitive inertia, and second, affective inertia [20,21,22]. In a study by Lin et al. [21], affective inertia refers to the degree of comfort in continuously using a service, and cognitive inertia refers to the degree to which a person intends to continuously use a service even if the currently used service is not the most efficient service. Polites and Karahanna [22] mentioned that cognitive inertia refers to the tendency to consciously continue the current service even if it is not the best service, and emotional inertia refers to the tendency to continue the current state because the current service is comfortable and good. Users with a high level of inertia will continue to use existing services regardless of switching costs such as money, time, and effort. On the other hand, consumers with a low level of inertia may have a desire to change the service due to dissatisfaction with the service they are currently using and tend to pursue variety more than consumers with a high level of inertia [19]. Studies looking at inertia in an innovative service environment have shown that inertia has a negative effect on the relative advantage of a new system, perceived ease of use, and intention to use the system [22], while inertia has a positive effect on loyalty, satisfaction, and repeat purchases for previous services [21]. In a study on a cloud computing system, switching costs were found to be an antecedent factor that increased inertia, and inertia was identified as a negative factor that decreased the intention to accept the system [23].
As innovation barriers and inertia exist against the application of new technologies in educational settings, reducing them will help overcome innovation resistance and increase the acceptance and adoption of this technology. Among educational technologies, the Learning Management System (LMS) is a typical solution for learning plans, transmission, and management [24]. LMS are effective tools for enhancing learning outcomes [25] and can contribute to the success of educators by incorporating student orientation materials and easily accessible resources [26]. Incorporating sustainability into the LMS represents a valuable educational approach aimed at continuously enhancing educational effectiveness and fostering interconnectedness among various stakeholders within the online learning environment and the ecosystem of educational institutions. Considering sustainability within the online education environment, one of the most significant challenges both for students and faculty members revolves around adapting to the LMS and leveraging it into teaching and learning.
The LMS can record user behavior, that is, it can collect basic behavioral units such as button clicks and page navigation, as well as record reading, writing, examination, learning activity, and communication activity [27]. By collecting and analyzing learner data from education, it is possible to prescribe methods to improve the learner’s achievement through the analyzed results [28]. In this way, studies on innovative LMS that collect and analyze learners’ data, predict their academic emotions and achievements, and provide prescriptions have been actively conducted recently. Despite the advantages of these new and innovative LMS, the transition to a new LMS is anticipated to cause significant stress for all faculty members, including adjunct teachers, and is expected to pose a high risk of disruption in the learning process for students, as they would be required to independently familiarize themselves with university resources to adapt to the new system [29]. Judge and Murray [29] conducted a project to provide a unified and consistent user interface in the new LMS, Canvas™. Through the project, standardized template courses in Canvas™ specifically for the hybrid program were available to the adjunct, part-time, and full-time faculty as they learned to use the developed LMS, and two faculty Canvas™ “super users” to serve as educators and resource persons were trained. After the project’s implementation, the survey feedback indicated a generally favorable reception of the shift to Canvas™.
When it comes to the usage of an LMS among university students and faculty members, the innovation resistance theory can play a significant role in determining whether the students will adopt and use the system or not. The three main factors are the perceived complexity, the lack of perceived benefits, and the lack of training and support in using a new LMS [9,30,31], all of which may contribute to innovation resistance towards it. Rogers [9]—who argued that the lower the complexity, the faster the innovation will be accepted—defined innovation complexity as the extent of difficulty to understand and use this change and divided it as follows: an idea complexity that is difficult to understand and an execution complexity that is difficult to execute. The introduction of an innovative LMS might face resistance from faculty, teaching assistants, or students due to uncertainty about its effectiveness, learnability of usage, compatibility with existing LMS, or perceived threats to traditional teaching and learning methods as well as concerns about the idea complexity and execution complexity.
According to the research results of Jung and Jang [32], a negative relationship was found between innovation resistance and sustained use intention. This means that it is important to manage innovation resistance when introducing a new technology such as a new LMS. If a university wants to introduce a new LMS, it should be concerned with these three factors and induce users’ innovation resistance to be low through positive recognition or perception of the utility value of the system. In the case of the LMS, there is a strong resistance to the introduction of new LMS technologies and User Interface (UI) from the perspective of ease of use, as they are used in a variety of academic fields, from instructors to learners of various ages and characteristics. It is not easy to change the LMS due to user resistance to innovation, along with stability and cost issues of academic administration related to credits and degrees [33]. In order to introduce an innovative LMS, it is necessary to fundamentally understand the characteristics of the user population who are holding back the acceptance of such a learning management system and the factors that influence the resistance to the LMS [11]. Therefore, this study aims to examine what types of innovation resistance including innovation barriers and inertia are perceived by users, how the types of users who perceive innovation resistance could be divided, and which characteristics differ depending on the type of users in a situation where a university adopts a new LMS. The ultimate purpose is to find out what kind of support should be provided for each group of users. To achieve these purposes, we posed three research questions as follows:
  • What sub-variables of innovation resistance are perceived by users in the context of a university adopting a new LMS?
  • How can users be categorized based on their perception of innovation resistance when using a new LMS?
  • What are the characteristics of demographics and support strategies for using a new LMS that differ among the user groups?
We anticipated that the results of this study would provide practical interventions and actionable strategies that could turn users’ resistance into acceptance in educational institutions considering conversion to the new and innovative LMS.

2. Methods

2.1. Participants

The participants in the survey were 202 undergraduate students, 36 faculty members, and 29 teaching assistants at a university in the metropolitan area of Korea. They were contacted via email and were asked to participate in the online survey. During the survey, all participants were required to give their informed consent and were informed that personal information would be processed in a way that could not identify a specific person. Data collected from 10 people (5 undergraduates, 2 faculty members, and 3 teaching assistants) who did not consent or complete all survey questions were excluded from data analysis. Based on eligibility screening, only 257 people were eligible for this study. Finally, 197 undergraduates, 34 faculty members, and 26 teaching assistants (51% female and 49% male) were selected as the study subjects. The demographic characteristics of the participants in this study are presented in Table 1.

2.2. Research Instruments

The new LMS used in this study is a Canvas™-based system and was operated for all courses in the summer semester of 2022. The LMS used until the first semester of 2022 was a Moodle-based system with a different source from this research tool. The questionnaire items shown in Table 2 were developed to investigate the perception of innovation barriers and inertia of users in using LMS, to which learning analytics were applied. The questionnaire was revised and supplemented through continuous discussion by a research team composed of experts who have research expertise as edutech designers and developers of LMS. The questionnaire items relate to variables of innovation barriers and inertia.
According to the Likert 5-point scale, the response results to the question asking about the “innovation barriers” and “inertia”, which are variables in this study, range from 5: feel barriers/inertia very much (very dissatisfied) to 1: do not feel barriers/inertia at all (very satisfied). The response results to negative questions were reverse coded. Since several items were used to measure each construct, reliability was verified through Cronbach’s alpha coefficient to determine whether each item to measure the same concept had internal consistency.
Innovation barriers were classified into functional barriers (usage, value, and risk) and psychological barriers (tradition and image) by referring to studies by Ram and Sheth [10]; Joachim, Spieth, and Heidenreich [14]; and Laukkanen [12]. Among the functional barrier factors, the first barrier—usage barrier—was defined as the degree to which users perceived that they needed to invest effort and time to use the LMS. There were five questions related to the usage barrier, and the reliability evaluation of the instrument with Cronbach’s alpha resulted in 0.881. Second, the value barrier was defined as the level of perception that the use value of the LMS would be low. There was a total of 3 value barrier questions, and the result of reliability analysis was 0.890. Third, the risk barrier was defined as the degree to which the LMS was recognized to have risk factors. There were three questions related to the risk barrier, and the instrument obtained Cronbach’s alpha of 0.855. Looking at the psychological barrier factors, the tradition barrier was defined as the degree to which the LMS was perceived to not provide improved efficacy. There were three questions related to the tradition barrier, and the value of Cronbach’s alpha was found to be 0.798. The image barrier was defined as the degree to which the participants were perceived to have a negative attitude toward the LMS. The image barrier value of the Cronbach’s alpha was 0.824 as a result of the reliability analysis with a total of three questions.
Inertia referred to the study of Lin, Huang, and Hsu [21] and was subdivided into affective inertia and cognitive inertia. Affective inertia was defined as the degree of emotional attachment to the currently used LMS, and cognitive inertia was defined as the degree of willingness to continue using the currently used LMS. There were two affective inertia questions in total, and the reliability analysis result was 0.767. Cognitive inertia totaled two questions, and reliability analysis indicated 0.888.

2.3. Research Procedure

The 21 question items in Table 2 were conducted for instructors, learners, and teaching assistants who used the new LMS for the summer semester classes in 2022. Then, the survey results were analyzed according to the following procedure.
First, factor analysis was performed to identify the types of barriers to innovation and inertia, and the reliability between the variables and items classified according to the results of the factor analysis was confirmed. Unlike the results of previous studies, an exploratory factor analysis was conducted on the assumption that the subjects of this study could perceive innovation barriers and inertia, and the varimax method was used. In addition, categorical regression analysis was performed to confirm how the factors derived through factor analysis affect satisfaction with support in using the new LMS. At this time, 245 of the total 257 responses, excluding 24 with a dependent variable value of 0, were targeted.
Next, users were classified through cluster analysis according to their level of perceiving innovation barriers to LMS and inertia. For this purpose, a dendrogram in the form of a cluster tree was constructed primarily through Ward linkage-based Hierarchical Cluster Analysis, and the tree was cut based on the height of 10, and 4—the number of truncated branches—was set as the number of clusters. Next, through K-means cluster analysis, the characteristics of innovation barriers and inertia were identified in each of the four clusters, and the number of users in each cluster was confirmed.
Finally, based on the above clusters, cross-tabulation analysis was conducted to analyze the differences in the characteristics of user and course as well as to support content and methods for using LMS and satisfaction. User characteristics were set as social status, gender, age group, field of study, Canvas™ experience, and number of courses, and course characteristics were set as subject category and subject field. In addition, the supports to use the LMS were set based on online tutors, regulations and guidelines, education, technical support, information and publicity, and the support methods in using the LMS were set to phone, e-mail, bulletin board, FAQ, manual, and human resources. If the number of cells with an expected frequency of less than 5 was 25% or more, Fisher’s exact test was performed, not an asymptotic test.

3. Results

3.1. Factor Analysis and Regression Analysis Results: Classification of Innovation Barriers and Inertia Factors for Using the New LMS

As a result of factor analysis, unlike previous studies of seven factors, it was grouped into three top factors, and KMO = 0.941 and Bartlett χ2 = 4444.330 (p = 0.000), indicating that the assumption of factor analysis was satisfied.
As shown in Table 3, factor 1 consisted of barriers to use, barriers to value, and barriers to tradition, which were recognized as similar factors in introducing a new LMS. Related to factor 2, affective inertia and cognitive inertia belonging to inertia were not distinguishable, and image barriers were recognized as the same factor as consumer inertia rather than innovation barriers. In addition, factor 3, the risk barrier, was recognized as a separate factor, unlike other barriers and inertia, in the introduction of a new LMS; the risk barrier is distinguished from other barriers and inertia and identified as a barrier that is particularly recognized by users.
As a result of analyzing the reliability according to the results of factor analysis, the level of trust was quite high, ranging from 0.798 (factor 3: risk barrier) to 0.949 (factor 1: usage barrier + value barrier + tradition barrier). After analyzing the characteristics of each factor and naming them, factor 1 is use/value/tradition barriers, factor 2 is risk barriers, and factor 3 is image barriers and inertia.
Factor 1 is use/value/tradition barriers, which include items related to the perceived usefulness and ease of use of the new LMS. The factor loadings for this factor range from 0.725 to 0.817, indicating that the items are highly correlated with each other and contribute significantly to the factor. The Cronbach’s alpha coefficient for this factor is 0.949, indicating high internal consistency among the items.
Factor 2 is risk barriers, which include items related to the perceived risks associated with using the new LMS. The factor loadings for this factor range from 0.136 to 0.171, indicating that the items are weakly correlated with each other and contribute less significantly to the factor. The Cronbach’s alpha coefficient for this factor is 0.798, indicating moderate internal consistency among the items.
Factor 3 is image barriers and inertia, which include items related to the perceived image and affective responses associated with using the new LMS. The factor loadings for this factor range from 0.262 to 0.702, indicating that the items are moderately correlated with each other and contribute moderately to the factor. The Cronbach’s alpha coefficient for this factor is 0.920, indicating high internal consistency among the items.
We analyzed how the three factors, innovation barriers, and inertia, affect satisfaction with support for using the new LMS through a categorical regression analysis. Table 4 presents the results of the categorical regression analysis conducted to investigate how innovation barriers and inertia affect satisfaction with support for using the new LMS. The dependent variable in the analysis is satisfaction, and the independent variables are the three factor scores obtained from the factor analysis conducted earlier. The results show that all three factor scores had statistically significant values, with p-values of 0.000 for all three scores. This indicates that the model is statistically significant and explains the relationship between the independent and dependent variables to a significant extent.
Factor score 1 had the greatest impact on satisfaction with support for using the new LMS, with a standardized coefficient of 0.687. Factor score 2 had a smaller impact on satisfaction, with a standardized coefficient of 0.373. Factor score 3 had the smallest impact on satisfaction, with a standardized coefficient of 0.128. All three factors had statistically significant values, and satisfaction decreased as the values of the innovation barrier and inertia increased. Among them, factor 1 had the greatest impact on satisfaction with the support for using the new LMS, followed by factor 2 and factor 3.

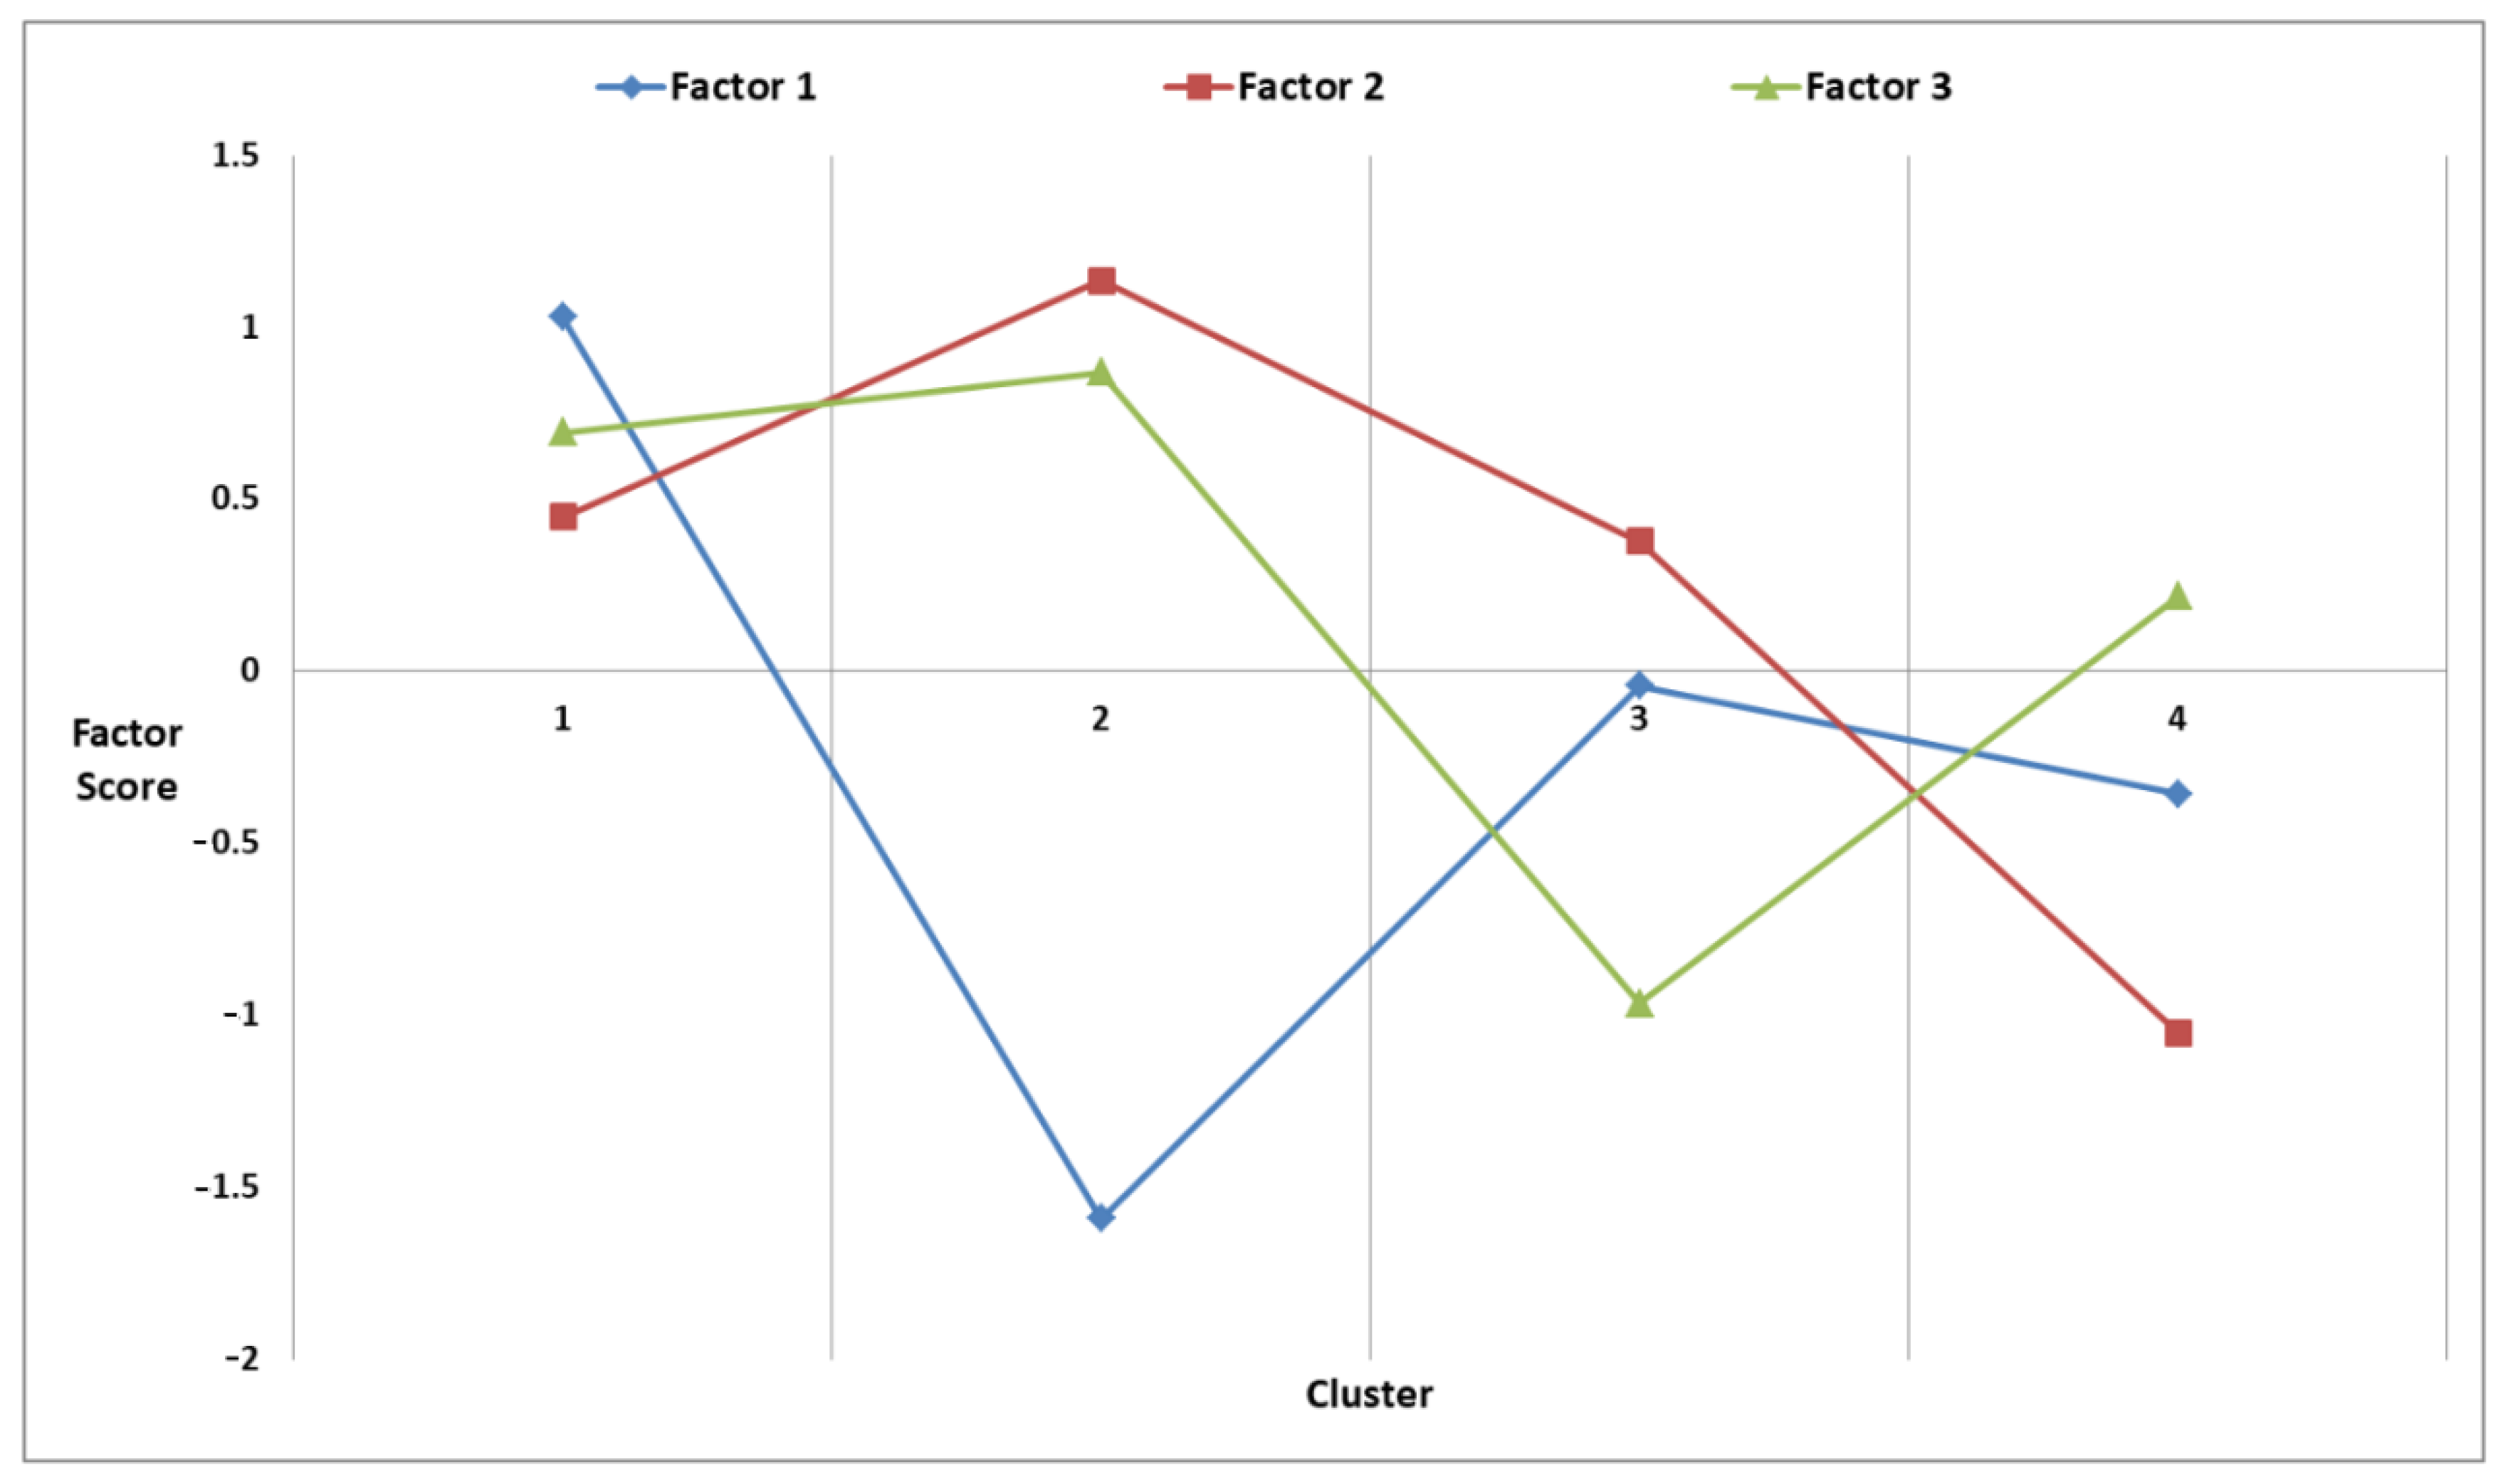
3.2. Results of Cluster Analysis: Classification of Users According to Their Awareness Levels of Innovation Barriers and Inertia for the New LMS

Four types of user groups were derived from centering on the three types of innovation barriers and inertia through the cluster analysis. The results are shown in Table 5. Looking at the factor score for each cluster, if the factor score is greater than 0, it indicates a higher score than the average, otherwise, it indicates a lower one. Since the factor score is the average of the standardized scores, not the original data, a criterion for indicating the size is needed. In this study, the value range was set from −1.60 to 1.60, based on the absolute value of −1.589. Considering the 5-point Likert scale, 1 (−1.60~−0.96) was set as very low, 2 (−0.96~−0.32) as low, 3 (−0.32~0.32) as medium, 4 (0.32~0.96) as high, and 5 (0.96~1.6) as very high.
Considering the characteristics and relationships of the four clusters’ factors derived from the cluster analysis results, cluster 1 was named “Innovation-Resistant Type” and cluster 4 was named “Innovation-Accepting Type”. In addition, cluster 2 and cluster 3, which have complex characteristics of factors, were named “Innovation Barriers and Inertia Cognitive Type” 1 and 2, based on factor 3 showing the most difference.
Figure 1 is a visual representation of the relative values of factor scores for each cluster shown in Table 5 in order to clearly compare them.

3.3. Cross-Tabulation Analysis Results: Differences in Group Characteristics According to Level of Innovation Barriers and Inertia for the New LMS

3.3.1. Differences in Users’ Demographic Characteristics and Characteristics of Courses Taken by Cluster

In this study, a cross-tabulation analysis was conducted to examine the differences in the demographic characteristics of users and the characteristics of the courses taken by them according to the level of recognition of innovation barriers and inertia. Table A1 presents the cross-tabulation analysis results of the differences in demographic characteristics of users and characteristics of courses taken according to the awareness levels of innovation barriers and inertia. The table shows the four clusters of users identified in the study: cluster 1 (innovation-resistant type), cluster 2 (innovation barriers and inertia cognitive type 1), cluster 3 (innovation barriers and inertia cognitive type 2), and cluster 4 (innovation-accepting type). It also shows the demographic characteristics of the users in each cluster, such as their identity (faculty, undergraduate student, or teaching assistant) and the number of users in each cluster.
As shown in Table A1, the results of the chi-square test (χ2) and the post hoc test were used to determine whether there were significant differences in the demographic characteristics of users and the characteristics of courses taken by them among the four clusters. The results indicate that there was no significant difference between the groups in all items except for gender. The post hoc test did not reveal any significant differences in the demographic characteristics of users and the characteristics of courses taken by them among the four clusters.

3.3.2. Differences in Supporting Methods in Using the New LMS by Cluster

Table A2 presents the results of the cross-tabulation analysis conducted to investigate the differences in support details for using a new LMS according to awareness levels of innovation barriers and inertia. The table provides information on the four clusters derived from the cluster analysis, as well as the chi-square test results for each support detail.
The results show that there are some differences in the use of support details among the four clusters. For instance, in the use of online tutors, cluster 1 (innovation-resistant type) had the highest percentage of users who did not use this support detail (43.9%), while cluster 4 (innovation-accepting type) had the highest percentage of users who used this support detail (61.4%). In the use of regulations and guidelines, cluster 1 had the highest percentage of users who did not use this support detail (33.3%), while cluster 4 had the highest percentage of users who used this support detail (39.5%). The chi-square test results for these support details were statistically significant, indicating that the differences between the clusters were significant.
As a result of cross-tabulation analysis to examine the difference in support details to use the new LMS according to awareness levels of innovation barriers and inertia, online tutors, regulations and guidelines, and training are in the order of cluster 2–cluster 4–cluster 3–cluster 1, and technical support, guide, and publicity appeared in the order of cluster 2–group 3–group 4–group 1, but there was no statistically significant difference among the groups. However, it was found that there was a difference between cluster 1 and clusters 2, 3, and 4 in the satisfaction of users who actually used it.

3.3.3. Differences in Supporting Details in Using the New LMS by Cluster

Table A3 in the paper presents the results of the cross-tabulation analysis conducted to investigate the differences in support methods of using the new LMS according to the levels of perceiving innovation barriers and inertia. The table provides information on the four clusters derived from the cluster analysis, as well as the chi-square test results for each support method.
Contrary to the above, statistically, there appears to be a difference between clusters in terms of the support methods for the effective use of the new LMS. In all six items, cluster 1 (innovation-resistant type) was found to be lower than clusters 2 (innovation barriers and inertia cognitive type 1) and 3 (innovation barriers and inertia cognitive type 2), and additionally, e-mail inquiries, usage inquiry bulletin boards, and other manpower utilization were higher in cluster 2 than cluster 4 (innovation-accepting type). In the use of phone inquiries, cluster 1 (innovation-resistant type) had the highest percentage of users who did not use this support method (72.7%), while cluster 2 (innovation barriers and inertia cognitive type 1) had the highest percentage of users who used this support method (68.2%).
In terms of the satisfaction of the users who actually used phone inquiries, e-mail inquiries, and usage inquiry bulletin boards, it can be seen that cluster 1 is different from clusters 2 and 3, and cluster 2 is different from cluster 4. In the satisfaction with using FAQ and the manual, cluster 1 appeared different from clusters 2 and 4, and cluster 2 appeared different from cluster 3. In satisfaction with other personnel, cluster 1 appeared different from clusters 2 and 3.

4. Discussion and Conclusions

Based on the findings of this study, it could be concluded that there are different clusters (groups) of users with varying levels of resistance to the innovation of new LMS. When introducing a new LMS into a university, it means that there are various types of innovation resistance among users. This study assumed innovation barriers and inertia as factors influencing innovation resistance. As a result of exploratory factor analysis, risk barriers were found to be separate and independent factors specially recognized by users, while usage barriers, value barriers, and tradition barriers were identified as similar factors. In the case of inertia, affective inertia and cognitive inertia were not distinguished, and image barriers were recognized as a kind of inertia, not innovation barriers, and image barriers, emotional inertia, and cognitive inertia were found to be similar factors. While Joachim et al. [14], Laukkanen [12], and Ram and Sheth [10] used innovation barriers as barriers, value barriers, risk barriers, tradition barriers, and image barriers, and Lin et al. [21] divided inertia into affective inertia and cognitive inertia, this study derived risk barriers, use/value/tradition barriers, image barriers, and inertia as three factors contributing to innovation resistance. The results of this study suggest that factor score 1, which represents use/value/traditional barriers, has the greatest impact on satisfaction, while factor score 3, which represents image barriers and inertia, has the smallest impact. Moreover, it was investigated that the higher the value of the sub-barrier or inertia, the lower the satisfaction with the new LMS. Therefore, it is necessary to find ways to reduce innovation barriers and inertia that may occur among users when introducing and adopting new technologies like LMS. This study emphasizes that various strategies may be needed to overcome the differing types of innovation barriers and inertia related to innovation resistance. Risk barriers need to be resolved through risk reduction measures such as providing more information and transparency about new technologies, while use/value/tradition barriers require a strategy that focuses on demonstrating the benefits of the new technology and how it aligns with the values and needs of its users.
In accordance with the results of this study, online tutors, regulations and guidelines, and training related to the new LMS were the most important in cluster 2 (innovation barriers and inertia cognitive type 1), followed by cluster 4 (innovation-accepting type) and cluster 3 (innovation barriers and inertia cognitive Type 2) in order. Technical support, guidance, and publicity are shown to be important in cluster 2, cluster 3, and cluster 4. In this study, it was found that there was a difference between the innovation-resistant type (cluster 1) and the other clusters in terms of satisfaction with the new LMS and that there was also a difference in how to use the new LMS effectively and efficiently. The results of this study suggest that new LMS-related personalized support and training programs should be developed according to the specific needs and characteristics of each user cluster. Therefore, customized support strategies such as technical support, guidance, and publicity for cluster 2 and online tutors, regulations, guidelines, and training for cluster 4 should be prepared. Through the above analysis results for each cluster, the characteristics of users, courses, and support according to the cluster were confirmed, as well as the characteristics of cluster 2 and cluster 3 were clearly identified—both of which appeared as innovation barriers and inertia cognitive type and were ambiguous to distinguish between the two in the distinction during cluster analysis. In addition, as a result of categorical regression analysis, factor 1 > factor 2 > factor 3 were found to have more influence in the order. Also, it was confirmed that users in cluster 2 with low factor 1 actively participated in the support for using the new LMS and had high satisfaction.
In this study, a cross-tabulation analysis was conducted to examine differences in group characteristics according to the level of innovation barriers and inertia for the new LMS. First, the cross-tabulation analysis results of the differences in the demographic characteristics of users and characteristics of courses, taken according to the awareness levels of innovation barriers and inertia, suggest that there are no significant differences in the demographic characteristics of users and the characteristics of courses taken by them among the four clusters identified in the study. This finding indicates that the perception of innovation resistance is not related to the demographic characteristics of the users or the characteristics of courses taken by them. The finding is consistent with previous research that suggests that the perception of innovation resistance is related to the individual’s cognitive and affective factors rather than their demographic characteristics. Second, the results of the cross-tabulation analysis to examine the difference in support details to use the new LMS, according to awareness levels of innovation barriers and inertia, suggest that there are some differences in the use of support details among the four clusters, but the significance of these differences varies depending on the support detail. The findings can be useful for designing targeted interventions to address the specific needs of each cluster and improve the overall support for using the new LMS. Lastly, the results of the cross-tabulation analysis conducted to investigate the differences in support methods of using the new LMS, according to levels of perceiving innovation barriers and inertia, report that there are some differences in the use of support methods among the four clusters, and the significance of these differences varies depending on the support method. The findings can be useful for designing targeted interventions to address the specific needs of each cluster and improve the overall support for using the new LMS.
The perceived innovation resistance, including innovation barriers and user inertia among university students, in relation to adopting a new LMS will negatively impact their sustained use intention. Different types of users with varying characteristics can be categorized based on their level of innovation resistance and providing tailored support to address their specific concerns will lead to higher acceptance and adoption rates of the new LMS. This study confirmed that based on the innovation resistance model, if customized support was provided by categorizing users according to LMS innovation resistance factors and levels, it could have a positive effect on adoption intentions.
This study also highlights the importance of addressing affective and cognitive barriers and inertia to innovation resistance that can be achieved through effective communication and change in management strategies. Overall, this study provides useful insights into the factors contributing to innovation resistance and the specific customized support needs of different user clusters. These results confirm the need to properly prepare strategies to overcome innovation resistance when introducing new technologies in the context of education. Therefore, the results of this study can help develop effective strategies for adopting and implementing new technologies in educational settings. Further, understanding the different types of innovation barriers and inertia that users may face can help organizations devise effective strategies to facilitate technology adoption and enhance its benefits to enable technology implementation. It raises the question of whether the independence of risk barriers and similarities between usage barriers, value barriers, tradition barriers, image barriers, affective inertia, and cognitive inertia are unique to LMS adoption or common to other technology adoption.
In deriving the results of this study, there were the following limitations, and future research directions to overcome these limitations are presented. First, in this study, the innovation resistance of the new LMS, which is an innovative technology, was studied with a focus on Korean universities. Due to the unique characteristics of Korea and its universities, it is difficult to generalize support measures to overcome innovation resistance. Therefore, it is necessary to investigate various countries, various school levels, and various users in future research. Also, it is needed to confirm whether it is applicable only to higher education institutions such as universities or other educational institutions such as elementary, junior high, and high schools. Future research is needed to investigate these issues to provide a more comprehensive understanding of users’ innovation resistance in a variety of educational and technological contexts.
Second, the data in this study were collected through self-reporting perceptions focusing on actual users of Canvas™, a new LMS. In other words, it may be meaningful that data collection was made in a more realistic situation due to the respondents who actually used it. While we focused on examining perceived barriers in the context of adopting a new LMS, Canvas™, future studies are required to link these perceptions to real usage data in order to provide a more comprehensive understanding of the relationship between perceived barriers and actual practices. By investigating the alignment between declared barriers and their impact on practical usage, they would be able to bridge the gap between perceived obstacles and their tangible effects on users’ engagement with the new LMS. These improvements would indeed strengthen the contribution of our study by shedding light on the practical implications of the identified barriers and guiding the customization of support strategies for different user groups.
Third, in this study, the innovation resistance model was used to classify users to understand the fundamental reasons for resistance to technological change. This innovation resistance model identifies multiple dimensions of resistance, including users’ cognitive, emotional, and behavioral barriers. By segmenting users based on these dimensions, the model provides insight into individual attitudes and intentions related to technology adoption. In other words, the innovation resistance model aims to lead to a successful implementation of new technologies if it provides customized support by identifying barriers and obstacles that prevent individuals from embracing technological change. On the other hand, TAM aims to predict user acceptance by identifying key factors influencing individual intention to use the technology, actual adoption, and usage patterns. Therefore, it is important to adopt an integrated approach to comprehensively address user resistance to technology adoption by integrating TAM and other theories. In future studies, it is necessary to seek multifaceted measures to increase the intention to adopt a new LMS and to continuously use it through a more integrated approach.

Author Contributions

Conceptualization, S.K. and T.P.; Data curation, S.K.; Formal analysis, T.P.; Investigation, T.P.; Methodology, S.K.; Software, S.K.; Validation, S.K. and T.P.; Resources, T.P.; Supervision, S.K.; Writing—original draft, S.K. and T.P.; Writing—review and editing, S.K. and T.P.; Visualization, S.K.; Project administration, S.K. and T.P.; Funding acquisition, S.K. All authors have read and agreed to the published version of the manuscript.

Funding

This research was supported by the Faculty of Liberal Education at Seoul National University in the form of a survey participation fee (Online Learning-2137).

Institutional Review Board Statement

Not applicable.

Informed Consent Statement

Informed consent was obtained from all subjects involved in the study.

Data Availability Statement

Restrictions apply to the availability of these data. Data was obtained from the Faculty of Liberal Education at Seoul National University and are available from the first author with the permission of the Faculty of Liberal Education at Seoul National University.

Acknowledgments

We would like to express our appreciation to the Faculty of Liberal Education at Seoul National University for their support in the research.

Conflicts of Interest

The authors declare no conflict of interest.

Appendix A

Table A1. Cross-tabulation analysis results 1: differences in demographic characteristics of users and characteristics of courses taken according to the awareness levels of innovation barriers and inertia.
Cluster 1
(Innovation-Resistant Type)
Cluster 2
Innovation Barriers and Inertia Cognitive Type 1
Cluster 3
Innovation Barriers and Inertia Cognitive Type 2
Cluster 4
Innovation-Accepting Type
χ2Post
IdentityFaculty8 (12.1)4 (18.2)12 (14.0)10 (12.0)3.513-
TA5 (7.6)1 (4.5)8 (9.3)12 (14.5)
Student 53 (80.3)17 (77.3)66 (76.7)61 (73.5)
GenderMale43 (32.8)11 (8.4)45 (34.4)32 (24.4)10.503 *1–4
Female 23 (18.3)11 (8.7)41 (32.5)51 (40.5)
Age groupUnder 20s 56 (26.3)17 (8.0)73 (34.3)67 (31.5)10.714-
30s3 (12.0)3 (12.0)6 (24.0)13 (52.0)
40s1 (20.0)1 (20.0)2 (40.0)1 (20.0)
Over 50s 5 (42.9)1 (7.1)5 (35.7)2 (14.3)
MajorHumanities and Social Sciences21 (18.1)9 (7.8)44 (37.9)42 (36.2)8.841-
Science and Engineering 35 (32.1)10 (9.2)35 (32.1)29 (26.6)
Others 10 (31.3)3 (9.4)7 (21.9)12 (37.5)
Experience using the new LMS No 60 (90.9)17 (77.3)72 (83.7)72 (86.7)8.118-
Yes: Out of class6 (9.1)5 (22.7)10 (11.6)11 (13.3)
Yes: Classes at other institutions0 (0.0)0 (0.0)4 (4.7)0 (0.0)
No. of coursesOne 35 (53.0)11 (50.0)50 (58.1)58 (69.9)5.748-
Two or more courses31 (47.0)11 (50.0)36 (41.9)25 (30.1)
Classification of subjects Liberal Arts (Undergraduate)42 (63.6)15 (68.2)55 (64.0)57 (68.7)2.830-
Major and Others (Undergraduate)19 (28.8)5 (22.7)28 (32.6)21 (25.3)
Graduate school5 (7.6)2 (9.1)3 (3.5)5 (6.0)
Academic field Humanities and Social Sciences45 (68.2)14 (63.6)59 (68.6)58 (69.9)2.317-
Science and Engineering 18 (27.3)6 (27.3)21 (24.4)17 (20.5)
Others 3 (4.5)2 (9.1)6 (7.0)8 (9.6)
Note: * p < 0.05.
Table A2. Cross-tabulation analysis results 2: differences in support details for using a new LMS according to awareness levels of innovation barriers and inertia.
Cluster 1
(Innovation-Resistant Type)
Cluster 2
Innovation Barriers and Inertia Cognitive Type 1
Cluster 3
Innovation Barriers and Inertia Cognitive Type 2
Cluster 4
Innovation-Accepting Type
χ2Post
Whether or not to use Online tutorUnused 29 (43.9)5 (22.7)37 (43.0)32 (38.6)3.558-
Used 37 (56.1)17 (77.3)49 (57.0)51 (61.4)
Regulations and guidelinesUnused 22 (33.3)3 (13.6)18 (20.9)17 (20.5)5.499-
Used 44 (66.7)19 (86.4)68 (79.1)66 (79.5)
Training Unused 26 (39.4)5 (22.7)28 (32.6)23 (27.7)3.246-
Used 40 (60.6)17 (77.3)58 (67.4)60 (72.3)
Technical supportUnused 26 (39.4)4 (18.2)24 (27.9)28 (33.7)4.371-
Used 40 (60.6)18 (81.8)62 (72.1)55 (66.3)
Guide and publicity Unused 15 (22.7)2 (9.1)11 (12.8)18 (21.7)4.546-
Used 51 (77.3)20 (90.9)75 (87.2)65 (78.3)
Satisfaction Online tutorVery satisfied0 (0.0)4 (18.2)4 (4.7)4 (4.8)60.887 ***1–2·3·4
Satisfied 3 (4.5)8 (36.4)16 (18.6)19 (22.9)
Neutral 15 (22.7)5 (22.7)24 (27.9)26 (31.3)
Unsatisfied 10 (15.2)0 (0.0)4 (4.7)2 (2.4)
Very unsatisfied 9 (13.6)0 (0.0)1 (1.2)0 (0.0)
Regulations and guidelinesVery satisfied0 (0.0)4 (18.2)7 (8.1)8 (9.6)73.039 ***1–2·3·4
Satisfied 2 (3.0)11 (50.0)22 (25.6)27 (32.5)
Neutral 18 (27.3)4 (18.2)31 (36.0)28 (33.7)
Unsatisfied 16 (24.2)0 (0.0)7 (8.1)2 (2.4)
Very unsatisfied 8 (12.1)0 (0.0)1 (1.2)1 (1.2)
Training Very satisfied0 (0.0)7 (31.8)7 (8.1)7 (8.4)66.113 ***1–2·3·4
Satisfied 4 (6.1)5 (22.7)18 (20.9)25 (30.1)
Neutral 13 (19.7)5 (22.7)24 (27.9)24 (28.9)
Unsatisfied 12 (18.2)0 (0.0)7 (8.1)2 (2.4)
Very unsatisfied 11 (16.7)0 (0.0)2 (2.3)2 (2.4)
Technical supportVery satisfied0 (0.0)7 (31.8)8 (9.3)5 (6.0)71.787 ***1–2·3·4
Satisfied 3 (4.5)6 (27.3)20 (23.3)25 (30.1)
Neutral 18 (27.3)5 (22.7)28 (32.6)24 (28.9)
Unsatisfied 9 (13.6)0 (0.0)4 (4.7)1 (1.2)
Very unsatisfied 10 (15.2)0 (0.0)2 (2.3)0 (0.0)
Guide and publicityVery satisfied1 (1.5)5 (22.7)6 (7.0)5 (6.0)46.052 ***1–2·3·4
Satisfied 3 (4.5)6 (27.3)18 (20.9)25 (30.1)
Neutral 18 (27.3)6 (27.3)26 (30.2)23 (27.7)
Unsatisfied 15 (22.7)2 (9.1)19 (22.1)8 (9.6)
Very unsatisfied 14 (21.2)1 (4.5)6 (7.0)4 (4.8)
Note: *** p < 0.001.
Table A3. Cross-tabulation analysis results 3: differences in support methods of using the new LMS according to levels of perceiving innovation barriers and inertia.
Cluster 1Cluster 2Cluster 3Cluster 4χ2Post
Whether or not to use Phone inquiries Unused48 (72.7)7 (31.8)59 (68.6)49 (59.0)13.620 **1–2
1–3
Used 18 (27.3)15 (68.2)27 (31.4)34 (41.0)
E-mail inquiriesUnused52 (78.8)5 (22.7)60 (69.8)48 (57.8)25.200 ***1–2
1–3
2–4
Used 14 (21.2)17 (77.3)26 (30.2)35 (42.2)
Usage inquiry bulletin boardsUnused49 (74.2)4 (18.2)60 (69.8)49 (59.0)24.795 ***1–2
1–3
2–4
Used 17 (25.8)18 (81.8)26 (30.2)34 (41.0)
FAQUnused44 (66.7)5 (22.7)57 (66.3)41 (49.4)18.054 ***1–2
1–3
Used 22 (33.3)17 (77.3)29 (33.7)42 (50.6)
ManualUnused36 (54.5)4 (18.2)48 (55.8)36 (43.4)11.774 **1–2
1–3
Used 30 (45.5)18 (81.8)38 (44.2)47 (56.6)
Other personnelUnused35 (53.0)2 (9.1)45 (52.3)35 (42.2)15.256 **1–2
1–3
2–4
Used 31 (47.0)20 (90.9)41 (47.7)48 (57.8)
SatisfactionPhone inquiriesVery satisfied0 (0.0)5 (22.7)2 (2.3)5 (6.0)49.141 ***1–2
1–3
2–4
Satisfied 2 (3.0)6 (27.3)4 (4.7)7 (8.4)
Neutral 9 (13.6)4 (18.2)17 (19.8)17 (20.5)
Unsatisfied 3 (4.5)0 (0.0)2 (2.3)5 (6.0)
Very unsatisfied 4 (6.1)0 (0.0)2 (2.3)0 (0.0)
E-mail inquiriesVery satisfied0 (0.0)5 (22.7)1 (1.2)5 (6.0)66.221 ***1–2
1–3
2–4
Satisfied 1 (1.5)8 (36.4)3 (3.5)9 (10.8)
Neutral 9 (13.6)3 (13.6)19 (22.1)19 (22.9)
Unsatisfied 2 (3.0)1 (4.5)1 (1.2)2 (2.4)
Very unsatisfied 2 (3.0)0 (0.0)2 (2.3)0 (0.0)
Usage inquiry bulletin boardsVery satisfied1 (1.5)4 (18.2)3 (3.5)4 (4.8)66.876 ***1–2
1–3
2–4
Satisfied 1 (1.5)9 (40.9)2 (2.3)9 (10.8)
Neutral 8 (12.1)3 (13.6)17 (19.8)18 (21.7)
Unsatisfied 5 (7.6)2 (9.1)1 (1.2)3 (3.6)
Very unsatisfied 2 (3.0)0 (0.0)3 (3.5)0 (0.0)
FAQVery satisfied0 (0.0)4 (18.2)3 (3.5)4 (4.8)58.032 ***1–2
1–4
2–3
Satisfied 2 (3.0)7 (31.8)2 (2.3)15 (18.1)
Neutral 11 (16.7)3 (13.6)21 (24.4)20 (24.1)
Unsatisfied 4 (6.1)2 (9.1)2 (2.3)3 (3.6)
Very unsatisfied 5 (7.6)1 (4.5)1 (1.2)0 (0.0)
ManualVery satisfied0 (0.0)6 (27.3)8 (9.3)9 (10.8)48.493 ***1–2
1–4
2–3
Satisfied 4 (6.1)8 (36.4)10 (11.6)18 (21.7)
Neutral 13 (19.7)2 (9.1)16 (18.6)17 (20.5)
Unsatisfied 8 (12.1)1 (4.5)3 (3.5)2 (2.4)
Very unsatisfied 5 (7.6)1 (4.5)1 (1.2)1 (1.2)
Other personnelVery satisfied0 (0.0)7 (31.8)7 (8.1)10 (12.0)44.625 ***1–2
1–3
Satisfied 6 (9.1)9 (40.9)16 (18.6)16 (19.3)
Neutral 13 (19.7)3 (13.6)11 (12.8)16 (19.3)
Unsatisfied 9 (13.6)1 (4.5)6 (7.0)5 (6.0)
Very unsatisfied 3 (4.5)0 (0.0)1 (1.2)1 (1.2)
Note: ** p < 0.01, *** p < 0.001.

References

  1. Davis, F.D. Perceived usefulness, perceived ease of use, and user acceptance of information technology. MIS Q. 1989, 13, 319–340. [Google Scholar] [CrossRef]
  2. Davis, F.D. User acceptance of information technology: System characteristics, user perceptions and behavioral impacts. Int. J. Man-Mach. Stud. 1993, 38, 475–487. [Google Scholar] [CrossRef]
  3. Fathema, N.; Shannon, D.; Ross, M. Expanding the technology acceptance model (TAM) to examine faculty use of learning management systems (LMSs) in higher education. Merlot 2015, 11, 210–232. [Google Scholar]
  4. Binyamin, S.; Rutter, M.J.; Smith, S. Factors Influencing the Students’ Use of Learning Management Systems: A Case Study of King Abdulaziz University. In Proceedings of the 12th International Conference on e-Learning (ICEL 2017), Orlando, FL, USA, 1–2 June 2017; pp. 289–297. [Google Scholar]
  5. Ram, S. A Model of Innovation Resistance. Adv. Consum. Res. 1987, 14, 208–212. [Google Scholar]
  6. Ali, M.; Zhou, L.; Miller, L.; Ieromonachou, P. User resistance in IT: A literature review. Int. J. Inf. Manag. 2016, 36, 35–43. [Google Scholar] [CrossRef]
  7. Ngafeeson, M. Understanding User Resistance to Information Technology in Healthcare: The Nature and Role of Perceived Threats. Trans. Int. Conf. Health Inf. Technol. Adv. 2015, 56, 37–49. [Google Scholar]
  8. Zaltman, G.; Wallendorf, M. Consumer Behavior: Basic Findings and Management Implications; John Wiley & Sons: New York, NY, USA, 1983. [Google Scholar]
  9. Rogers, E.M. Diffusion of Innovations, 4th ed.; The Free Press: New York, NY, USA, 1995. [Google Scholar]
  10. Ram, S.; Sheth, J.N. Consumer resistance to innovations: The marketing problem and its solutions. J. Consum. Mark. 1989, 6, 5–14. [Google Scholar] [CrossRef]
  11. Mohammadi, M.K.; Mohibbi, A.A.; Hedayati, M.H. Investigating the challenges and factors influencing the use of the learning management system during the COVID-19 pandemic in Afghanistan. Educ. Inf. Technol. 2021, 26, 5165–5198. [Google Scholar] [CrossRef]
  12. Laukkanen, T. Consumer adoption versus rejection decisions in seemingly similar service innovations: The case of the Internet and mobile banking. J. Bus. Res. 2016, 69, 2432–2439. [Google Scholar] [CrossRef]
  13. Teo, T.S.; Pok, S.H. Adoption of WAP-enabled mobile phones among Internet users. Omega 2003, 31, 483–498. [Google Scholar] [CrossRef]
  14. Joachim, V.; Spieth, P.; Heidenreich, S. Active innovation resistance: An empirical study on functional and psychological barriers to innovation adoption in different contexts. Ind. Mark. Manag. 2018, 71, 95–107. [Google Scholar] [CrossRef]
  15. Lian, J.W.; Yen, D.C. Online shopping drivers and barriers for older adults: Age and gender differences. Comput. Hum. Behav. 2013, 37, 133–143. [Google Scholar] [CrossRef]
  16. Kuisma, T.; Laukkanen, T.; Hiltunen, M. Mapping the reasons for resistance to Internet banking: A means-end approach. Int. J. Inf. Manag. 2007, 27, 75–85. [Google Scholar] [CrossRef]
  17. Jung, N. Investigating the Resistance of Booth Recommendation Systems on Exhibition Attendee’s Unplanned Spatial Behavior. e-Bus. Res. 2014, 15, 103–121. [Google Scholar]
  18. Zeelenberg, M.; Pieters, R. Beyond valence in customer dissatisfaction: A review and new findings on behavioral responses to regret and disappointment in failed services. J. Bus. Res. 2004, 57, 445–455. [Google Scholar] [CrossRef]
  19. Lee, R.; Neale, L. Interactions and consequences of inertia and switching costs. J. Serv. Mark. 2016, 26, 365–374. [Google Scholar] [CrossRef]
  20. Greenfield, H.I. Consumer inertia: A missing link? Am. J. Econ. Sociol. 2005, 64, 1085–1089. [Google Scholar] [CrossRef]
  21. Lin, T.C.; Huang, S.L.; Hsu, C.J. A Dual-Factor Model of Loyalty to IT Product-The Case of Smartphones. Int. J. Inf. Manag. 2015, 35, 215–228. [Google Scholar] [CrossRef]
  22. Polites, G.L.; Karahanna, E. Shackled to the status quo: The inhibiting effects of incumbent system habit, switching costs, and inertia on new system acceptance. MIS Q. 2012, 36, 21–42. [Google Scholar] [CrossRef]
  23. Lucia-Palacios, L.; Pérez-López, R.; Polo-Redondo, Y. Cognitive, affective and behavioural responses in mall experience: A qualitative approach. Int. J. Retail Distrib. Manag. 2016, 44, 4–21. [Google Scholar] [CrossRef]
  24. Lucas, M.; Gunawardena, C.; Moreira, A. Assessing social construction of knowledge online: A critique of the interaction analysis model. Comput. Hum. Behav. 2014, 30, 574–582. [Google Scholar] [CrossRef]
  25. Chipps, J.; Kerr, J.; Brysiewicz, P.; Walters, F. A survey of university students’ perceptions of learning management systems in a low-resource setting using a technology acceptance model. CIN Comput. Inform. Nurs. 2015, 33, 71–77. [Google Scholar] [CrossRef]
  26. Johnson, G.M.; Cooke, A. An ecological model of student interaction in online learning environments. In Handbook of Research on Strategic Management of Interaction, Presence, and Participation in Online Courses; IGI Global: Hershey, PA, USA, 2016; pp. 1–28. [Google Scholar]
  27. Mostow, J.; Beck, J. Some useful tactics to modify, map and mine data from intelligent tutors. Nat. Lang. Eng. 2006, 12, 195–208. [Google Scholar] [CrossRef]
  28. Yoon, S.; Kim, D.; Kim, N.; Cheon, J. Big Data in Education and Learning; Communication Books: Seoul, Republic of Korea, 2017. [Google Scholar]
  29. Judge, D.S.; Murray, B. Student and faculty transition to a new online learning management system. Teach. Learn. Nurs. 2017, 12, 277–280. [Google Scholar] [CrossRef]
  30. Al-Mamary, Y.H.S. Understanding the use of learning management systems by undergraduate university students using the UTAUT model: Credible evidence from Saudi Arabia. Int. J. Inf. Manag. Data Insights 2022, 2, 100092. [Google Scholar] [CrossRef]
  31. Anas, A. Perceptions of Saudi students to blended learning environments at the University of Bisha, Saudi Arabia. Arab World Engl. J. (AWEJ) Spec. Issue CALL 2020, 6, 261–277. [Google Scholar] [CrossRef]
  32. Jung, S.G.; Jang, J.H. The relationship of mobile payment service using value and innovation resistance, continuous use intention. J. Digit. Contents Soc. 2018, 19, 2203–2210. [Google Scholar] [CrossRef]
  33. Almarashdeh, I. Sharing instructors experience of learning management system: A technology perspective of user satisfaction in distance learning course. Comput. Hum. Behav. 2016, 63, 249–255. [Google Scholar] [CrossRef]
Figure 1. The graph illustrating the results of cluster analysis.
Sustainability 15 12627 g001
Table 1. Profile of participants.
CategorySample (Percentage)
IdentificationFaculty34 (13.23%)
TA26 (10.12%)
Student 197 (76.65%)
GenderMale 131 (50.97%)
Female 126 (49.03%)
AgeUnder 20s 213 (82.88%)
30s25 (9.73%)
40s5 (1.95%)
50s and over 14 (5.45%)
Use experienceNo221 (85.99%)
Yes (Out of class)32 (12.45%)
Yes (Within classes of other institutions)4 (1.56%)
No. of coursesOne course 154 (59.92%)
Two courses or more 103 (40.08%)
Classification of subjectsUndergraduate liberal arts169 (65.76%)
Undergraduate liberal arts73 (28.40%)
Graduate 15 (5.84%)
Subject fieldHumanities and Social Science176 (68.48%)
Science and Engineering62 (24.12%)
Others19 (7.39%)
Table 2. Variables and questionnaire items.
Variables No. of ItemsQuestionnaire Content Cronbach’s Alpha
Innovation barrierUsage barrier 5The new LMS web is easy and convenient to use. *
The new LMS mobile app is easy and convenient to use. *
Learning to use a new LMS is easy. *
The features and design of the new LMS are clear and easy to understand. *
I have the necessary knowledge to use the new LMS. *
0.881
Value barrier 3Using the new LMS is helpful for teaching. *0.890
Tradition barrier 3The new LMS is suitable as a classroom-related interaction tool. *
Overall, I am satisfied with the new LMS. *
Using the new LMS is better than using the old LMS. *
The new LMS provides more diverse and higher quality functions and services than the existing LMS. *
Overall, I am more satisfied with the old LMS than the new LMS.
0.855
Risk barrier 3I am worried about connection errors while using the new LMS.
I am concerned about errors and loss of class-related data when using the new LMS.
When using a new LMS, I am concerned about issues related to privacy, copyright, and portrait rights.
0.798
Image barrier 3Adopting a new LMS is not useful.
The new LMS has an image of being difficult to use.
The new LMS is not suitable as a system for class management.
0.824
InertiaAffective inertia2I feel stressed about changing to a new LMS.
The old LMS is more comfortable than the new LMS.
0.767
Cognitive inertia2Although the existing LMS is not a system with the latest design and functions, I would like to use the existing LMS if the choice is possible.
In the existing LMS, it is difficult to use various tools related to scoring, sharing, and chatting, but if the choice is possible, I would like to use the existing LMS.
0.888
* Marked items are reverse-coded items.
Table 3. The results of factor analysis.
ItemsFactor 1 Factor 2 Factor 3Cronbach’s Alpha
Usage barrier10.7800.4070.0840.949
20.7250.1500.171
30.7780.1890.203
40.7450.3610.138
50.6890.0750.316
Value barrier10.7590.4070.110
20.7700.3070.055
30.8170.3980.078
Tradition barrier10.7590.4070.110
20.7700.3070.055
30.8170.3980.078
Risk barrier10.1510.1360.7910.798
20.1360.1710.845
30.0030.0720.781
Image barrier10.3670.6560.2620.920
20.3130.5550.331
30.3920.6400.420
Affective inertia10.3820.7020.288
20.2490.7570.113
Cognitive inertia10.3130.866−0.001
20.2240.8430.120
Table 4. The results of categorical regression analysis.
Coefficients
Standardized Coefficients dFp
BetaBootstrap (1000) Std. Error Estimates
REGR factor score 1 for analysis 10.6870.0434250.2720.000
REGR factor score 2 for analysis 10.3730.048360.8370.000
REGR factor score 3 for analysis 10.1280.04438.6610.000
Dependent variable: satisfaction
Table 5. The results of cluster analysis.
Level of Factor Score (Rank among Clusters)
Cluster 1
(n = 66)
Cluster 2
(n = 22)
Cluster 3
(n = 86)
Cluster 4
(n = 83)
Factor score[Factor 1]
usage/value/tradition barriers
1.031
very high (1)
−1.589
very low (4)
−0.042
medium (2)
−0.355
low (3)
[Factor 2]
risk barriers
0.449
high (2)
1.136
very high (1)
0.378
high (3)
−1.050
very low (4)
[Factor 3]
image barriers and inertia
0.695
high (2)
0.870
high (1)
−0.965
very low (4)
0.217
medium (3)
Factor composition
  • Not much difference amongin factors
  • A group generally sensitive to the three factors
  • Very large difference among in factors
  • A group sensitive to factor 2 (risk barrier) and factor 3 (image barrier + inertia) but not sensitive to factor 1 (usage + value + tradition barrier)
  • Medium difference among in factors
  • A group that is sensitive to factor 2 (risk barrier) but not sensitive to factor 3 (image barrier + inertia).
  • Moderate sensitivity to factor 1 (usage + value + tradition barriers)
  • Medium difference in factor
  • A group not generally sensitive to the three factors
Cluster nameInnovation-Resistant TypeInnovation Barriers and Inertia Cognitive Type 1Innovation Barriers and Inertia Cognitive Type 2Innovation-Accepting Type
Disclaimer/Publisher’s Note: The statements, opinions and data contained in all publications are solely those of the individual author(s) and contributor(s) and not of MDPI and/or the editor(s). MDPI and/or the editor(s) disclaim responsibility for any injury to people or property resulting from any ideas, methods, instructions or products referred to in the content.

