

Study of Constitutive Models of Reconstituted Clay with High Initial Water Content

Abstract
1. Introduction
2. Compressive Model of Reconstituted Clay with Different Water Contents
2.1. Research on Key Parameters of Reconstituted Clay Compression Model
2.2. Compressive Model of Reconstituted Clay with Different Water Contents under High Water Content
2.3. Parameter Determination
3. Modified Cambridge Model of Reconstituted Clay with High Water Content Considering Structure
4. Comparison between Model Prediction Results and Test Results
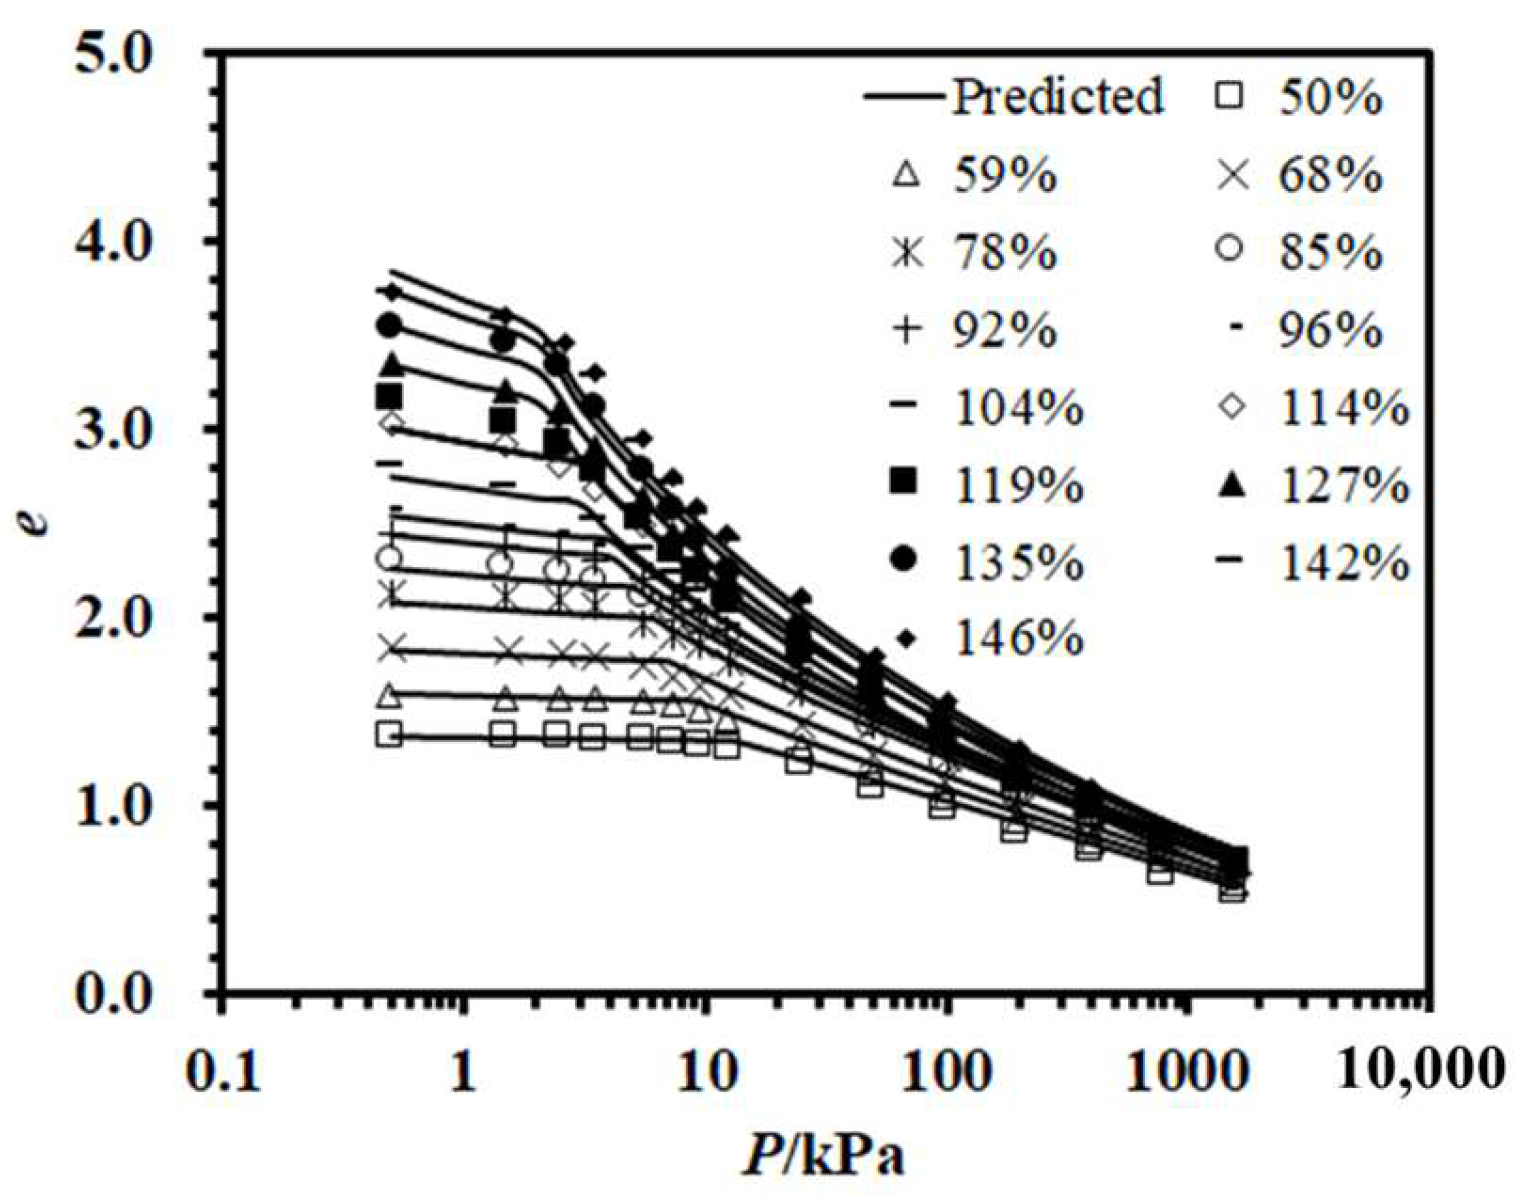
- To verify the rationality and superiority of the model in this paper, MATLAB is used to program the model: three kinds of compression curves of reconstituted soil in Lianyungang clay, Baimahu clay, and Huaian clay, and one kind of consolidated undrained compression curve in Lianyungang clay in Hong et al. [5], Zeng et al. [6], and Hong et al. [23]. Due to the lack of consolidated drained shear test data, this paper only simulates the consolidated undrained shear test curve. The model parameters a1, bL, a2, and a3 of the three reconstituted clays can be obtained from Table 3; CC(FA) can be obtained from the compression curve; M is the slope of the critical state line on the q-p plane of the triaxial shear test; and the obtained model parameters are shown in Table 4.
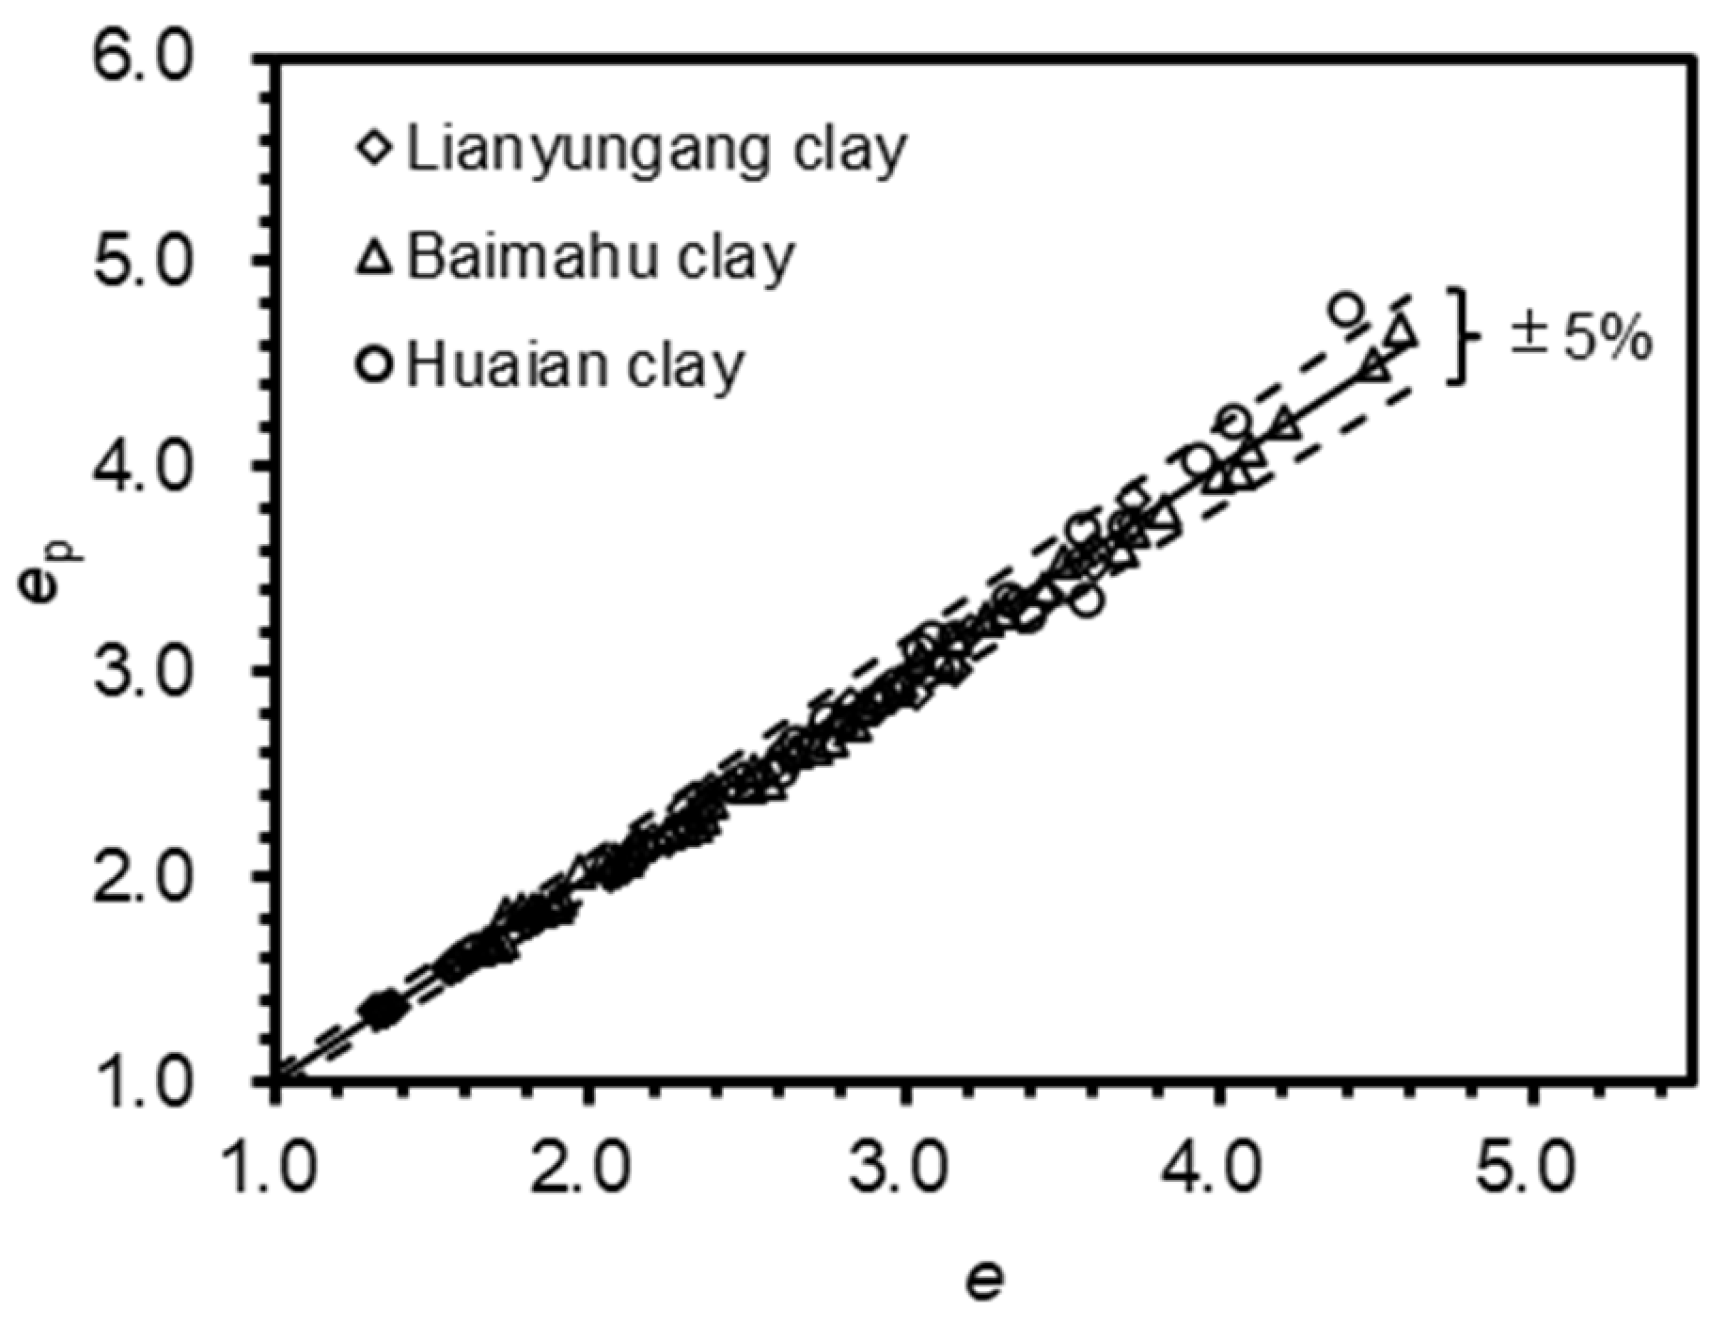
- The comparison results of the simulation results and uniaxial compression tests of three reconstituted clays, Lianyungang clay, Baimahu clay, and Huaian clay, are shown in Figure 8, Figure 9 and Figure 10, respectively. The solid line represents the model prediction line, and the data point represents the void ratio under different effective pressures. The test data and the model simulation results in this paper show good consistency. The comparison of the void ratio in the pre-yield stage is shown in Figure 11, and the error range is almost within ±5%. The comparison of the void ratio in the post-yield stage is shown in Figure 12. The error range is almost within ±10%, where ep and ea are the predicted void ratios before and after yielding, respectively.
5. Application of Model
- Since a1, bL, a2, and a3 are all determined by fitting the model and test data, the curve can be better fitted by taking three pieces of water content data (preferably, the maximum, middle, and minimum water content), while CC(FA) can be obtained by the linear interpolation or extrapolation method for the complete failure compression index of the reconstituted clay structure with a known water content. By combining the parameters of the compression curve and the critical state stress ratio M and Poisson’s ratio ν, the consolidated undrained shear test of reconstituted soil with different water contents can be simulated.
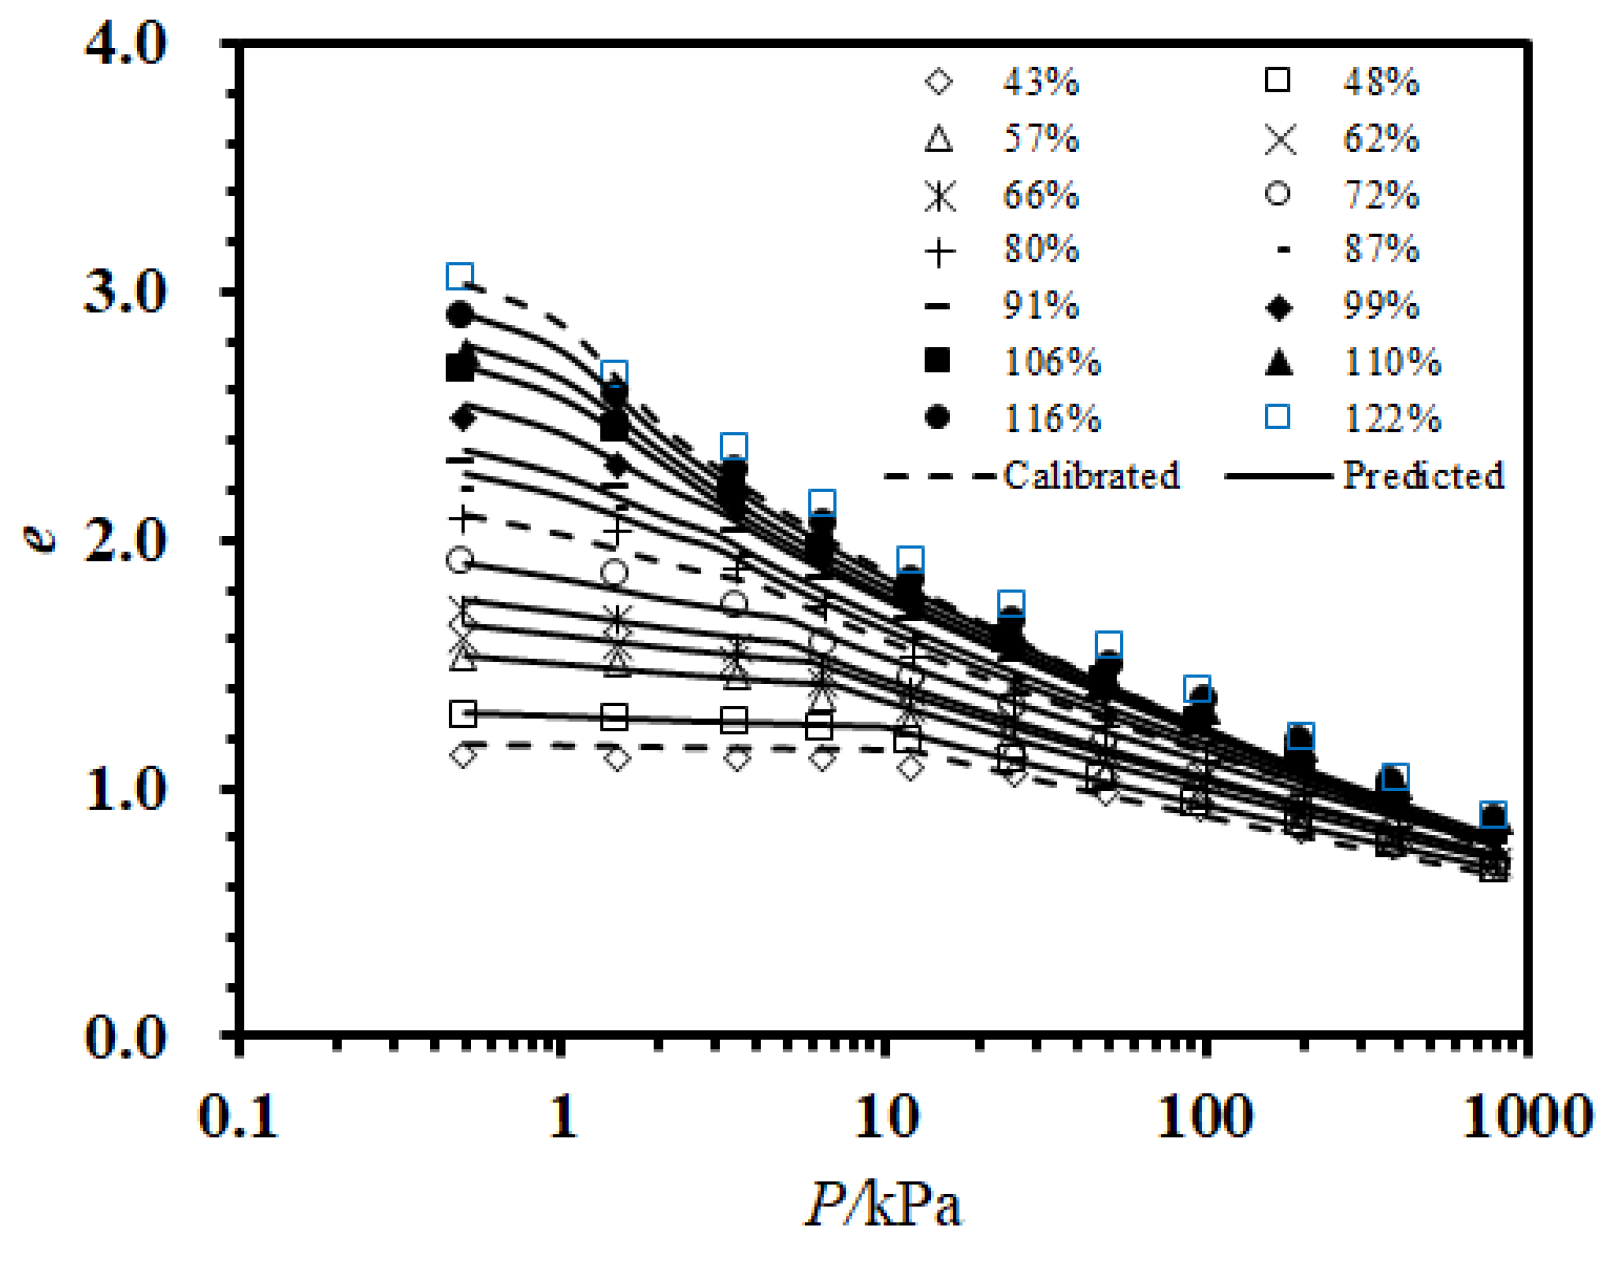
- To further verify the practicability of the model in this paper, the compression curve of reconstituted soil with different initial water contents in Kemen clay studied by Hong et al. [5] is quoted and compared with the curve obtained by the model in this paper. The test data with the initial water content of 43%, 80%, and 122% are selected for a fitting analysis with the model in this paper. See Table 5 for model parameters.
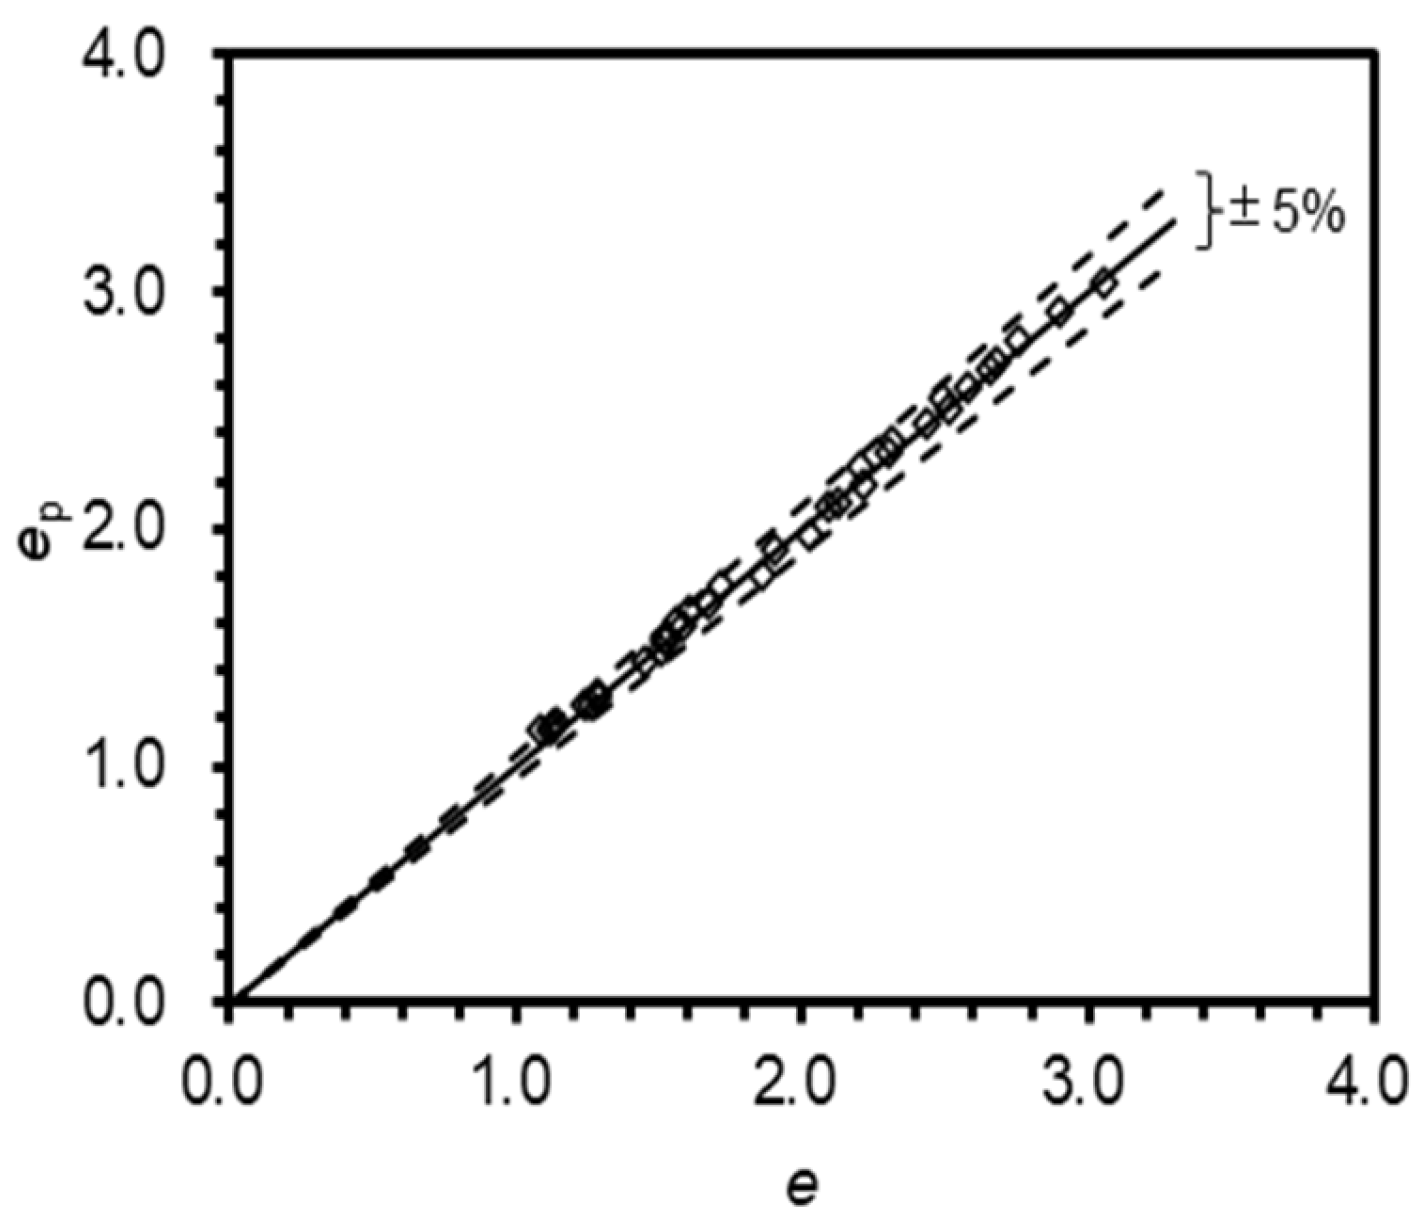
- The comparison results between the simulation results of reconstituted clay with different initial water contents and the oedometer test of Kemen clay are shown in Figure 14. The solid line represents the model prediction line, the dotted line represents the three selected water content compression curves as the calibration line, and the data point represents the void ratio under different effective pressures. The test data and the model simulation results in this paper show good consistency. The comparison of the void ratio in the pre-yield stage loading process is shown in Figure 15, and the error range is almost between ±5%.
- The comparison of the void ratio in the post-yield stage loading process is shown in Figure 16, and the error range is almost between ±10%.
6. Discussion
7. Conclusions
- (1)
- Based on the concept of the disturbed state, the change of the compression index caused by a structural failure during compression is analyzed. According to the functional relationship between the parameters of the compression curve and the water content, the compression curve equation of reconstituted clay with different water contents is established. The changes in the compression index with the compression pressure, water content, and elastic index with the water content are introduced into the modified Cambridge model. The curve equation of the triaxial shear test of reconstituted clay with different water contents is established.
- (2)
- The established model is relatively simple and easy to understand, and all model parameters can be determined through conventional oedometer tests and triaxial shear tests.
- (3)
- The model can simulate and predict the compression curves of other reconstituted soils with different water contents through the measured data of three reconstituted soil compression curves with different water contents; in addition, by adding the critical state stress ratio M and Poisson’s ratio ν, the consolidated undrained shear test of reconstituted soil with different water contents can be simulated.
- (4)
- By comparing the test data and simulation results, it is confirmed that the established model can better simulate the compression and triaxial shear mechanical properties of reconstituted clay with different initial water contents.
- (5)
- Since it is based on the modified Cambridge model, the model cannot describe the softening phenomenon in the process of consolidated undrained shear. In addition, with the development of the consolidated drained triaxial test of reconstituted clay, the model used to simulate it will be carried out in future work.
Author Contributions
Funding
Institutional Review Board Statement
Informed Consent Statement
Data Availability Statement
Conflicts of Interest
References
- Ma, J.J.; Qian, M.Y.; Yu, C.; Yu, X.N. Compressibility evaluation of reconstituted clays with various initial water contents. J. Perform. Constr. Fac. 2018, 32, 52–58. [Google Scholar] [CrossRef]
- Burland, J.B. 30th Rankine Lecture—On the compressibility and shear-strength of natural clays. Geotechnique 1990, 40, 329–378. [Google Scholar] [CrossRef]
- Liu, M.D.; Carter, J.P. Modelling the destructuring of soils during virgin compression. Geotechnique 2000, 50, 479–483. [Google Scholar] [CrossRef]
- Cerato, A.B.; Lutenegger, A.J. Determining intrinsic compressibility of fine-grained soils. J. Geotech. Geoenviron. 2004, 130, 872–877. [Google Scholar] [CrossRef]
- Hong, Z.S.; Yin, J.; Cui, Y.J. Compression behavior of reconstituted soils at high initial water contents. Geotechnique 2010, 60, 691–700. [Google Scholar] [CrossRef]
- Zeng, L.L.; Hong, Z.S.; Cui, Y.J. Determining the virgin compression lines of reconstituted clays at different initial water contents. Can. Geotech. J. 2015, 52, 1408–1415. [Google Scholar] [CrossRef]
- Chai, J.C.; Shen, S.L.; Geng, X. Effect of initial water content and pore water chemistry on intrinsic compression behavior. Mar. Georesour. Geotec. 2018, 37, 417–423. [Google Scholar] [CrossRef]
- Polidori, E. Discussion on the Compression Behavior of Reconstituted Soils by B. Shipton; M.R. Coop Soils and Foundations 52 (4) (2012) 668–681. Soils Found. 2013, 53, 784–795. [Google Scholar] [CrossRef][Green Version]
- Habibbeygi, F. Intrinsic compression characteristics of an expansive clay from western Australia. Int. J. Geomate. 2017, 12, 203–215. [Google Scholar] [CrossRef]
- Habibbeygi, F.; Nikraz, H. Characterization of the undrained shear strength of expansive soils of high water content using intrinsic concept. Int. J. Geomate. 2018, 14, 199–206. [Google Scholar] [CrossRef]
- Riyad, A.S.M.; Rafizul, I.M.; Kadir, R. Compressive behavior of reconstituted soils at high initial water content: Case study on south-western region of Bangladesh. J. Eng. Sci. 2023, 14, 1–9. [Google Scholar] [CrossRef]
- Sun, W.J.; Cui, Y.J.; Hong, Z.S.; Wang, H.L.; Liu, K. Moisture tension in fine-grained reconstituted soils at high initial water contents. Acta Geotech. 2020, 15, 2591–2598. [Google Scholar] [CrossRef]
- Liu, M.D.; Carter, J.P.; Desai, C.S.; Xu, K.J. Analysis of the compression of structured soils using the disturbed state concept. Int. J. Numer. Anal. Met. 2000, 24, 723–735. [Google Scholar] [CrossRef]
- Ouria, A. Disturbed state concept–based constitutive model for structured soils. Int. J. Geomech. 2017, 17, 101–111. [Google Scholar] [CrossRef]
- Zeng, L.L.; Hong, Z.S.; Cui, Y.J.; Liu, M.D. Compression reference of soil structure evaluation with reconstituted clays at different initial water contents. Mar. Georesources Geotechnol. 2018, 36, 759–767. [Google Scholar] [CrossRef]
- Zeng, L.L.; Hong, Z.S.; Gao, Y.F. Practical estimation of compression behavior of dredged clays with three physical parameters. Eng. Geol. 2017, 217, 102–109. [Google Scholar] [CrossRef]
- Bian, X.; Hong, Z.S.; Cai, Z.Y.; Zeng, L.L. Change of critical state line of reconstituted clay with the initial water content. Chin. J. Geotech. Eng. 2013, 1, 170–175. [Google Scholar]
- Lin, S.; Yan, S.; Yan, Y.; Qiu, C.L.; Zhuang, D.K.; Xing, X.J. Experimental research of the influence of the initial water content on the compression and strength properties of slurry. Chin. J. Rock Mech Eng. 2019, 38, 1452–1460. [Google Scholar]
- Butterfield, R. A natural compression law for soils (an advance one–logp′). Geotechnique 1979, 29, 469–480. [Google Scholar] [CrossRef]
- Hong, Z.S. Void ratio-suction behavior of remolded ariake clays. Geotech. Test J. 2007, 30, 234–239. [Google Scholar]
- Desai, C.S. A Consistent finite element technique for work-softening behavior. In Proceedings of the International Conference on Computers Methods in Nonlinear Mechanics, University of Texas, Austin, TX, USA, 23–25 September 1974; pp. 120–150. [Google Scholar]
- Zeng, L.L.; Hong, Z.S.; Cai, Y.Q.; Han, J. Change of hydraulic conductivity during compression of undisturbed and remolded clays. Appl. Clay Sci. 2011, 51, 86–93. [Google Scholar] [CrossRef]
- Hong, Z.S.; Bian, X.; Cui, Y.J.; Gao, Y.F.; Zeng, L.L. Effect of initial water content on undrained shear behaviour of reconstituted clays. Geotechnique 2013, 63, 441–450. [Google Scholar] [CrossRef]
- Schofield, A.N.; Wroth, P. Critical State Soil Mechanics; McGraw-Hill: London, UK, 1968. [Google Scholar]


| Soil | Density of Soil Particles (Mg/m3) | Liquid Limit wL (%) | Plastic Limit (%) | Reference |
|---|---|---|---|---|
| Lianyungang clay | 2.71 | 74 | 33 | Hong et al. [5] |
| Baimahu clay | 2.65 | 91 | 38 | Hong et al. [5] |
| Kemen clay | 2.67 | 61 | 30 | Hong et al. [5] |
| Huaian clay | 2.70 | 100.0 | 38.8 | Zeng et al. [6] |
| Soil | Illite | Chlorite | Kaolinite | Smectite | Reference |
|---|---|---|---|---|---|
| Lianyungang clay | 60 | 19 | 13 | 8 | Zeng et al. [22] |
| Wenzhou clay | 65 | 17 | 11 | 7 | Hong et al. [23] |
| Kemen clay | 54 | 15 | 16 | 15 | Hong et al. [23] |
| Figure Numbers | Soil Type | Fitting Equation | R2 |
|---|---|---|---|
| Figure 2 | Liangyungang clay | (CC(a) − CC(FA))/(CC(RI) − CC(FA)) = 1.07(P/Pr) − 0.32 | 0.95 |
| Baimahu clay | (CC(a) − CC(FA))/(CC(RI) − CC(FA)) = 1.13(P/Pr) − 0.38 | 0.94 | |
| Huaian clay | (CC(a) − CC(FA))/(CC(RI) − CC(FA)) = 1.13(P/Pr) − 0.26 | 0.96 | |
| Figure 3 | Liangyungang clay | 0.95 | |
| Baimahu clay | |||
| Huaian clay | |||
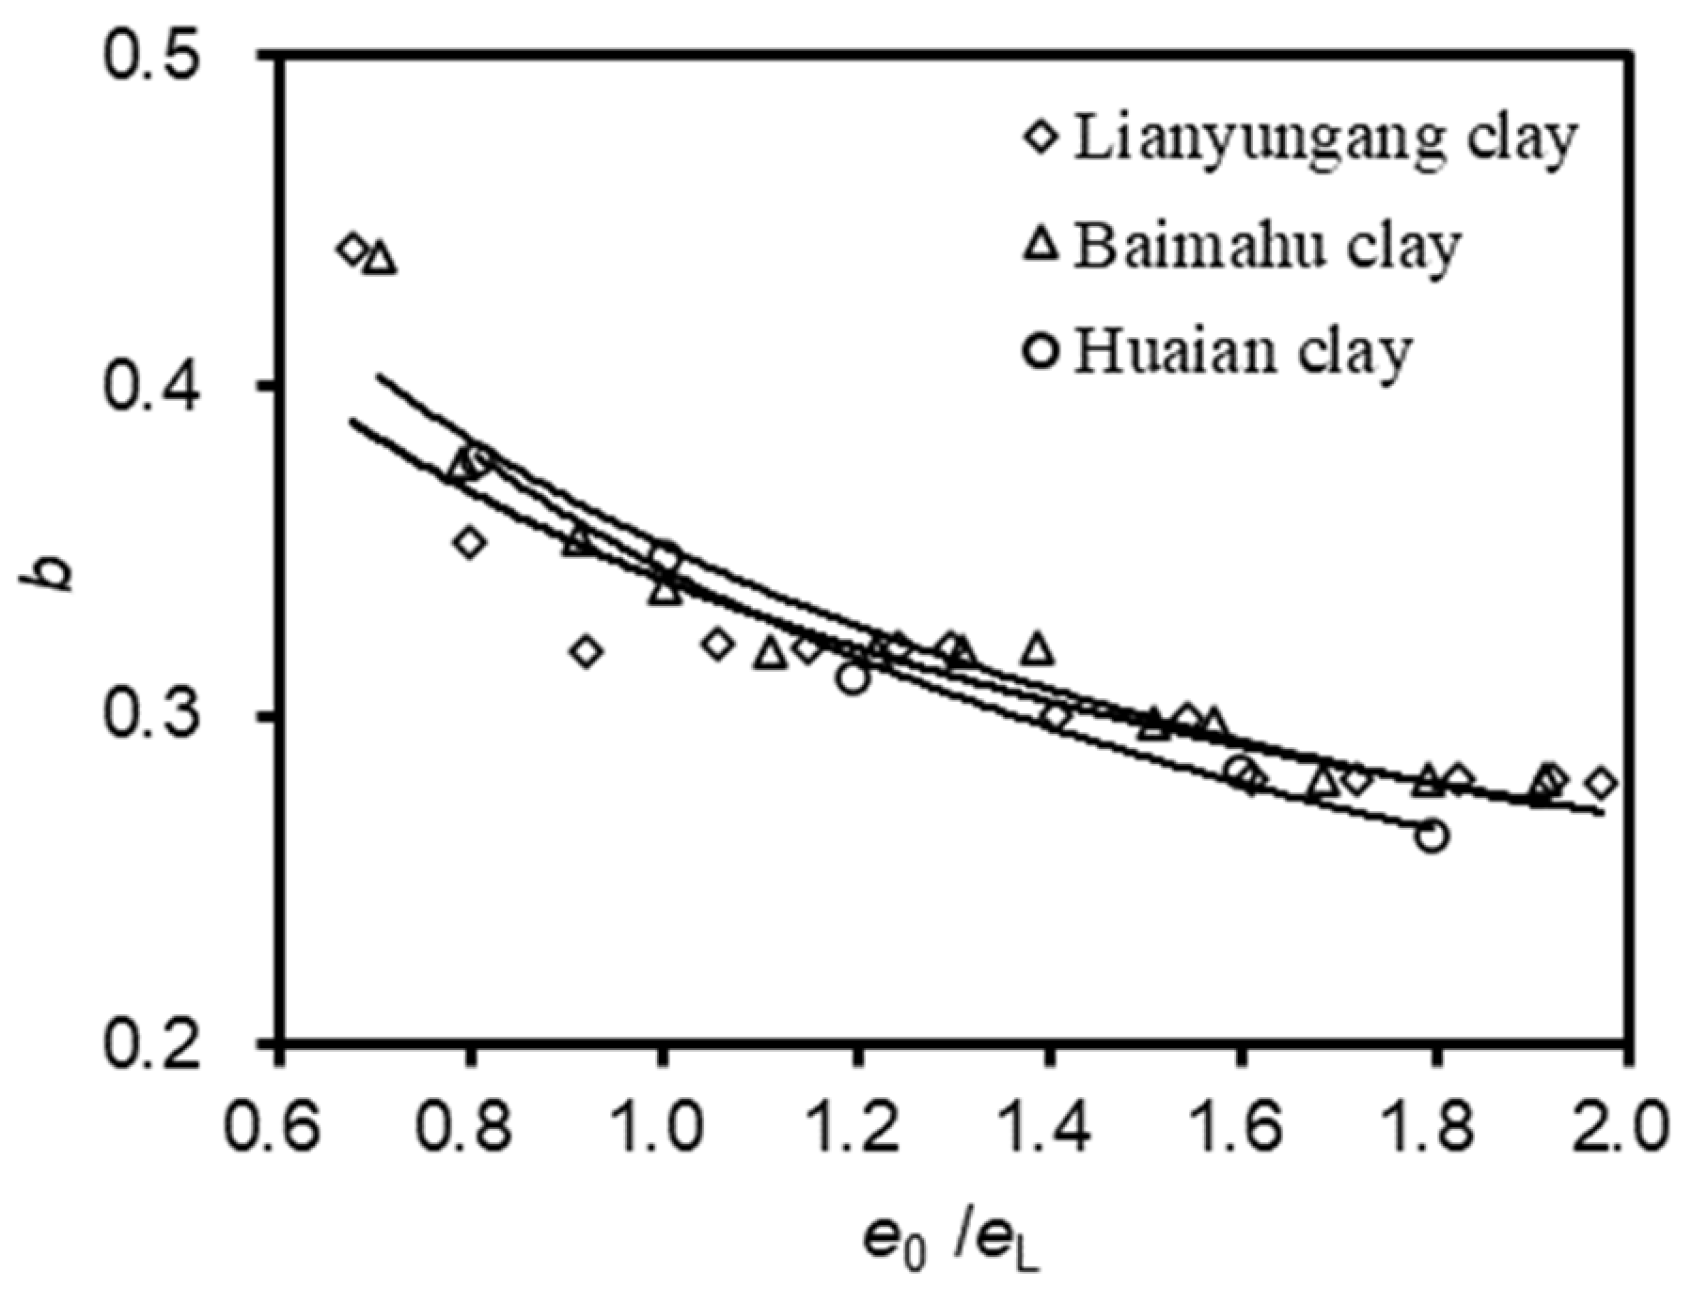
| Figure 4 | Liangyungang clay | b = 0.34(e0/eL) − 0.34 | 0.84 |
| Baimahu clay | b = 0.35(e0/eL) − 0.39 | 0.92 | |
| Huaian clay | b = 0.34(e0/eL) − 0.44 | 0.99 | |
| Figure 5 | Liangyungang clay | CC(RI) = 0.99(e0/eL) − 0.33 | 0.98 |
| Baimahu clay | CC(RI) = 0.86(e0/eL) − 0.07 | 0.98 | |
| Huaian clay | CC(RI) = 0.91(e0/eL) − 0.02 | 0.98 |
| Soil Type | a1 | bL | a2 | a3 | M |
|---|---|---|---|---|---|
| Lianyungang clay | −0.34 | 0.34 | 0.99 | −0.33 | 1.40 (126.6%) 1.68 (86.6%) |
| Baimahu clay | −0.39 | 0.35 | 0.86 | −0.07 | — |
| Huaian clay | −0.44 | 0.34 | 0.91 | −0.02 | — |
| Clay | a1 | bL | a2 | a3 | M |
|---|---|---|---|---|---|
| Kemen clay | −0.45 | 0.43 | 0.41 | 0.02 | 0.81 (98%); 1.00 (83.4%) 1.32 (70.4%); 1.60 (63%) |
Disclaimer/Publisher’s Note: The statements, opinions and data contained in all publications are solely those of the individual author(s) and contributor(s) and not of MDPI and/or the editor(s). MDPI and/or the editor(s) disclaim responsibility for any injury to people or property resulting from any ideas, methods, instructions or products referred to in the content. |
© 2023 by the authors. Licensee MDPI, Basel, Switzerland. This article is an open access article distributed under the terms and conditions of the Creative Commons Attribution (CC BY) license (https://creativecommons.org/licenses/by/4.0/).
Share and Cite
Liu, J.; Hu, S.; Liu, G.; Zhang, J.; Lu, Z. Study of Constitutive Models of Reconstituted Clay with High Initial Water Content. Sustainability 2023, 15, 12618. https://doi.org/10.3390/su151612618
Liu J, Hu S, Liu G, Zhang J, Lu Z. Study of Constitutive Models of Reconstituted Clay with High Initial Water Content. Sustainability. 2023; 15(16):12618. https://doi.org/10.3390/su151612618
Chicago/Turabian StyleLiu, Jie, Shijun Hu, Gang Liu, Jingbo Zhang, and Zheng Lu. 2023. "Study of Constitutive Models of Reconstituted Clay with High Initial Water Content" Sustainability 15, no. 16: 12618. https://doi.org/10.3390/su151612618
APA StyleLiu, J., Hu, S., Liu, G., Zhang, J., & Lu, Z. (2023). Study of Constitutive Models of Reconstituted Clay with High Initial Water Content. Sustainability, 15(16), 12618. https://doi.org/10.3390/su151612618