Article

A Highway On-Ramp Control Approach Integrating Percolation Bottleneck Analysis and Vehicle Source Identification

1
School of Traffic and Transportation Engineering, Central South University, Changsha 410075, China
2
Hunan Communications Research Institute Co., Ltd., Changsha 410015, China
*
Author to whom correspondence should be addressed.
Sustainability 2023, 15(16), 12608; https://doi.org/10.3390/su151612608
Submission received: 29 June 2023 / Revised: 25 July 2023 / Accepted: 18 August 2023 / Published: 20 August 2023
(This article belongs to the Special Issue Sustainable Transportation and Data Science Application)

Abstract

:
Identifying the bottleneck segments and developing targeted traffic control strategies can facilitate the mitigation of highway traffic congestion. In this study, we proposed a new method for identifying the bottleneck segment in a large highway network based on the percolation theory. A targeted on-ramp control approach was further developed by identifying the major vehicle sources of the bottleneck segment. We found that the identified bottleneck segment played a crucial role in maintaining the functional connectivity of the highway network in terms of meeting the required level of service. The targeted on-ramp control approach can more effectively enhance the service level of the highway network.

1. Introduction

Highways play an important role in the regional transportation systems of most countries [1]. However, the ubiquitous traffic congestion on highways [2] could cause travel delays and traffic accidents [3,4], posing great negative effects on the efficiency and safety of highway transportation. Mitigating traffic congestion is an important task for many highway transportation agencies, and various traffic control approaches (e.g., on-ramp control [5], route guidance [6], and variable speed limit [7]) were developed and applied. The on-ramp control approaches were widely studied to alleviate highway traffic congestion [8]. Many countries implemented on-ramp control strategies in practice to facilitate highway transportation management [9,10,11,12,13,14,15,16,17,18,19,20,21]. Yet, despite the theoretical and practical achievements, existing on-ramp control approaches were usually developed for small theoretical networks or localized highway segments. That was mainly caused by the huge solution space when dealing with a large network and the difficulty of incorporating network-level traffic information. There are still lacking on-ramp control approaches applicable to large-scale highway networks.
In this study, we employed the network percolation approach to identify the bottleneck segment of a large regional highway network (i.e., the Hunan highway network). A percolation-bottleneck-based on-ramp control approach was proposed to alleviate traffic congestion and improve the functional connectivity of the highway network. Specifically, we pinpointed the major vehicle sources (MVSs) of the bottleneck segment to reduce the solution space and involve the network-level traffic information in the on-ramp control model. We validated the proposed on-ramp control approach using actual travel demand data of the Hunan highway network. The generated traffic control schemes can considerably improve the highway’s service level. The main contributions of this study are summarized as follows:
(1)
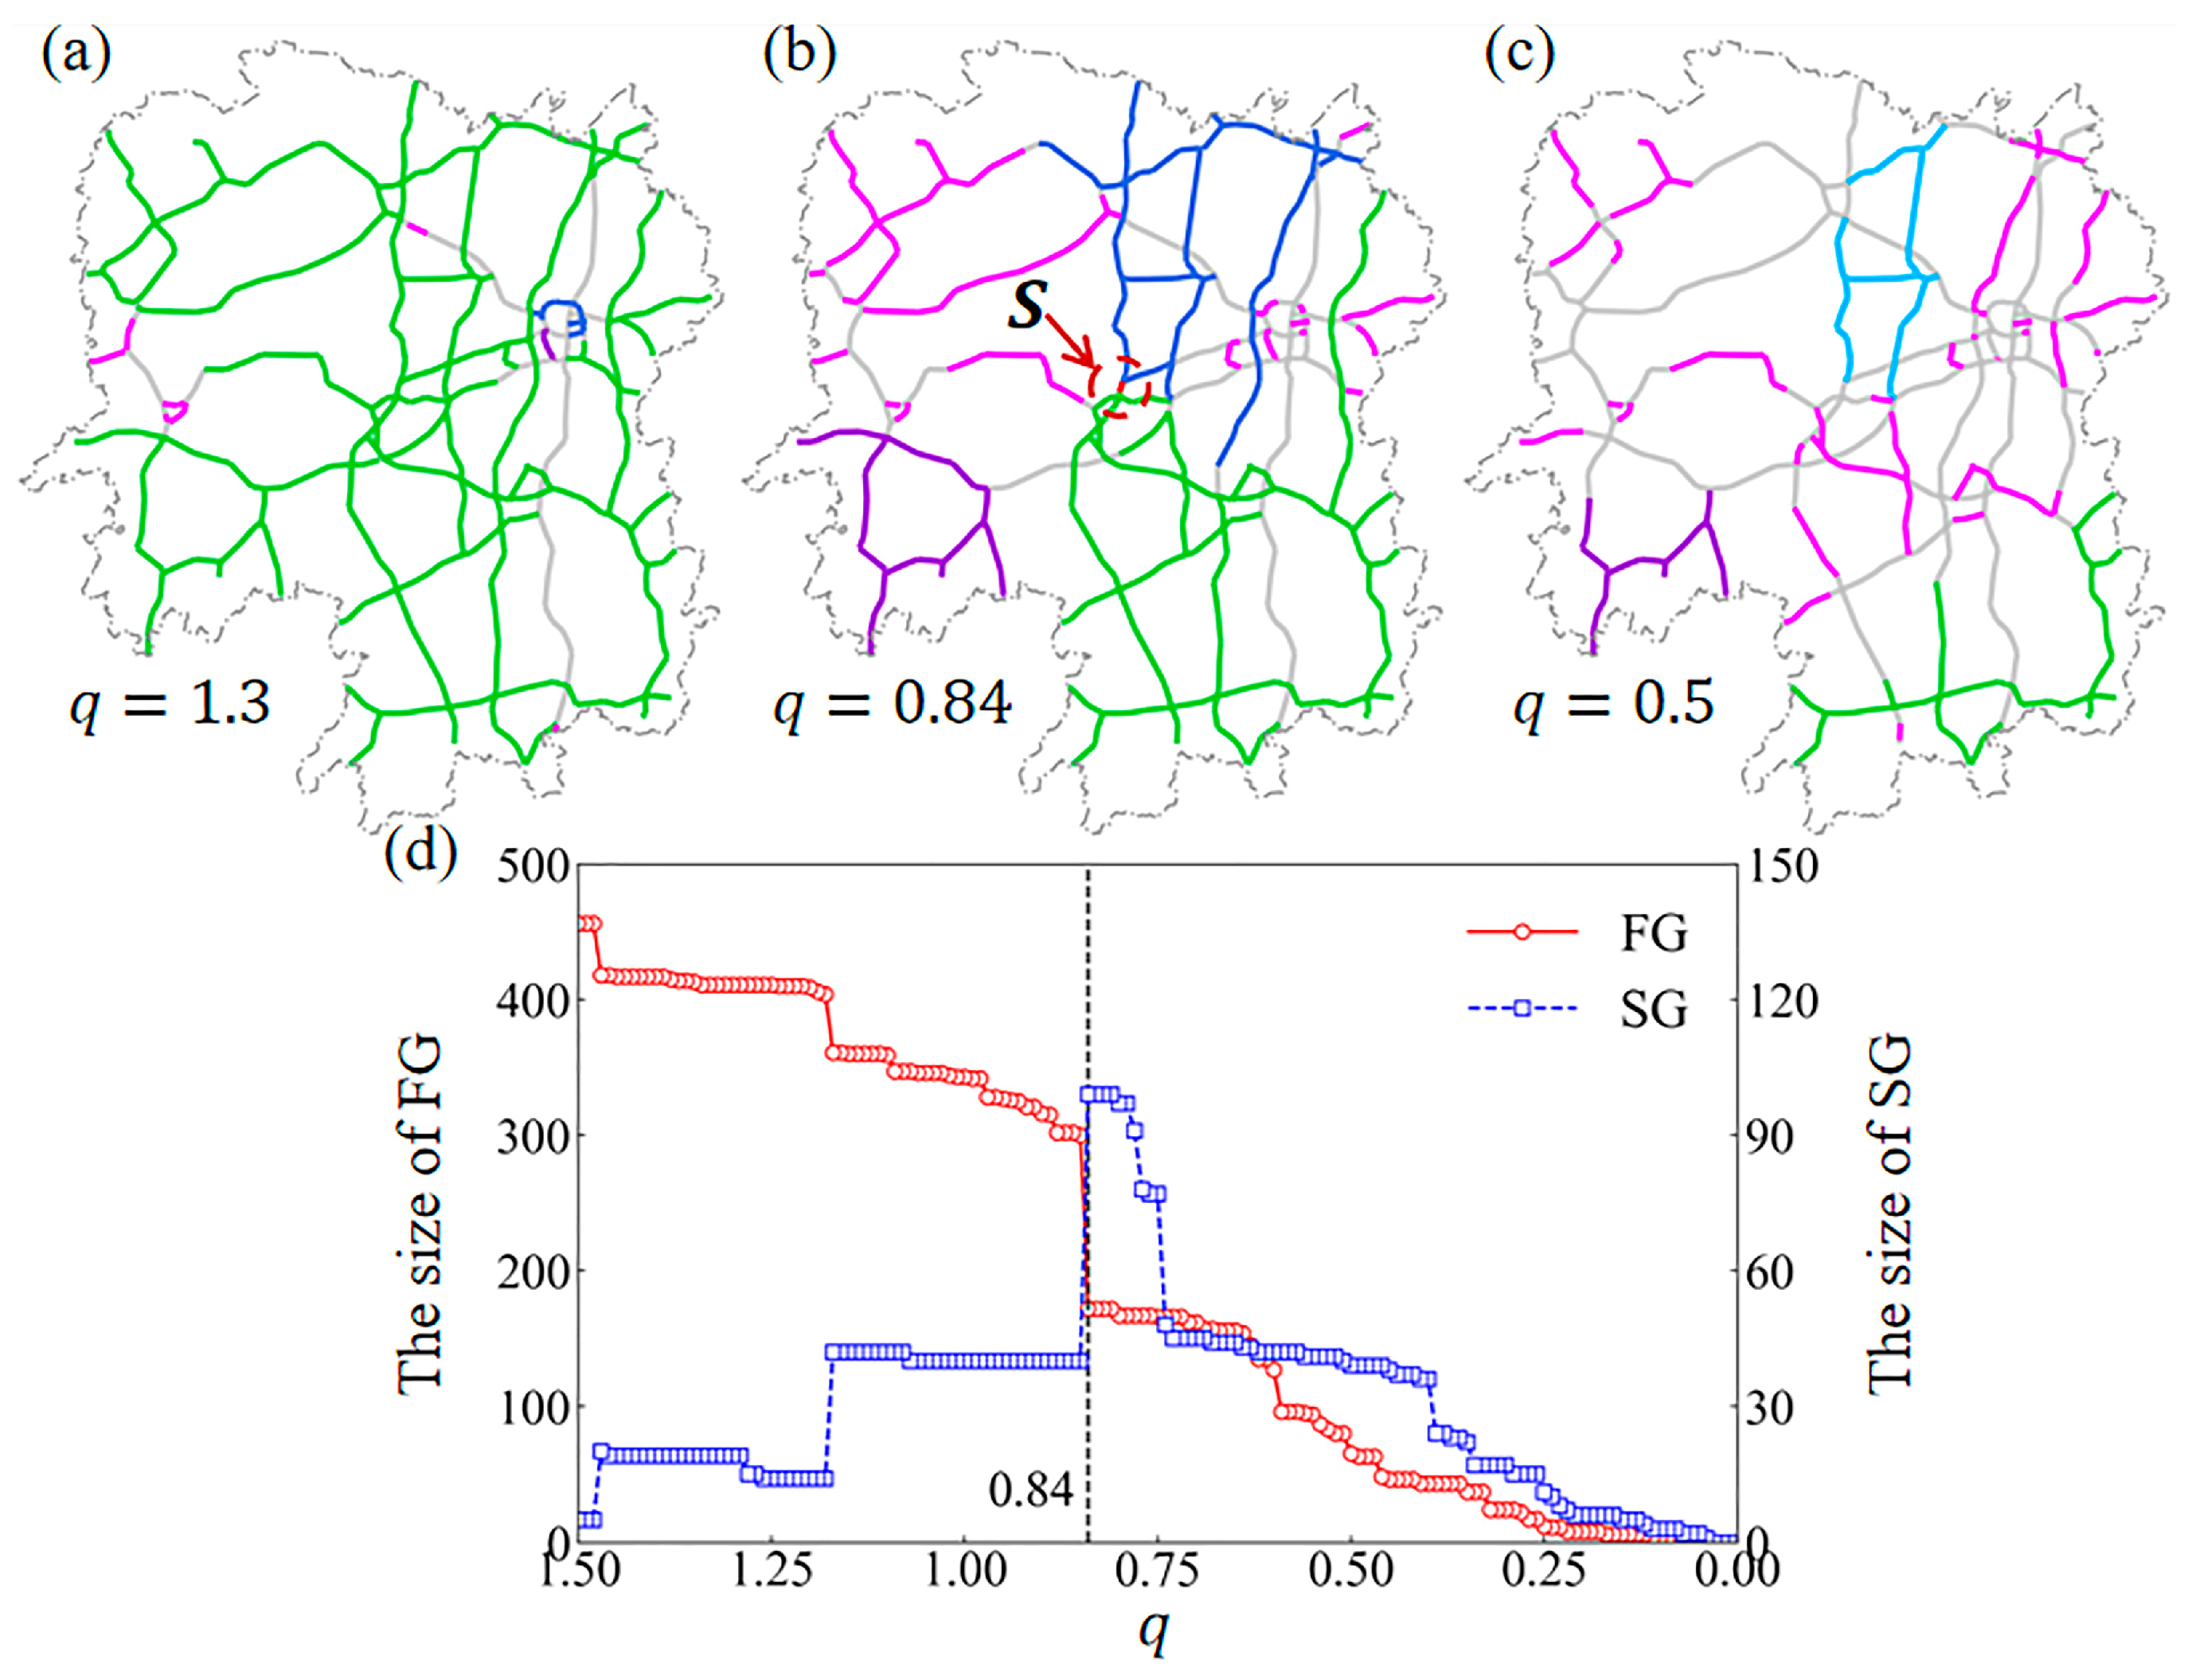
Existing methods usually located the highway bottlenecks based on each highway segment’s traffic state (e.g., traffic speed, traffic flow), paying less attention to the segment’s role in maintaining the functional connectivity of the highway network. In the present study, we employed the network percolation approach to identify the highway bottleneck. The service level of the highway network could be considerably enhanced by slightly reducing the congestion of the identified bottleneck;
(2)
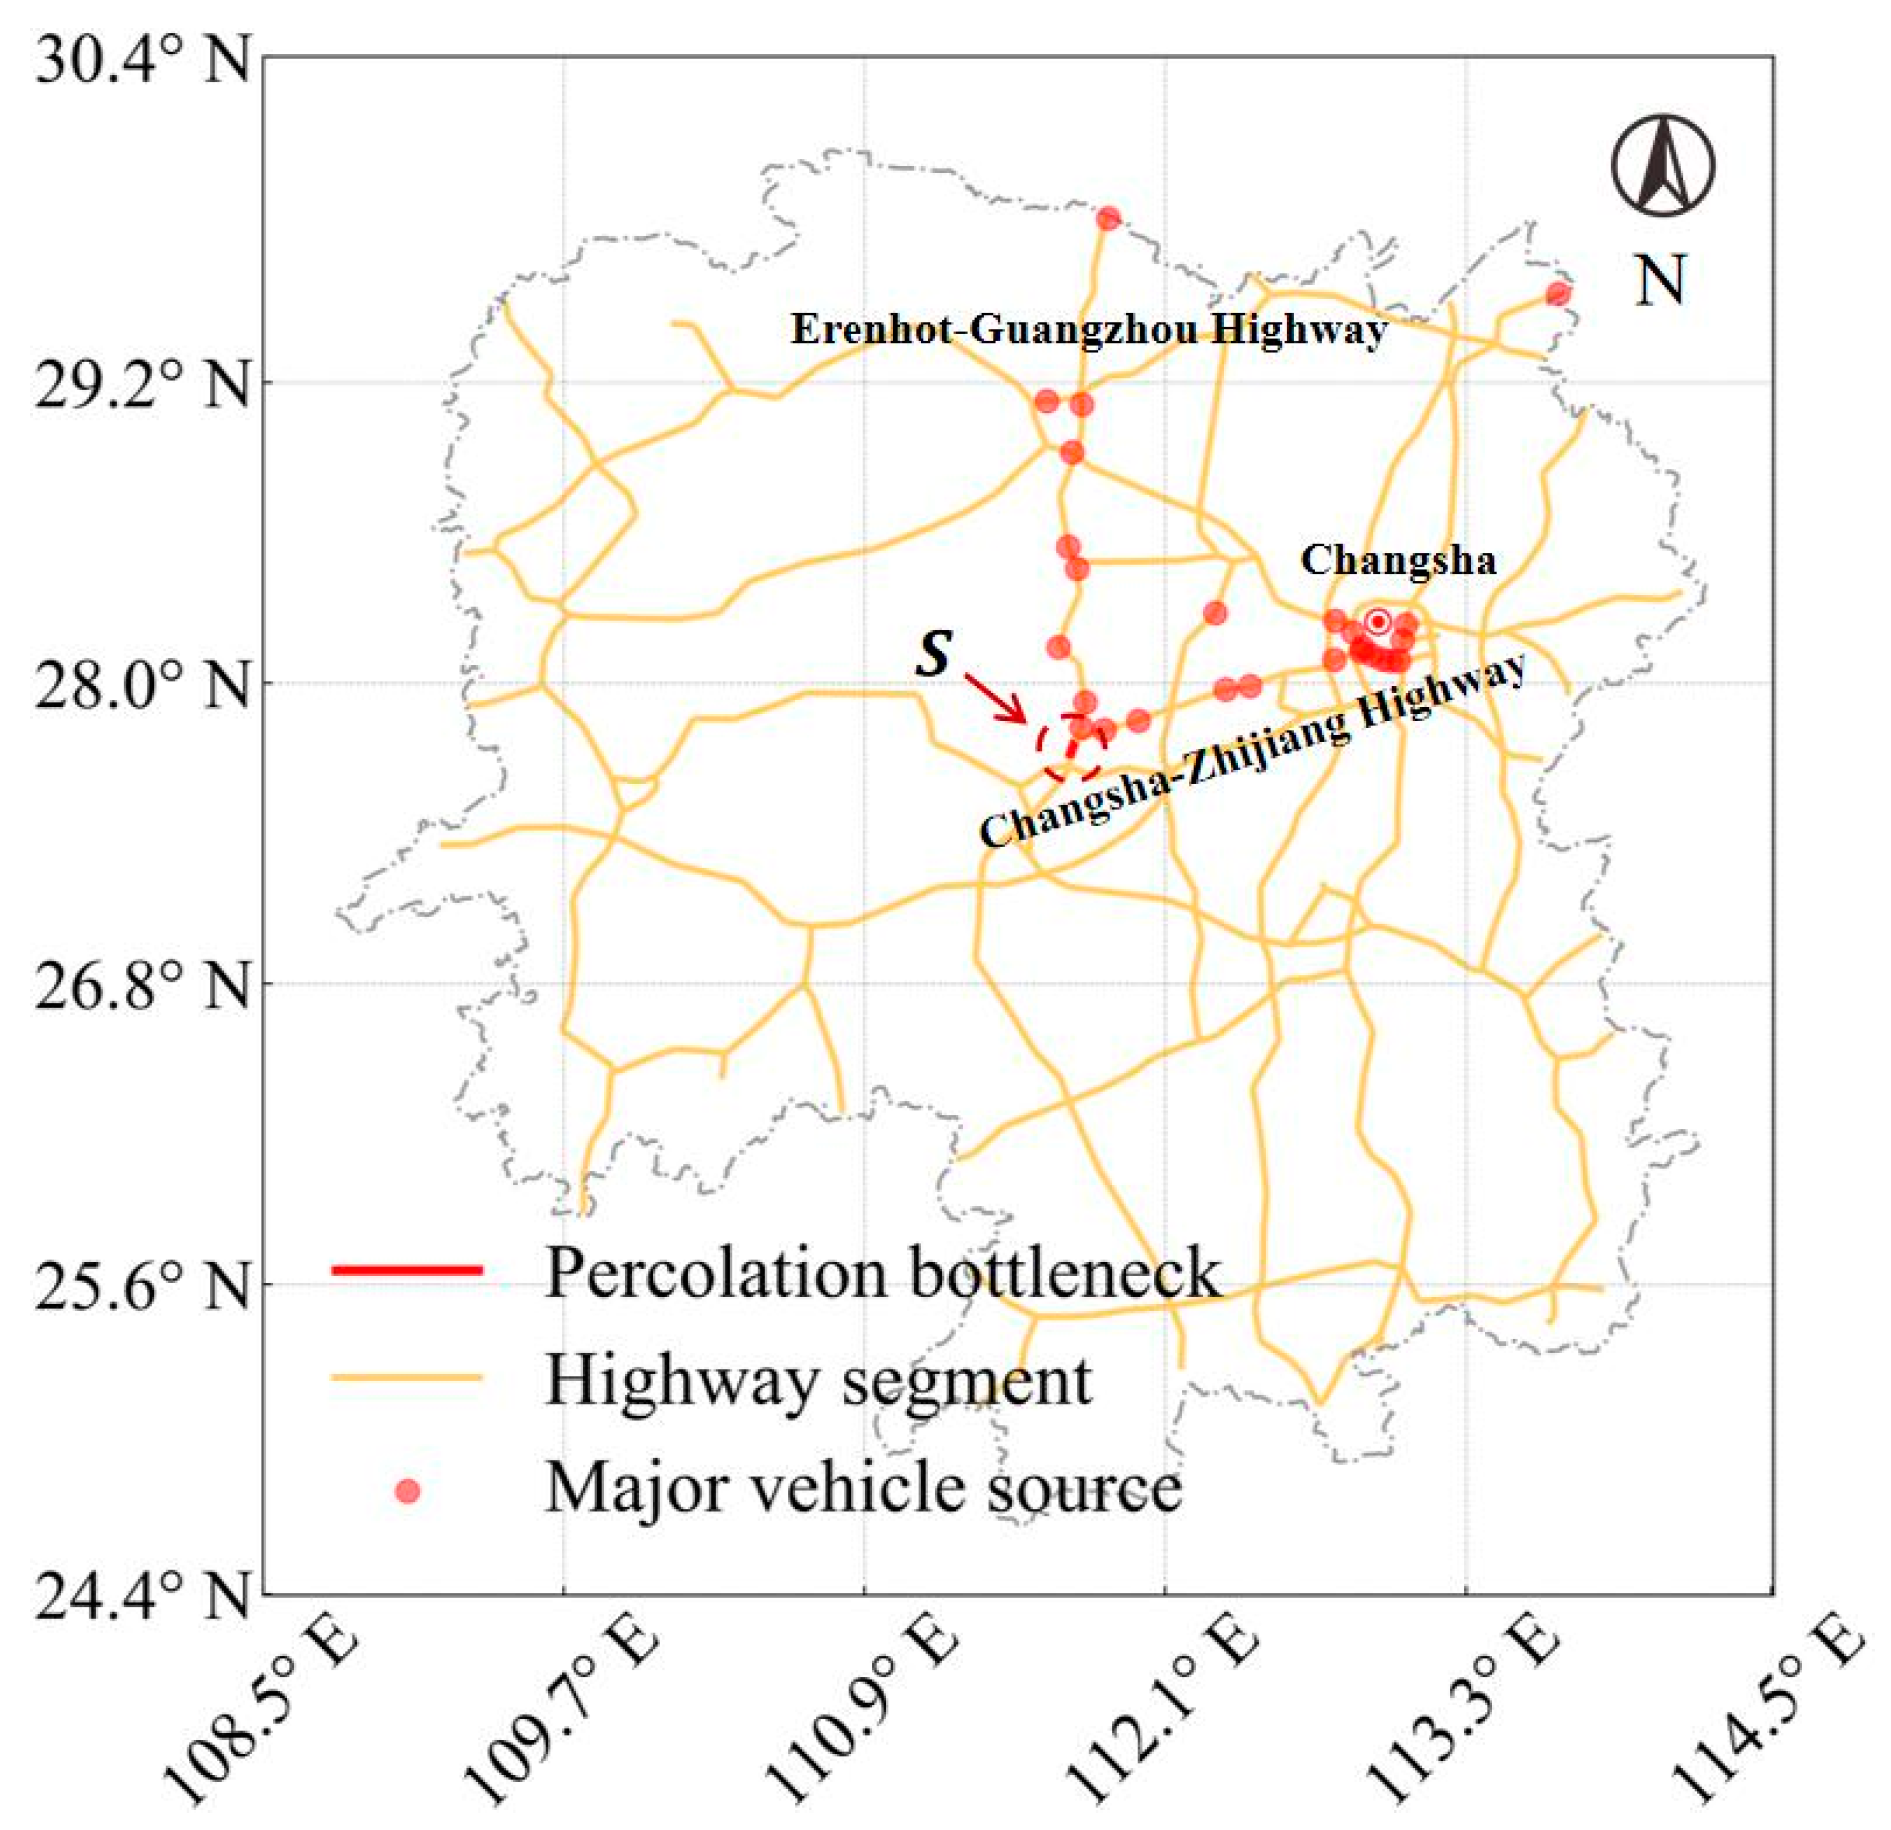
Existing on-ramp control approaches were, in general, developed for small theoretical networks or localized highway segments. In the present study, we filled the research gap by pinpointing the major vehicle sources of the bottleneck segment and developing a targeted on-ramp control approach applicable to large-scale highway networks based on the major vehicle source information.
The remainder of this paper is organized as follows. Section 2 reviews previous studies and applications in the field of on-ramp control and methods for identifying highway bottlenecks. Section 3 introduces the used highway network data and travel demand data. Section 4 presents the method for identifying the percolation bottleneck segment and the developed percolation-bottleneck-based on-ramp control approach. In Section 5, the proposed approach is validated using the actual data of the Hunan highway network. In Section 6, the advantage, limitations, and practical feasibility of the proposed on-ramp control approach are discussed. Section 7 concludes the results and findings and discusses future research directions. Some data calculations are presented in Appendix A.

2. Literature Review

On-ramp control models can be classified into the local on-ramp control models and the coordinated on-ramp control models. In general, a local on-ramp control model generates the optimal control rate at one upstream on-ramp to decrease the traffic flow of the congested highway segment [22]. For example, Xu et al. [23] developed a fuzzy logic control-based local on-ramp control model to generate the optimal control rate for a single controlled on-ramp. There were also some studies improving traditional local on-ramp control models, such as the ones by Smaragdis and Papageorgiou [24], who improved the Asservissement Linéaire d’Entrée Autoroutière (ALINEA) strategy by proposing the flow-based ALINEA strategy and the upstream-occupancy-based ALINEA strategy. However, given that the traffic flow of a congested highway segment is usually originated from many entrances of the highway, local on-ramp control models sometimes could not mitigate traffic congestion effectively.
Given the limitation of local on-ramp models, coordinated on-ramp control models have been more widely investigated in recent years. Papamichail et al. [25] developed a hierarchical model to generate the coordinated on-ramp control scheme and validated their model using the Amsterdam ring-road data. Zhang et al. [26] proposed a coordinated on-ramp control model based on feedback control and artificial neural networks (ANN). Greguric et al. [27] integrated coordinated on-ramp control and variable speed limit to simulate automatic vehicle control in a highway section of Zagreb, Croatia. In order to mitigate traffic congestion and reduce travel delays, Peng and Xu [28] proposed a coordinated on-ramp control model by analyzing each on-ramp’s contribution to traffic congestion. Sun et al. [29] used the traffic state information to identify the on-ramps for implementing traffic control. Benmohamed and Meerkov [30] defined the expected traffic flow reduction in a highway segment and calculated the control rate at each on-ramp to meet the congestion mitigation requirements.
Many countries have implemented on-ramp control strategies in practical highway transportation management. The United Kingdom applied on-ramp control schemes on the M6 and M8 highways to decrease travel delays [9,10]. ALINEA was applied on the Paris highways and the A10 West Highway of Amsterdam [11,12,13]. An electronic system named TAngenziale di NApoli (TANA) was implemented on the highway of Naples, Italy [14]. The Hanshin Expressway Public Corporation in Japan operated an automated traffic control system to avoid traffic congestion by restricting vehicles from entering highways at on-ramps [15,16]. The California Department of Transportation in the United States developed a centrally controlled segmented system-wide adaptive ramp metering (SWARM) system [17]. The Minnesota Department of Transportation in the United States developed a ramp metering system under the Integrated Corridor Traffic Management (ICTM-RMS) project [18]. In Australia, a heuristic ramp-metering coordination (HERO) algorithm was implemented on the Monash highway to improve traffic conditions [19]. In China, on-ramp control approaches were widely implemented on many highways (e.g., the Changsha–Yiyang Highway [20]) to facilitate highway transportation management. On-ramp control played an important role in Turkey’s highway traffic management systems [21].
Previous studies indicated that the traffic conditions of a highway network were greatly affected by the traffic conditions of several key bottleneck segments [31,32,33]. Consequently, improving the traffic conditions of the bottleneck segments was regarded as a feasible and effective way of enhancing the transportation efficiency of a highway network [34,35]. There were a number of studies focusing on the on-ramp control approaches targeting the bottleneck segments. Zhang and Levinson [36] investigated the effectiveness of an on-ramp control approach in improving the capacities of highway bottleneck segments. Kerner [37] analyzed the congestion patterns of the bottleneck segments in a highway and proposed an effective countermeasure. Ma et al. [38] proposed an on-ramp control strategy to relieve the chaotic traffic situation in the highway bottleneck region.
A number of methods were proposed for identifying highway bottlenecks. These methods were based on the analysis of queue length, traffic flow, or traffic speed [39,40]. Kerner [41] defined the highway bottleneck as the segment where traffic flow suddenly had a large increase. Ban et al. [42] and Margiotta et al. [43] regarded the highway bottleneck as the segment with traffic flow exceeding its capacity. Chen et al. [44] identified the highway bottleneck segment, which experienced frequent congestion. Zhang and Levinson [45] analyzed the properties of queue discharge flows to locate the highway bottleneck segments. Gong et al. [46] defined the top 30 most congested highway segments as the highway bottleneck segments. Bertini et al. [47] used the maximum upstream speed threshold and the minimum differential speed threshold to identify the highway bottleneck segments. Chen et al. [44] used the difference in vehicle speeds in a short period as the index for identifying highway bottlenecks. Jose et al. [48] regarded the highway bottleneck as the segment where traffic speed had a significant decrease.
In recent years, network-based approaches were also employed to identify the bottlenecks in a transportation network [49,50]. These approaches focused on the segments whose breakdown would disrupt the functional connectivity of the transportation network. For example, He et al. [51] identified the bottleneck sections of an urban metro and discovered that the functional connectivity of the urban metro network could be greatly enhanced by slightly reducing the congestion of the bottleneck sections. Li et al. [52] employed the network percolation approach to identify the bottleneck road segments and discovered that slightly increasing the traffic speeds of the bottleneck segments could greatly improve the functional connectivity of the road network. Lv et al. [53] employed the network percolation approach to pinpoint the bottleneck sections of an urban metro and improved the functional connectivity of the urban metro network by reducing the load ratios of the bottleneck sections.

3. Data

3.1. Highway Network Data

The used highway network data were provided by the Hunan Communications Research Institute Co., Ltd. and the Baidu Map Open Platform. The Hunan highway network was composed of 506 nodes (i.e., on-ramps, intersections) and 550 links (i.e., highway segments). The recorded node information includes the ID and the coordinate of each on-ramp or intersection. The recorded link information includes the highway ID, the origin node ID, the destination node ID, the length, the number of lanes, and the designed speed of each highway segment. Moreover, volume over capacity ( V O C ) was used to quantify the service level of a highway segment (see Appendix A). The highway network of Hunan Province with detailed spatial context information is shown in Figure 1.

3.2. Travel Demand Data

The travel demand data were provided by the Hunan Communications Research Institute Co., Ltd. In this study, the travel demand data collected on 13 May 2019 (an ordinary weekday) were used. The used travel demand data recorded the number of trips between each pair of on-ramps during each 1-h time window. A total of 730,326 trips were recorded during the data collection period. To simulate actual traffic conditions, we up-scaled the number of trips between each pair of on-ramps by eight times (see Appendix A).

4. Methods

4.1. Network Percolation Approach

We used the network percolation approach [54] to identify the bottleneck segment of the studied highway network. Firstly, the highway network was regarded as a connected giant cluster. Next, links were gradually removed from the giant cluster according to their V O C :
I a = { 1 ,     V O C a q 0 ,     V O C a > q
where I a determines if highway segment a will be removed from the giant cluster, and q is a predefined V O C threshold. Highway segment a is defined as functional (can meet the required level of service) if V O C a q (i.e., I a = 1 ) and not functional if V O C a > q (i.e., I a = 0 ) [52,53]. The retained highway segments in the giant cluster can meet the required level of service. In other words, travelers can enjoy a qualified level of service V O C a q inside the giant cluster but cannot enjoy the qualified level of service outside the giant cluster.
With the decrease in q (i.e., an increase in required service level), the giant cluster gradually split into small clusters. At the critical threshold q c , the giant cluster suddenly collapsed, and the size of the second largest cluster reached its maximum value (the size of a cluster is the number of nodes in the cluster). The highway segment that had a V O C = q c and connected the largest and second-largest clusters was identified as the percolation bottleneck [52]. Identifying the percolation bottleneck is important because slightly decreasing the V O C of the percolation bottleneck can maintain the functional connectivity of the highway network at a higher required level of service.

4.2. Traffic Flow Simulation

The travel demand data only recorded the number of trips between each pair of on-ramps during each 1-h time window. The time-varying traffic flow information, which serves as the fundamental input for most on-ramp control models, was not available. Hence, we simulated the movements of vehicles to estimate the time-varying traffic flows in the highway network under the following assumptions: (1) each driver selected the shortest path from the origin on-ramp to the destination on-ramp; (2) the departure time of each vehicle followed the uniform distribution [55]; (3) the vehicle speed followed the normal distribution [56].
We used the Dijkstra algorithm [57] to infer the path of each highway trip. The departure time of each vehicle ( t s ) during each 1-h time window t was assigned following the uniform distribution. The vehicle speed was updated every 2 min (i.e., Δ t = 2 min) after the vehicle entered the highway from its origin on-ramp. The mean and standard deviation of vehicle speed were set to 88.671 km/h and 13.744 km/h, respectively [58]. For each vehicle passing through the percolation bottleneck, the travel distance d from the origin on-ramp to the percolation bottleneck was calculated. The time that the vehicle arrived at the percolation bottleneck t e was calculated using Equation (2).
t e = t s + ( n t 1 ) · Δ t + ( d m n t 1 Δ t · v m ) v n t
where v m represents the vehicle speed during the m th time interval, m { 1 , 2 , , n t } , n t is the total number of time intervals lasted from the time that the vehicle entered the highway to the time that the vehicle arrived at the percolation bottleneck. We calculated the traffic flow of the percolation bottleneck f k during each 5-min time window k , k { 1 , 2 , , 288 } .

4.3. Percolation-Bottleneck-Based on-Ramp Control Approach

We defined vehicle sources as the on-ramps from where the vehicles passing through the percolation bottleneck entered the highway [59,60]. The vehicle sources were ranked according to their contributions to the traffic flow of the percolation bottleneck. Next, we defined the major vehicle sources (MVSs) as the top-ranked M vehicle sources contributing 80% of the traffic flow of the percolation bottleneck [59]. The identified MVSs were used as the on-ramps for implementing the traffic control schemes.
We defined 90% of the maximum f k as the upper bound of ordinary traffic flow f b [61]. The heavy traffic period of the percolation bottleneck was set to the time period during which traffic flow exceeded f b . We estimated the travel time from each MVS to the percolation bottleneck based on the travel distance d and the average vehicle speed (i.e., 88.671 km/h [58]). For each MVS, the traffic control period started c × 15 min before the heavy traffic period, where c is the total number of 15-min time intervals lasted from the time that the vehicle entered the highway from the MVS to the time that the vehicle arrived at the percolation bottleneck. We divided the traffic control period of each MVS into N 15-min phases, and the traffic control scheme changed every 15 min.
The objective of the proposed on-ramp control model is to avoid traffic overload at the percolation bottleneck. The decision variable r i j is the extra waiting time that a vehicle takes to enter the highway from MVS i during phase j , where i { 1 , 2 , M } and j { 1 , 2 , N } . That is, vehicles are postponed entering the highway network by r i j minutes. To ensure reliable operation, r i j was restricted to less than 5 min. We used R = [ r 11 , r 12 , , r i j , , r M N ] to represent the traffic control scheme, which was solved using the particle swarm optimization (PSO) algorithm.
The PSO algorithm is an evolutionary algorithm widely used to solve the combinatorial optimization problems in highway on-ramp control [62,63,64], probably because it is characterized by the good features of a simple concept, easy implementation, high operating efficiency, and relatively few parameters [65,66]. Therefore, we also employed the PSO algorithm to solve the optimized traffic control schemes in the present study. The main steps of the PSO algorithm are elaborated as follows (Figure 2):
Step 1: The number of particles was set to n p , where each particle represents a traffic control scheme R = [ r 11 , r 12 , , r i j , , r M N ] . An initial position X n (i.e., the initial solution) and an initial velocity V n (i.e., the perturbation of solution) were randomly generated for each particle, where n is the particle ID, n { 1 , 2 , , n p } .
Step 2: The initial fitness Fn (i.e., the objective function value) was calculated for each particle.
F n = f c k f b λ · ( f c k f b ) 2 + f c k < f b ( 1 λ ) · ( f b f c k ) 2
where f c k is the number of vehicles arriving at the percolation bottleneck in time window k after implementing the traffic control scheme X n , k { 1 , 2 , , 288 } . The penalty coefficient λ was set to 0.9. In Equation (3), a small F n represents that the time that each vehicle arrives at the percolation bottleneck is more evenly distributed. We used X n as the local optimal position P n for each particle (i.e., the local optimal solution) and used the X n with the smallest F n as the global optimal position G (i.e., the global optimal solution).
Step 3: We updated the velocity of each particle using Equation (4) and then updated the position of each particle using Equation (5).
V n = w · V n + c 1 · r 1 · ( P n X n ) + c 2 · r 2 · ( G X n )
X n = X n + V n
where w is the inertia weight; c 1 and c 2 represent the individual acceleration factor and the collective acceleration factor; r 1 and r 2 are random numbers between 0 and 1. The random values were regenerated when Equation (4) was used to update the velocity.
Step 4: The updated position X n was input into Equation (3). For each particle, if F n of X n is smaller than F n of P n , replace P n with X n . If F n of X n is smaller than F n of G , replace G with X n .
Step 5: We iteratively executed Step 3 and Step 4. If the total number of iterations reaches the given maximum number of iterations I m , stop the algorithm. The final global optimal solution G was used as the generated traffic control scheme.

5. Results

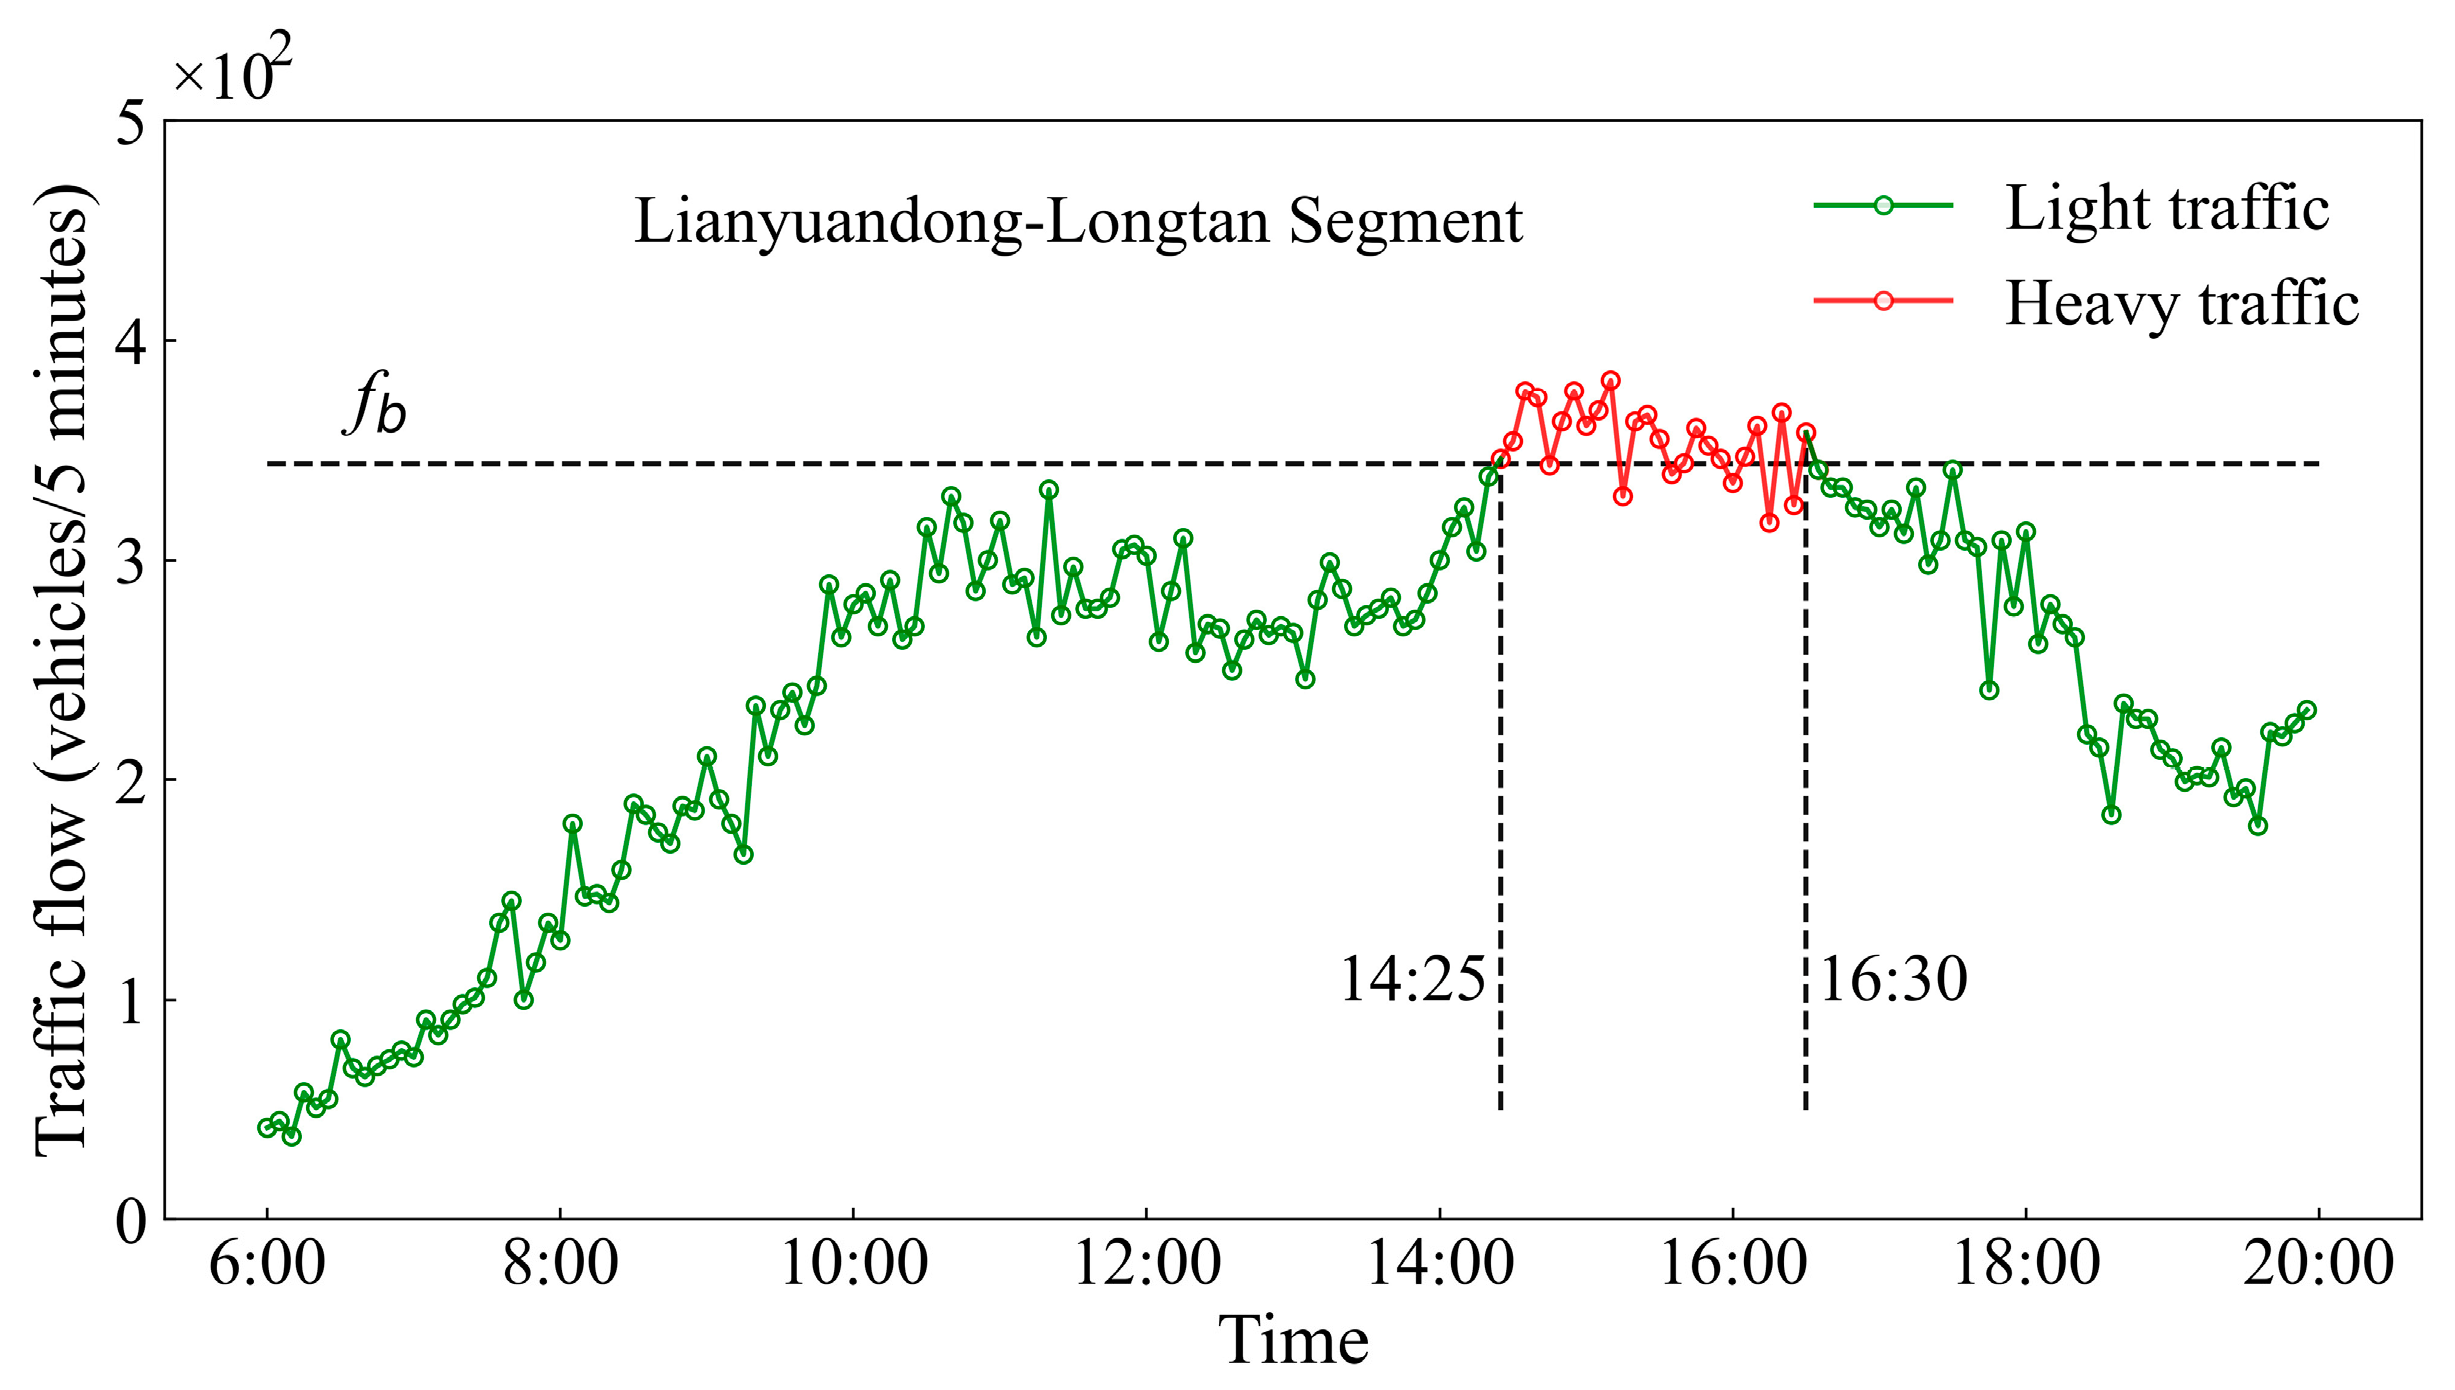
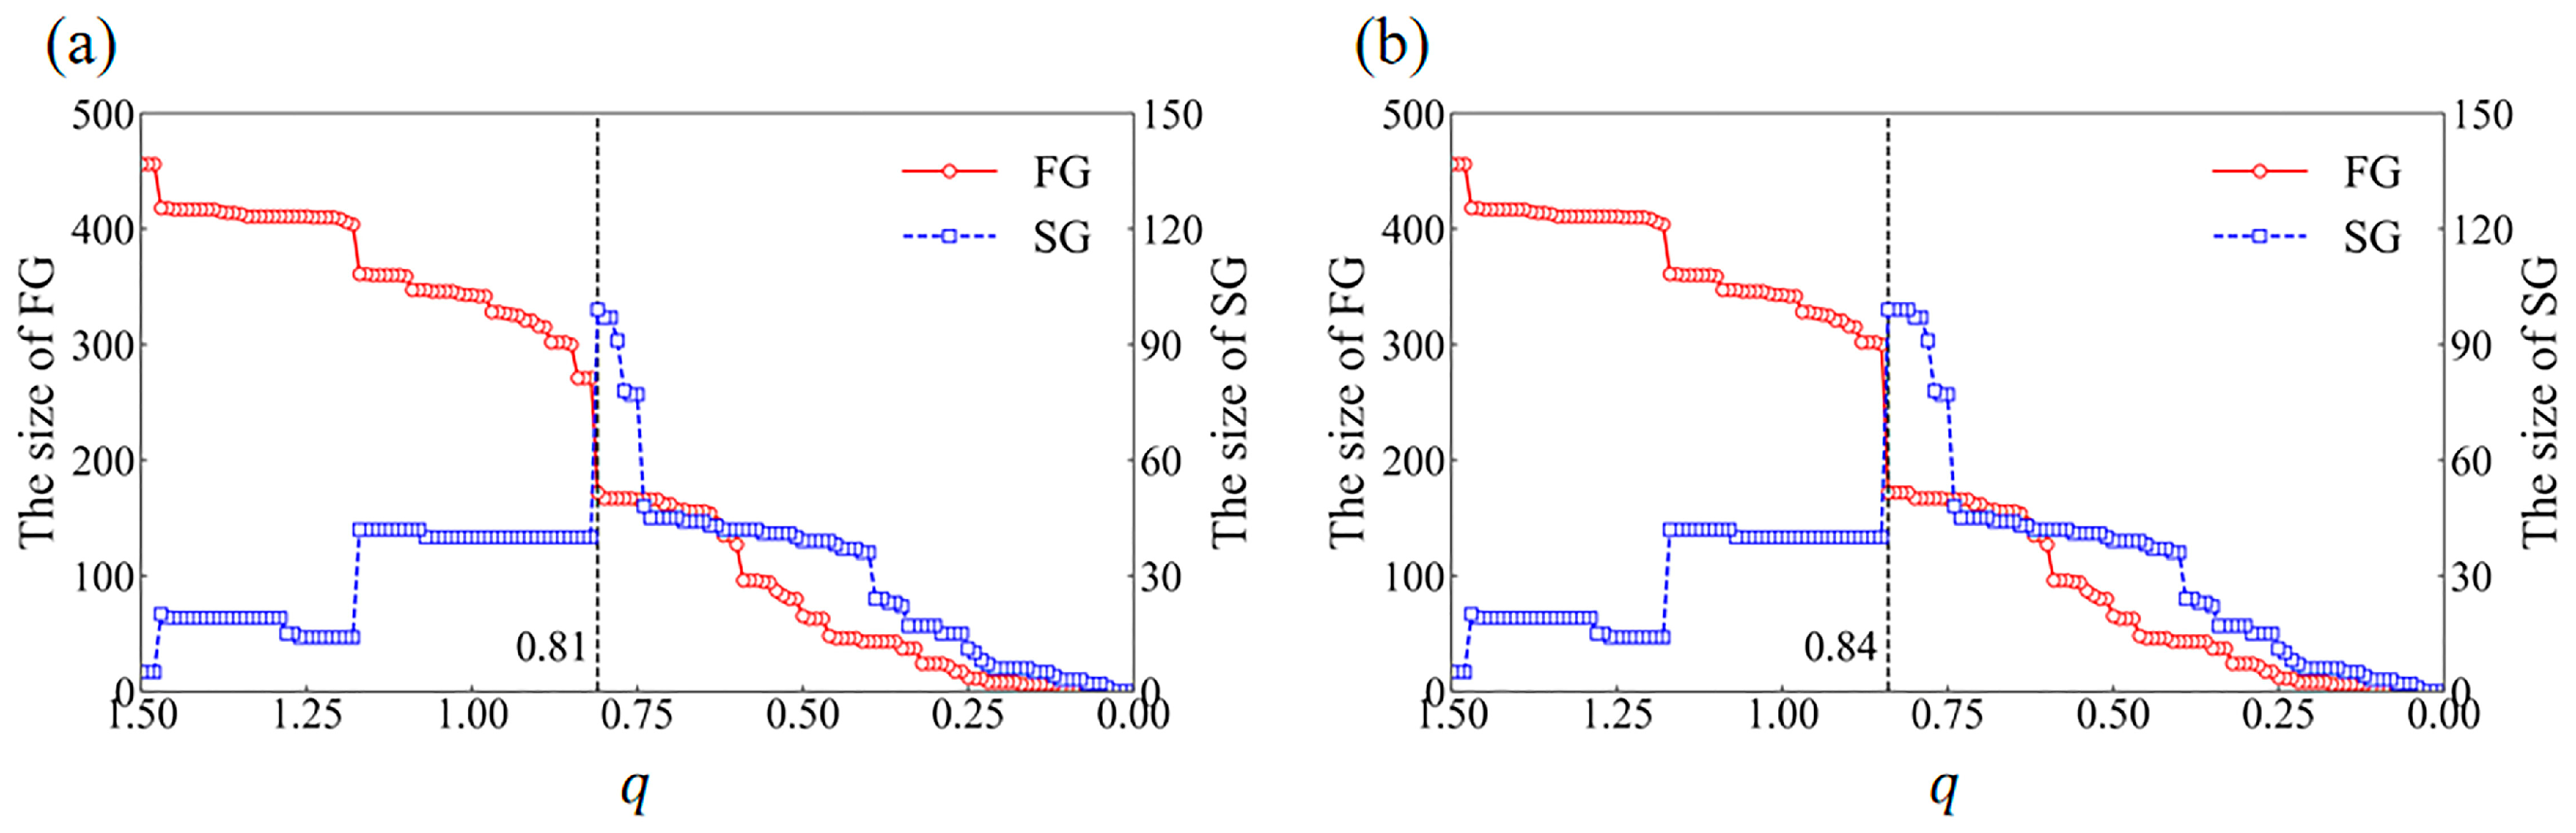
5.1. Identifying the Percolation Bottleneck

We simulated the vehicle movements using the method introduced in Section 4.2 and used the time period of 14:00–15:00 p.m., 13 May 2019, to illustrate the network percolation process. There was a connected giant cluster if the requirement of service level was low (Figure 3a). However, with the increase in the required service level, the highway network gradually decomposed into several isolated clusters (Figure 3b) and finally collapsed (Figure 3c). We further found that with the decrease in q , the size of the largest cluster (FG) gradually decreased, whereas the size of the second largest cluster (SG) reached its maximum value at q = 0.84 (Figure 3d), implying that the critical threshold of q was q c = 0.84 . Consequently, the highway segment with V O C being equal to q c and connected to FG and SG was identified as the percolation bottleneck. As shown in Figure 3b, the identified percolation bottleneck is the Lianyuandong–Longtan segment ( S ) of the Erenhot–Guangzhou Highway. Slightly decreasing the V O C of the percolation bottleneck could maintain the functional connectivity of the highway network at a higher required level of service.

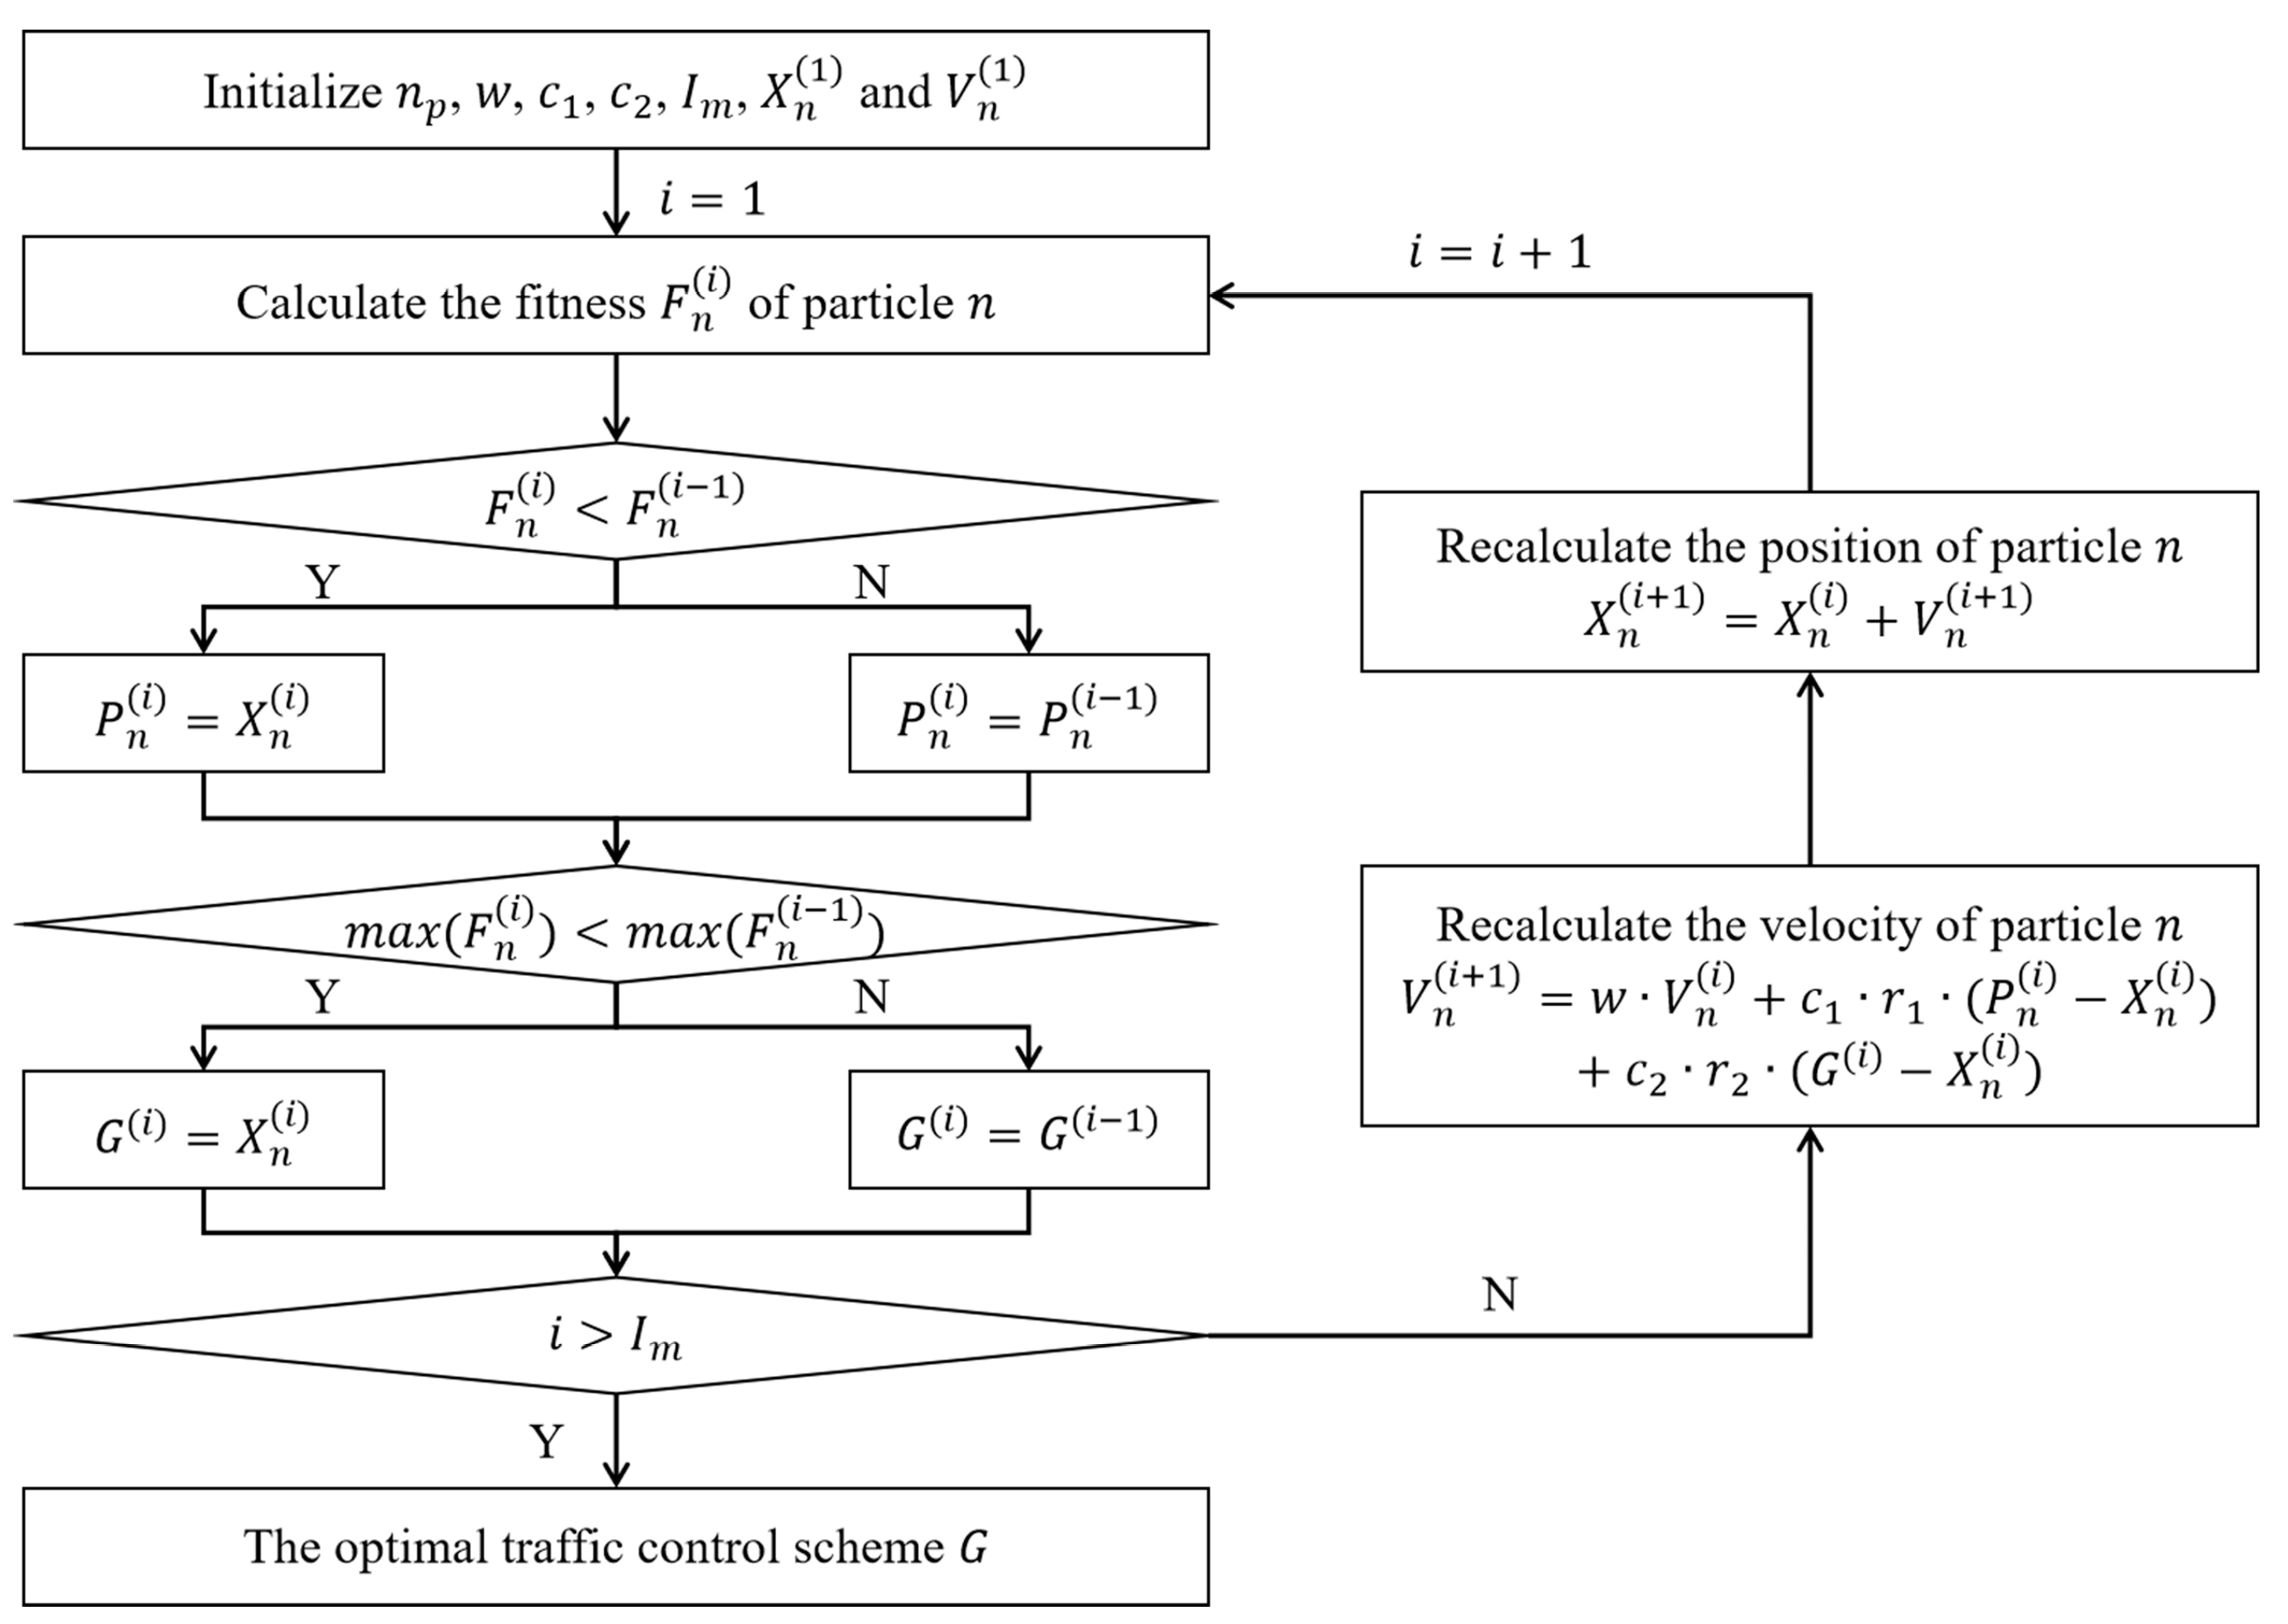
5.2. Generating the Traffic Control Scheme

We first identified the vehicle sources of the percolation bottleneck and determined the on-ramps for implementing traffic control. For the identified percolation bottleneck (i.e., the Lianyuandong–Longtan segment), a total of 134 vehicle sources and 26 MVSs were located using the method introduced in Section 4.3. As shown in Figure 4, the MVSs of the percolation bottleneck are mainly distributed along the Erenhot–Guangzhou Highway and the Changsha–Zhijiang Highway, and a considerable number of vehicles using the percolation bottleneck come from Changsha (the core city of Hunan Province). Counterintuitively, the MVSs of the percolation bottleneck were not only distributed in its vicinity but also located in some distant areas, suggesting that preventive traffic control could be implemented to mitigate the traffic congestion at the percolation bottleneck.
Next, we determined the traffic control period. First, we calculated the number of vehicles arriving at the percolation bottleneck f k during each 5-min time window k (Figure 5). The maximum value of f k was 382, and the upper bound of ordinary traffic flow f b was set to 343.8. The heavy traffic period started at 14:25 p.m. and ended at 16:30 p.m. (Figure 5). We estimated the travel time from each MVS to the percolation bottleneck, finding that the longest travel time was about 212 min from the MVS Yanglousi to the percolation bottleneck. Consequently, the traffic control period was set from 10:40 a.m. to 16:30 p.m., which covered 24 traffic control phases. We generated a vector R = [ r 11 , r 12 , , r i j , , r M N ] to represent the traffic control scheme, where M = 26 is the number of controlled on-ramps and N = 24 is the number of traffic control phases.
We solved the traffic control scheme using the PSO algorithm (see Section 4.3). In the PSO algorithm, the number of particles n p was set to 20; the inertia weight w was set to 0.72984; the individual acceleration factor c 1 and the collective acceleration factor c 2 were both set to 1.49618, and the maximum number of iterations I m was set to 200 [67,68]. As shown in Figure 6a, the objective function value converges at about 175 iterations. For each controlled on-ramp, vehicles were postponed to enter the highway by waiting extra r i j minutes. We found that the average on-ramp control time was 158.63 s in a phase.
We used Yanglousi on-ramp, Chengtoushan on-ramp, and Changsha on-ramp to illustrate the generated traffic control scheme (Figure 6b–d). The Yanglousi on-ramp was the most distant controlled on-ramp from the percolation bottleneck. The on-ramp also had the maximum number of traffic control phases (24 phases). The Chengtoushan on-ramp was featured with the longest total controlled time (74.6 min), and the Changsha on-ramp was featured with the longest average controlled time in a phase (3.6 min). Figure 6e depicts the average controlled time in each phase, where the maximum value (5 min) is reached at Phase 6 (i.e., 11:55–12:10 a.m.). Figure 6f shows the average controlled time at each on-ramp, where the maximum value is reached at MVS 15 (i.e., the Changsha on-ramp).

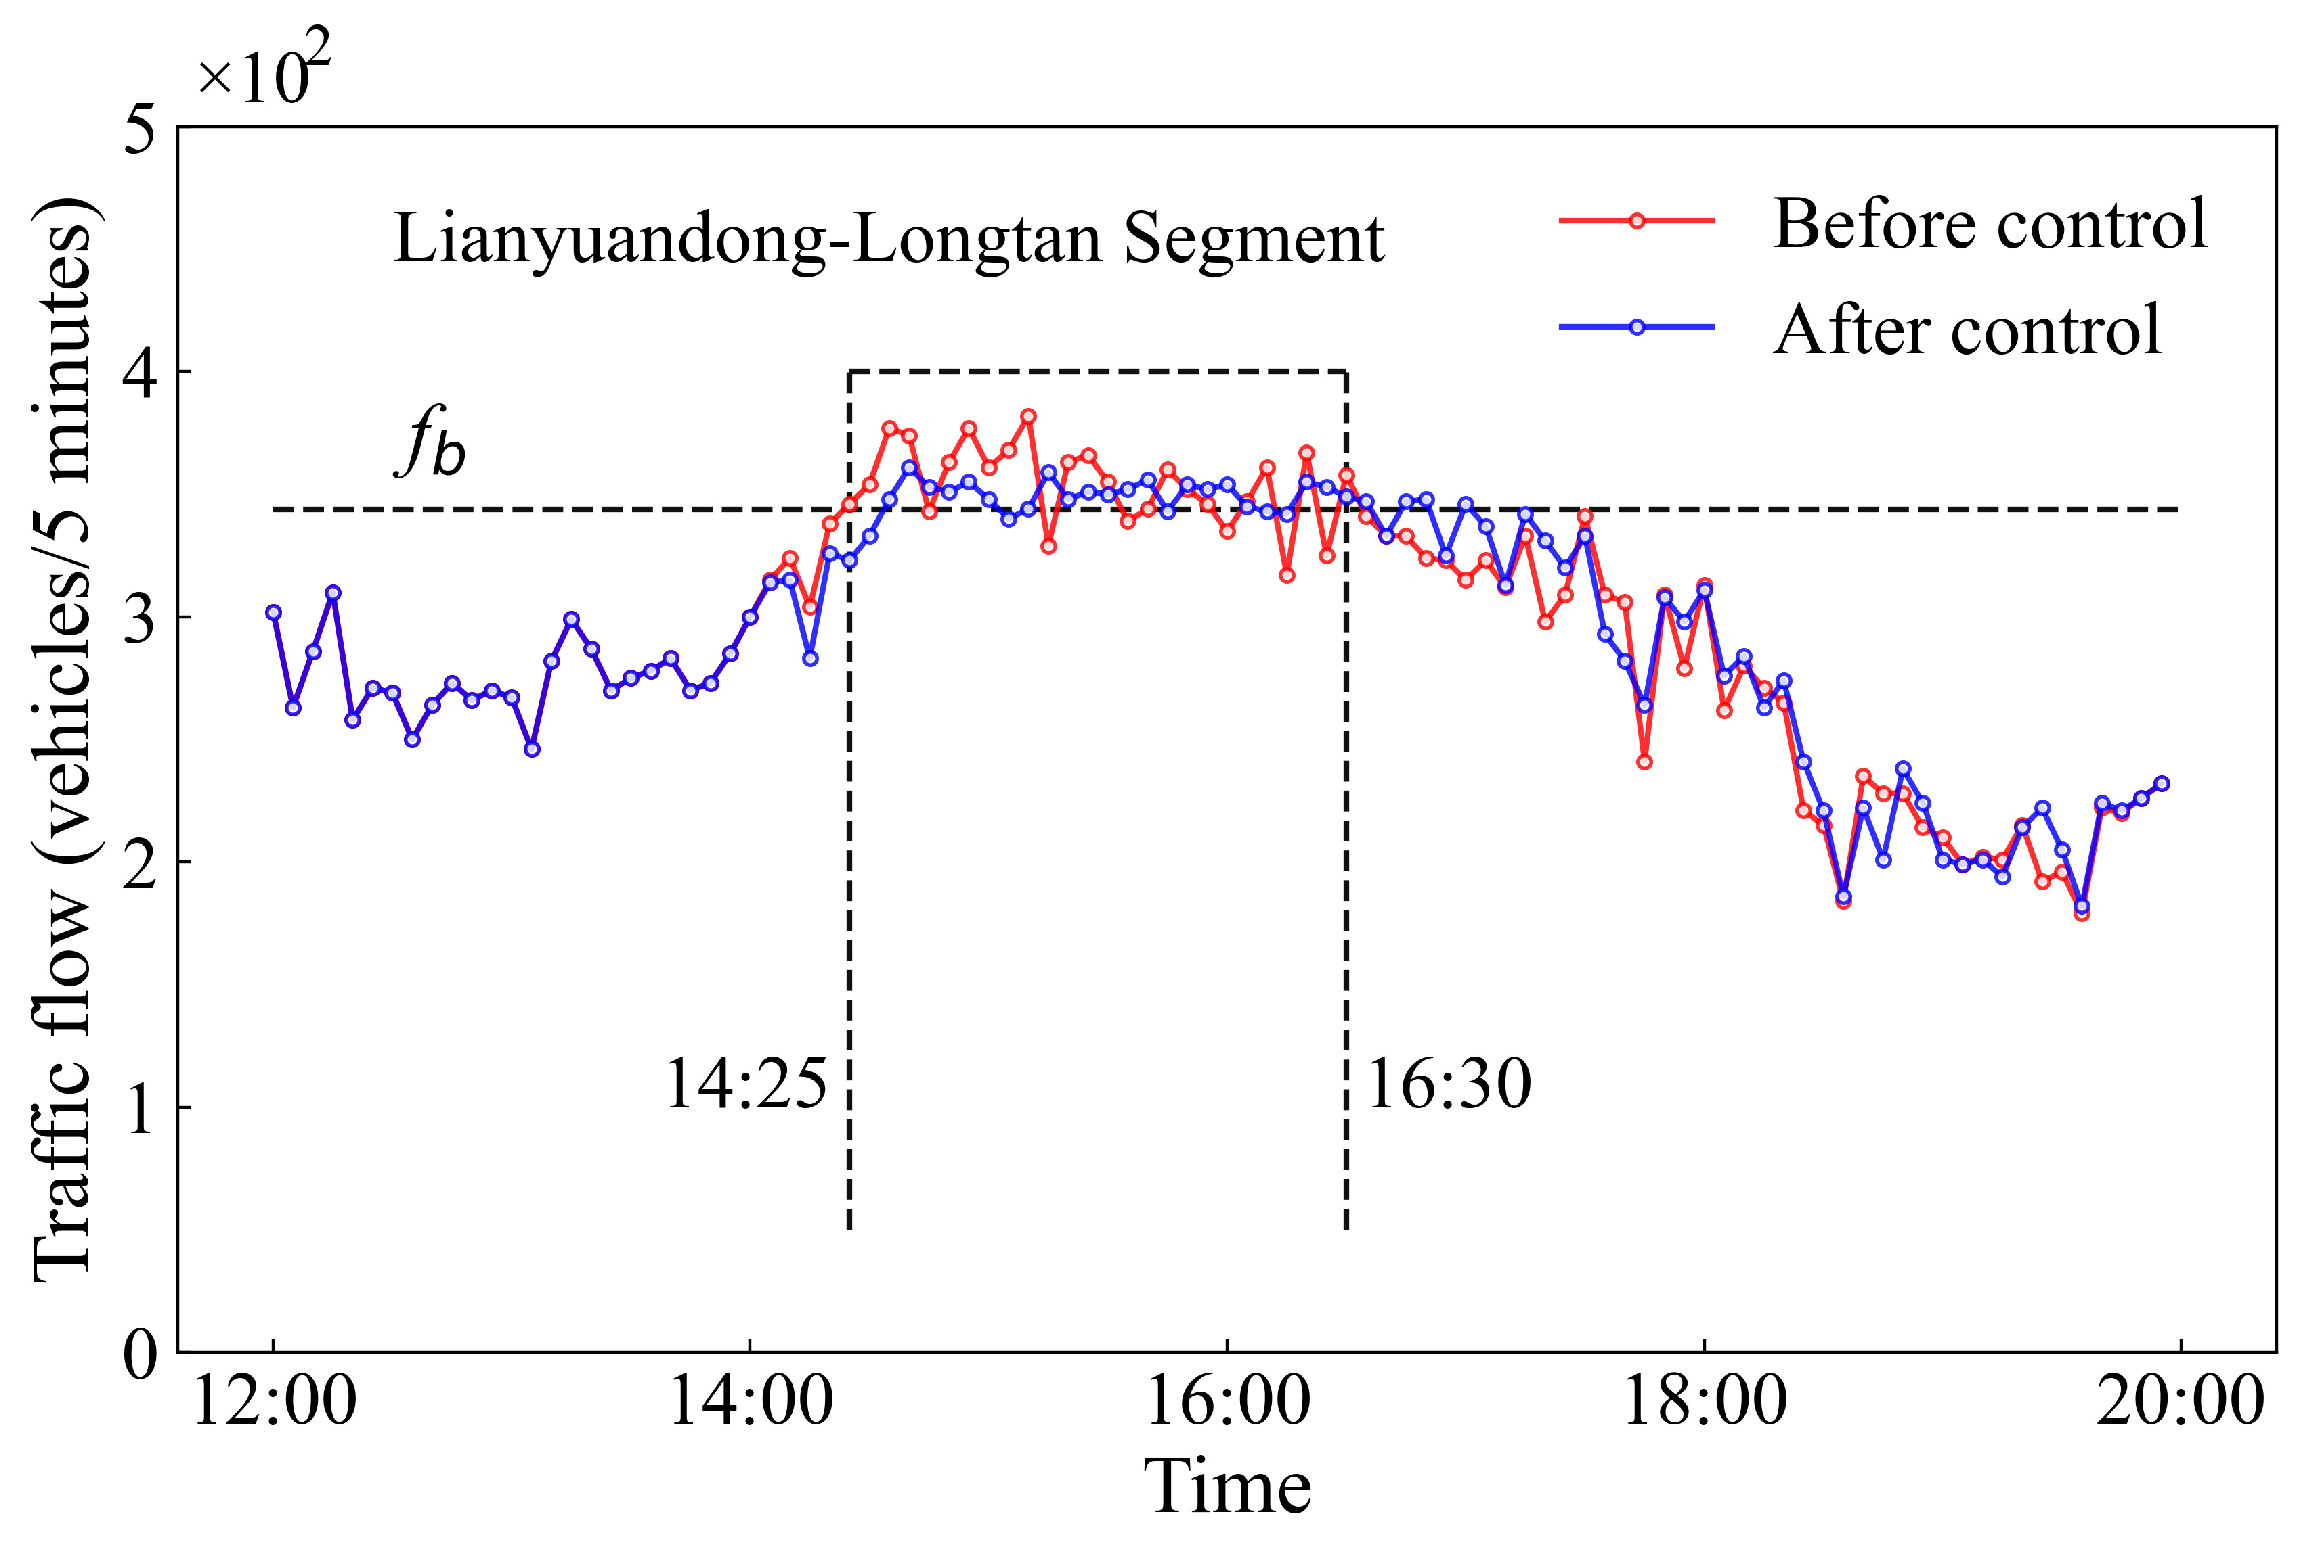
5.3. Evaluating the Generated Traffic Control Scheme

We calculated the number of vehicles arriving at the percolation bottleneck f c k during each 5-min time window k after implementing the traffic control scheme. As shown in Figure 7, there is an obvious decrease in traffic flow at the percolation bottleneck. In particular, the maximum traffic flow reduced by 9.95%, and the total traffic flow during the heavy traffic period reduced by 1.56%, implying that the generated traffic control scheme could alleviate the traffic pressure at the percolation bottleneck.
The generated traffic control scheme also improved the functional connectivity of the highway network. We calculated the V O C of each highway segment after applying the generated traffic control scheme. The critical threshold q c decreased from 0.84 to 0.81 (Figure 8a), implying that the highway network could maintain its functional connectivity at a higher required service level. To further show the advantage of the percolation-bottleneck-based on-ramp control approach, we used the most congested segment (i.e., the Zhaoshan–Zhuyi Viaduct segment of the Beijing–Hong Kong–Macao Highway) as the bottleneck segment and generated the traffic control scheme. As shown in Figure 8b, controlling the traffic flow of the most congested segment does not reduce the critical threshold q c . In other words, the highway network was not able to maintain its functional connectivity at a higher required service level (Figure 8b).

6. Discussion

To further demonstrate the advantage of the proposed approach, we compared the proposed on-ramp control model with five benchmark models. The proposed on-ramp control model and the first benchmark model were both developed to mitigate the traffic congestion of the percolation bottleneck. The second and third benchmark models were developed to mitigate the traffic congestion of the most congested segment. The fourth and the fifth benchmark models were developed for mitigating the traffic congestion of the segment with the largest betweenness centrality [69]. The proposed model, the second and the fourth benchmark models used the MVSs of the bottleneck segment as the candidate-controlled on-ramps, whereas the first, third, and fifth benchmark models randomly selected the same number of upstream on-ramps of the bottleneck segment as the candidate-controlled on-ramps.
As shown in Table 1, the proposed on-ramp control model achieves the best performance in reducing the maximum traffic flow and improving the network’s functional connectivity (i.e., achieving the largest decrease in critical threshold). The benchmark models developed for mitigating the congestion of the most congested segment or the segment with the largest betweenness failed to improve the network’s functional connectivity, showing the importance of identifying the percolation bottleneck. Moreover, using the MVSs of the bottleneck as the controlled on-ramps usually achieved a better congestion mitigation effect, highlighting the importance of identifying the major vehicle sources.
The proposed on-ramp control model focused on improving the functional connectivity of the highway network. It performed not as well as the second benchmark model in reducing the total traffic flow during the heavy traffic period, which could be one of its limitations. The second benchmark model was developed to mitigate the congestion of the most congested segment. It is not surprising that this benchmark model achieved the best performance in reducing the total traffic flow. Yet, this benchmark model failed to decrease the maximum traffic flow and improve the network’s functional connectivity. Taken together, the proposed on-ramp control model is characterized by the best overall performance. In practice, appropriate models could be selected according to the goal of transportation management.
The proposed percolation-bottleneck-based on-ramp control approach has not been applied in practice. To explore this approach’s practical feasibility, we simulated different traffic conditions by adjusting the mean and the standard deviation of the vehicle speeds. Next, we tested the proposed on-ramp control approach under different traffic condition scenarios. As shown in Table 2, the proposed on-ramp control approach is robust in reducing the maximum traffic flow, the total traffic flow, and the critical threshold under various traffic conditions, suggesting the potential of its future application in practice.

7. Conclusions

In this study, we identified the percolation bottleneck of the highway network by employing the network percolation approach. The major vehicle sources (MVSs) of the percolation bottleneck were pinpointed and used as the candidate-controlled stations. The percolation-bottleneck-based on-ramp control model was generated to avoid traffic overload at the percolation bottleneck. The on-ramp control model was solved using the PSO algorithm. Results indicated that the proposed on-ramp control approach could alleviate the traffic pressure at the percolation bottleneck and improve the functional connectivity of the highway network. The necessity for identifying the percolation bottleneck and pinpointing the MSVs was discussed. The practical feasibility of the proposed on-ramp control approach was tested under various traffic conditions.
Given that there were a limited number of MSVs, using MVSs as the controlled on-ramps could greatly reduce the model solution space, making the model applicable to large highway networks. In the future, the spatiotemporal characteristics of the percolation bottleneck could be further analyzed. In addition, more accurate highway trip data and real-time traffic speed data could be used for simulating the traffic flow and generating the on-ramp control model. Finally, machine learning and deep learning techniques can be incorporated into the current modeling framework to generate more intelligent and effective traffic control schemes.

Author Contributions

Conceptualization, P.W.; methodology, S.L., H.Y. and M.L.; data curation, S.L., M.L. and J.D.; writing—original draft preparation, S.L.; writing—review and editing, H.Y. and P.W.; visualization, S.L.; supervision, P.W. and J.D. All authors have read and agreed to the published version of the manuscript.

Funding

This research was supported by the Hunan Provincial Natural Science Fund for Distinguished Young Scholars [grant number 2022JJ10077] and the 2021 Science and Technology Progress and Innovation Plan of the Department of Transportation of Hunan Province [grant number 202102].

Institutional Review Board Statement

Not applicable.

Informed Consent Statement

Not applicable.

Data Availability Statement

The data are not publicly available due to the confidentiality agreement.

Acknowledgments

The authors sincerely thank Jianhe Xiao, Zijian Wu, and Tianhao Wang for their valuable discussions.

Conflicts of Interest

The authors declare no conflict of interest.

Appendix A

We calculated the volume over capacity ( V O C ) of each highway segment, which was defined in the following [70]:
V O C a = V a / C a
where V a and C a represent the traffic flow and the capacity of highway segment a . The traffic flow of a highway segment ( V a ) was calculated by assigning the travel demand to the highway network using the Dijkstra algorithm. The capacity of a highway segment ( C a ) was calculated according to the capacity per lane (which was estimated based on the designed speed [70]) and the number of lanes of the highway segment. We further calculated the average V O C of Hunan highway segments:
V O C a v e = a V O C a · l a a l a
where l a is the length of highway segment a . The calculated V O C a v e was about 0.05, which was much smaller than the V O C a v e officially reported by the Department of Transportation of Hunan Province (which was about 0.397). Therefore, we up-scaled the travel demand between each pair of on-ramps by eight times to simulate the actual traffic condition.

References

  1. Chang, Y.; Wang, S.; Zhou, Y.; Wang, L.; Wang, F. A novel method of evaluating highway traffic prosperity based on nighttime light remote sensing. Remote Sens. 2019, 12, 102. [Google Scholar] [CrossRef]
  2. Chen, J.; Yu, Y.; Guo, Q. Freeway traffic congestion reduction and environment regulation via model predictive control. Algorithms 2019, 12, 220. [Google Scholar] [CrossRef]
  3. Karaer, A.; Ulak, M.B.; Ozguven, E.E.; Sando, T. Reducing the non-recurrent freeway congestion with detour operations: Case study in Florida. Transp. Eng. 2020, 2, 100026. [Google Scholar] [CrossRef]
  4. Yu, M.; Fan, W.D. Optimal variable speed limit control in connected autonomous vehicle environment for relieving freeway congestion. J. Transp. Eng. Part A Syst. 2019, 145, 04019007. [Google Scholar] [CrossRef]
  5. Han, Y.; Wang, M.; Li, L.; Roncoli, C.; Gao, J.; Liu, P. A physics-informed reinforcement learning-based strategy for local and coordinated ramp metering. Transp. Res. Part C Emerg. Technol. 2022, 137, 103584. [Google Scholar] [CrossRef]
  6. Ma, M.; Liang, S. An optimization approach for freeway network coordinated traffic control and route guidance. PLoS ONE 2018, 13, 0204255. [Google Scholar] [CrossRef]
  7. Wang, C.; Zhang, J.; Xu, L.; Li, L.; Ran, B. A new solution for freeway congestion: Cooperative speed limit control using distributed reinforcement learning. IEEE Access 2019, 7, 41947–41957. [Google Scholar] [CrossRef]
  8. Wang, X.; Qiu, T.Z.; Niu, L.; Zhang, R.; Wang, L. A micro-simulation study on proactive coordinated ramp metering for relieving freeway congestion. Can. J. Civ. Eng. 2016, 43, 599–608. [Google Scholar] [CrossRef]
  9. Gould, C.; Rayman, N.; McCabe, K.; Schofield, M.; Hermans, F.; Munro, P.; Papageorgiou, M. Ramp metering development in a UK context. In Proceedings of the 12th IEE International Conference on Road Transport Information and Control (RTIC), London, UK, 20–22 April 2004; IET: London, UK, 2004; pp. 145–148. [Google Scholar]
  10. Owens, D.; Schonfield, M.J. Access Control on the M6 Motorway: Evaluation of Britain’s First Ramp Metering Scheme; Traffic Engineering & Control; Hemming Group, Limited: London, UK, 1988; Volume 29. [Google Scholar]
  11. Papageorgiou, M.; Hadj-Salem, H.; Middelham, F. ALINEA local ramp metering: Summary of field results. Transp. Res. Rec. 1997, 1603, 90–98. [Google Scholar] [CrossRef]
  12. Papageorgiou, M.; Haj-Salem, H. A low cost tool for freeway ramp metering. IFAC Proc. Vol. 1995, 28, 49–54. [Google Scholar] [CrossRef]
  13. Buijn, H.; Middelham, F. Ramp metering control in the netherlands. In Proceedings of the Third International Conference on Road Traffic Control, London, UK, 22–24 March 1990; IET: London, UK, 2002; pp. 199–203. [Google Scholar]
  14. Pera, R.L.; Nenzi, R. TANA—An operating surveillance system for highway traffic control. Proc. IEEE 1973, 61, 542–556. [Google Scholar] [CrossRef]
  15. Yoshino, T.; Sasaki, T.; Hasegawa, T. The traffic-control system on the hanshin expressway. Interfaces 1995, 25, 94–108. [Google Scholar] [CrossRef]
  16. Yukimoto, T.; Okushima, M.; Uno, N.; Daito, T. Evaluation of On Ramp Metering on Hanshin Expressway Using Traffic Simulator (HEROINE). In Proceedings of the 9th World Congress on Intelligent Transport Systems, Chicago, IL, USA, 14–17 October 2002. [Google Scholar]
  17. Paesani, G.F. System wide adaptive ramp metering in southern California. In Proceedings of the ITS America 7th Annual Meeting and Exposition: Merging the Transportation and Communications Revolutions, Washington, DC, USA, 2–5 June 1997; ITS America: Washington, DC, USA, 1997. [Google Scholar]
  18. Thompson, N.; Greene, S. Ramp Metering for the 21st Century: Minnesota’s Experience. In Proceedings of the ITS America 7th Annual Meeting and Exposition: Merging the Transportation and Communications Revolutions, Washington, DC, USA, 2–5 June 1997; ITS America: Washington DC, USA, 1997. [Google Scholar]
  19. Papamichail, I.; Papageorgiou, M.; Vong, V.; Gaffney, J. Heuristic Ramp-Metering Coordination Strategy Implemented at Monash Freeway, Australia. Transp. Res. Rec. 2010, 2178, 10–20. [Google Scholar] [CrossRef]
  20. Wei, J.; Long, K.; Gu, J.; Zhou, Z.; Li, S. Freeway ramp metering based on PSO-PID control. PLoS ONE 2021, 16, e0260977. [Google Scholar] [CrossRef] [PubMed]
  21. Abuamer, I.M.; Silgu, M.A.; Celikoglu, H.B. Micro-simulation based ramp metering on Istanbul freeways: An evaluation adopting ALINEA. In Proceedings of the 2016 IEEE 19th International Conference on Intelligent Transportation Systems (ITSC), Rio de Janeiro, Brazil, 1–4 November 2016; IEEE: London, UK, 2016; pp. 695–700. [Google Scholar]
  22. Smaragdis, E.; Papageorgiou, M.; Kosmatopoulos, E. A flow-maximizing adaptive local ramp metering strategy. Transp. Res. Part B Methodol. 2004, 38, 251–270. [Google Scholar] [CrossRef]
  23. Xu, J.; Zhao, X.; Srinivasan, D. On optimal freeway local ramp metering using fuzzy logic control with particle swarm optimisation. IET Intell. Transp. Syst. 2013, 7, 95–104. [Google Scholar] [CrossRef]
  24. Smaragdis, E.; Papageorgiou, M. Series of new local ramp metering strategies. Transp. Res. Rec. 2003, 1856, 74–86. [Google Scholar] [CrossRef]
  25. Papamichail, I.; Kotsialos, A.; Margonis, I.; Papageorgiou, M. Coordinated ramp metering for freeway networks—A model-predictive hierarchical control approach. Transp. Res. Part C Emerg. Technol. 2010, 18, 311–331. [Google Scholar] [CrossRef]
  26. Zhang, H.M.; Ritchie, S.G.; Jayakrishnan, R. Coordinated traffic-responsive ramp control via nonlinear state feedback. Transp. Res. Part C Emerg. Technol. 2001, 9, 337–352. [Google Scholar] [CrossRef]
  27. Greguric, M.; Ivanjko, E.; Mandzuka, S. A Neuro-fuzzy Based Approach to Cooperative Ramp Metering. In Proceedings of the 2015 IEEE 18th International Conference on Intelligent Transportation Systems, Gran Canaria, Spain, 15–18 September 2015; IEEE: London, UK, 2015; pp. 54–59. [Google Scholar]
  28. Peng, C.; Xu, C. A coordinated ramp metering framework based on heterogeneous causal inference. Comput. -Aided Civil Infrastruct. Eng. 2023, 38, 1365–1380. [Google Scholar] [CrossRef]
  29. Sun, X.; Munoz, L.; Horowitz, R. Highway traffic state estimation using improved mixture Kalman filters for effective ramp metering control. In Proceedings of the 42nd IEEE International Conference on Decision and Control (IEEE Cat. No.03CH37475), Maui, HI, USA, 9–12 December 2003; IEEE: London, UK, 2015; pp. 6333–6338. [Google Scholar]
  30. Benmohamed, L.; Meerkov, S.M. Feedback control of highway congestion by a fair on-ramp metering. In Proceedings of the 1994 33rd IEEE Conference on Decision and Control, Lake Buena Vista, FL, USA, 14–16 December 1994; IEEE: London, UK, 2015; pp. 2437–2442. [Google Scholar]
  31. Li, M.; Yang, H.; Guo, B.; Dai, J.; Wang, P. Driver source-based traffic control approach for mitigating congestion in freeway bottlenecks. J. Adv. Transp. 2022, 2022, 3536979. [Google Scholar] [CrossRef]
  32. Liu, H.X.; Danczyk, A. Optimal sensor locations for freeway bottleneck identification. Comput. -Aided Civil Infrastruct. Eng. 2009, 24, 535–550. [Google Scholar] [CrossRef]
  33. Asgharzadeh, M.; Gubbala, P.S.; Kondyli, A.; Schrock, S.D. Effect of on-ramp demand and flow distribution on capacity at merge bottleneck locations. Transp. Lett. 2020, 12, 550–558. [Google Scholar] [CrossRef]
  34. Margiotta, R.A.; Snyder, D. An Agency Guide on How to Establish Localized Congestion Mitigation Programs (No. FHWA-HOP-11-009); Federal Highway Administration, Office of Operations: Washington, DC, USA, 2011.
  35. Kondyli, A.; Hale, D.K.; Asgharzadeh, M.; Schroeder, B.; Jia, A.; Bared, J. Evaluating the operational effect of narrow lanes and shoulders for the highway capacity manual. Transp. Res. Rec. 2019, 2673, 558–570. [Google Scholar] [CrossRef]
  36. Zhang, L.; Levinson, D. Ramp metering and freeway bottleneck capacity. Transp. Res. Part A Policy Pract. 2010, 44, 218–235. [Google Scholar] [CrossRef]
  37. Kerner, B.S. Control of spatiotemporal congested traffic patterns at highway bottlenecks. IEEE Trans. Intell. Transp. Syst. 2007, 8, 308–320. [Google Scholar] [CrossRef]
  38. Ma, M.H.; Yang, Q.F.; Liangand, S.D.; Li, Z.L. Integrated Variable Speed Limits Control and Ramp Metering for Bottleneck Regions on Freeway. Math. Probl. Eng. 2015, 2015, 313089. [Google Scholar] [CrossRef]
  39. Bertini, R.L.; Myton, A. Using PeMS data to empirically diagnose freeway bottleneck locations in Orange County, California. Transp. Res. Rec. J. Transp. Res. Board 2005, 1925, 48–57. [Google Scholar] [CrossRef]
  40. Florida Department of Transportation. SIS Bottleneck Study (Technical Memorandum No. 2—Methodology to Identify Bottlenecks); Florida Department of Transportation: Tallahassee, FL, USA, 2011.
  41. Kerner, B.S. Theory of breakdown phenomenon at highway bottlenecks. Transp. Res. Rec. 2000, 1710, 136–144. [Google Scholar] [CrossRef]
  42. Ban, X.; Chu, L.; Benouar, H. Bottleneck identification and calibration for corridor management planning. Transp. Res. Rec. 2007, 1999, 40–53. [Google Scholar] [CrossRef]
  43. Margiotta, R.A.; Spiller, N.C.; Systematics, C. Recurring Traffic Bottlenecks: A primer: Focus on Low-Cost Operational Improvements (No. FHWA-HOP-09-037); Federal Highway Administration: Washington, DC, USA, 2009.
  44. Chen, C.; Skabardonis, A.; Varaiya, P. Systematic identification of freeway bottlenecks. Transp. Res. Rec. 2004, 1867, 46–52. [Google Scholar] [CrossRef]
  45. Zhang, L.; Levinson, D. Some properties of flows at freeway bottlenecks. Transp. Res. Rec. 2004, 1883, 122–131. [Google Scholar] [CrossRef]
  46. Gong, L.; Fan, W. Applying travel-time reliability measures in identifying and ranking recurrent freeway bottlenecks at the network level. J. Transp. Eng. Part A Syst. 2017, 143, 04017042. [Google Scholar] [CrossRef]
  47. Bertini, R.L.; Fernandez, R.; Wieczorek, J.; Li, H. Using archived ITS data to automatically identify freeway bottlenecks in Portland, Oregon. In Proceedings of the 15th World Congress on ITS, New York, NY, USA, 16–20 November 2008. [Google Scholar]
  48. Jose, R.; Mitra, S. Identifying and classifying highway bottlenecks based on spatial and temporal variation of speed. J. Transp. Eng. Part A Syst. 2018, 144, 04018075. [Google Scholar] [CrossRef]
  49. Cellai, D.; López, E.; Zhou, J.; Gleeson, J.P.; Bianconi, G. Percolation in multiplex networks with overlap. Phys. Rev. E 2013, 88, 052811. [Google Scholar] [CrossRef] [PubMed]
  50. Wu, R.; Guo, S.; Yang, B.; Li, D. Improvement of traffic percolation based on bottlenecks. In Proceedings of the 2017 2nd International Conference on System Reliability and Safety (ICSRS), Milan, Italy, 20–22 December 2017; IEEE: New York, NY, USA, 2018; pp. 41–46. [Google Scholar]
  51. He, Y.; Xu, Z.; Zhao, Y.; Tsui, K.L. Dynamic Evolution Analysis of Metro Network Connectivity and Bottleneck Identification: From the Perspective of Individual Cognition. IEEE Access 2019, 7, 2042–2052. [Google Scholar] [CrossRef]
  52. Li, D.; Fu, B.; Wang, Y.; Lu, G.; Berezin, Y.; Stanley, H.E.; Havlin, S. Percolation transition in dynamical traffic network with evolving critical bottlenecks. Proc. Natl. Acad. Sci. USA 2015, 112, 669–672. [Google Scholar] [CrossRef]
  53. Lv, S.; Yang, H.; Zhang, F.; Wang, P. Identifying the bottlenecks of urban metros and analyzing the passenger source. In Proceedings of the 22nd COTA International Conference of Transportation Professionals (CICTP), Changsha, China, 8–11 July 2022; ASCE: Reston, VA, USA, 2022; pp. 2625–2635. [Google Scholar]
  54. Li, M.; Liu, R.R.; Lü, L.; Hu, M.B.; Xu, S.; Zhang, Y.C. Percolation on complex networks: Theory and Application. Phys. Rep. -Rev. Sec. Phys. Lett. 2021, 907, 1–68. [Google Scholar]
  55. Yang, G.; Tian, Z.; Xu, H.; Wang, Z.; Wang, D. Impacts of traffic flow arrival pattern on the necessary queue storage space at metered on-ramps. Transp. A 2018, 14, 543–561. [Google Scholar] [CrossRef]
  56. Zhu, J.; Shi, Q. Research on vehicle speed distribution characteristics of urban expressway section and influence factors. J. Hefei Univ. Technol. 2018, 41, 95–101. [Google Scholar]
  57. Dijkstra, E.W. A note on two problems in connexion with graphs. In Edsger Wybe Dijkstra: His Life, Work, and Legacy, 1st ed.; Apt, K.R., Hoare, T., Eds.; ACM: New York, NY, USA, 2022; pp. 287–290. [Google Scholar]
  58. Yan, Y.; Wang, X.; Zhang, Y.H. Research on section operating speed distribution characteristics of expressway. China Saf. Sci. J. 2008, 18, 171–176. [Google Scholar]
  59. Wang, P.; Hunter, T.; Bayen, A.M.; Schechtner, K.; González, M.C. Understanding road usage patterns in urban areas. Sci. Rep. 2012, 2, 1001. [Google Scholar] [CrossRef]
  60. Wang, J.; Wei, D.; He, K.; Gong, K.; Wang, P. Encapsulating urban traffic rhythms into road networks. Sci. Rep. 2014, 4, 4141. [Google Scholar] [CrossRef]
  61. Wang, P.; Wang, C.; Lai, J.; Huang, Z.; Ma, J.; Mao, Y. Traffic control approach based on multi-source data fusion. IET Intell. Transp. Syst. 2019, 13, 764–772. [Google Scholar] [CrossRef]
  62. Liang, X.R.; Fan, Y.K.; Jiang, T. Application of PSO algorithm to coordinated ramp control. In Proceedings of the 2009 International Conference on Machine Learning and Cybernetics (ICMLC), Hebei, China, 12–15 July 2009; IEEE: London, UK, 2009; pp. 1712–1716. [Google Scholar]
  63. Fan, Y.; Liang, X. Particle swarm optimization based PI controller for freeway ramp metering. In Proceedings of the 2008 27th Chinese Control Conference (CCC), Kunming, China, 16–18 July 2008; IEEE: London, UK, 2008; pp. 503–506. [Google Scholar]
  64. Zhao, X.; Xu, J.; Srinivasan, D. Freeway ramp metering by macroscopic traffic scheduling with particle swarm optimization. In Proceedings of the 2013 IEEE Symposium on Computational Intelligence in Vehicles and Transportation Systems (CIVTS), Singapore, 16–19 April 2013; IEEE: London, UK, 2013; pp. 32–37. [Google Scholar]
  65. Wang, D.; Tan, D.; Liu, L. Particle swarm optimization algorithm: An overview. Soft Comput. 2018, 22, 387–408. [Google Scholar] [CrossRef]
  66. Houssein, E.H.; Gad, A.G.; Hussain, K.; Suganthan, P.N. Major advances in particle swarm optimization: Theory, analysis, and application. Swarm Evol. Comput. 2021, 63, 100868. [Google Scholar]
  67. Wu, X.; Zhong, M. Particle swarm optimization with hybrid velocity updating strategies. In Proceedings of the 2009 Third International Symposium on Intelligent Information Technology Application (IITA), Nanchang, China, 21–22 November 2009; IEEE: New York, NY, USA, 2009; pp. 336–339. [Google Scholar]
  68. Zhang, Q. Research on particle swarm optimization for grain logistics vehicle routing problem. In Proceedings of the 2009 IITA International Conference on Control, Automation and Systems Engineering (CASE), Zhangjiajie, China, 11–12 July 2009; IEEE: New York, NY, USA, 2009; pp. 212–215. [Google Scholar]
  69. Brandes, U. A faster algorithm for betweenness centrality. J. Math. Sociol. 2001, 25, 163–177. [Google Scholar] [CrossRef]
  70. JTG B01-2014; Technical Standard of Highway Engineering. Ministry of Transport of the People’s Republic of China: Beijing, China, 2014.
Figure 1. The highway network of Hunan Province.
Sustainability 15 12608 g001
Figure 2. Flowchart for generating the optimal traffic control scheme using the PSO algorithm.
Sustainability 15 12608 g002
Figure 3. The percolation process of Hunan highway network. (ac) The connectivity of the highway network when q was set to 1.3, 0.84, and 0.5. Different colors represent different clusters. (d) The size of FG and the size of SG in the network percolation process.
Sustainability 15 12608 g003
Figure 4. The major vehicle sources of the percolation bottleneck S .
Sustainability 15 12608 g004
Figure 5. The number of vehicles arriving at the percolation bottleneck during each 5-min time window from 6:00 a.m. to 08:00 p.m. on 13 May 2019.
Sustainability 15 12608 g005
Figure 6. (a) The convergence of the objective function value. The controlled time in each phase for (b) Yanglousi on-ramp, (c) Chengtoushan on-ramp, and (d) Changsha on-ramp. (e) The average controlled time in each phase. (f) The average controlled time at each on-ramp.
Sustainability 15 12608 g006
Figure 7. The number of vehicles arriving at the percolation bottleneck during each 5-min time window after implementing the traffic control scheme.
Sustainability 15 12608 g007
Figure 8. (a) The size of FG and the size of SG after controlling the traffic flow of the percolation bottleneck. (b) The size of FG and the size of SG after controlling the traffic flow of the most congested highway segment.
Sustainability 15 12608 g008
Table 1. The proposed on-ramp control model vs. the five benchmark models.
BottleneckHeavy Traffic PeriodUsing MVSMaximum Traffic FlowTotal Traffic Flow During Heavy Traffic PeriodCritical Threshold
Percolation bottleneck14:25–16:30yes−9.95%−1.56%−0.03
no−4.45%−1.32%−0.01
Congested bottleneck13:30–17:00yes0−2.20%0
no0−0.15%0
Betweenness bottleneck14:55–16:55yes−3.04%−1.56%0
no−3.56%−0.22%0
Table 2. Testing the proposed on-ramp control model under different traffic conditions.
Vehicle Speed (Mean, Standard Deviation) (km/h)Heavy Traffic PeriodMaximum Traffic FlowTotal Traffic Flow During Heavy Traffic PeriodCritical Threshold
(88.671, 13.744)14:25–16:30−9.95%−1.56%−0.03
(83.671, 13.744)14:35–17:35−7.37%−0.83%−0.02
(93.671, 13.744)14:25–15:55−6.49%−2.12%−0.01
(88.671, 8.744)14:25–17:25−7.67%−0.74%−0.02
(88.671, 18.744)14:30–16:15−5.38%−1.50%−0.02
Disclaimer/Publisher’s Note: The statements, opinions and data contained in all publications are solely those of the individual author(s) and contributor(s) and not of MDPI and/or the editor(s). MDPI and/or the editor(s) disclaim responsibility for any injury to people or property resulting from any ideas, methods, instructions or products referred to in the content.

