Article

Pressure Drop and Heat Transfer Characteristics of TiO2/R1234yf Nanorefrigerant: A Numerical Approach

Department of Thermal and Energy Engineering, School of Mechanical Engineering, Vellore Institute of Technology (VIT), Vellore 632014, India
*
Author to whom correspondence should be addressed.
Sustainability 2023, 15(16), 12605; https://doi.org/10.3390/su151612605
Submission received: 26 July 2023 / Revised: 15 August 2023 / Accepted: 18 August 2023 / Published: 20 August 2023

Abstract

:
Global warming is one of the most dangerous ecological issues facing the globe. Refrigerants are a major contributor to global warming. This investigation mainly focuses on the analysis of a greener nanorefrigerant. Nanorefrigerant can improve the efficiency of refrigeration and air conditioning systems that use vapor compression. In the present investigation, mathematical and computational methods are used to assess the heat transfer and pressure drop properties of TiO2/R1234yf. In order to analyze the heat transfer characteristics and the transport features of the innovative nanorefrigerant, appropriate mathematical predictive models were adapted from earlier investigations. The models are validated by the experiments using TiO2/POE nanolubricant as a test fluid. The investigation was conducted with a temperature range of 10 °C to 40 °C and a volume percentage of nano-sized TiO2 particles in R1234yf refrigerant ranging from 0.2 to 1%. According to the research, the introduction of nanoparticles increases viscosity, thermal conductivity, and density. However, as the amount of nanoparticles rises, the specific heat capacity of the nano-enhanced refrigerant decreases. The nanorefrigerant’s heat transfer coefficient and pressure drop are improved by 134.03% and 80.77%, respectively. The outcomes observed from the predictive technique and the simulation approach had an average absolute variation of 9.91%.

1. Introduction

One of the most significant ecological problems influencing our planet at the present time is global warming. The prior production of refrigerant gases and carbon dioxide emissions is one of the reasons for them [1,2]. These gases are released into the atmosphere, where they remain for a longer time and contribute to global warming [3]. The life cycle analysis (LCA) of these gases [4] and the conversion effectiveness of refrigeration systems [5] help to quantify how seriously these gases have an influence on the environment. Over the duration of the next 100 years, Earth’s temperature is predicted to increase by 2.5 to 10 °F as a result of global warming [6]. Due to the impact on agriculture, there will be more heat waves, strong precipitation patterns, and rainfalls, and by the end of the next century, the sea level may increase by 1–4 feet. Therefore, in order to safeguard the ozone layer and limit net planet warming by 0.5 °C by the year 2100, the member countries of the Montreal Protocol decided in October 2016 to phase down HFCs and HCFCs. Chlorofluorocarbons (CFCs) and hydrochlorofluorocarbons (HCFCs), which were already thinning the ozone layer [7], were eliminated following the Montreal and Kyoto Protocols, respectively [8]. Currently, HFCs, including R134a, R23, R404A, R407A, R410A, and R507A, make up the majority of the various refrigerants used in residential, automobile, commercial, and industrial refrigeration and air-conditioning systems [9,10]. HFCs have a high global warming potential (GWP) despite having no ozone depletion potential (ODP).
Refrigeration systems are a significant energy consumption industry for the majority of advanced and some emerging countries worldwide. As a result, researchers continue to hunt for effective ways to improve the energy efficiency of refrigeration systems. An inventive technique for cooling systems employs nanorefrigerants to increase efficiency. One type of emerging nanofluid utilized in refrigeration systems to enhance heat transfer efficiency and system performance is nanorefrigerants [11]. This improvement is made achievable by the nanoscale particles’ greater thermal conductivity. The performance of the system’s heat transmission is being improved [12], the solubility of the refrigerant and lubricant is being improved [13], and the friction coefficient and wear heat are being optimized [14]. The basic refrigerant’s ability to transmit heat more effectively may be increased by mixing in nanoscale particles, which boosts the system’s overall performance [15]. Two-phase heat transfer fluids are used as refrigerants. Refrigerant characteristics have an impact on the heat transfer capabilities and energy efficiency of the complete refrigeration system. The globally adopted refrigerant for different applications of refrigeration systems is R134a. It comes under the ‘A’ safety rating, and it has no flame propagation and low toxicity; meanwhile, it has about 1430 GWP [16]. Due to the high GWP of R134a, researchers are tried to replace it with low GWP refrigerants. HFOs are one of the suitable candidates for substituting the R134a with or without modifications in the refrigeration systems [8,17].
When Jankovic et al. [18] examined the operation of a small power refrigeration system, they found that the cooling efficiency and COP of R1234yf were 10% and 9% lesser than those of R134a, respectively. Similar findings were made by Sieres et al. [19], who discovered that R1234yf’s compressor power was 3% higher while cooling power was 6% lower than R134a. Chen et al. [20] and Li et al. [21] investigated R1234yf’s potential in a refrigeration system without oil. Both came to the conclusion that R1234yf had a lower volumetric efficiency and cooling capacity than R152a and R134a. According to Navarro-Esbr et al. [22], R1234yf had 9% and 5% less cooling power and volumetric efficiencies than R134a. Investigations by Sanchez et al. [23] also showed that R1234yf’s cooling impact was 4.4% to 8.5% less than R134a’s. Mota-Bobiloni et al. [24] reported comparable outcomes as well.
Nanorefrigerants perform refrigeration systems better than traditional refrigerants, according to recent studies. The R140a refrigerant’s efficiency was increased by 40% by the addition of Al2O3 nanoparticles [25]. The COP of the system containing Al2O3/R134a was determined by research by Ambhore et al. [26] to be 2.03. Similar findings were made by Subhedar et al. [27], who discovered that using Al2O3/R134a as a refrigerant increased COP by almost 85%. According to Payyala et al. [25], adding Al2O3 to R140a improved the COP, pressure ratio, and energy efficiency ratio. The coefficient of the performance was increased by 14.55%, and the friction coefficient was reduced by 9.9% when the CuO nanomaterial was combined with R134a [28]. CuO/R134a refrigerant’s heat transfer coefficient is enhanced by 42–82% at the concentration of 1% by volume, according to Bartelt et al. [29]. When CuO/R113a nano-enhanced refrigerant was examined by Katoch et al. [30] in the refrigeration system, they discovered that the energy consumption decreased by 19.82% at 0.5% nanoparticle addition. CuO/LPG-based systems improve efficiency and heat transfer rate by 36% and 46%, respectively [31]. According to Dhamneya et al. [32], the evaporatively cooled condenser with TiO2/R134a performed substantially better and had a 51% increase in COP. Rahman et al. [33] discovered that the compressor energy utilization was reduced by 34%; however, the COP was enhanced by 4.59%. The results show that the nano-enhanced refrigerants contribute to increasing the whole system performance and heat transfer effectiveness and that the COP rises as the concentration of nanoparticles does as well [34].
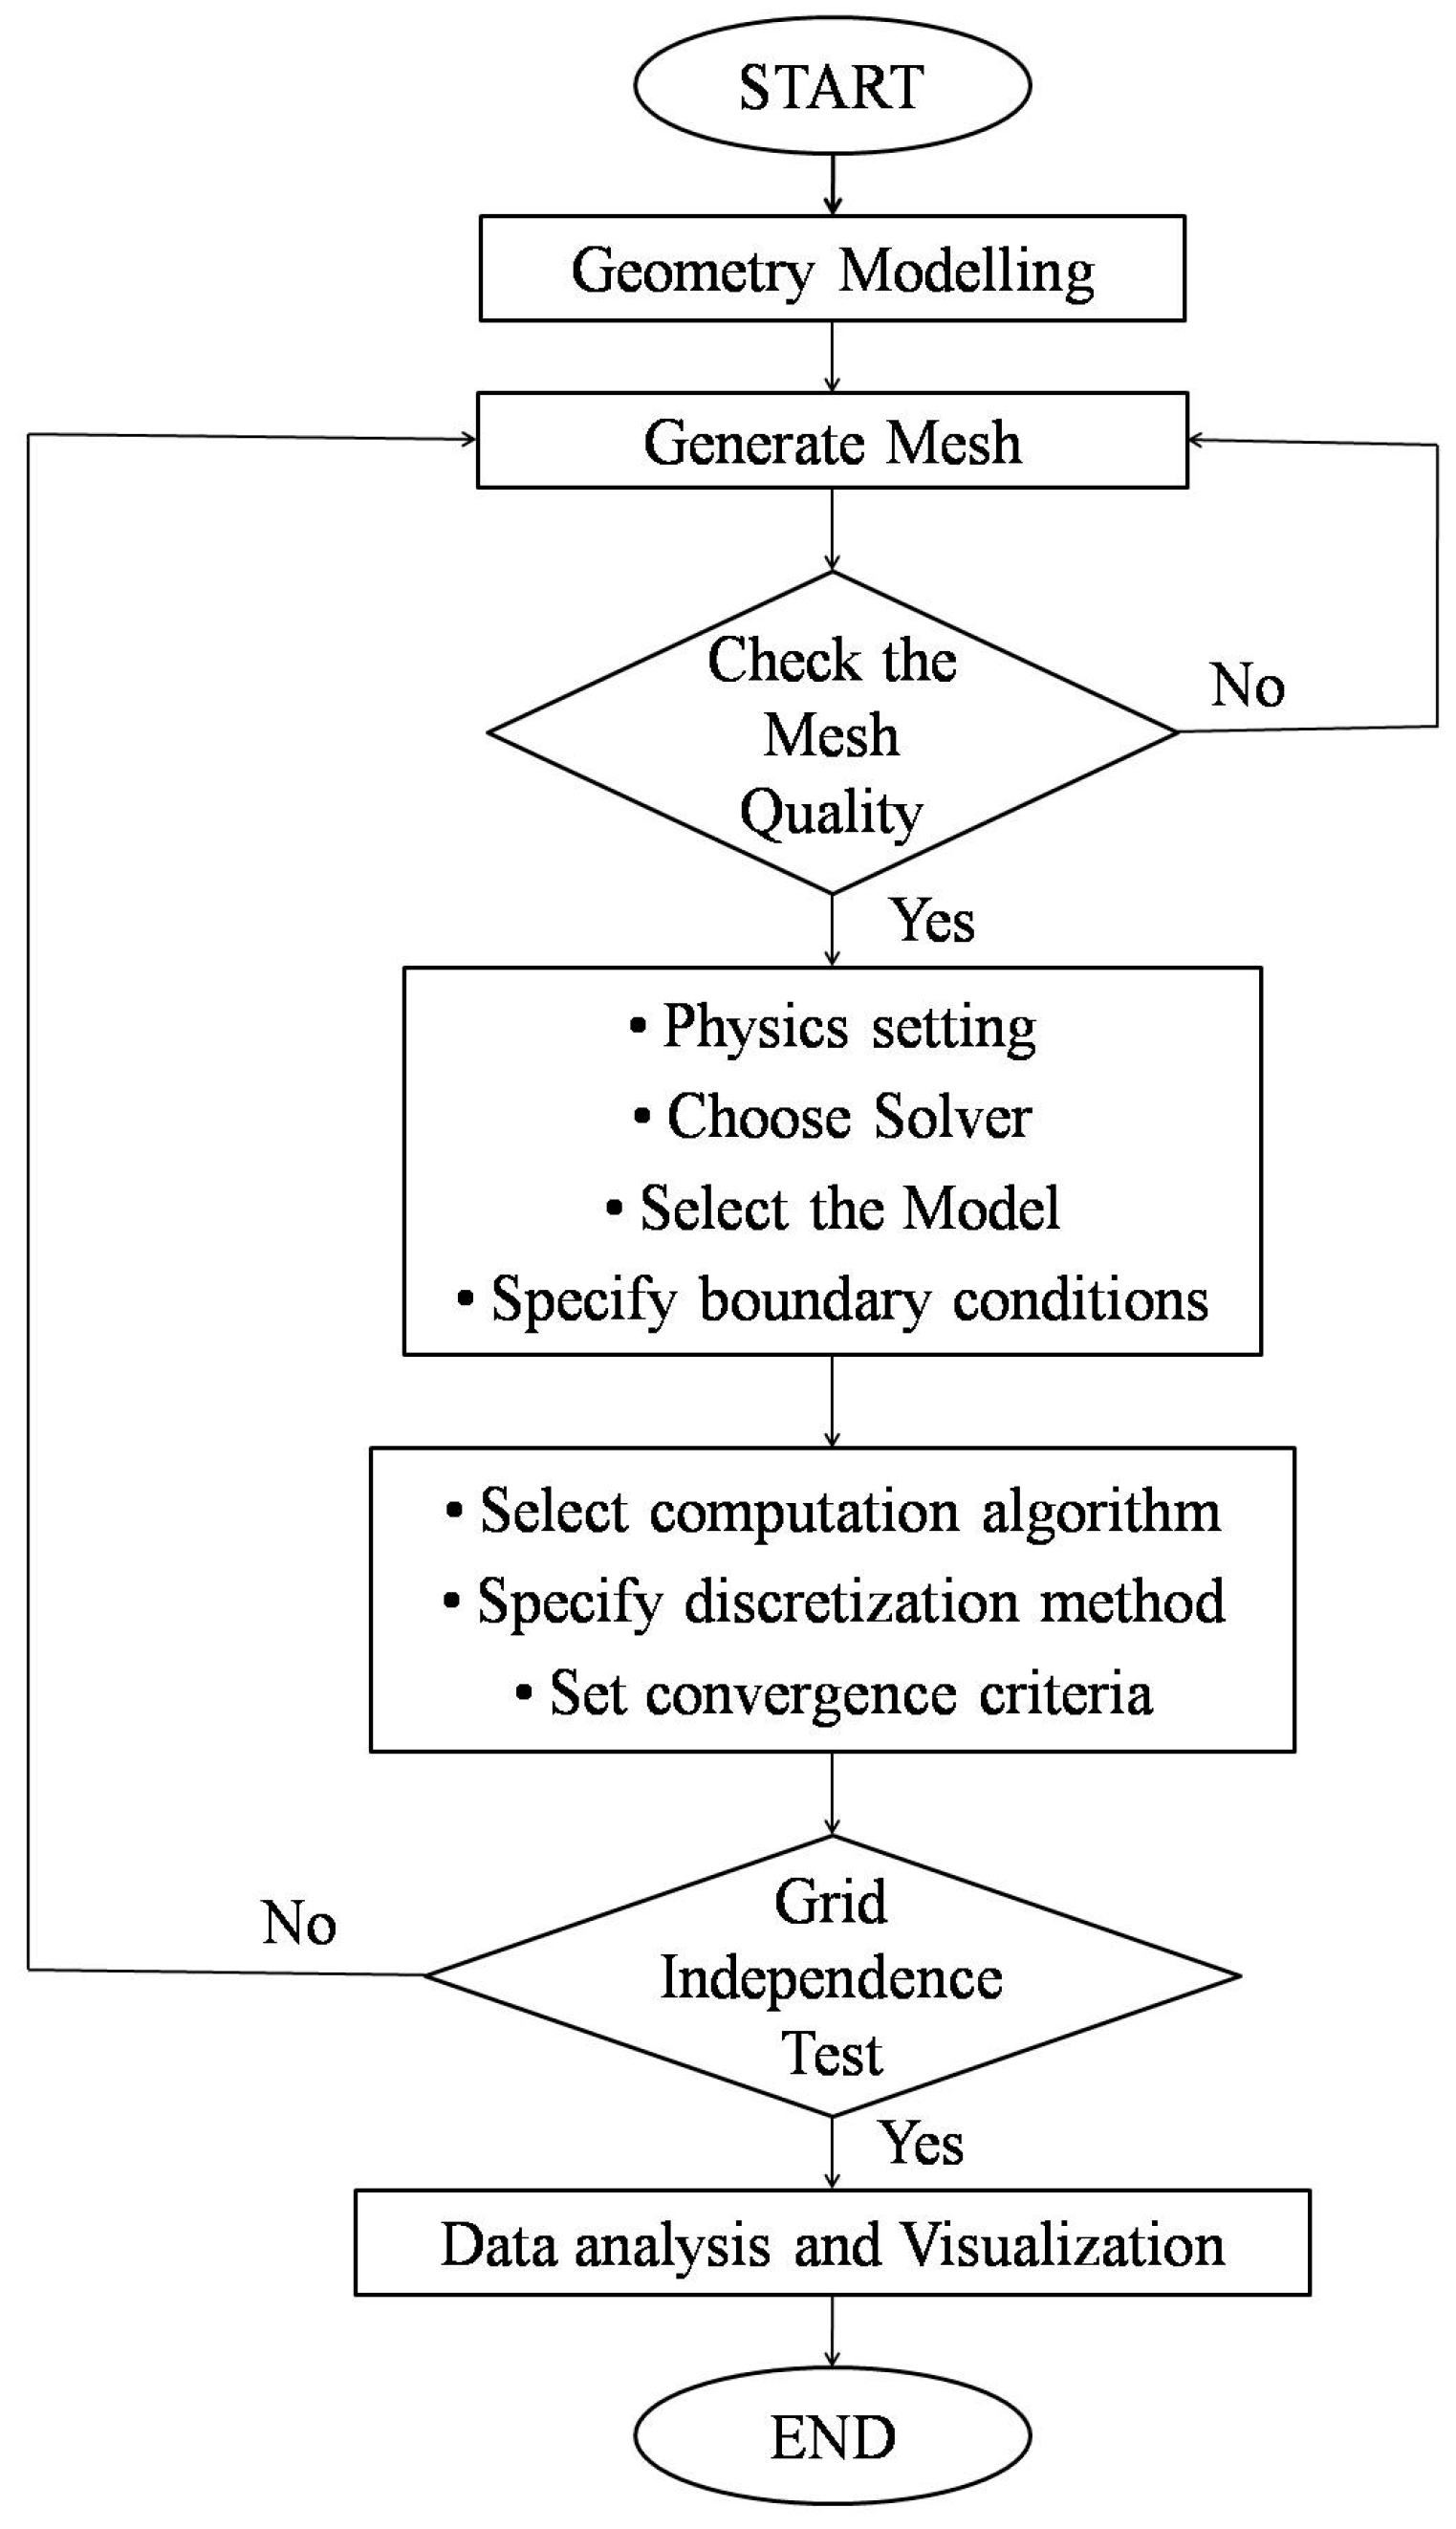
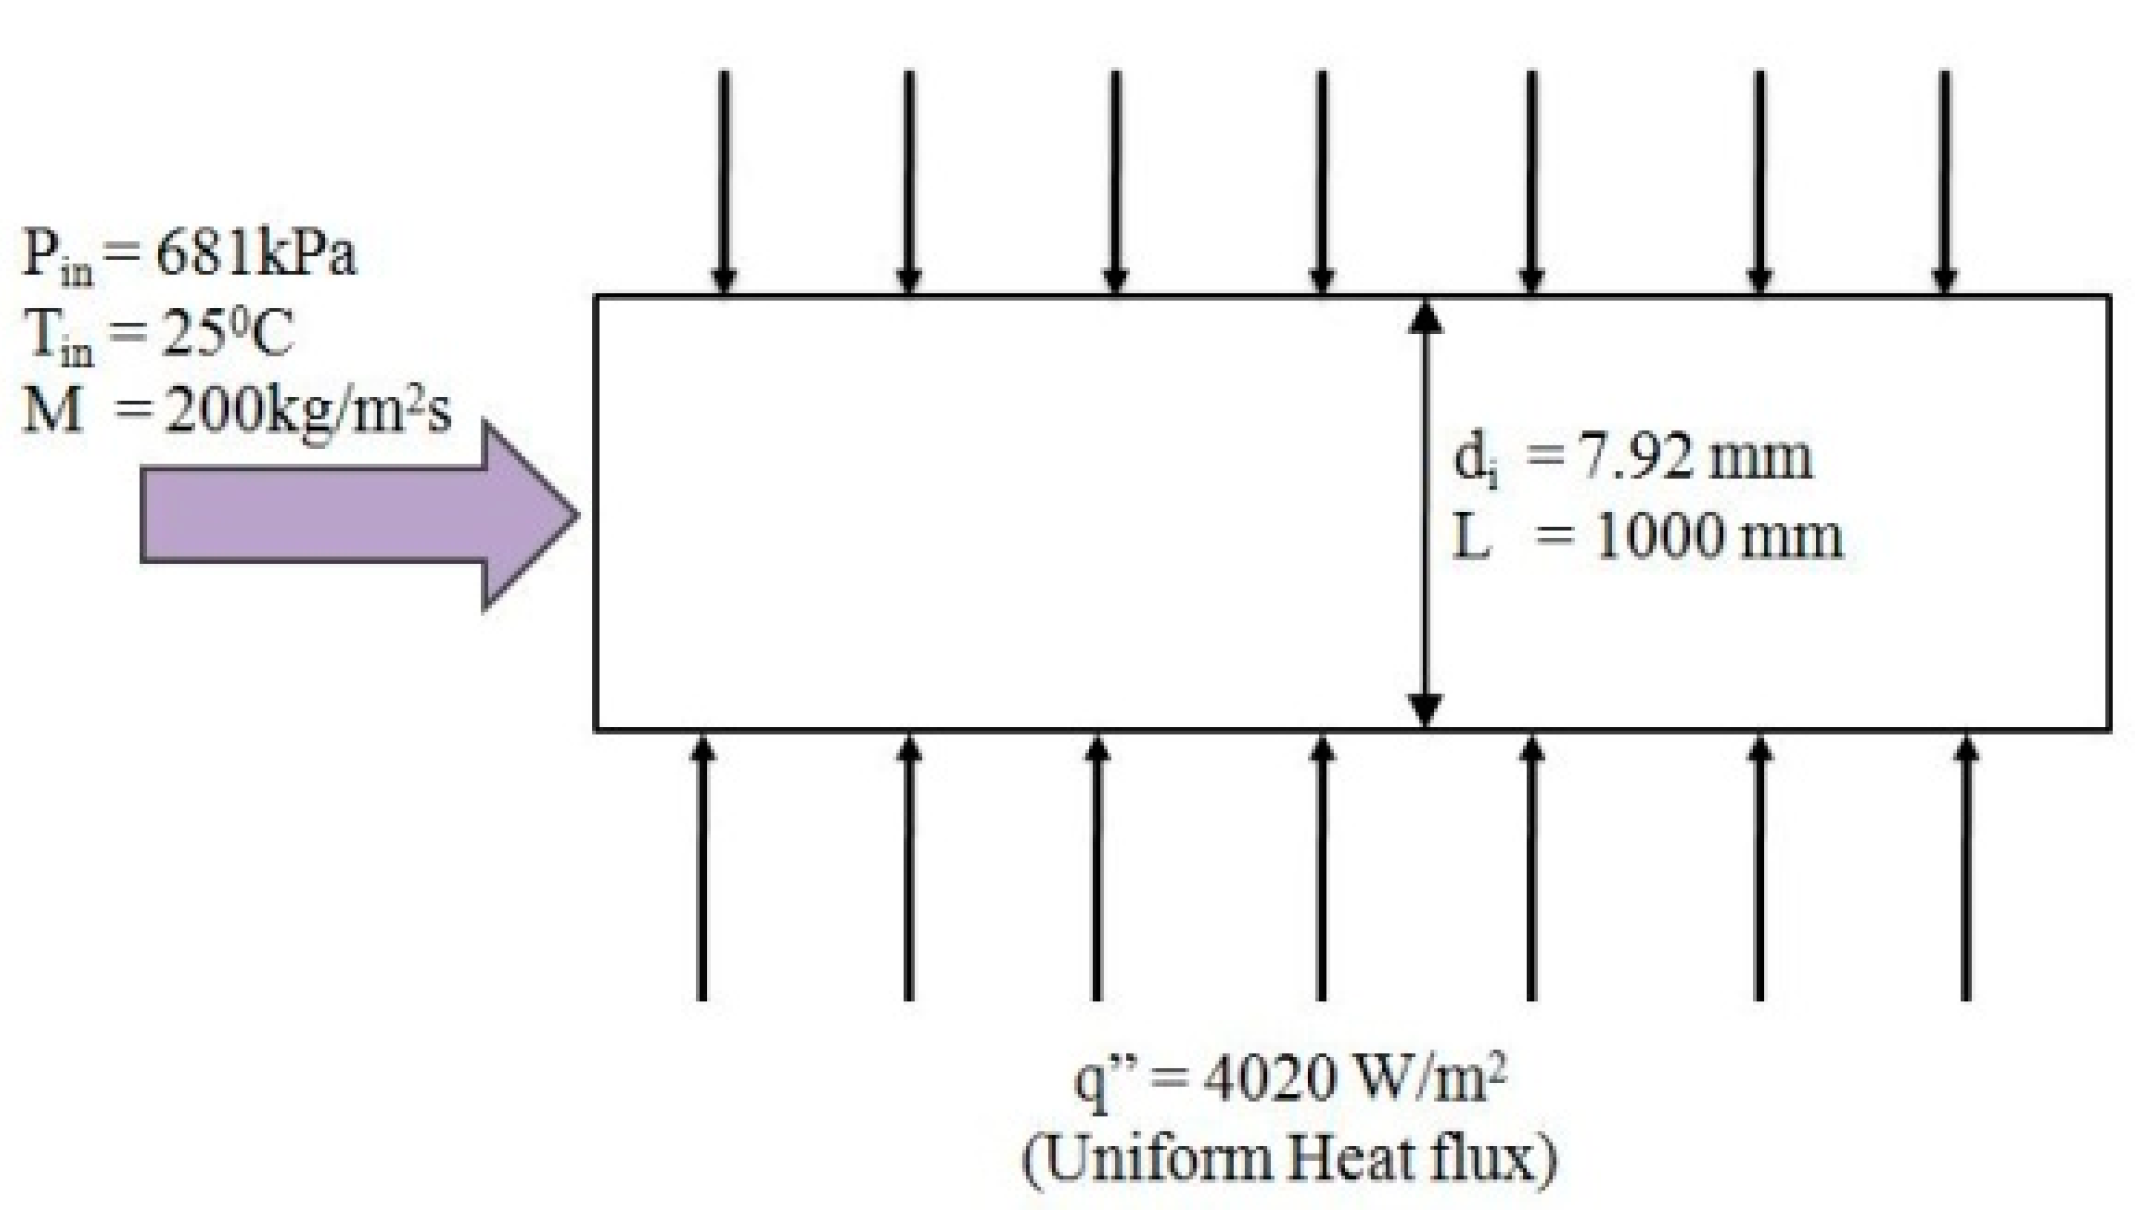
The key drawback of the R1234yf refrigerant is its lower performance than R134a. Therefore, the emphasis of this study is on increasing system efficiency using R1234yf by employing nanoparticles. Few investigations have been done on the heat transfer capabilities, pressure drop, and thermo-transport characteristics of R1234yf-based nano-enhanced refrigerants. Analysis of the pressure drop properties and HTC of the R1234yf-based nanorefrigerants requires more investigation. Through the use of simulation techniques and mathematical models, this study examines the heat transfer properties and pressure drop of the TiO2/R1234yf refrigerant. The findings of the simulation approach are compared with numerical results, and the predictive models are validated using various types of prior literature. This analysis leads to the sustainable development of the refrigeration system with greener refrigerants.

2. Methodology

2.1. Materials

The performance of the refrigeration systems depends on the heat transfer fluids used in it. In this analysis, TiO2 nano-sized particles and R1234yf refrigerant are used. The properties of TiO2 nanoparticles, POE lubricant oil and R1234yf refrigerant are tabulated in Table 1 and Table 2, respectively. The thermal properties of TiO2 added to the R1234yf nano-enhanced refrigerant have been determined by adopting the predictive models from the literature. To analyze the impact of nanoparticles on the properties of refrigerant, the concentration of TiO2 ranges between 0.2 and 1% by volume, and the mean diameter of the particles was 30 nm. Likewise, to study the effect of temperature on the properties, it changes from 10 °C to 40 °C.
The polyol ester (POE) is the lubricant oil used in commercial refrigeration systems. The fluid (TiO2/POE) utilized for the validation of the predictive models is prepared by a two-step technique. The lubricant oil and TiO2 nano-sized particles were purchased from Kenizol and Sigma Alrich, respectively. The scanning electron microscopy (SEM) image shows the size of the nanoparticle, which is shown in Figure 1. The SEM was carried out by a Quanta device with a magnification of ×120,000. It indicated that the average size of the nanoparticle is 30 nm and spherical in shape. The average size of the nanoparticle chosen below 30 nm was to avoid the sedimentation of the particle in the base fluid. Initially, the TiO2 nano-sized particles with different volume fractions (0.2 to 1%) were dispersed into the POE lubricant with the aid of the magnetic stirrer for 2 h. After that, the blend was sonicated using an ultra sonicator for 5 h. This helped to obtain a homogeneous nanoliquid.

2.2. Predictive Models

Predictive models were utilized to identify the thermo-physical properties of the TiO2/R1234yf nanorefrigerant, such as thermal conductivity, viscosity, specific heat and density, as well as predictions of the heat transfer coefficient and pressure drop of the evaporator tubes. The major assumptions considered for the predictive analysis were:
The nanoparticles are spherical in nature;
The nanorefrigerant is treated as homogeneous;
No surfactant is used;
Single-phase approach.

2.2.1. Thermal Conductivity

The temperature and concentration of the nanoparticles in the working fluid, the size of the particle and the interfacial layer thickness impact the thermal conductivity of the nano-enhanced refrigerant. Stiprasert et al. [36] developed a predictive model based on these factors. The thermal conductivity of TiO2/R1234yf nano-enhanced refrigerant was identified by:
k n r = k n p k l r φ k l r 2 β 1 3 β 3 + 1 + k n p + 2 k l r β 1 3 [ φ β 3 k l r k r + k r ] β 1 3 k n p + 2 k l r k n p k l r φ [ β 1 3 + β 3 1 ]

2.2.2. Viscosity

The viscosity induces the shear stress in the flow of the working fluids. It affects the flow of the fluid. Due to viscosity, a pressure drop in the flow took place. The Brinkman model [37] was adopted to determine the viscosity of the nano-enhanced refrigerant.
μ n r = μ r 1 ( 1 φ ) 2.5

2.2.3. Density

One of the important parameters influencing the refrigeration system is the density of the working fluid. It directly affects the pressure in the system. The density is analyzed by the Pak and Cho model [38].
ρ n r = 1 φ ρ r + φ ρ n p

2.2.4. Specific Heat

The specific heat of a refrigerant is the amount of energy needed to increase the unit temperature of a unit mass substance. The specific heat of the nanorefrigerant was calculated using [38]:
C p n r = 1 φ ( ρ C p ) r + φ ( ρ C p ) n p ( 1 φ ) ρ r + φ ρ n p

2.2.5. Flow Boiling Heat Transfer Coefficient

The HTC of the nanorefrigerant is predicted using the correlation of Peng et al. [39].
n r = r N I F h t
The nanoparticle impact factor, or NIF, is influenced by the particle concentration, the base refrigerant’s and nanomaterials’ transport characteristics, the mass flow, and the vapor quality. It is determined by:
N I F h t = exp φ 0.8 k n p k r 39.94 ρ C p n p ρ C p r , l 0.028 M 733.26 x 1 x

2.2.6. Pressure Drop

The frictional pressure drop is evaluated by the relation from Ding et al. [40]. It is expressed as:
P n r , f r i c = N I F p d P r , f r i c
The NIF can be identified by:
N I F p d = e x p φ × 2.19 × 10 7 × d n p d i + 37.26 × ρ n p ρ r , l 0.63 M 217.73 × x × ( 1 x )

2.2.7. Validation of Predictive Models

The predictive models for the thermo-physical properties are validated using the experiment results. For the validation, TiO2/POE nanolubricant is used as the test fluid. The thermal conductivity of the liquid is measured using KD2 thermal property analyzer, and the differential scanning calorimeter (DSC) is utilized for identifying the specific heat of the TiO2/POE.
Table 3 tabulates the deviation of the results from the prediction and experiment. From the table, it is seen that the variation between the predictive and experiment results is below 10%. Thereby, the results from the predictive models are reliable.

2.3. Simulation Method

The simulation study was carried out to identify the HTC and pressure drop of the TiO2 nanoparticles added to the R1234yf refrigerant in a smooth evaporator tube. The analysis was conducted using Ansys Fluent (version 2020.R2) software. It identified the temperature of the wall and refrigerant, distribution of flow velocity, pressure and the vapor quality of the refrigerant in the evaporator tube to determine the heat transfer characteristic as well as the pressure drop in the test section.
The flow of the simulation analysis is shown in Figure 2. The initial stage of the simulation is the modeling of the geometry. The geometry of the evaporator tube was modeled as per the dimensions given in Figure 3. Then, the meshes were generated and the mesh quality was checked. If the mesh quality was good, it proceeded to the specified boundary conditions. After that, we chose the computation algorithm (SIMPLE) and discretization method. Then, the independency of the grid was checked, and the flow was visualized.
The working fluid (nanorefrigerant) flowed through the test section at a constant mass flux (200 kg/m2s) and the vapor quality varied from 0.2 to 0.9. Figure 2 shows the dimensions and boundary conditions of the horizontal evaporator for analysis.
Due to the high accuracy, consistent results and less computational time, the standard k-ε model was utilized to solve the turbulent flow problem. Figure 4 shows the mesh structure of the test section on which the analysis was performed. Therein, 108,750 elements and 112,530 nodes make upthe whole test evaporator section.
To solve the two-phase mathematical model used to simulate the flow boiling in the evaporator tube, some hypotheses were taken into account. The flow field was consider as two-dimensional and turbulent. In addition, the heat flux was uniform along the length of the test section. The fluid was considered to be incompressible, and force vectors as negligible.

2.3.1. Grid Independency Analysis

In order to generate grids that perform the most effectively, it is necessary to take into account the grids’ shape, quality, and number. A component that affects the overall processing cost and the precision of the outcomes of simulation analysis is the number of grids. A considerable spatial discretization error is produced by coarse grids, which lowers the accuracy of the analysis’s findings [41]. Due to this, the selection of the optimum grid number is crucial. Based on the evaluation of various grid conditions, the grid independence analysis is a procedure used to identify the best grid condition that has the smallest grids without generating a difference in the numerical results. The grid independence analysis is done to select the size of the mesh. This helps to increase the processing speed and decreases the consumption of time by optimizing the grid size. Figure 4 shows the result of the grid independency analysis.
The outlet pressure of the evaporator tube remains steady after the number of elements is 108,600, which is depicted in Figure 5. From these, it is clear that after the specific limit, the simulation results are not dependent on the size of the grid. Hence, the number of elements selected for the study was 108,750.

2.3.2. Governing Equations

The simulation analysis utilized the two-phase flow model and standard k-ε model in AnsysFluent software. The two-phase flow model is governed by the following equations:
The nth phase continuity equation [42] is expressed as:
t φ n ρ n + . φ n ρ n V n = n = 1 i ( m ˙ o n )
The momentum equation [42] for the nth phase is:
t φ n ρ n V n + . φ n ρ n V n V n = φ n p + . τ ̿ n + φ n ρ n g + n = 1 i R o n + m ˙ o n V o n
The nth phase energy equation [42] is given as:
x φ n ρ n h n + . φ n ρ n h n u n = φ n p n x + τ ̿ n . u n . q n + S n + n = 1 i ( Q n o + m ˙ n o h n o )
The standard Kk–ε model is based on the transport equations for turbulence kinetic energy and dissipation rate. This model takes less time for computation and is more reliable and accurate. The K (turbulence kinetic energy) is from the transport equation [42] as per the following:
t ρ K + x i ρ K u i = x j μ + μ t σ k K x j + G k + G b ρ ε Y M + S k
The ‘ε’ (dissipation rate) is identified from the transport equation as below:
t ρ ε + x i ρ ε u i = x j μ + μ t σ ε ε x j + C 1 ϵ k ( G k + C 3 G b ) C 2 ρ ε 2 k + S ε

2.3.3. Software Tools Validation

The results obtained from the experiment analysis conducted by Sun and Yang [43] are used for the validation of software tools. They determined the HTC of the CuO nanoparticles added to the R141b refrigerant. The average size of the nanoparticles for this study was 30 nm. The vapor quality ranged from 0.3 to 0.8, and the nanoparticle mass fraction ranged between 0.1 and 0.3% of the weight. They utilized a copper tube of 1 mm thickness, 10 mm inner diameter and 1400 mm length. Table 4 shows the variation of flow boiling heat transfer coefficient obtained by simulation and experiment analysis. The maximum deviation is observed at around 7%, which indicates the reliability of the present analysis.

2.4. Average Absolute Deviation Estimation

The average deviation of results indicates the level of prediction. It is the deviation of the results obtained from the simulation to the prediction analysis. The level of prediction is tabulated in Table 5. The AAD (average absolute deviation) is expressed by [44]:
A A D = 1 n i = 0 n X n u m X s i m X n u m × 100 %

3. Result and Discussions

3.1. Thermo-Physical Properties of TiO2/R1234yf Refrigerant

The performance of the refrigeration system influences the thermo-physical characteristics of the working fluid, such as thermal conductivity, density, specific heat, and viscosity.
The thermal conductivity of the nanorefrigerant is one of the key thermo-physical characteristics to enhance the thermal performance of the system. The heat transfer rate of the system greatly affects the thermal conductivity of the nanoparticles doped in the refrigerant [45]. Figure 6 indicates the impact of temperature and nanoparticle volume concentration on the thermal conductivity of R1234yf-based nanorefrigerant. The figure shows that the thermal conductivity of the TiO2 nanoparticle dispersed refrigerant rises with the concentration and reduces with the temperature. When 0.2% to 1% of the nanoparticles were added to the refrigerant, the thermal conductivity changed from 0.0717 to 0.0735 W/m2K at a temperature of 10 °C. However, when the temperature varied from 10 °C to 40 °C, it changed from 0.0735 to 0.0656 W/m2K at the 1% volume concentration. There is an 11.88% of augmentation in thermal conductivity obtained at the 1% volume fraction and 40 °C temperature, and when 0.2% of the nanoparticles was added to the R1234yf, a 0.6% enhancement was obtained at 10 °C.
The thermal conductivity of the nanorefrigerant was enhanced with the doping of TiO2 nanoparticles. This is due to the Brownian motion effect of the nanometer-sized materials in the base working fluid. Photons are used to transmit heat by propagating lattice vibrations in crystalline nanoparticles immersed in the base fluid. This kind of phonon oscillates erratically. Some ballistic phonon events might lead to advances in thermal conductivity. If the ballistic phonons that originated in the particle travel through the fluid and reach neighboring particles, a significant increase in thermal conductivity occurs [46]. Due to Brownian motion, heat can travel between particles more efficiently the closer they are to one another. Meanwhile, the thermal conductivity declines with the temperature. When the temperature is raised, the mean free path between the molecules also increases. This reduces the collision between them [47]. While the separation between the nanoparticle grows, the Coulomb interaction (i.e., near-field radiation) degrades. This reduces the thermal conductivity [48].
Viscosity is another vital property that influences the pressure drop of the refrigeration system [49]. Figure 7 depicts the variation in the viscosity of TiO2/R1234yf refrigerant with the temperature and the concentration of the nanoparticles in it. It is seen that the viscosity is increased with the addition of nanoparticles, and it decreases with the temperature. At the 0.2% concentration, the viscosity varied from 194.97 to 134.67 μPas when the temperature ranged between 10 °C and 40 °C. Meanwhile, it changed from 194.97 to 198.94 μPas with the 0.2% TiO2 nanoparticles inclusion in the R1234yf base refrigerant at 10 °C. The highest increment in the viscosity is obtained at 1% at 2.54%, and the lowest at 0.5% of concentration at 0.5%. The high surface-to-volume area ratio of nanoparticles can be attributed as the main cause of the increase in viscosity with nanoparticles. Because nanoparticles have a larger surface area, there is more friction, which raises viscosity. On the other hand, it decreases when the temperature rises since it is hypothesized that the entropy increases; thereby, the thermal energy increases. High viscosity is not preferred for refrigeration systems, as is well known. It should be remembered that at higher temperatures, the enhanced viscosity with the nanoparticles will diminish and become closer to that of the base fluid. Therefore, for such systems, the slight increase in viscosity caused by the addition of nanoparticles may be disregarded [50].
Density influences the heat transfer properties of the refrigeration system. In addition, it affects the pressure drop of the system [50,51]. Figure 8 indicates the deviation in the density of nano-enhanced refrigerant with various temperatures and concentrations of nanoparticles. It was observed that the density improved with the nanoparticle dispersion, and it declined with the temperature. At 10 °C temperature, the density of TiO2/R1234yf refrigerant changed from 1150.2 to 1174.86 kg/m3 when the concentration of nanoparticles ranged from 0.2 to 1% by volume. However, when the temperature varied from 10 °C to 40 °C, it changed from 1150.2 to 1043.4 kg/m3 at the 0.2% volume concentration. The maximum enhancement in the density is 3.08%, which is obtained at 1% nanoparticle addition and 40 °C temperature. The minimum enhancement is 0.54% at a volume concentration of 0.2% and temperature of 10 °C. The density of the nanorefrigerant is increased by the addition of nanoparticles to the base fluids. The increment in density for the resulting nanorefrigerant will become increasingly apparent as the doping fraction of the nanoparticles rises. It is caused by significant variations in the density between materials in the solid and liquid phases. As the temperature rises, the volume of the fluid increases. Hence, the density of the nanorefrigerant decreases with the temperature rise [50,51].
One of the essential characteristics of the fluid is specific heat, which affects the rate of heat transfer and the output temperature and so indirectly improves system performance. Figure 9 shows the effect of temperature and concentration on the specific heat of TiO2/R1234yf. From the figure, it is indicated that the specific heat capacity reduces with the rise in the concentration of nanoparticles in the refrigerant, and it improves with temperature increments. When the temperature ranged from 10 °C to 40 °C, the specific heat capacity varied from 1288.58 to 1430.95 J/kgK at the 0.2% concentration of TiO2 nanoparticles in the R1234yf refrigerant. Meanwhile, at 10 °C, it changed from 1288.58 to 1271.36 J/kgK when the concentration ranged between 0.2 and 1%. The highest reduction in specific heat capacity was obtained at a 1% volume concentration of TiO2nanoparticles and a 40 °C temperature as 2.05%. The least reduction was at 0.34% at a temperature of 10 °C and the concentration of 0.2% by volume.
Generally, the specific heat of nanorefrigerant is reduced with increasing the concentration of nanoparticles. This is because the specific heat of nano-oxide materials is less, especially for TiO2 [52,53]. However, the specific heat of nano-enhanced refrigerants improved with temperature. As the temperature rises, the liquid molecules are forced to fluctuate in their equilibrium value to a greater degree, resulting in a rise in the specific heat [54]. The results indicated that the nano-enhanced refrigerants required less amount of heat to raise the temperature than the base refrigerant R1234yf.

3.2. Flow Patterns

The contours of velocity and pressure obtained by the simulation analysis are depicted in Figure 10 and Figure 11, respectively. The flow pattern along the axial length of the test section is visualized at the heat flux of 4020 W/m2, 1 vol.% of TiO2 nanoparticles concentration and 200 kg/m2s mass flux.
The velocity varied between 0 and 0.389 m/s. The maximum velocity was observed at the center, and the minimum velocity was at the walls of the test section. At the wall, the velocity is zero due to the no-slip condition. It was also observed that the velocity varied in the axial as well as the radial directions.
The pressure variation, along with the evaporation section, is depicted in Figure 11. It indicates the pressure decreased from 681 to 670 kPa.

3.3. Pressure Drop and Heat Transfer of TiO2/R1234yf Refrigerant

The variation of flow boiling heat transfer coefficient with vapor quality on different concentrations of nanoparticles in the refrigerant is illustrated in Figure 12. From the figure, it is seen that the HTC enhanced with the vapor quality and concentration of nanoparticles in the refrigerant. When the vapor quality change from 0.2 to 0.9, the HTC increases between 3024.56 and 7370.49 W/m2K at 0.2% of volume concentration. Likewise, with the 1% TiO2 nanoparticles, the addition of the R1234yf refrigerant enhances the heat transfer coefficient from 6292.61 to 15,175.88 W/m2K. When 0.2% of the nanoparticles dispersed in the refrigerant improved the coefficient by 13.35% on average, it also enhanced by 134.03% on average by mixing 1% of the TiO2 nanoparticles into the R1234yf refrigerant. The outcomes of the study indicate that the concentration of metal particles at the nanoscale affects how well the nanorefrigerant transfers heat up. The boundary layer’s height is reduced, and the flow boiling HTC of the nanorefrigerant increased as a result of the molecular adsorption layer that forms on the surface of nanoparticles and their breakup [40].
Table 6 summarizes the deviation between the predictive and simulation result of flow boiling HTC for various vapor qualities at 0.2 and 1% of volume concentrations. From the simulation, the heat transfer coefficient was enhanced from 2443.86 to 6592.06 W/m2K and between 5699.2 and 13678.08 W/m2K at 0.2 and 1% addition of TiO2 nanoparticle on R1234yf refrigerant, respectively. The absolute average deviation is observed as 9.91%.
Figure 13 indicates the difference in pressure drop of TiO2/R1234yf nanorefrigerant with vapor quality for various nanoparticle concentrations. It is observed that the pressure drop rises with vapor quality and nanoparticles addition to the refrigerant. When a 0.2% volume fraction of the nanoparticles was added to the refrigerant, the pressure drop varied between 2.11 and 8.04 kPa at 0.2 and 0.9 vapor qualities, respectively. Likewise, the variation in the vapor qualities changes the pressure drop from 3.58 to 15.43 kPa at 1% of volume concentration. It was enhanced by 12.45% at 0.2% and by 80.77% at 1% by volume of TiO2 concentration on average. Despite the fact that the mass flow rate of the heat transfer fluid was kept constant for the purposes of this investigation, the dispersion of nano-sized particles to the pure refrigerant improves the pressure decrease. When the nanoparticle concentration increases, there may be more particle-to-wall collisions, which results in a greater pressure drop for the nanorefrigerant than for the base refrigerant. The high-pressure drop of the nanorefrigerant has an effect on a refrigeration system’s capacity to pump. As the nanoparticles loading rises, frictional pressure loss also rises, necessitating a significant amount of pumping energy to circulate the nanorefrigerant throughout the system.
The variation between the simulation and predictive results of pressure drop is tabulated in Table 7. From the simulation, the pressure drop changes between 1.81 to 6.71 kPa, when the vapor quality ranges from 0.2 to 0.9 at 0.2% of nanoparticles concentration. In addition, it varies from 3.23 to 13.84 kPa at a 1% volume concentration of TiO2 nanoparticles on the R1234yf refrigerant. The AAD was obtained as 10.04%.

4. Conclusions

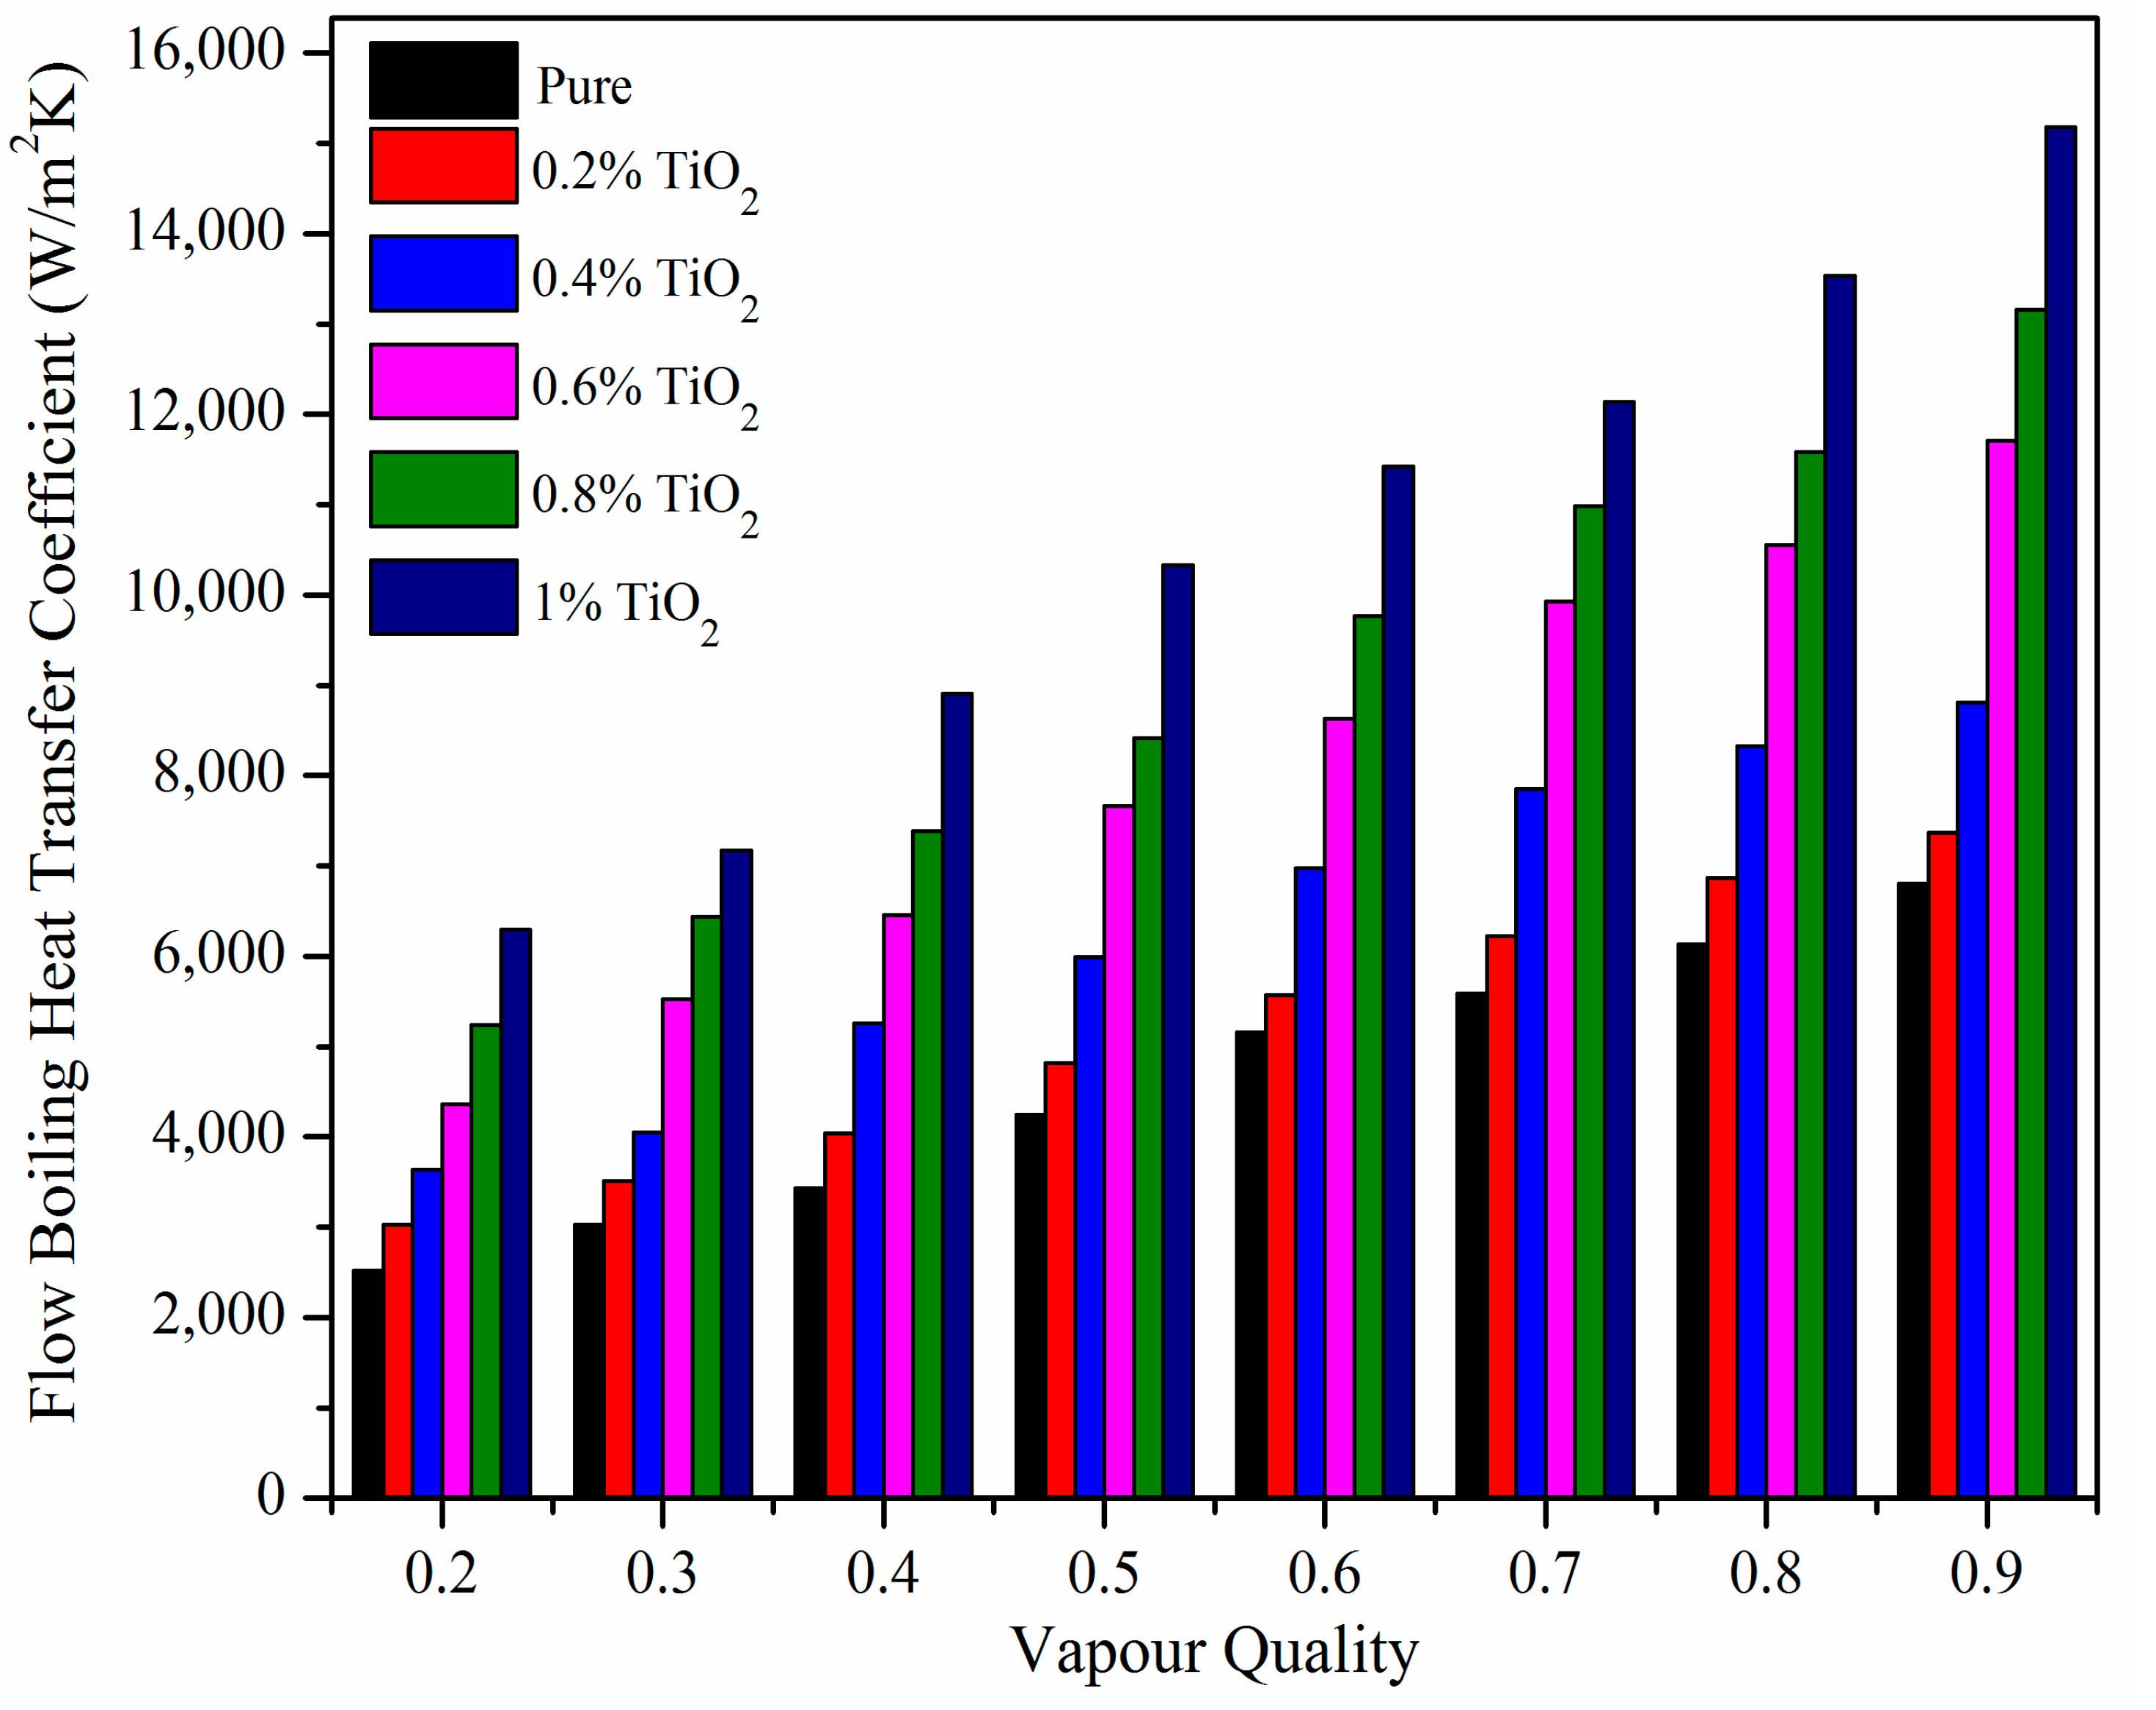
The HTC, pressure drop and the thermal characteristics of TiO2-doped R1234yf refrigerants with various concentrations (0.2% to 0.1% by volume) have been studied. The temperature of the working fluid varied between 10 °C and 40 °C to identify the influence of the temperature on the properties. From the property analysis, the thermal conductivity, viscosity and density were enhanced by 7.49%, 2.54% and 2.87%, respectively, at the temperature of 25 °C and volume concentration of 1%. However, in the same conditions, the specific heat showed a 1.84% reduction.
A mathematical model and simulation approach were used to assess the nanorefrigerant’s pressure drops and heat transfer characteristics. The investigation shows that the volume fraction of nanoparticles in the TiO2/R1234yf nano-enhanced refrigerant increases its HTC. At a 1% volume fraction of TiO2 in R1234yf, the coefficient of heat transfer was enhanced by 134.03%. However, the presence of nanoparticles also resulted in an increase in the pressure drop. With a volume fraction of 1%, it is shown that there is an improvement of 80.77%. In the system, the improvement in heat transfer was more significant than the reduction in pressure. Therefore, adding nanoparticles to the refrigerant solution might improve the performance of the refrigeration system. The outcomes from the simulation technique and mathematical method differed by an average of 9.91%.
Numerical and simulation techniques were used in this study. The identification of nanorefrigerant performance and energy efficiency in actual cooling systems requires experimental verification, which is outside the focus of this work. Only lower concentrations and smaller sizes of nanoparticles are covered in the current research. Future analyses could expand to include higher concentrations, different nanoparticle shapes, and varied nanoparticle sizes added to the refrigerant. According to recent research, the TiO2/R1234yf nano-enhanced refrigerant has the potential to improve the performance of the system. It could be used to aid in human comfort as well as residential refrigeration systems and vehicular air conditioning systems. However, the performance of nano-enhanced refrigerants and their energy efficiencymust be experimentally demonstrated and must be compatible with real-time refrigeration systems. In conclusion, nano-enhanced refrigerants will soon be a key component of environmentally responsible and energy-efficient refrigeration systems.

Author Contributions

Conceptualization, B.S.B. and E.G.; methodology, B.S.B. and E.G.; software, B.S.B.; validation, B.S.B.; formal analysis, B.S.B. and E.G.; investigation, B.S.B.; writing—original draft preparation, B.S.B.; writing—review and editing, E.G.; visualization, B.S.B. and E.G.; supervision, E.G. All authors have read and agreed to the published version of the manuscript.

Funding

This research received no external funding.

Institutional Review Board Statement

Not applicable.

Informed Consent Statement

Not applicable.

Data Availability Statement

Data may be shared uponreasonable request.

Acknowledgments

The authors are thankful to the management of the Vellore Institute of Technology, India.

Conflicts of Interest

The authors declare no conflict of interest.

Nomenclature

Abbreviations
AADAverage Absolute deviation
COPCoefficient of Performance
HFOHydro-fluoro-olefin
HTCHeat transfer coefficient
NIFNanoparticle Impact Factor
TiO2Titanium dioxide
Notations
α Heat Transfer Co-efficient (W/mK)
ρDensity (kg/m2)
εDissipation Rate
φVolume Concentration (%)
σTurbulent Prandtl Number
μDynamic Viscosity (mPa.s)
CpSpecific Heat (J/kgK)
dDiameter
gAcceleration due to gravity (m/s2)
hSpecific enthalpy (kJ/kg)
kThermal Conductivity (W/m2K)
qHeat flux (w/m2)
uVelocity (m/s2)
xVapor fraction
KTurbulence Kinetic Energy
MMass flux (kg/m2s)
QHeat transfer rate (W)
RInteraction force between phases
SSource term
TTemperature (°C)
VOverall Velocity Vector (m/s)
∆PaPressure drop (Pa/m)
Subscripts
fricFrictional
lrInterfacial layer
npNanoparticle
nrNanorefrigerant
rRefrigerant

References

  1. Usman, M.; Hayat, N. Lubrication, emissions, and performance analyses of LPG and petrol in a motorbike engine: A comparative study. J. Chin. Inst. Eng. 2019, 43, 47–57. [Google Scholar] [CrossRef]
  2. Kashif, M.; Awan, M.; Nawaz, S.; Amjad, M.; Talib, B.; Farooq, M.; Nizami, A.; Rehan, M. Untapped renewable energy potential of crop residues in Pakistan: Challenges and future directions. J. Environ. Manag. 2020, 256, 109924. [Google Scholar] [CrossRef] [PubMed]
  3. Khan, N.; Kalair, A.R.; Khan, N.; Haider, A.; Saleem, Z.; Saleem, M. Natural and synthetic refrigerants, global warming: A review. Renew. Sustain. Energy Rev. 2018, 90, 557–569. [Google Scholar] [CrossRef]
  4. Kharal, H.S.; Kamran, M.; Ullah, R.; Saleem, M.; Alvi, M. Environment-Friendly and Efficient Gaseous Insulator as a Potential Alternative to SF6. Processes 2019, 7, 740. [Google Scholar] [CrossRef]
  5. Zhang, D.; Gao, Z. Improvement of Refrigeration Efficiency by Combining Reinforcement Learning with a Coarse Model. Processes 2019, 7, 967. [Google Scholar] [CrossRef]
  6. Usman, M.; Hayat, N. Use of CNG and Hi-octane gasoline in SI engine: A comparative study of performance, emission, and lubrication oil deterioration. Energy Sources Part A Recovery Util. Environ. Eff. 2019, 1–15. [Google Scholar] [CrossRef]
  7. Steffen, J.; Bernath, P.F.; Boone, C.D. Trends in halogen-containing molecules measured by the Atmospheric Chemistry Experiment (ACE) satellite. J. Quant. Spectrosc. Radiat. Transf. 2019, 238, 106619. [Google Scholar] [CrossRef]
  8. Bibin, B.S.; Gundabattini, E. Properties and Performance of Eco-Friendly Hydro-Fluoro-Olefin (HFO) Refrigerant-R1234yf: Part I. Int. J. Air-Cond. Refrig. 2021, 29, 2130005. [Google Scholar] [CrossRef]
  9. Nielsen, S.K.; Christensen, S.; Thorsen, R.; Elmegaard, B. Comparison of heat pump design and performance for modern refrigerants. In Proceedings of the 13th IIR Gustav Lorentzen Conference on Natural Refrigerants Natural Refrigerant Solutions for Warm Climate Countries, Proceedings 2018, Valencia, Spain, 18–20 June 2018; pp. 307–314. [Google Scholar] [CrossRef]
  10. Farooq, M.; Hamayoun, A.A.; Khan, N.; Nawaz, S.; Usman, M.; Naqvi, S.R.; Imran, M.; Nadeem, R.; Razi, A.; Turan, A.; et al. Thermodynamic Performance Analysis of Hydrofluoroolefins (HFO) Refrigerants in Commercial Air-Conditioning Systems for Sustainable Environment. Processes 2020, 8, 187. [Google Scholar] [CrossRef]
  11. Alawi, O.A.; Sidik, N.A.C.; Mohammed, H. A comprehensive review of fundamentals, preparation, and applications of nano-refrigerants. Int. Commun. Heat Mass Transf. 2014, 54, 81–95. [Google Scholar] [CrossRef]
  12. Wang, R.; Hao, B.; Xie, G.Z.; Li, H. A Refrigerating System Using Hfc134a and Mineral Lubricant Appended with N-TiO2 (R) as Working Fluids. In Proceedings of the International Symposium on Heating Ventilating and Air Conditioning, 4th: International Symposium, Heating, Ventilating, and Air Conditioning, ISHVAC 2003, Beijing, China, 9–11 October 2003. [Google Scholar]
  13. Jiang, W.; Ding, G.; Peng, H. Measurement and model on thermal conductivities of carbon nanotube nano-refrigerants. Int. J. Therm. Sci. 2009, 48, 1108–1115. [Google Scholar] [CrossRef]
  14. Lee, K.; Hwang, Y.; Cheong, S.; Kwon, L.; Kim, S.; Lee, J. Performance evaluation of nano-lubricants of fullerene nanoparticles in refrigeration mineral oil. Curr. Appl. Phys. 2009, 9, e128–e131. [Google Scholar] [CrossRef]
  15. Bi, S.S.; Shi, L.; Zhang, L.L. Application of nanoparticles in domestic refrigerators. Appl. Therm. Eng. 2008, 28, 1834–1843. [Google Scholar] [CrossRef]
  16. Mota-Babiloni, A.; Navarro-Esbrí, J.; Barragán-Cervera, Á.; Molés, F.; Peris, B. Experimental study of an R1234ze(E)/R134a mixture (R450A) as R134a replacement. Int. J. Refrig. 2015, 51, 52–58. [Google Scholar] [CrossRef]
  17. Bibin, B.S.; Gundabattini, E. Investigation on transport properties, heat transfer characteristics and pressure drop of CuO enhanced R1234yf based refrigerant. Case Stud. Therm. Eng. 2023, 49, 103229. [Google Scholar] [CrossRef]
  18. Janković, Z.; Sieres Atienza, J.; Martínez Suárez, J.A. Thermodynamic and heat transfer analyses for R1234yf and R1234ze(E) as drop-in replacements for R134a in a small power refrigerating system. Appl. Therm. Eng. 2015, 80, 42–54. [Google Scholar] [CrossRef]
  19. Sieres, J.; Santos, J.M. Experimental analysis of R1234yf as a drop-in replacement for R134a in a small power refrigerating system. Int. J. Refrig. 2018, 91, 230–238. [Google Scholar] [CrossRef]
  20. Chen, X.; Liang, K.; Li, Z.; Zhao, Y.; Xu, J.; Jiang, H. Experimental assessment of alternative low global warming potential refrigerants for automotive air conditioners application. Case Stud. Therm. Eng. 2020, 22, 100800. [Google Scholar] [CrossRef]
  21. Li, Z.; Liang, K.; Jiang, H. Experimental study of R1234yf as a drop-in replacement for R134a in an oil-free refrigeration system. Appl. Therm. Eng. 2019, 153, 646–654. [Google Scholar] [CrossRef]
  22. Navarro-Esbrí, J.; Mendoza-Miranda, J.; Mota-Babiloni, A.; Barragán-Cervera, A.; Belman-Flores, J. Experimental analysis of R1234yf as a drop-in replacement for R134a in a vapor compression system. Int. J. Refrig. 2013, 36, 870–880. [Google Scholar] [CrossRef]
  23. Sánchez, D.; Cabello, R.; Llopis, R.; Arauzo, I.; Catalán-Gil, J.; Torrella, E. Energy performance evaluation of R1234yf, R1234ze(E), R600a, R290 and R152a as low-GWP R134a alternatives. Int. J. Refrig. 2017, 74, 269–282. [Google Scholar] [CrossRef]
  24. Mota-Babiloni, A.; Navarro-Esbrí, J.; Barragán, N.; Molés, F.; Peris, B. Drop-in energy performance evaluation of R1234yf and R1234ze(E) in a vapor compression system as R134a replacements. Appl. Therm. Eng. 2014, 71, 259–265. [Google Scholar] [CrossRef]
  25. Peyyala, A.; Naga, M.; Sri, S.; Sudheer, N.; Kumar, K.C.K. Experimental investigation on effect of nano lubrication in a VCR system using R410a refrigerant with Al2O3 nano particles. Int. J. Mech. Prod. Eng. Res. Dev. 2020, 10, 1761–1768. [Google Scholar]
  26. Ambhore, D.; Tiwari, A.; Patel, U.; Patil, J.; Ramachandran, M. Effect of Aluminium oxide Nano filler in Tetrafluoroethane (R-134a) Refrigerant. IOP Conf. Ser. Mater. Sci. Eng. 2020, 810, 012018. [Google Scholar] [CrossRef]
  27. Subhedar, D.G.; Patel, J.Z.; Ramani, B.M. Experimental studies on vapour compression refrigeration system using Al2O3/mineral oil nano-lubricant. Aust. J. Mech. Eng. 2020, 20, 1136–1141. [Google Scholar] [CrossRef]
  28. Yilmaz, A.C. Performance evaluation of are frigeration system using nanolubricant. Appl. Nanosci. 2020, 10, 1667–1678. [Google Scholar] [CrossRef]
  29. Bartelt, K. Flow-Boiling of R-134a/POE/CuO Nanofluids in a Horizontal Tube. Purdue e-Pubs. 2008. Available online: https://docs.lib.purdue.edu/iracc/928/ (accessed on 25 May 2023).
  30. Katoch, A.; Razak, F.A.; Suresh, A.; Bibin, B.S.; Gundabattini, E. Performance analysis of nano-refrigerants used in the vapor compression refrigeration system using MATLAB-Simulink. Proc. Inst. Mech. Eng. Part C J. Mech. Eng. Sci. 2022, 236, 6948–6966. [Google Scholar] [CrossRef]
  31. Kumar, S.; Kanimozhi, B.; Sunil Kumar, M. Performance evaluation of refrigeration system using nano-fluid. Mater. Today Proc. 2021, 44, 3838–3845. [Google Scholar] [CrossRef]
  32. Dhamneya, A.K.; Rajput, S.; Singh, A. Comparative performance analysis of ice plant test rig with TiO2-R-134a nano refrigerant and evaporative cooled condenser. Case Stud. Therm. Eng. 2018, 11, 55–61. [Google Scholar] [CrossRef]
  33. Rahman, S.; Issa, S.; Said, Z.; El Haj Assad, M.; Zadeh, R.; Barani, Y. Performance enhancement of a solar powered air conditioning system using passive techniques and SWCNT /R-407c nano refrigerant. Case Stud. Therm. Eng. 2019, 16, 100565. [Google Scholar] [CrossRef]
  34. Katoch, A.; Abdul Razak, F.; Suresh, A.; Bibin, B.S.; Gundabattini, E.; Yusoff, M.Z. Performance of Nanoparticles in Refrigeration Systems: A Review. J. Nanofluids 2022, 11, 469–486. [Google Scholar] [CrossRef]
  35. Wang, C. An overview for the heat transfer performance of HFO-1234yf. Renew. Sustain. Energy Rev. 2013, 19, 444–453. [Google Scholar] [CrossRef]
  36. Sitprasert, C.; Dechaumphai, P.; Juntasaro, V. A thermal conductivity model for nanofluids including effect of the temperature-dependent interfacial layer. J. Nanoparticle Res. 2008, 11, 1465–1476. [Google Scholar] [CrossRef]
  37. Brinkman, H.C. The Viscosity of Concentrated Suspensions and Solutions. J. Chem. Phys. 1952, 20, 571. [Google Scholar] [CrossRef]
  38. Pak, B.C.; Cho, Y.I. Hydrodynamic and heat transfer study of dispersed fluids with submicron metallic oxide particles. Exp. Heat Transf. Int. J. 1998, 11, 151–170. [Google Scholar] [CrossRef]
  39. Peng, H.; Ding, G.; Jiang, W.; Hu, H.; Gao, Y. Heat transfer characteristics of refrigerant-based nanofluid flow boiling inside a horizontal smooth tube. Int. J. Refrig. 2009, 32, 1259–1270. [Google Scholar] [CrossRef]
  40. Ding, G.; Jiang, W.; Hu, H.; Gao, Y. Measurement and correlation of frictional pressure drop of refrigerant-based nanofluid flow boiling inside a horizontal smooth tube. Int. J. Refrig. 2009, 32, 1756–1764. [Google Scholar] [CrossRef]
  41. Lee, M.; Park, G.; Park, C.; Kim, C. Improvement of Grid independence Test for computational fluid dynamics model of building based on grid resolution. Adv. Civ. Eng. 2020, 2020, 8827936. [Google Scholar] [CrossRef]
  42. Yasser, Z.K.; Hamad, A.J. Experimental and numerical analyses of R134A flow boiling heat transfer characteristics in an evaporator tube of refrigeration system. Int. J. Air-Cond. Refrig. 2019, 27, 1950024. [Google Scholar] [CrossRef]
  43. Sun, B.; Yang, D. Flow boiling heat transfer characteristics of nano-refrigerants in a horizontal tube. Int. J. Refrig. 2014, 38, 206–214. [Google Scholar] [CrossRef]
  44. Sakthi Priya, M.; Sakthivadivel, D. Experimental investigation on the thermal performance of a novel thermosyphon heat pipe with truncated cone for heat recovery systems. Energy Convers. Manag. 2023, 276, 116522. [Google Scholar] [CrossRef]
  45. Asadi, A.; Alarifi, I.M.; Ali, V.; Nguyen, H.M. An experimental investigation on the effects of ultrasonication time on stability and thermal conductivity of MWCNT-water nanofluid: Finding the optimum ultrasonication time. Ultrason. Sonochem. 2019, 58, 104639. [Google Scholar] [CrossRef]
  46. Shen, S.; Narayanaswamy, A.; Chen, G. Surface Phonon Polaritons Mediated Energy Transfer between Nanoscale Gaps. Nano Lett. 2009, 9, 2909–2913. [Google Scholar] [CrossRef]
  47. Sharif, M.Z.; Azmi, W.H.; Redhwan, A.A.M.; Mamat, R.; Yusof, T.M. Performance analysis of SiO2/PAG nanolubricant in automotive air conditioning system. Int. J. Refrig. 2017, 75, 204–216. [Google Scholar] [CrossRef]
  48. Domingues, G.; Volz, S.; Joulain, K.; Greffet, J.-J. Heat Transfer between Two Nanoparticles Through Near Field Interaction. Phys. Rev. Lett. 2005, 94. [Google Scholar] [CrossRef]
  49. Patil, M.S.; Kim, S.C.; Seo, J.; Lee, M. Review of the Thermo-Physical Properties and Performance Characteristics of a refrigeration system using Refrigerant-Based Nanofluids. Energies 2015, 9, 22. [Google Scholar] [CrossRef]
  50. Yıldız, G.; Ağbulut, Ü.; Gürel, A.E. A review of stability, thermophysical properties and impact of using nanofluids on the performance of refrigeration systems. Int. J. Refrig. 2021, 129, 342–364. [Google Scholar] [CrossRef]
  51. Bibin, B.S.; Gundabattini, E. Investigation on the density of Al2O3/R1234yf, TiO2/R1234yf and CuO/R1234yf nano-refrigerants. Proc. Inst. Mech. Eng. Part N J. Nanomater. Nanoeng. Nanosyst. 2022, 239779142210986. [Google Scholar] [CrossRef]
  52. Mahbubul, I.; Saadah, A.; Saidur, R.; Khairul, M.; Kamyar, A. Thermal performance analysis of Al2O3/R-134a nano-refrigerant. Int. J. Heat Mass Transf. 2015, 85, 1034–1040. [Google Scholar] [CrossRef]
  53. He, Q.; Wang, S.; Tong, M.; Liu, Y. Experimental study on thermophysical properties of nanofluids as phase-change material (PCM) in low temperature cool storage. Energy Convers. Manag. 2012, 64, 199–205. [Google Scholar] [CrossRef]
  54. Alawi, O.A.; Salih, J.M.; Mallah, A. Thermo-physical properties effectiveness on the coefficient of performance of Al2O3/R141b nano-refrigerant. Int. Commun. Heat Mass Transf. 2019, 103, 54–61. [Google Scholar] [CrossRef]
Figure 1. SEM image of TiO2 nanoparticle.
Sustainability 15 12605 g001
Figure 2. Flow chart for simulation.
Sustainability 15 12605 g002
Figure 3. Evaporator tube with boundary condition.
Sustainability 15 12605 g003
Figure 4. Grid Structure.
Sustainability 15 12605 g004
Figure 5. Dependency of Grids.
Sustainability 15 12605 g005
Figure 6. Thermal conductivity of nano-enhanced refrigerant with temperature.
Sustainability 15 12605 g006
Figure 7. Impact of temperature and volume concentration on the viscosity of TiO2/R1234yf.
Sustainability 15 12605 g007
Figure 8. Variation of volume fraction and temperature on the density of nanorefrigerant.
Sustainability 15 12605 g008
Figure 9. Effect of specific heat capacity by temperature.
Sustainability 15 12605 g009
Figure 10. Velocity contour.
Sustainability 15 12605 g010
Figure 11. Pressure Contour.
Sustainability 15 12605 g011
Figure 12. Flow boiling HTC of TiO2/R1234yf nanorefrigerant.
Sustainability 15 12605 g012
Figure 13. Variation of pressure drops with vapor quality.
Sustainability 15 12605 g013
Table 1. TiO2 Nanoparticle Properties [21].
Thermal Conductivity (W/mK)8.4
Density (kg/m3)4230
Specific heat (J/kgK)692
Diameter (nm)30
Table 2. Properties of POE lubricant oil and R1234yf refrigerant [35].
T (°C)Thermal Conductivity (W/mK)Density (kg/m3)Specific Heat (J/kgK)Viscosity (mPa.s)
R1234yfPOER1234yfPOER1234yfPOER1234yfPOE
100.07130.146711441026.21129317450.19456.375
150.06930.145711281022.14131217560.18242.673
200.06720.144711111018.08133217690.17133.491
250.06520.14310941014.04135417830.16126.875
300.06310.142310751010137917960.15221.929
350.06090.141610571005.97140618080.14318.067
400.05860.140810371001.94143718210.13415.25
Table 3. Summary of validation analysis.
Volume Concentration (%)Thermal Conductivity (W/mK)Specific Heat (J/kgK)Density (kg/m3)
PredictiveExperimentDeviation (%)PredictiveExperimentDeviation (%)PredictiveExperimentDeviation (%)
00.14230.13038.4317961775.521.141010922.848.63
0.20.14470.13367.661786.811758.401.591016.44933.678.14
0.40.14700.13617.411777.741741.292.051022.88947.637.36
0.60.14940.14016.211768.781722.082.641029.32956.447.08
0.80.15140.14295.631759.931704.843.131035.76969.126.43
10.15310.14535.101751.191692.703.341042.2980.125.96
Table 4. Validation of software tool.
Vapor QualityFlow Boiling HTC (W/m2K) of CuO/R141b (0.3% of Weight)
Experiment by Sun & Yang [43]SimulationDeviation (%)
0.32255.852346.083.99
0.42579.32713.425.2
0.52845.852983.894.62
0.63374.943574.065.9
0.73847.24108.86.79
0.84448.34750.786.8
Table 5. Level of prediction.
Prediction LevelsAAD
ExcellentUp to ±5%
Very Good±5 to 15%
Good±15 to 25%
Satisfactory±25 to 35%
Over predictionabove ±35%
Table 6. Comparison of simulation and numerical results.
Vapor QualityFlow Boiling HTC (W/m2K)
0.2% TiO21% TiO2
Predictive ResultSimulation ResultDeviation (%)Predictive ResultSimulation ResultDeviation (%)
0.22517.892443.862.946292.615699.29.43
0.33023.8729283.147171.926478.399.67
0.43431.713316.753.358902.148019.059.92
0.54246.524107.233.2810,332.19287.5310.11
0.65158.444982.533.4111,419.4310,250.0810.24
0.75584.415402.923.2812,137.2310,936.869.89
0.86135.025943.613.1213,530.4912,157.1510.15
0.96800.156592.063.0615,175.8913,678.089.87
Table 7. Deviation of the simulation and predictive results.
Vapor QualityPressure Drop (kPa)
0.2% TiO21% TiO2
Predictive ResultSimulation ResultDeviation (%)Predictive ResultSimulation ResultDeviation (%)
0.21.851.812.003.583.239.78
0.32.592.532.264.504.069.78
0.43.333.271.755.424.8710.15
0.54.084.001.906.505.8310.27
0.64.844.712.687.887.119.79
0.75.605.482.219.748.779.97
0.86.326.172.4112.2611.0010.24
0.96.836.711.8315.4313.8410.30
Disclaimer/Publisher’s Note: The statements, opinions and data contained in all publications are solely those of the individual author(s) and contributor(s) and not of MDPI and/or the editor(s). MDPI and/or the editor(s) disclaim responsibility for any injury to people or property resulting from any ideas, methods, instructions or products referred to in the content.

