
How to Improve the Synergetic Development Capabilities of the Innovation Ecosystems of High-Tech Industries in China: An fsQCA Analysis Based on the TOE Framework

Abstract
:1. Introduction
2. Theoretical Foundation and Research Framework
2.1. Theoretical Foundation
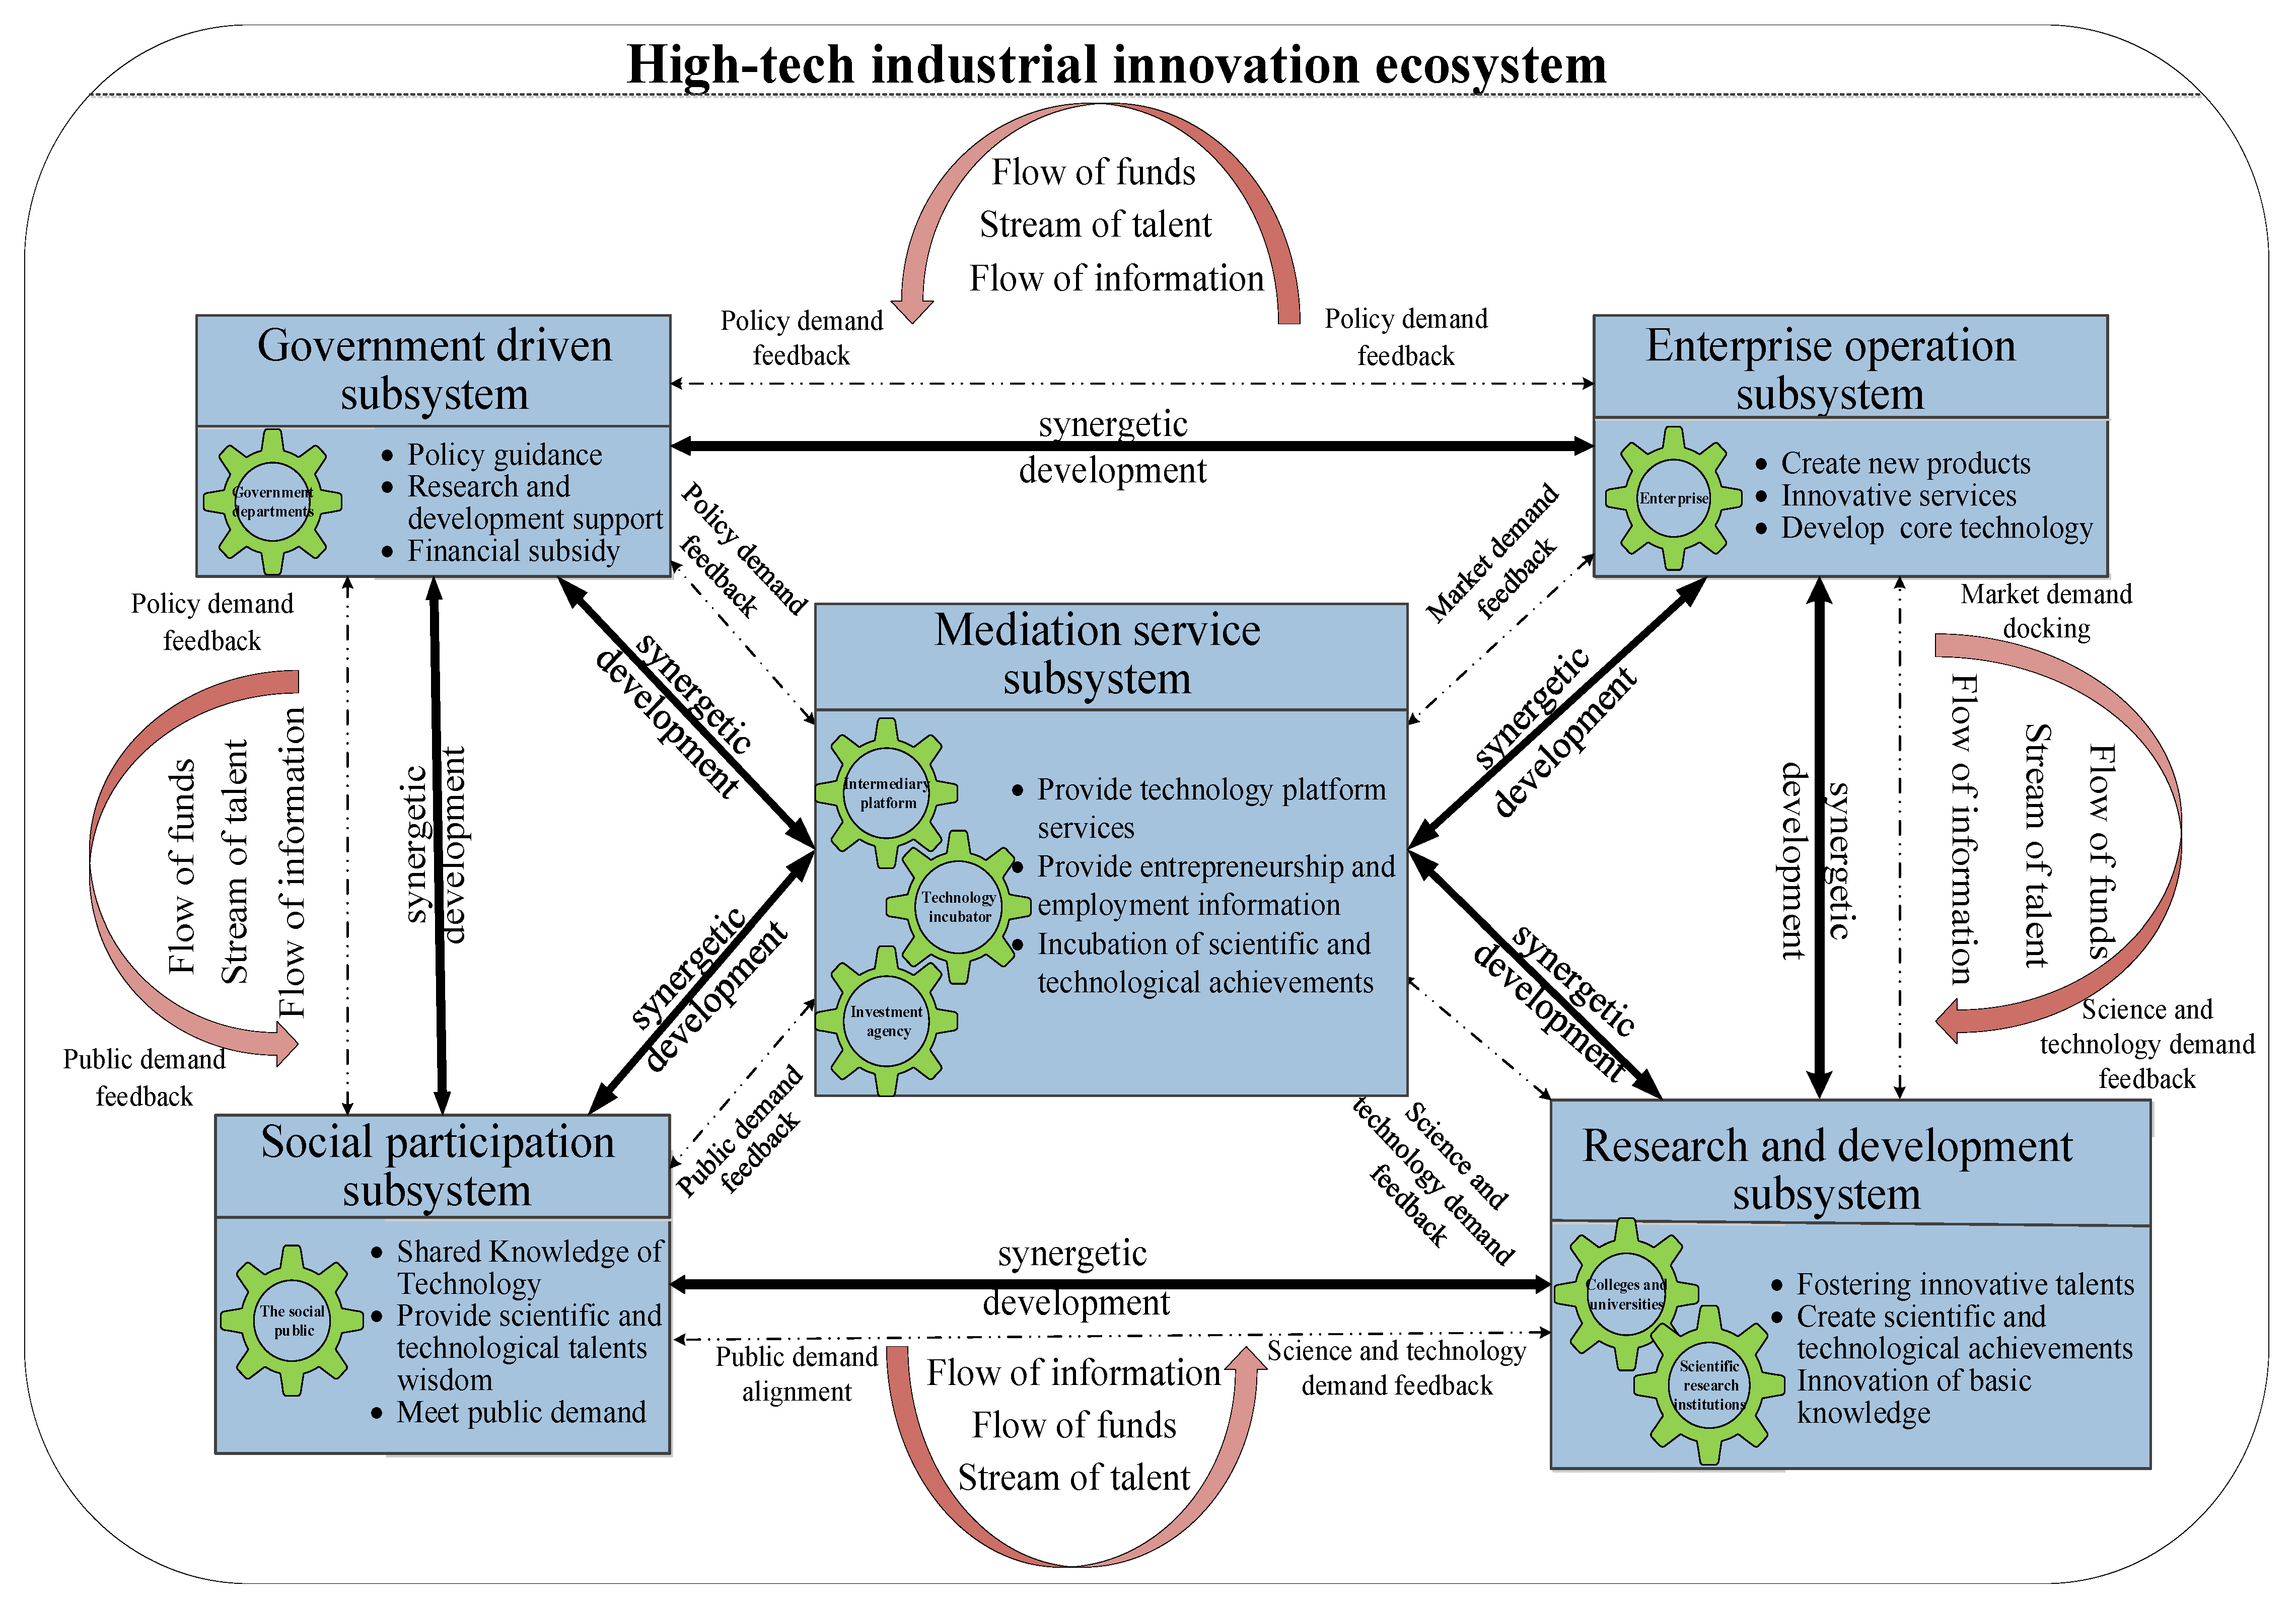
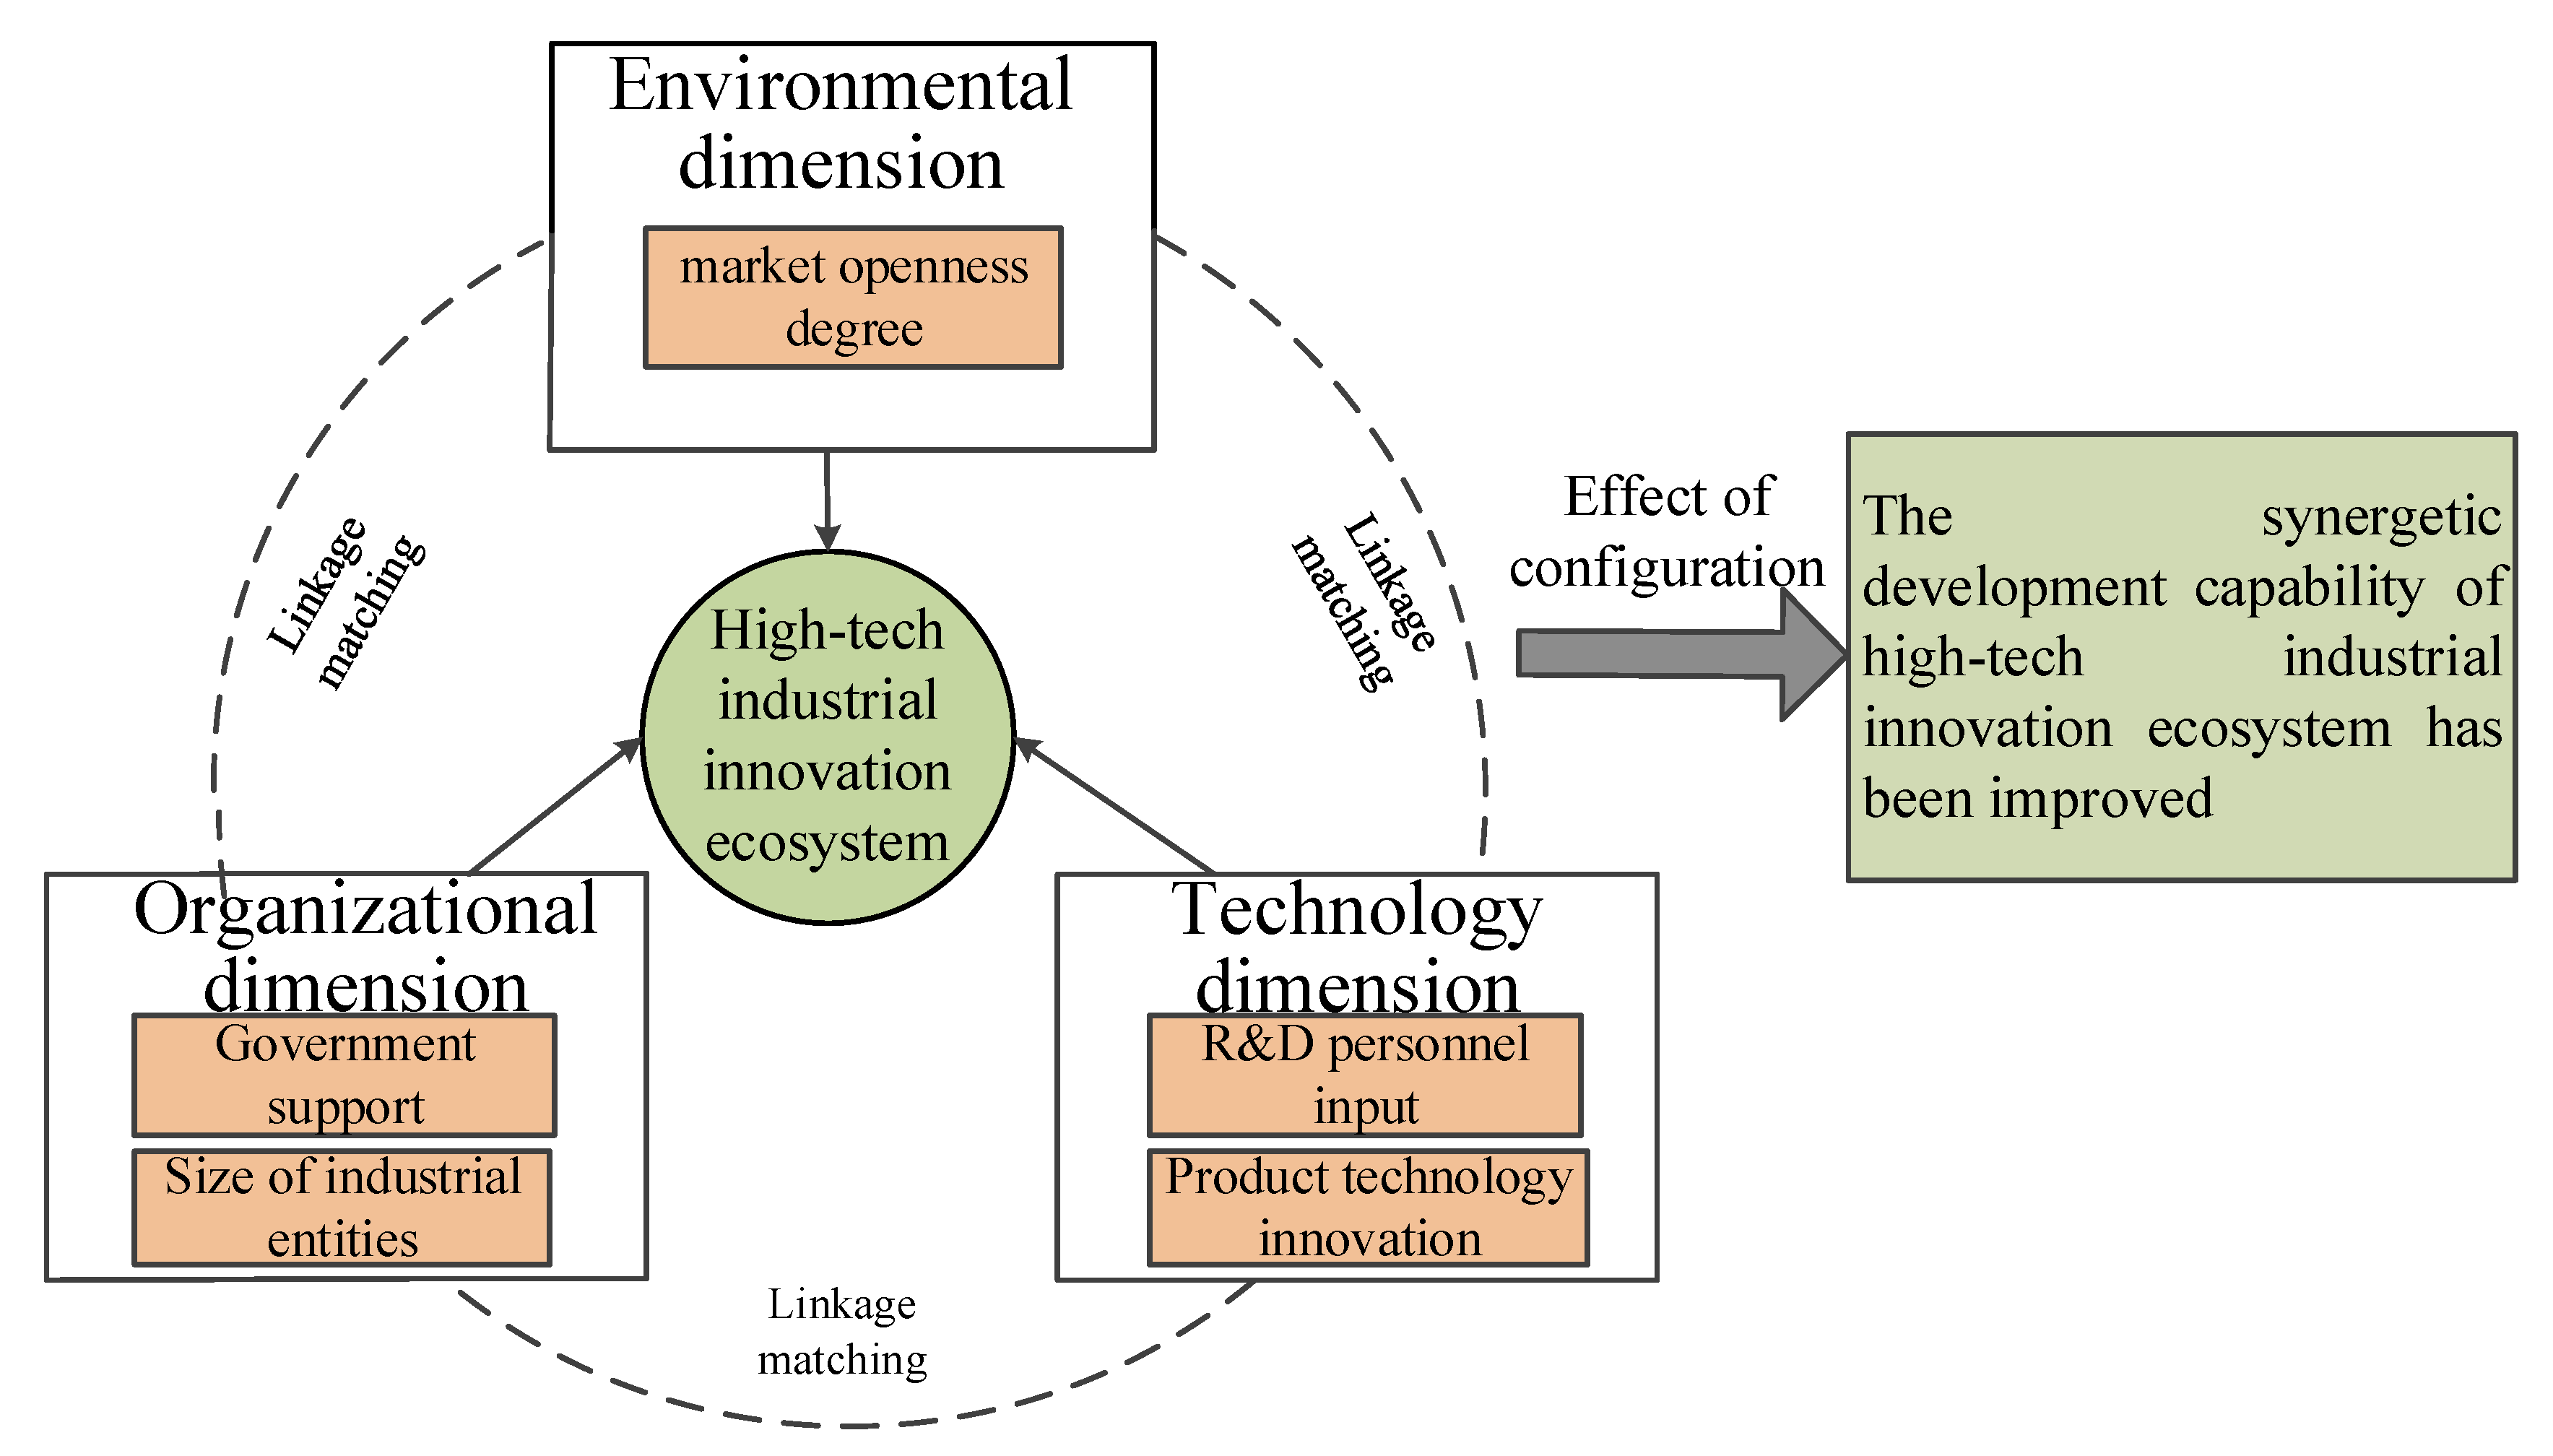
2.2. Research Framework
2.2.1. Technology Dimension
2.2.2. Organization Dimension
2.2.3. Environment Dimension
3. Study Design
3.1. Research Methods
3.1.1. The Index Construction of System Synergetic Development
3.1.2. Synergetic Development Capability Measurement Model
3.1.3. Fuzzy Set Qualitative Comparative Analysis (fsQCA)
3.1.4. Sensitivity Analysis
3.1.5. Predictive Validity Analysis
3.1.6. Post Hoc Analysis
3.2. Variable Measurement and Data Sources
3.2.1. Variable Selection and Measurement
- Outcome variable
- Condition variables
- 1.
- Technology-related condition variables
- 2.
- Organization-related condition variables
- 3.
- Environment-related condition variable
3.2.2. Data Sources
3.3. Data Calibration
4. Analysis of Empirical Results
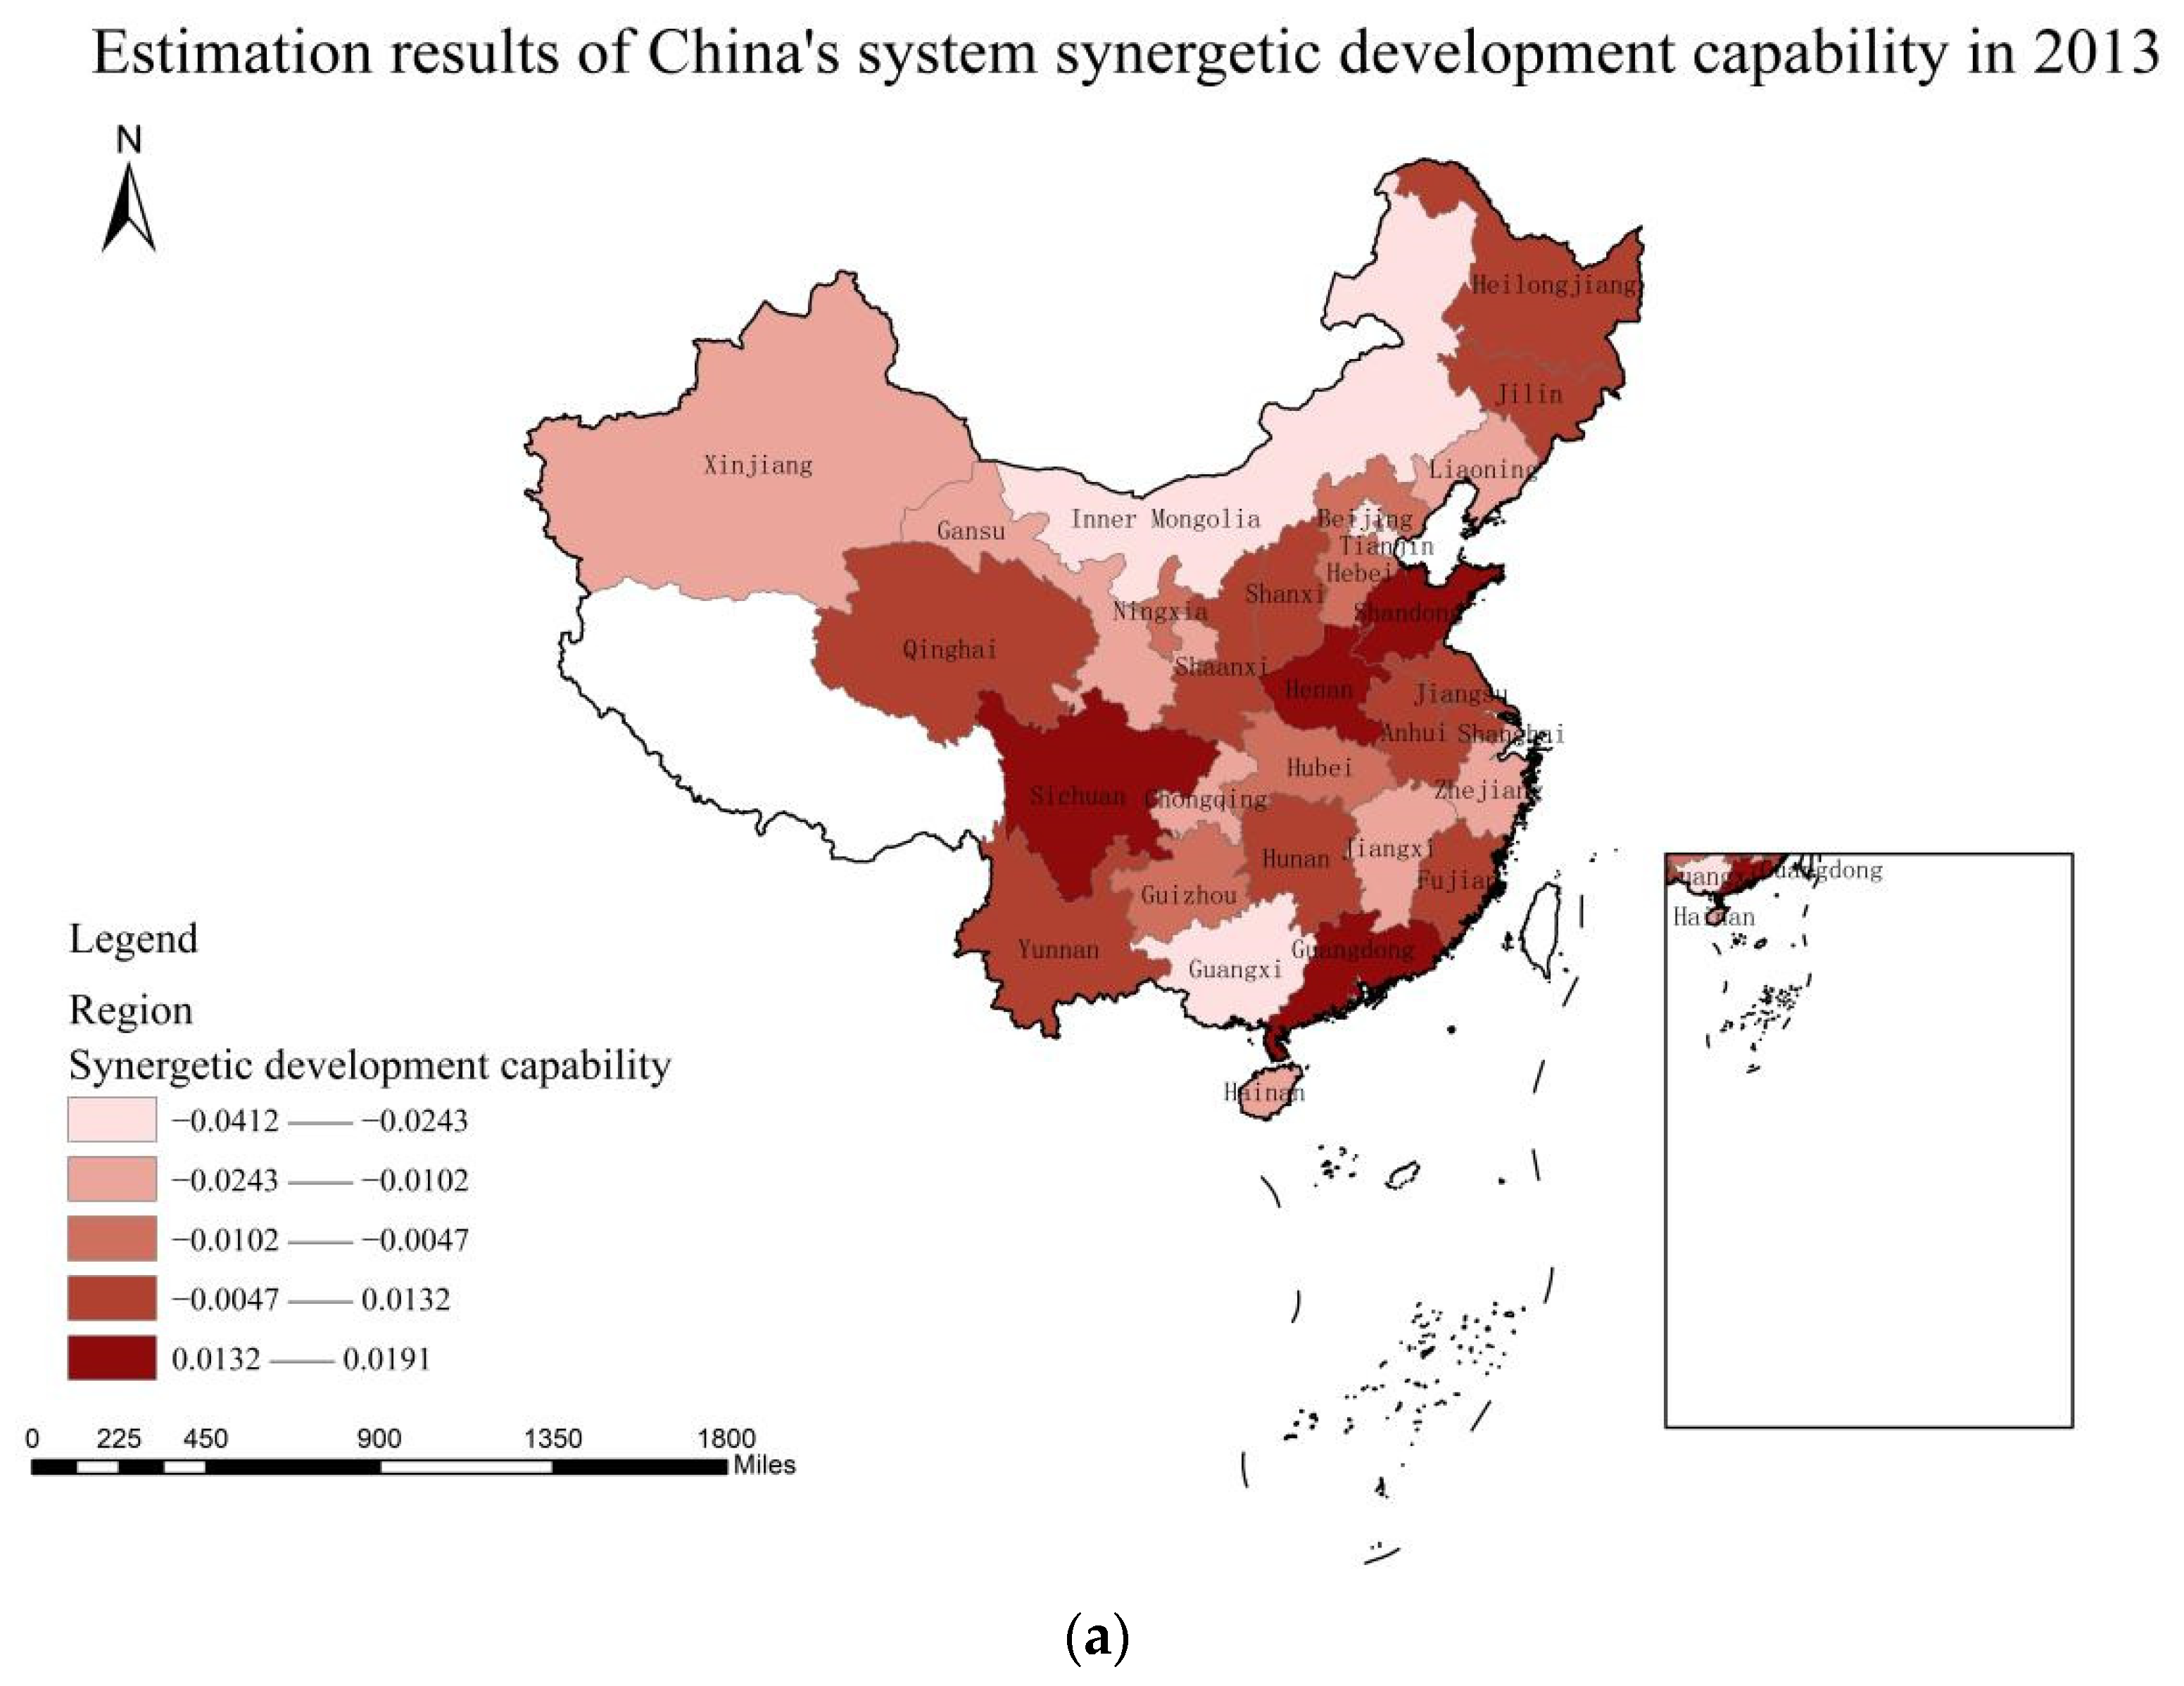
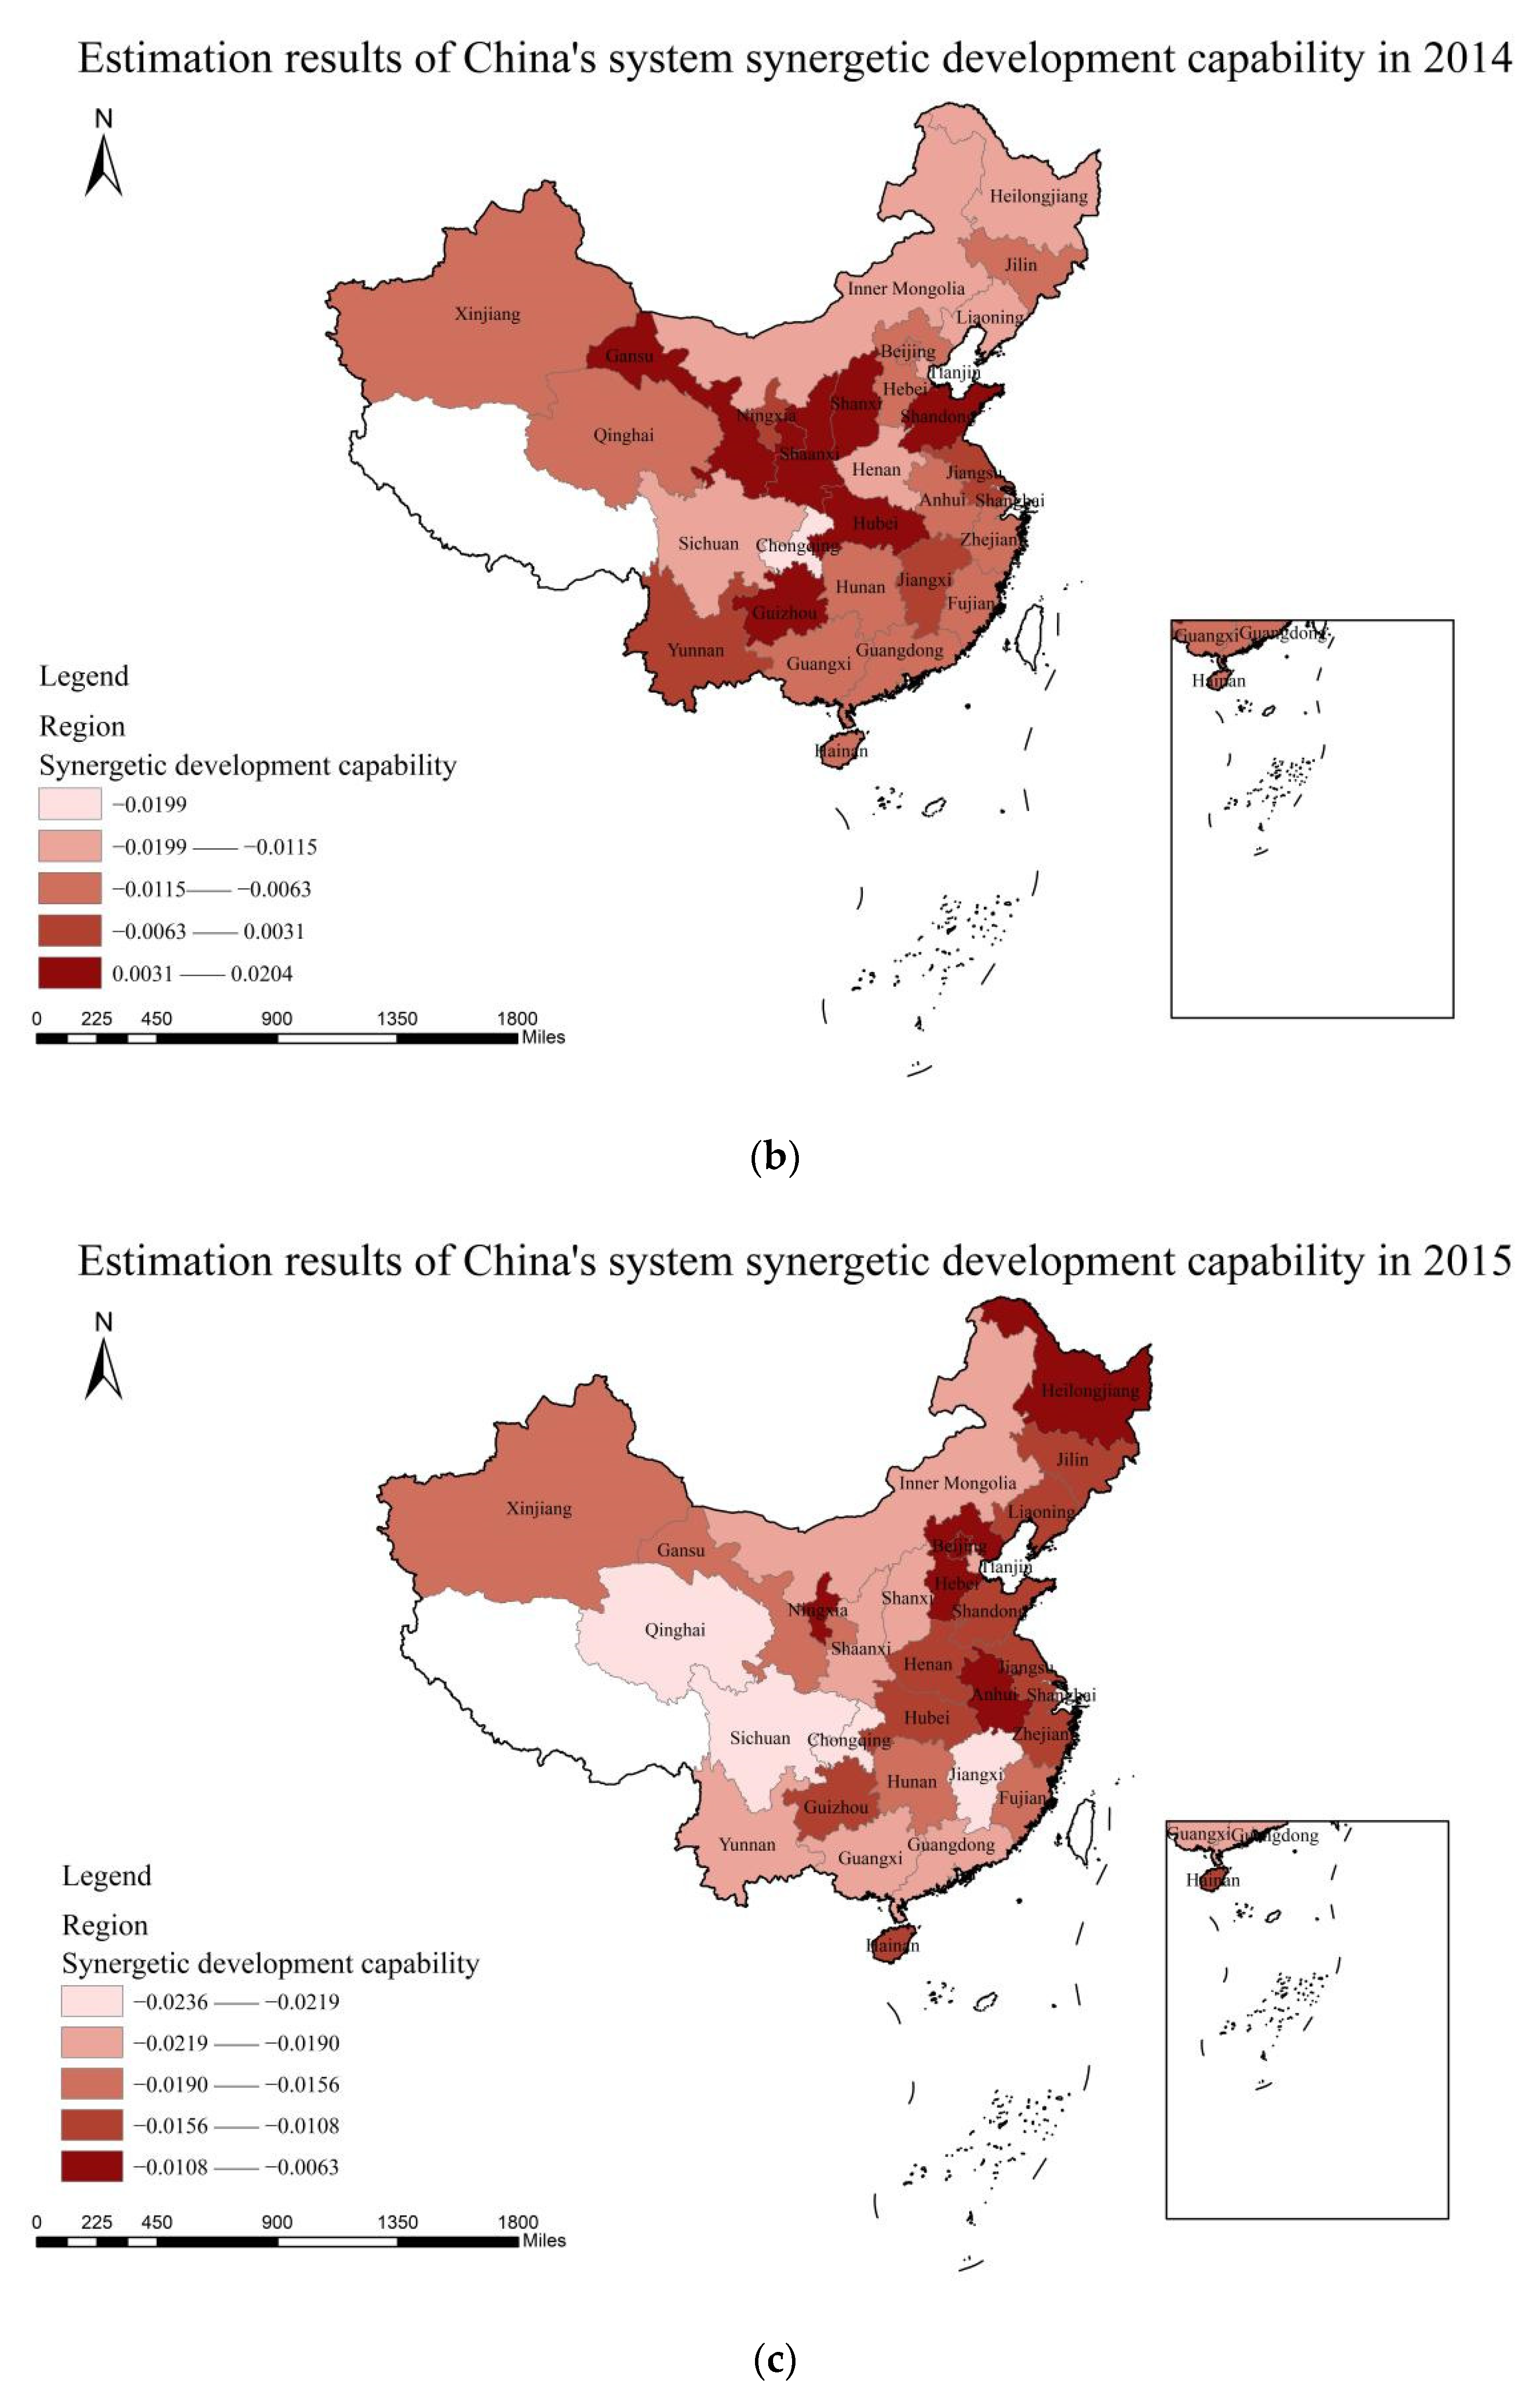
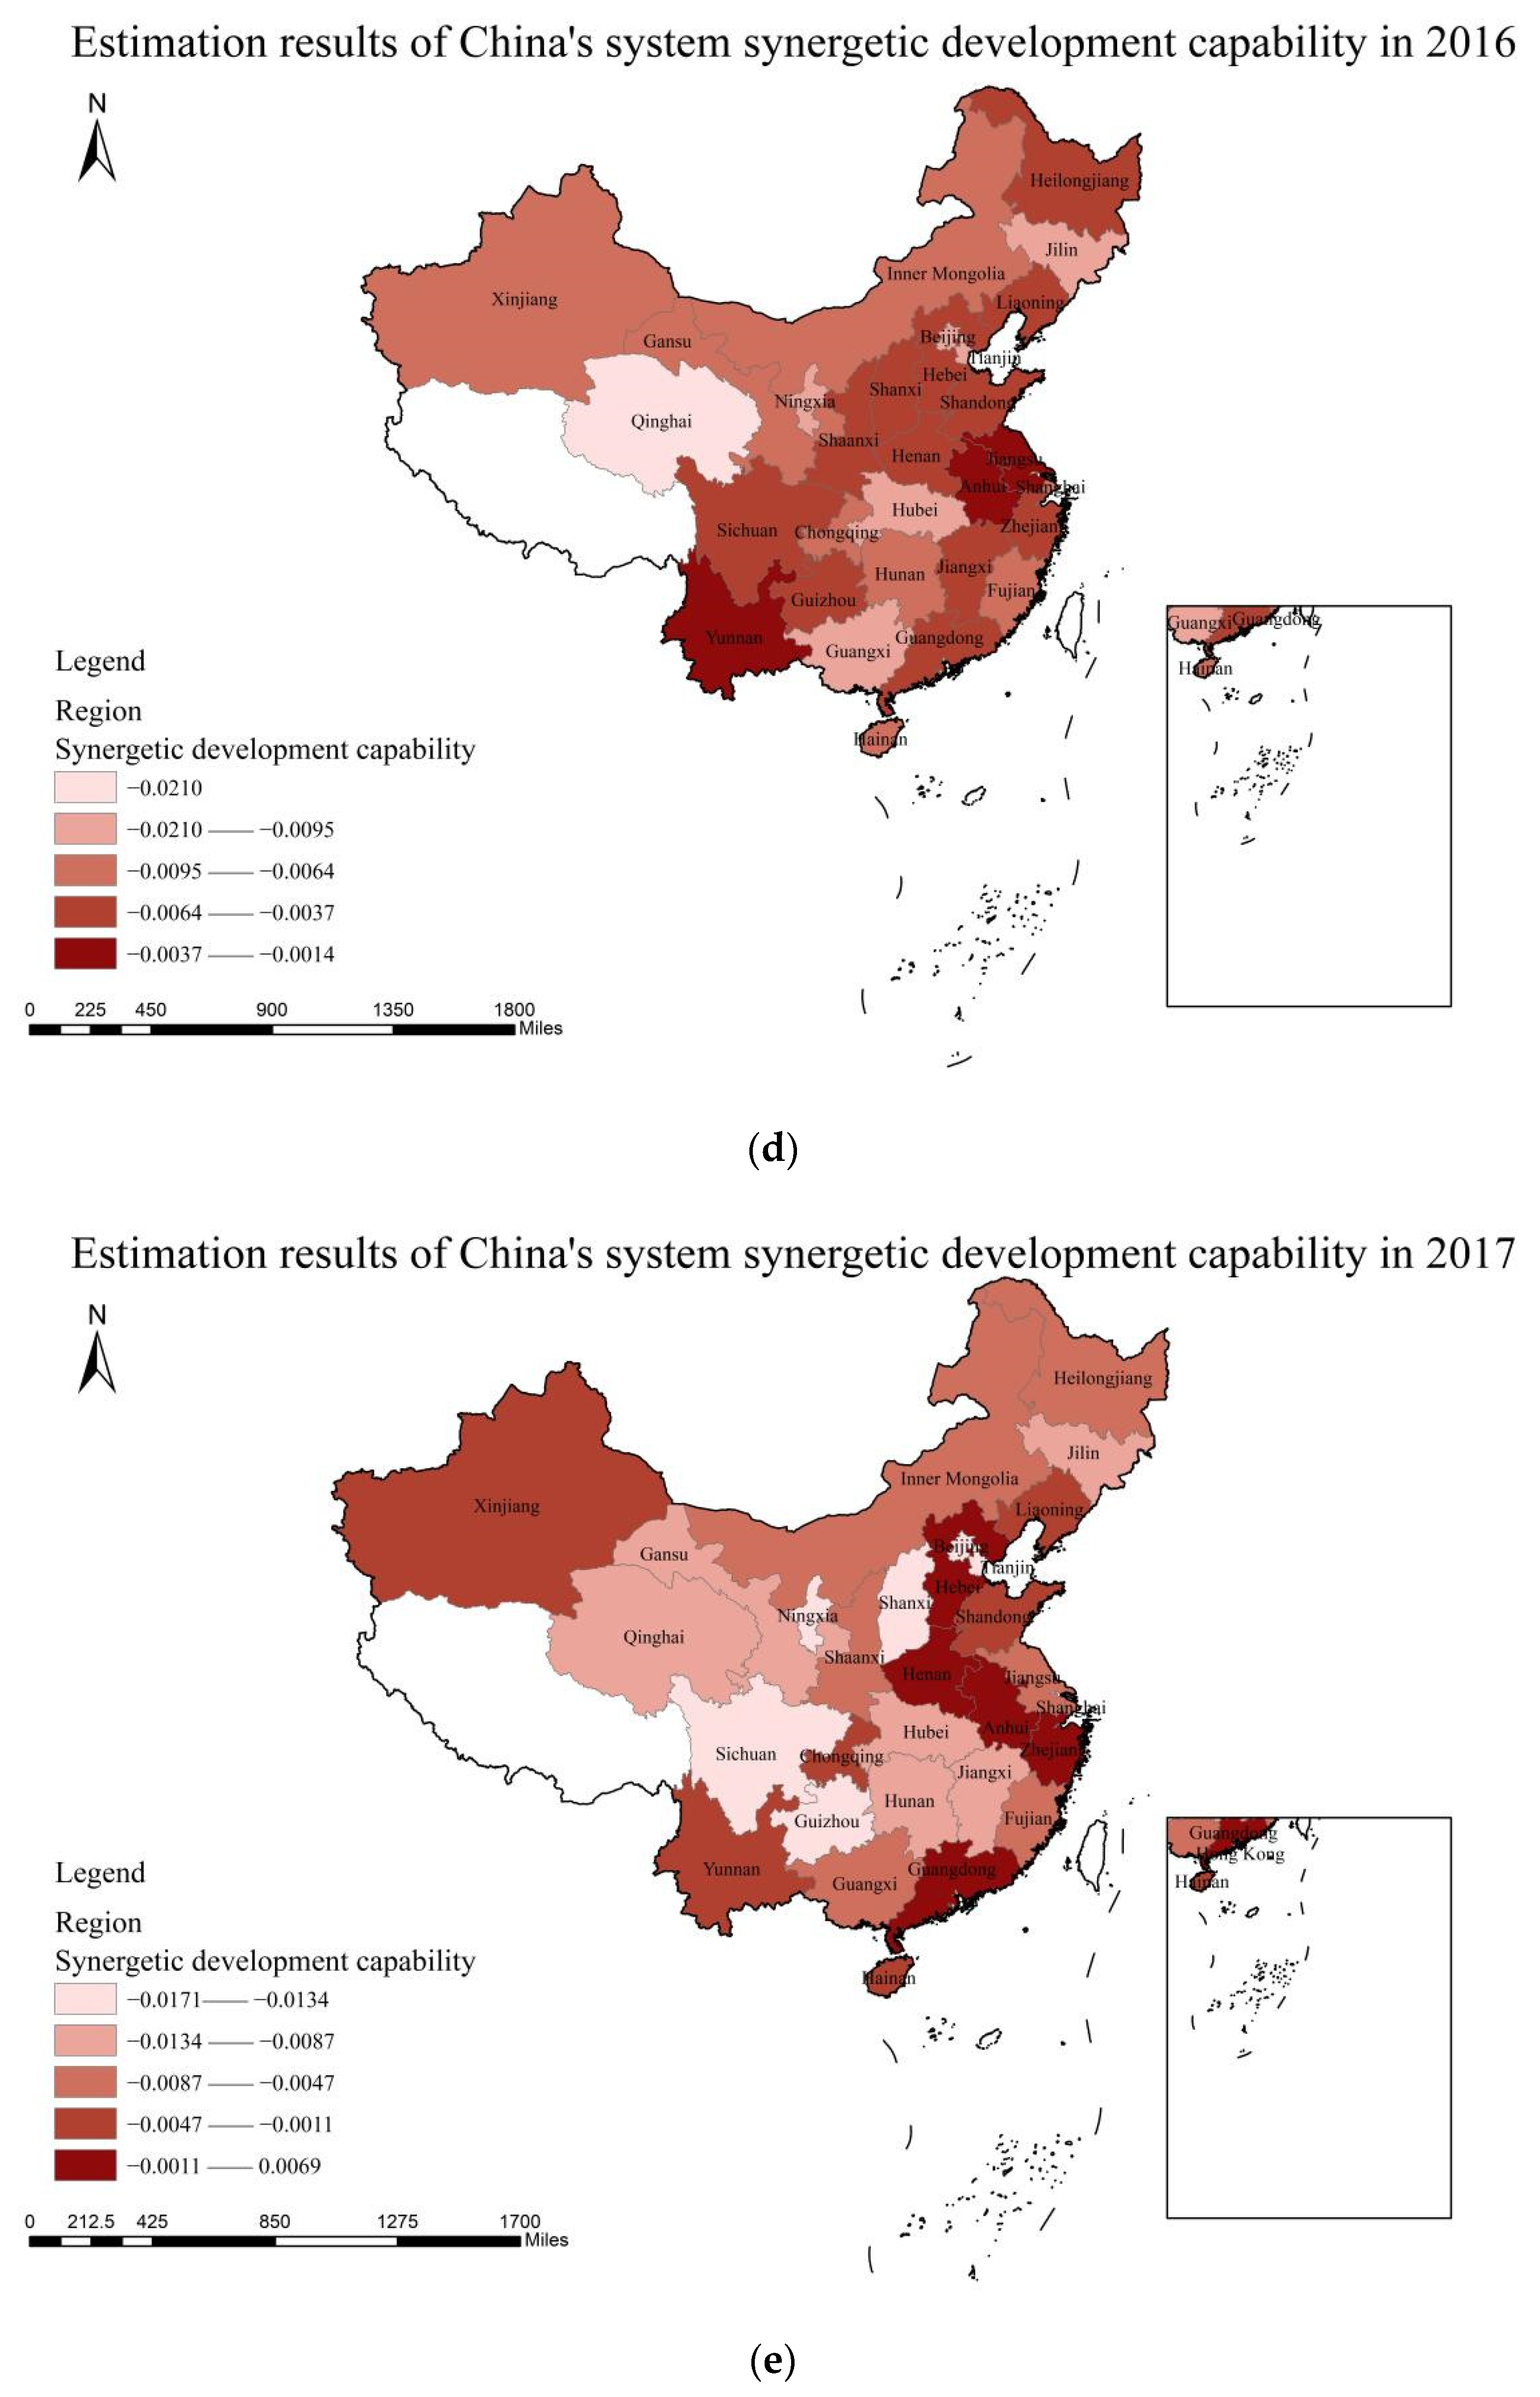
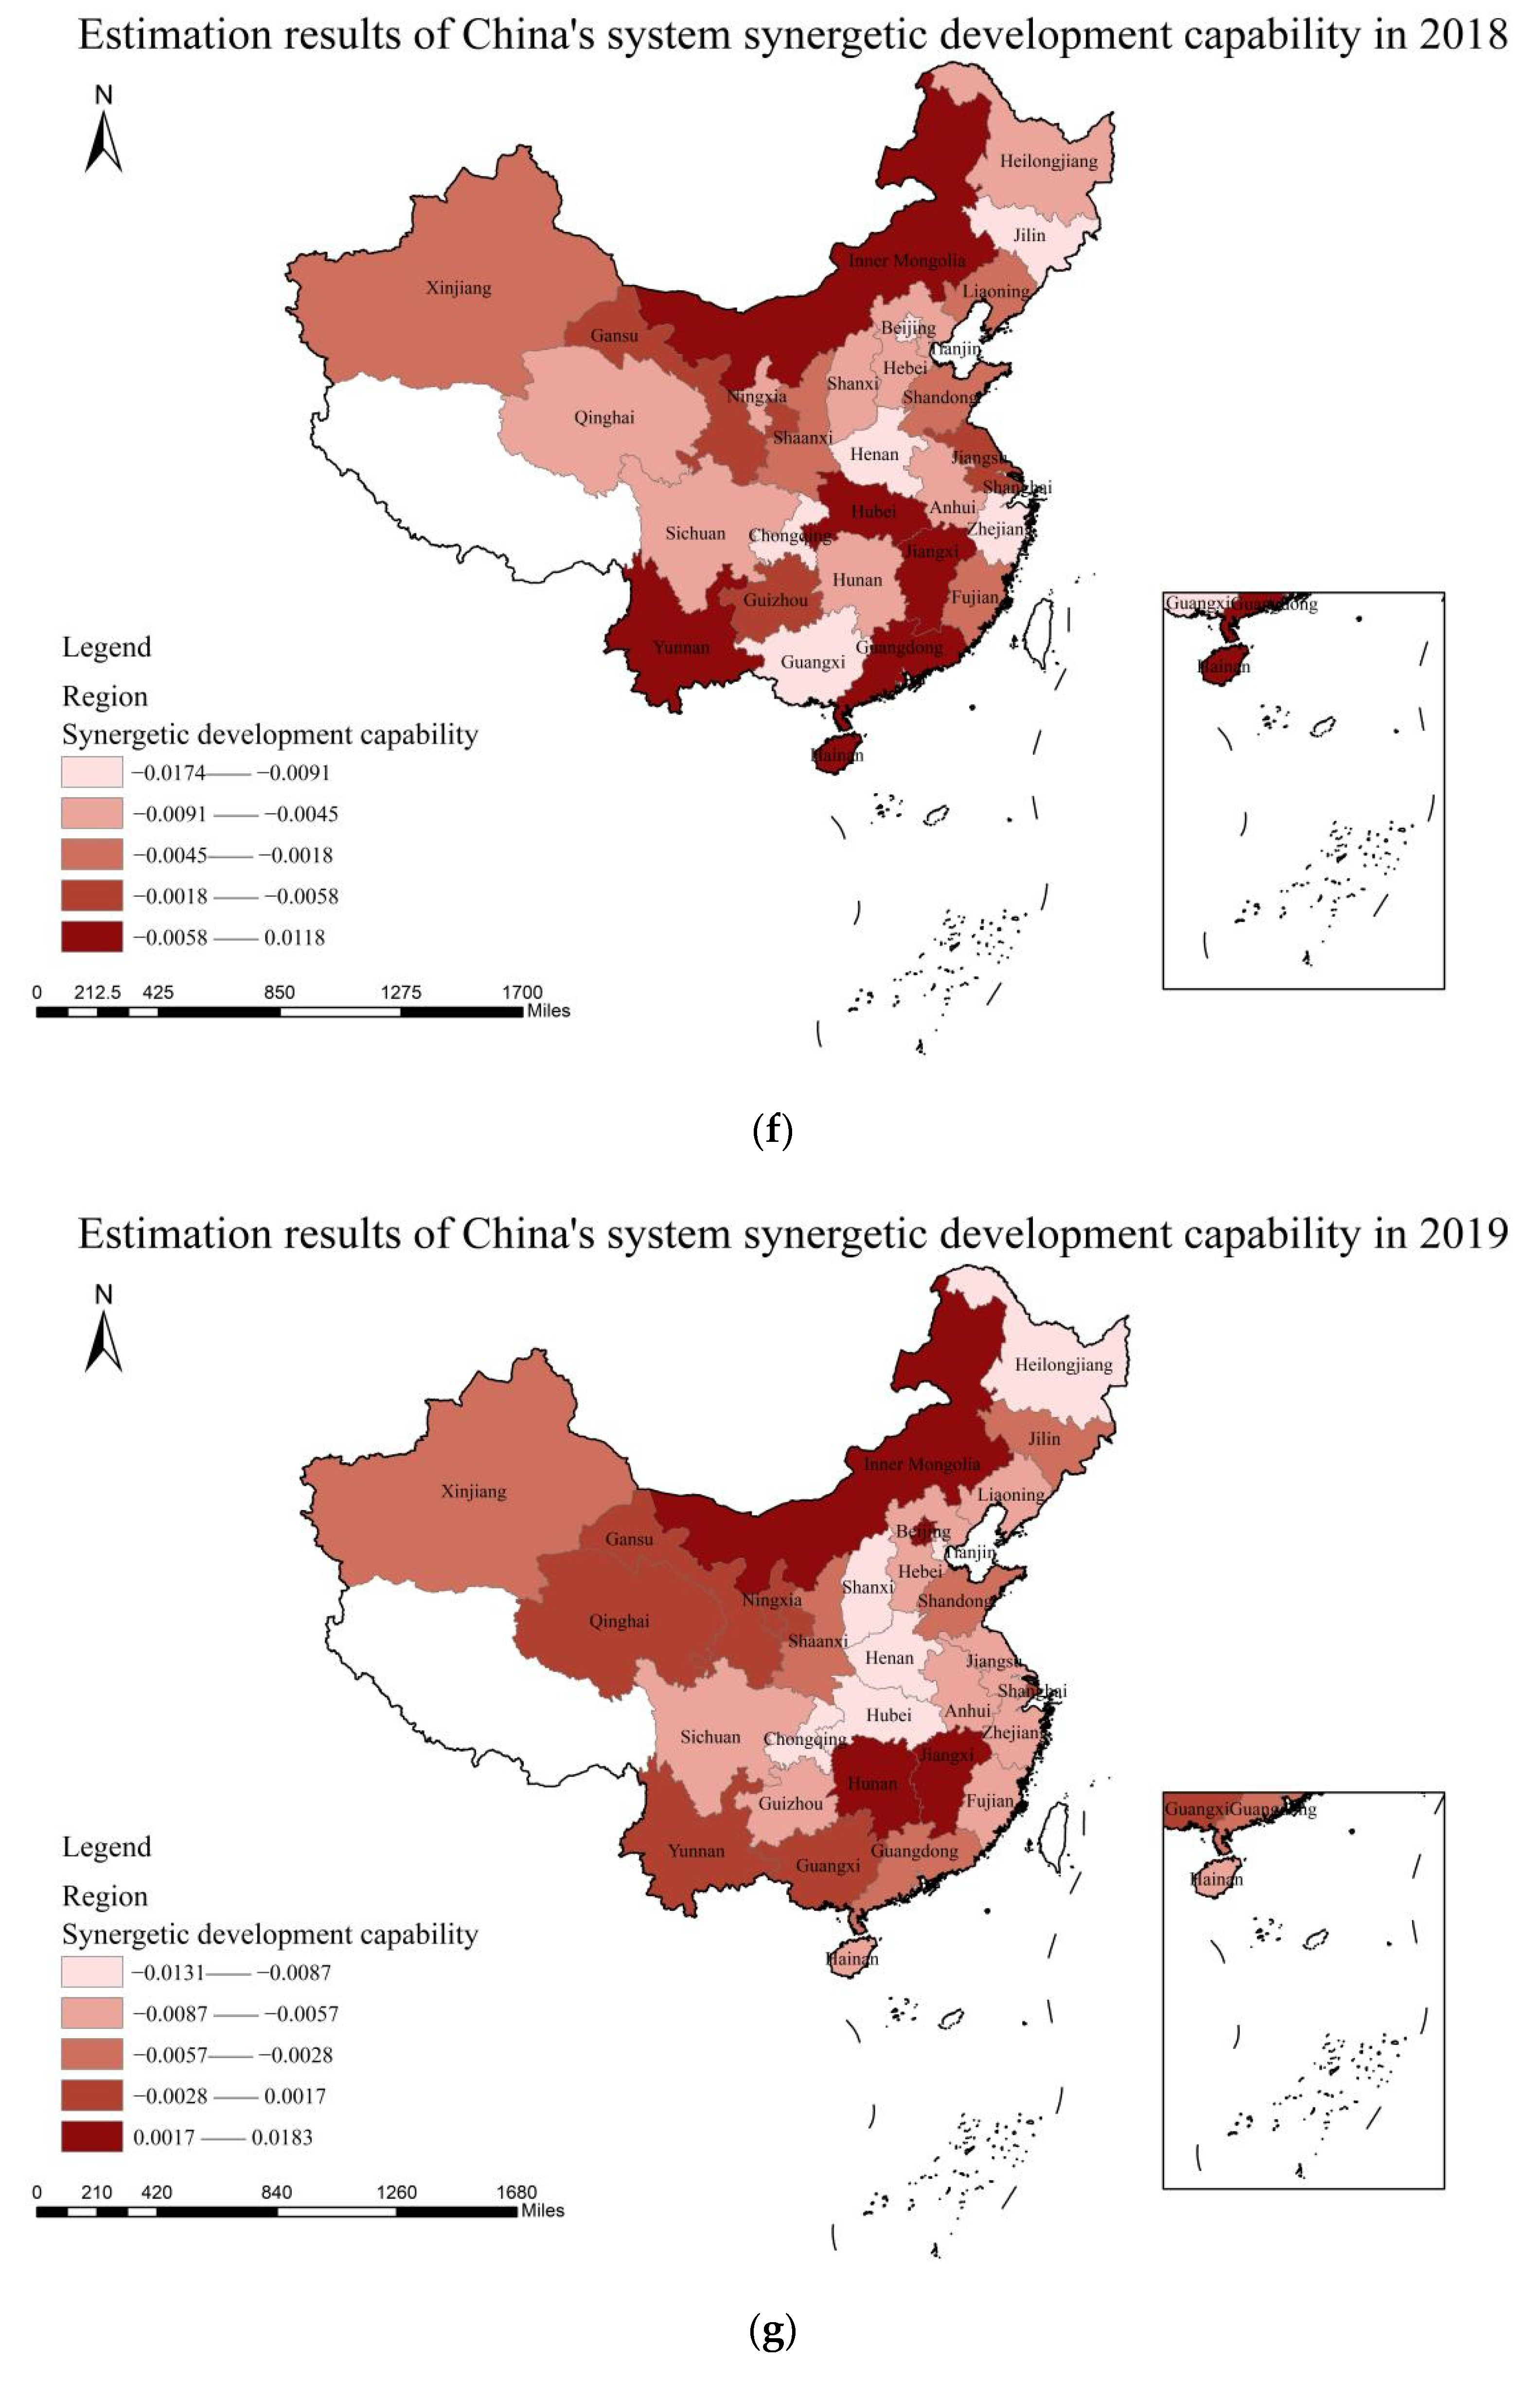
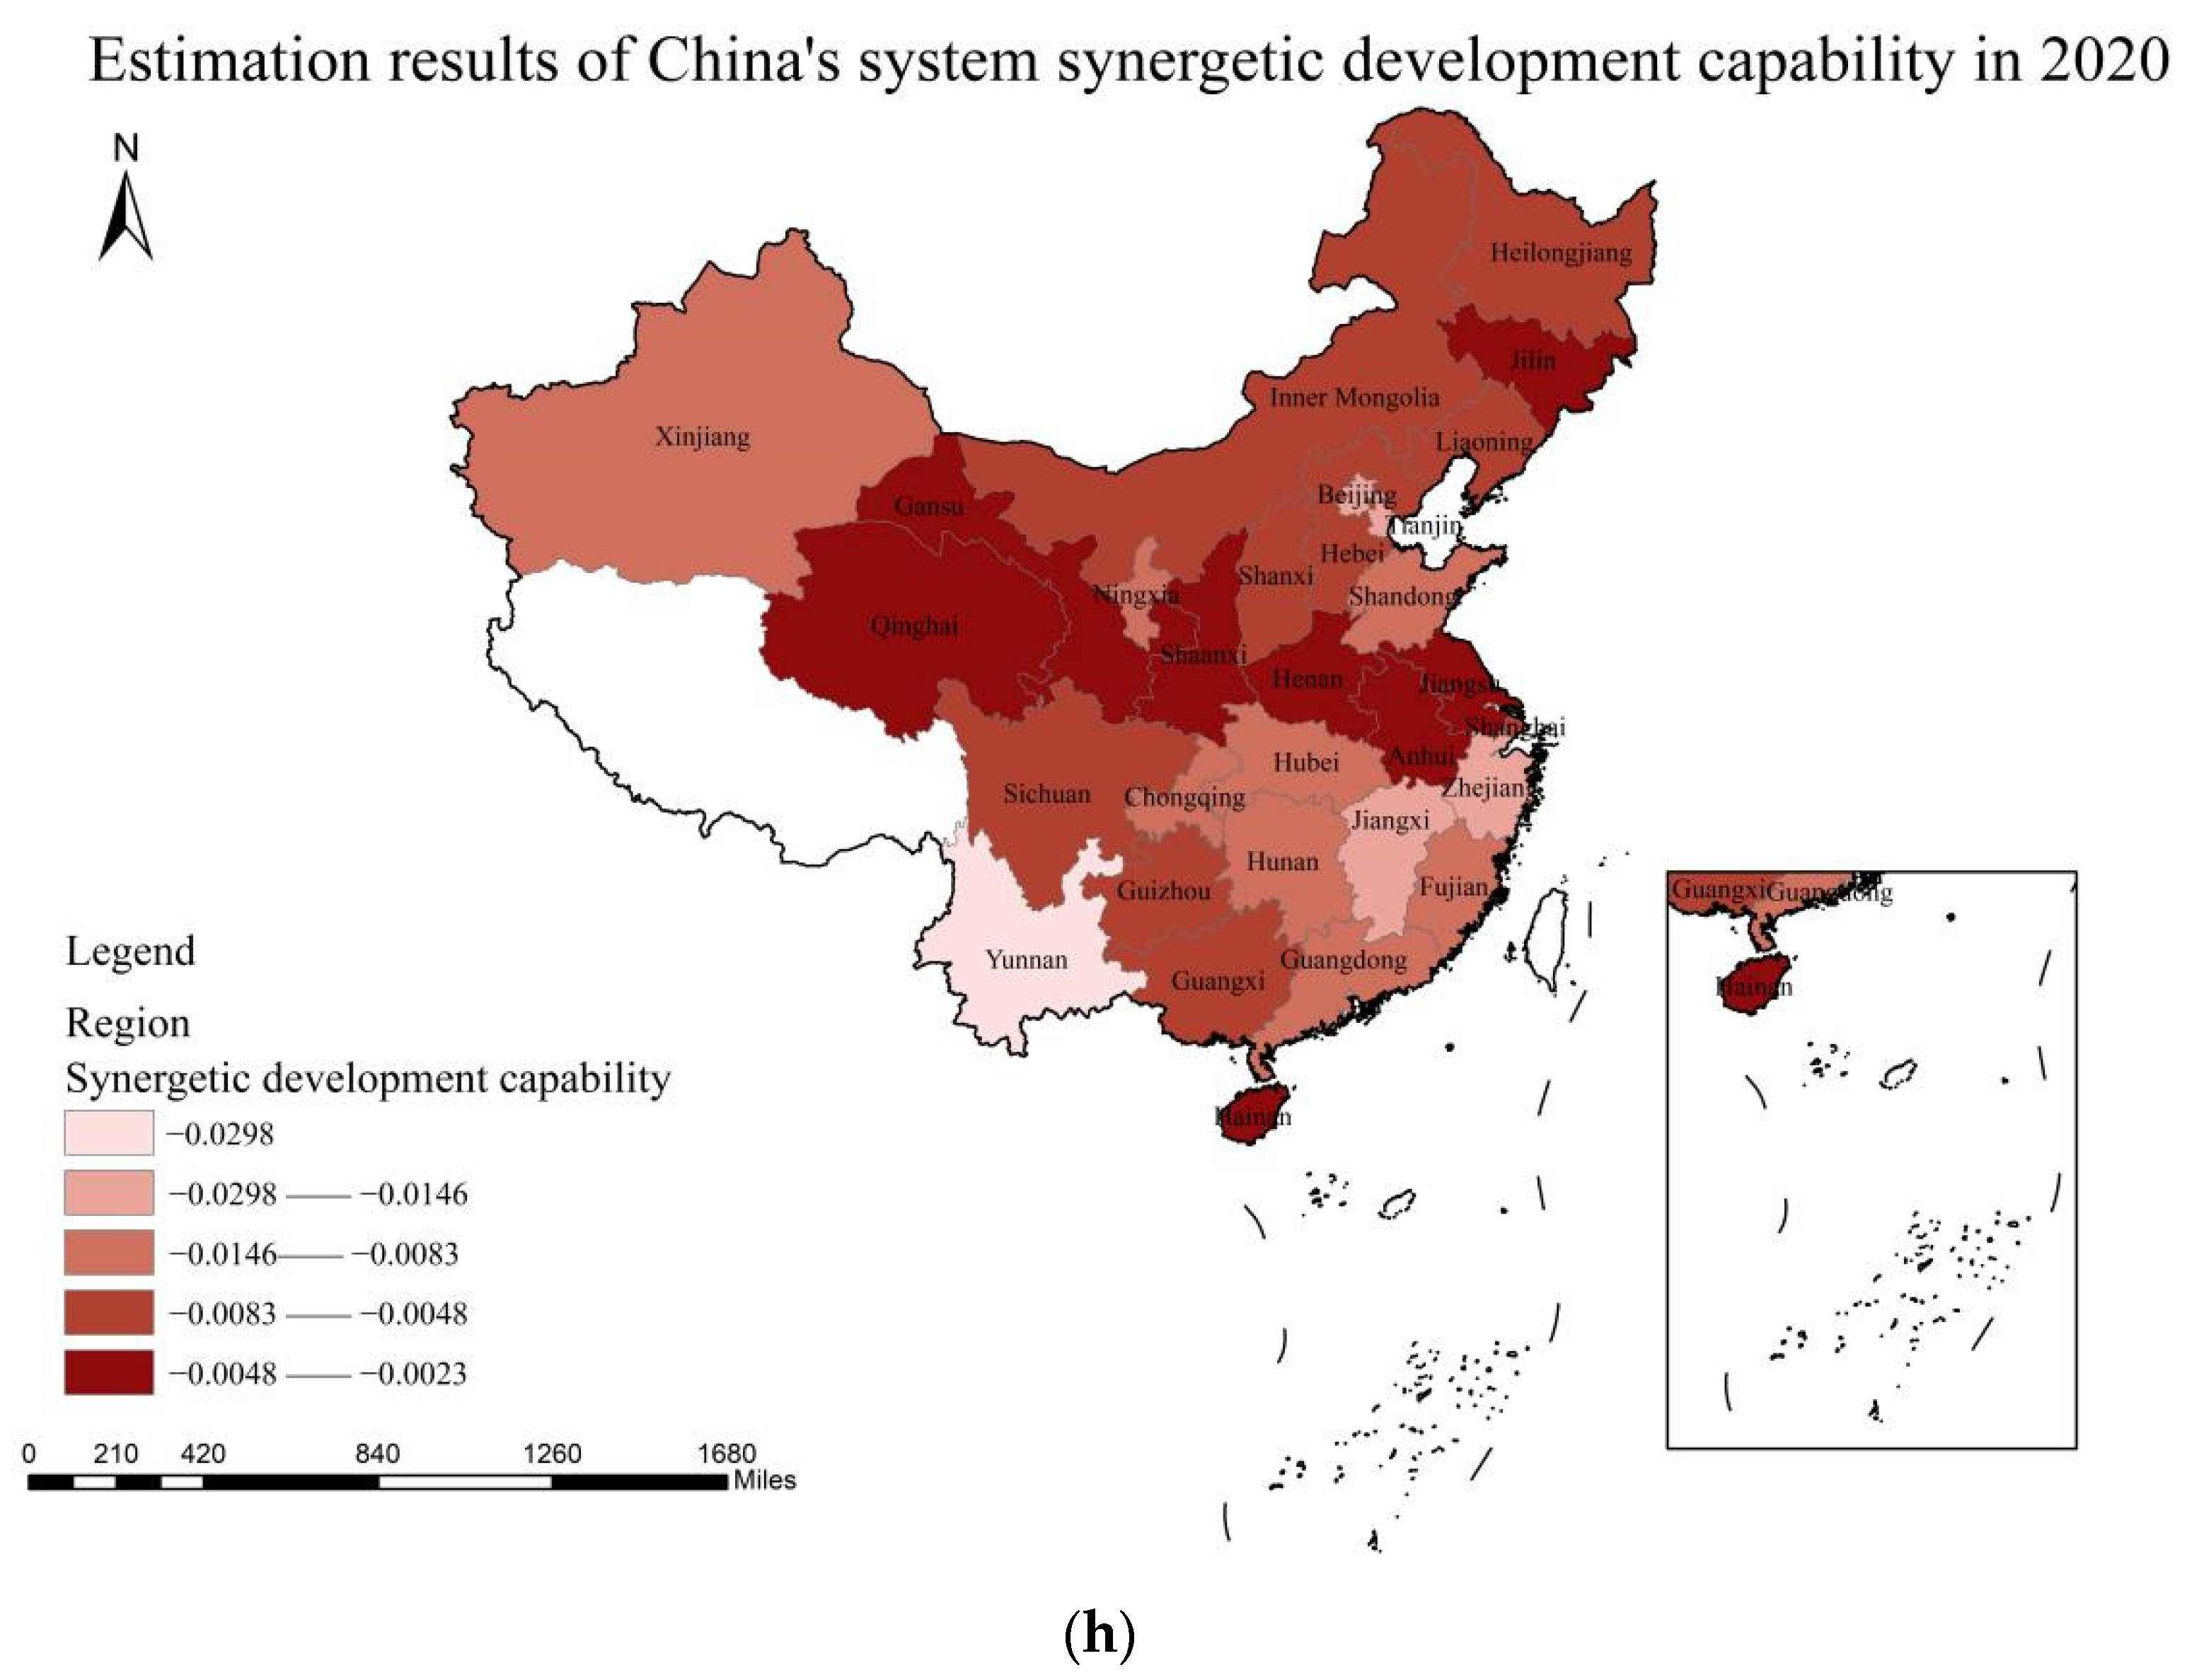
4.1. Measurement Results of Synergetic Development Capability
4.2. Analysis of Combinations of Key Factors for Synergetic Development
4.2.1. Univariate Necessity Analysis
4.2.2. Results of Configuration Analysis
4.2.3. Results of Sensitivity Analysis, Predictive Validity Analysis and Post Hoc Analysis
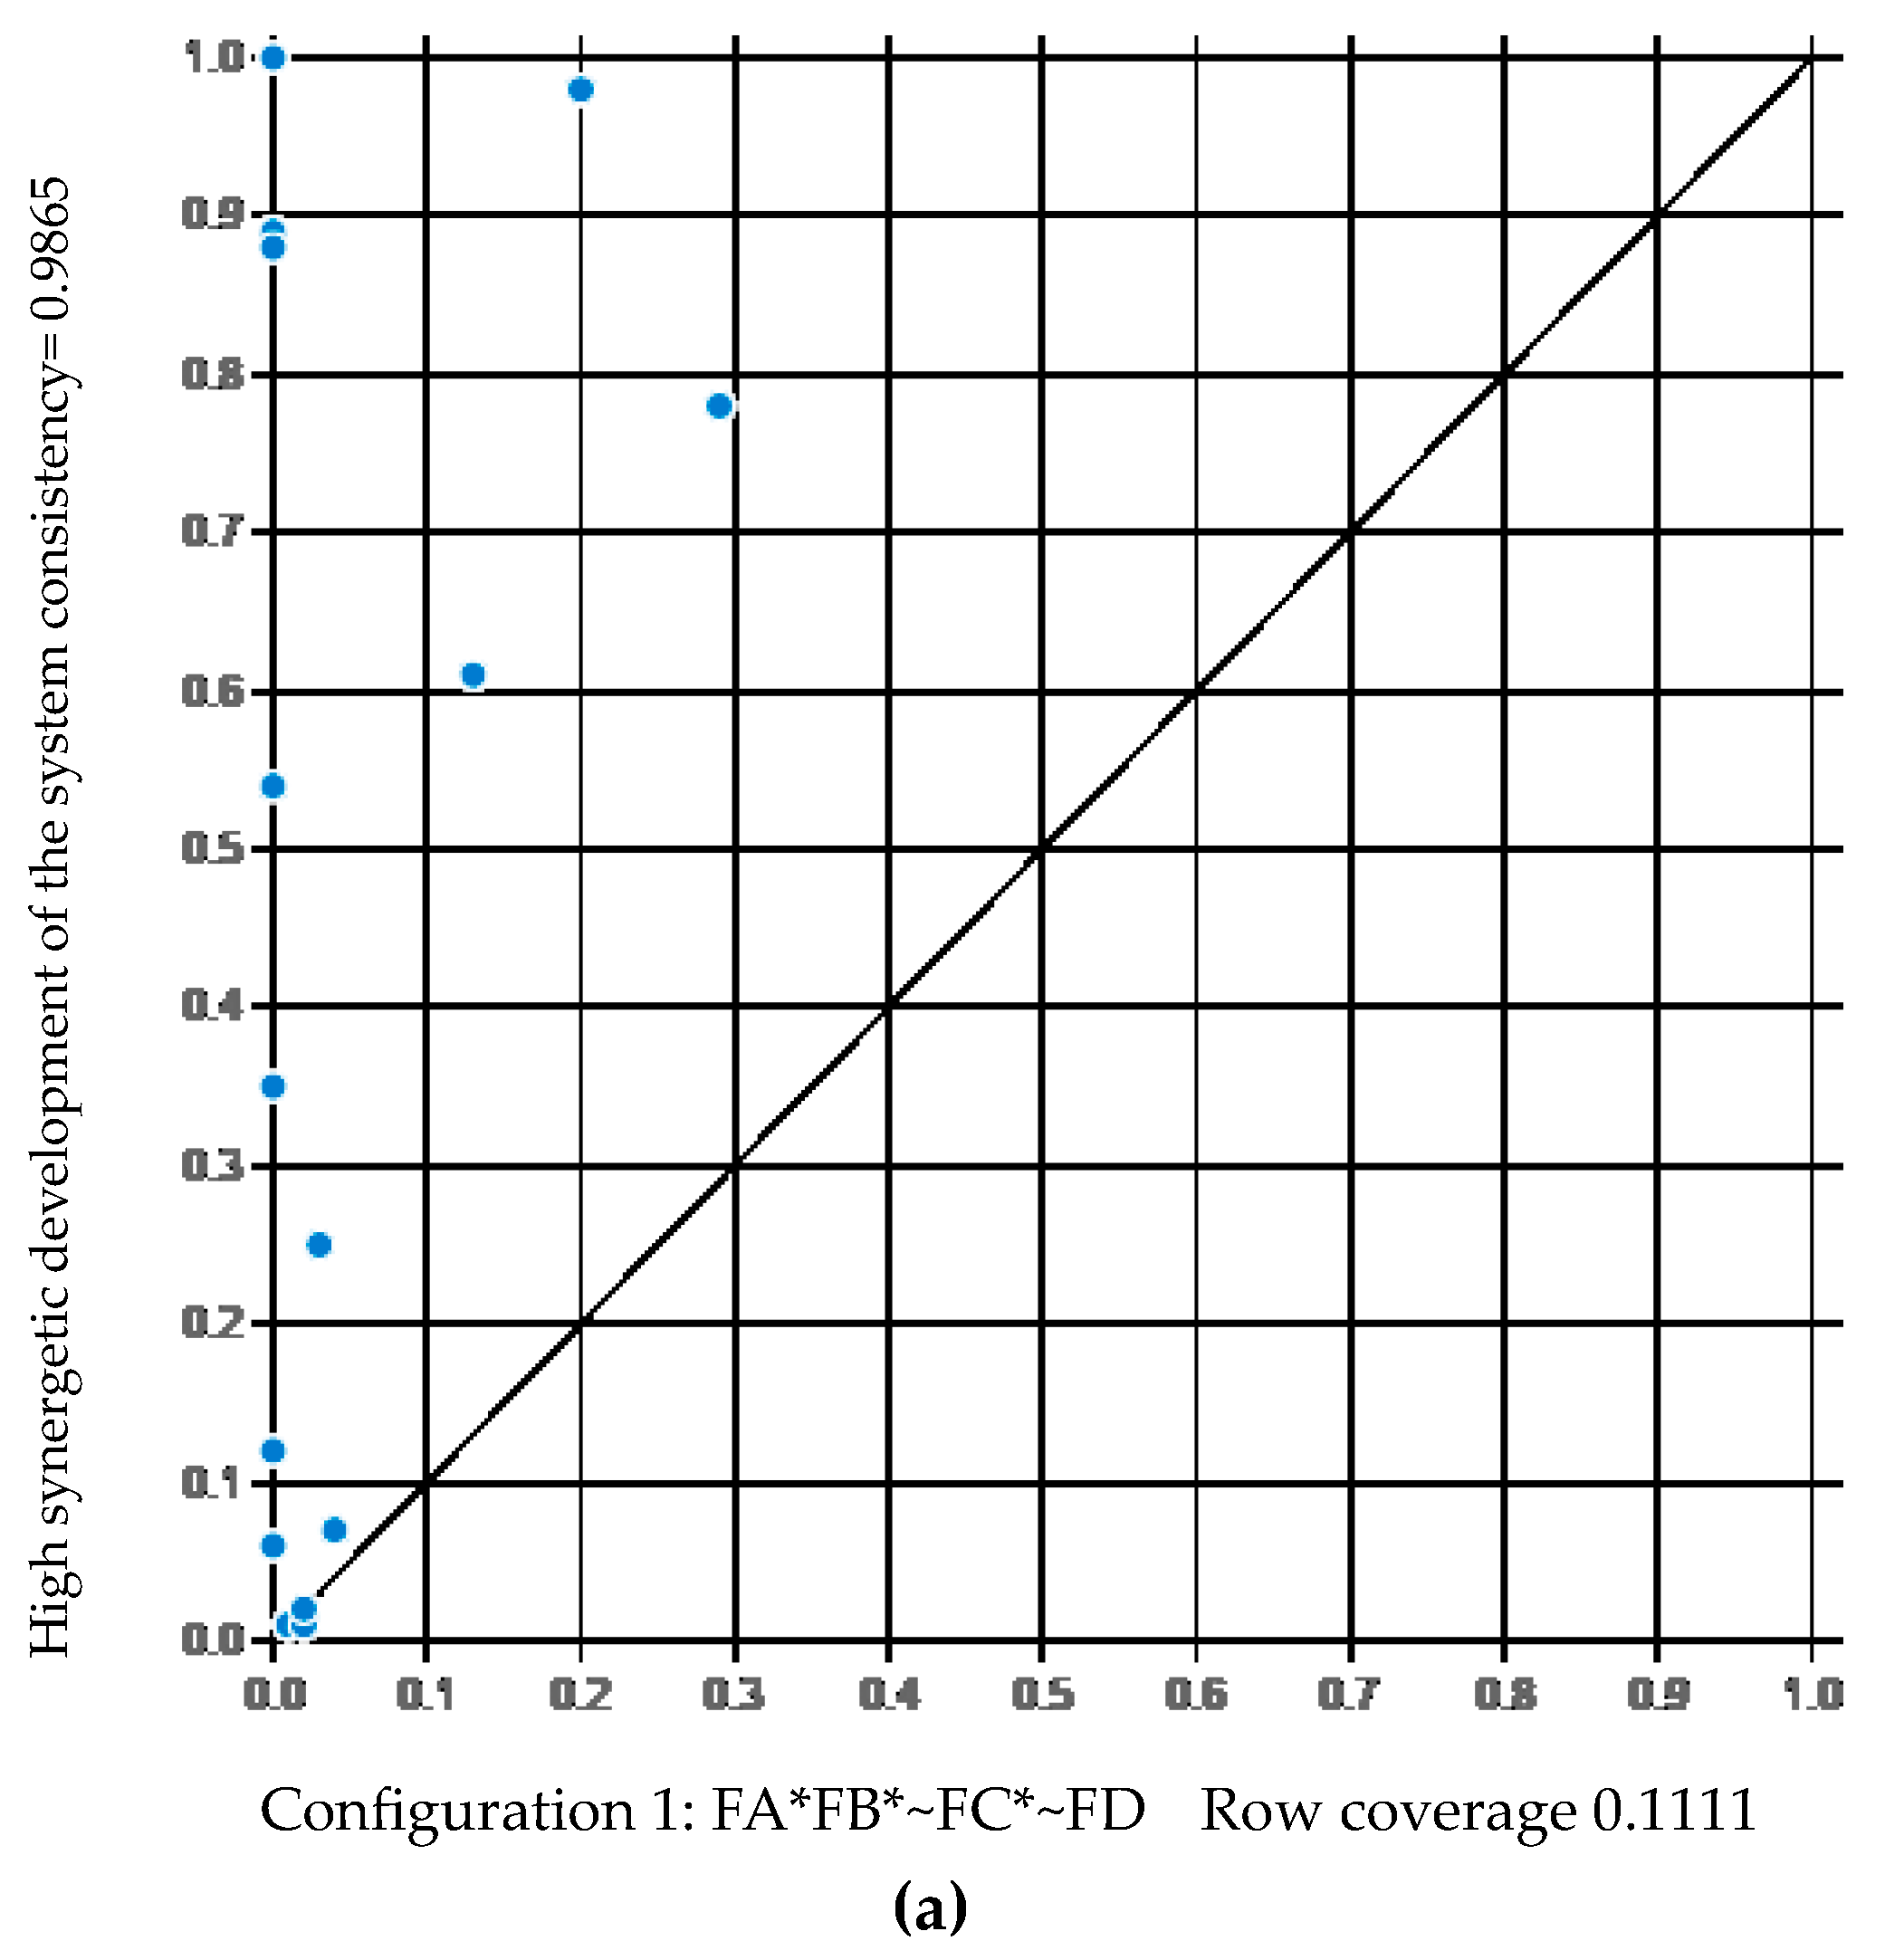
4.3. Analysis of the Paths for the System’s High Synergetic Development Capability
4.3.1. “Technology”-Led Type
4.3.2. “Technology–Organization–Environment” Synergy
4.3.3. “Organization–Environment” Balanced Synergy

| Type of Highly Synergetic Development Path | Path Map | Research Propositions |
|---|---|---|
| “Technology”-led type | 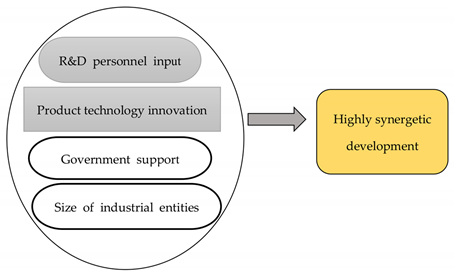 | Proposition 1 |
| “Technology–organization–environment” synergy | 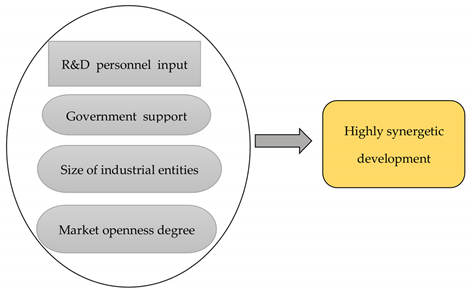 | Proposition 2 |
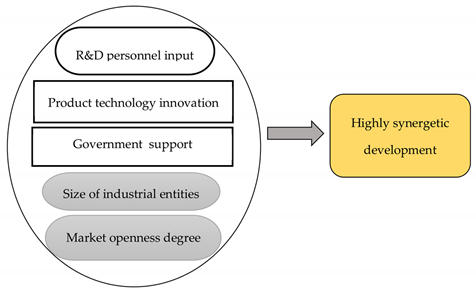 | Proposition 3 | |
| “Organization–environment” balanced synergy | 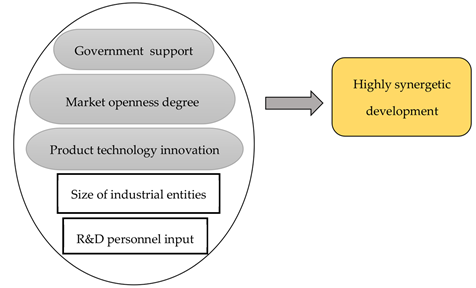 | Proposition 4 |
5. Conclusions and Implications
5.1. Conclusions
5.2. Theoretical and Practical Implications
5.3. Limitations and Prospects
Author Contributions
Funding
Institutional Review Board Statement
Informed Consent Statement
Data Availability Statement
Conflicts of Interest
References
- Yang, B.; Chen, Y.Z.; Li, H.Y. Research on driving mechanism of innovation ecosystem evolution under digital transformation. Sci. Res. Manag. 2023, 44, 62–69. [Google Scholar] [CrossRef]
- Adner, R. Match your innovation strategy to your innovation ecosystem. Harv. Bus. Rev. 2006, 84, 98–107. [Google Scholar] [PubMed]
- Li, W.; Chang, J.; Wang, M.J.; Zhu, X.Y.; Jin, A.M. Innovation 3. 0 and innovation ecosystem. Stud. Sci. Sci. 2014, 32, 1761–1770. [Google Scholar] [CrossRef]
- Adner, R. Ecosystem as structure: An actionable construct for strategy. J. Manag. 2017, 43, 39–58. [Google Scholar] [CrossRef]
- Adner, R.; Kapoor, R. Value creation in innovation ecosystems: How the structure of technological interdependence affects firm performance in new technology generations. Strateg. Manag. J. 2010, 31, 306–333. [Google Scholar] [CrossRef]
- Dedehayir, O.; Makinen, S.J.; Ortt, J.R. Roles during innovation ecosystem genesis: A literature review. Technol. Forecast. Soc. Chang. 2016, 136, 18–29. [Google Scholar] [CrossRef]
- Granstrand, O.; Holgersson, M. Innovation ecosystems: A conceptual review and a new definition. Technovation 2020, 90–91, 102098. [Google Scholar] [CrossRef]
- Gomes, L.A.D.; Facin, A.L.F.; Saleron, M.S.; Ikenami, R.K. Unpacking the innovation ecosystem construct: Evolution, gaps and trends. Technol. Forecast. Soc. Chang. 2018, 136, 30–48. [Google Scholar] [CrossRef]
- Lv, Y.B.; Han, S.J.; Su, J.Q.; Wang, S.J. Research on the construction of university—Driven open innovation ecosystem. Manag. Rev. 2017, 29, 68–82. [Google Scholar] [CrossRef]
- Han, S.J.; Su, J.Q. Research on the construction of open innovation ecosystems of digital transformation enterprises—Theoretical foundation and future prospects. Stud. Sci. Sci. 2023, 41, 335–347. [Google Scholar] [CrossRef]
- Zhang, Z.; Zeng, G. Evaluation of Regional Innovation Ecosystem Sustainable Development Ability in China. J. Ind. Technol. Econ. 2021, 40, 38–43. [Google Scholar] [CrossRef]
- Song, J. Innovation ecosystem: Impact of interactive patterns, member location and member heterogeneity on cooperative innovation performance. Innov. Manag. Policy Pract. 2016, 18, 13–29. [Google Scholar] [CrossRef]
- Prokop, V.; Hajek, P.; Stejskal, J. Configuration Paths to Efficient National Innovation Ecosystems. Technol. Forecast. Soc. Chang. 2021, 168, 120787. [Google Scholar] [CrossRef]
- Kuzior, A.; Pidorycheva, I.; Liashenko, V.; Shevtsova, H.; Shvets, N. Assessment of National Innovation Ecosystems of the EU Countries and Ukraine in the Interests of Their Sustainable Development. Sustainability 2022, 14, 8487. [Google Scholar] [CrossRef]
- Xie, X.M.; Liu, X.J.; Blanco, C. Evaluating and forecasting the niche fitness of regional innovation ecosystems: A comparative evaluation of different optimized grey models. Technol. Forecast. Soc. Chang. 2023, 191, 122473. [Google Scholar] [CrossRef]
- Rong, K.; Lin, Y.; Yu, J.; Zhang, Y.; Radziwon, A. Exploring regional innovation ecosystems: An empirical study in China. Ind. Innov. 2021, 28, 545–569. [Google Scholar] [CrossRef]
- Xie, X.M.; Liu, X.J. Niche-fitness evaluation and prediction of regional innovation ecosystem: An empirical study based on the data of chinese 30 provinces from 2009 to 2018. Stud. Sci. Sci. 2021, 39, 1706–1719. [Google Scholar] [CrossRef]
- Dhanasai, C.; Parkhe, A. Orchestrating innovation networks. Acad. Manag. Rev. 2006, 31, 659–669. [Google Scholar]
- Fransman, M. Innovation in the new ICT ecosystem. Commun. Strateg. 2008, 68, 89–109. [Google Scholar]
- Ritala, P.; Armila, L.; Blomqvist, K. Innovation orchestration capability—Defining the organizational and individual level determinants. Int. J. Innov. Manag. 2009, 13, 569–591. [Google Scholar] [CrossRef]
- Dougherty, D.; Danielle, D.D. Organizing ecologies of complex innovation. Organ. Sci. 2011, 22, 1214–1223. [Google Scholar] [CrossRef]
- Yang, S.X.; Yang, J.M.; Wei, J. Enterprise innovation ecosystem resource complementary uncertainty and strategy. Stud. Sci. Sci. 2022, 40, 2272–2280. [Google Scholar] [CrossRef]
- Jiang, S.M.; Hu, Y.M.; Wang, Z.Y. Core Firm Based View on the Mechanism of Constructing an Enterprise Innovation Ecosystem: A Case Study of Haier Group. Sustainability 2019, 11, 3108. [Google Scholar] [CrossRef]
- Feng, L.J.; Lu, J.R.; Wang, J.F. A Systematic Review of Enterprise Innovation Ecosystems. Sustainability 2021, 13, 5742. [Google Scholar] [CrossRef]
- Gonzalo, L. Analysis of University-Driven Open Innovation Ecosystems: The UPM Case Study. RD Manag. 2012, 12, 321–336. [Google Scholar]
- Salmelin, B. The Horizon 2020 Framework and Open Innovation Ecosystems. J. Innov. Manag. 2013, 1, 4–9. [Google Scholar] [CrossRef]
- Radziwon, A.; Bogers, M. Open innovation in SMEs: Exploring inter-organizational relationships in an ecosystem. Technol. Forecast. Soc. Chang. 2019, 146, 573–587. [Google Scholar] [CrossRef]
- Xie, X.M.; Wang, H.W. How can open innovation ecosystem modes push product innovation forward? An fsQCA analysis. J. Bus. Res. 2020, 108, 29–41. [Google Scholar] [CrossRef]
- Helfat, C.E.; Raubitschek, R.S. Dynamic and integrative capabilities for profiting from innovation in digital platform-based ecosystems. Res. Policy 2018, 47, 1391–1399. [Google Scholar] [CrossRef]
- Chae, B.K. A General Framework for Studying the Evolution of the Digital Innovation Ecosystem: The Case of Big Data. Int. J. Inf. Manag. 2019, 45, 83–94. [Google Scholar] [CrossRef]
- Sun, Y.L.; Zhu, R.J.; Song, J. Research on the evolution and governance of digital innovation ecosystem. Stud. Sci. Sci. 2023, 41, 325–334. [Google Scholar] [CrossRef]
- Beltagui, A.; Rosli, A.; Candi, M. Exaptation in a digital innovation ecosystem: The disruptive impacts of 3D printing. Res. Policy 2020, 49, 103833. [Google Scholar] [CrossRef]
- Tan, J.S.; Song, J.; Chen, X.H. The formation and evolution of industrial innovation ecosystem: ‘Architect’ transition and the evolution of its strategic behavior. Manag. World 2021, 37, 167–191. [Google Scholar] [CrossRef]
- Chen, Z.T.; MENG, F.R.; Wang, H. The research on the impact of government support on innovation efficiency of high—Technological industries. Stud. Sci. Sci. 2020, 38, 1782–1790. [Google Scholar] [CrossRef]
- Moore, J.F. Predators and prey: A new ecology of competition. Harv. Bus. Rev. 1993, 71, 75–86. [Google Scholar]
- Zhang, Y.S. Research on coupling strategy of high-tech industry innovation ecosystem. China Soft Sci. 2009, 134–143. Available online: https://kns.cnki.net/kcms2/article/abstract?v=3uoqIhG8C44YLTlOAiTRKgchrJ08w1e75TZJapvoLK0VK-OLdUdeWmFYaBnvIVCtzvah0j4thj-JtF9wQ3X2csmT1Amjq0ZR&uniplatform=NZKPT (accessed on 25 June 2023).
- Zhang, L.F. The asymmetric coupling mechanisms of technology populations of innovation ecosyste. Stud. Sci. Sci. 2015, 33, 1100–1108. [Google Scholar] [CrossRef]
- Yang, J.Z.; Li, X.D. The operating mechanism of high-tech industry innovation ecosystem. Acad. Exch. 2016, 134–139. Available online: https://kns.cnki.net/kcms2/article/abstract?v=3uoqIhG8C44YLTlOAiTRKibYlV5Vjs7ijP0rjQD-AVm8oHBO0FTadi5F82aJUuWMt6P9nb79oyNv9hZxBoNwn_uPoTFq335I&uniplatform=NZKPT (accessed on 25 June 2023).
- Shan, W.; Chen, R.C. The characteristics, structure and operational mechanism of high-tech enterprise innovation ecosystem. In Proceedings of the 22nd International Conference on Management Science and Engineering, UAE, Dubai, United Emirates, 6–9 December 2015; pp. 1496–1504. [Google Scholar]
- Yan, J.D.; Yu, X.; Liu, P.C.; Zhang, Q. High-tech service platform ecosystem evolution: A simulation analysis using Lotka-Volterra model. Tech. Gaz. 2020, 27, 1509–1518. [Google Scholar] [CrossRef]
- He, X.W.; Zhou, W.Y. A classified evaluation of innovation ecosystem cooperativity of regional hi-tech industries. Stud. Sci. Sci. 2018, 36, 541–549. [Google Scholar] [CrossRef]
- Song, H.; Chen, S.J. How to build a healthy innovation ecosystem in high-tech industry: Based on the view of core competence. Manag. Rev. 2021, 33, 76–84. [Google Scholar] [CrossRef]
- Fan, D.C.; Gu, X.M. Health evaluation and key influencing factors of technological innovation ecosystem in high-tech industry: An empirical study based on improved entropy-Dematel-ISM combination method. Oper. Res. Manag. 2021, 30, 167–174. [Google Scholar] [CrossRef]
- Zou, H.; Qin, H.; He, D.Y.; Sun, J. Research on an enterprise green innovation ecosystem from the vulnerability perspective: Evolutionary game and simulation. IEEE Access 2021, 9, 140809–140823. [Google Scholar] [CrossRef]
- Lei, Y.Y.; Chen, G.J.; Liu, Q.L. Innovation niche suitability and evolution of high-tech industry innovation ecosystem. Syst. Eng. 2018, 36, 103–111. [Google Scholar]
- Wu, F.F.; Tong, Y.M.; Huang, L.C. Organic evaluation of innovation ecosystem of China’s high-tech industry-from the perspective of innovation quadruple helix. Sci. Technol. Prog. Countermeas. 2020, 37, 67–76. [Google Scholar] [CrossRef]
- Liu, L.J.; Xiang, L.L.; Xia, Q. Research on innovation ecosystem evaluation of high-tech industry based on innovation policy. Sci. Res. Manag. 2020, 41, 1–9. [Google Scholar] [CrossRef]
- Yang, J.Z. An Empirical study evaluating the symbiotic efficiency of China’s provinces and the innovation ecosystem in the high-tech industry. Complexity 2022, 2022, 1391415. [Google Scholar] [CrossRef]
- Liu, Z.Y.; Chen, X.F.; Chu, J.F.; Zhu, Q.Y. Industrial development environment and innovation efficiency of high-tech industry: Analysis based on the framework of innovation systems. Technol. Anal. Strateg. Manag. 2018, 30, 434–446. [Google Scholar] [CrossRef]
- Huang, L.C. The characteristics of regional technology innovation ecosystem. China Sci. Technol. 2003, 1, 23–26. [Google Scholar] [CrossRef]
- Hemmert, M.; Bstieler, L.; Okamuro, H. Bridging the cultural divide: Trust formation in university-industry research collaborations in the US, Japan, and South Korea. Technovation 2014, 34, 605–616. [Google Scholar] [CrossRef]
- Wang, G.H.; Jia, N.; Xing, R. Study on the coupling of innovation incubation network and collaborative innovation network of clusters. Sci. Sci. Manag. S. T. 2013, 34, 73–82. [Google Scholar]
- Czarnitzki, D.; Licht, G. Additionality of public R&D grants in a transition economy: The case of eastern Germany. Econ. Transit. 2006, 14, 101–131. [Google Scholar] [CrossRef]
- Mention, A.L.; Barlatier, P.J.; Josserand, E. Using social media to leverage and develop dynamic capabilities for innovation. Technol. Forecast. Soc. Chang. 2019, 114, 242–250. [Google Scholar] [CrossRef]
- Tan, H.B.; Fan, Z.T.; Du, Y.Z. Technical management capacity, attention allocation and local government website construction—A configuration analysis based on TOE framework. Manag. World 2019, 35, 81–94. [Google Scholar] [CrossRef]
- Chau, K.; Tam, Y. Factors affecting the adoption of open systems: An exploratory study. MIS Q. 1997, 21, 1–24. [Google Scholar] [CrossRef]
- Walker, R.M. Internal and external antecedents of process innovation: A review and extension. Public Manag. Rev. 2014, 16, 21–44. [Google Scholar] [CrossRef]
- Oliveir, T.; Martins, M.F. Literature review of information technology adoption models at Firm Level. Electron. J. Inf. Syst. Eval. 2011, 14, 312–323. [Google Scholar]
- Wang, X.Y.; Li, X.Q. Digitization policy combination analysis based on technology—Organization—Environment framework. Stud. Sci. Sci. 2022, 40, 841–851. [Google Scholar] [CrossRef]
- Qiao, H.; Li, Z.L.; Huang, C.H. Influencing factors and accelerating paths of data element marketization: Analysis of configuration effect from the perspective of complex economic system management. Foreign Econ. Manag. 2023, 45, 38–54. [Google Scholar] [CrossRef]
- Li, Y.; Wang, Y.T.; Wang, L.; Xie, J.C. Investigating the effects of stakeholder collaboration strategies on risk prevention performance in a digital innovation ecosystem. Ind. Manag. Data Syst. 2022, 122, 2045–2071. [Google Scholar] [CrossRef]
- Russell, M.G.; Still, K.; Huhtamaki, J.; Rubens, N. Transforming innovation ecosystems through shared vision and network orchestration. In Proceedings of the Triple Helix IX International Conference, Stanford, CA, USA, 11–14 July 2011. [Google Scholar]
- Yang, R. The definition, characteristics and its construction of innovation ecosystem. Sci. Technol. Innovation 2014, 34, 12–17. [Google Scholar] [CrossRef]
- Jacobides, M.G.; Cennamo, C.; Gawer, A. Towards a theory of ecosystems. Strateg. Manag. J. 2018, 39, 2255–2276. [Google Scholar] [CrossRef]
- Xu, G.N.; Wu, Y.C.; Minshall, T.; Zhou, Y. Exploring innovation ecosystems across science, technology, and business: A case of 3D printing in China. Technol. Forecast. Soc. Chang. 2018, 136, 208–221. [Google Scholar] [CrossRef]
- Wang, S.Y.; Hu, Y.; Xiong, X.; Wang, S.M.; Zhang, W. Complex system management: Theory and methods. J. Manag. Sci. China 2021, 24, 1–9. [Google Scholar] [CrossRef]
- Lu, X.Y.; Wang, K.T.; Hu, J.S.; Chen, Y. A Fuzzy-DEMATEL-based analysis of the factors that influence users’ participation behaviors under the crowdsourcing model. Manag. Rev. 2017, 29, 101–109. [Google Scholar] [CrossRef]
- Sheng, Z.H.; Yu, J.Y. Complex systems management: An emerging management science with Chinese characteristics. Manag. World 2021, 37, 36–50+2. [Google Scholar] [CrossRef]
- Ye, X.; Wu, F.; Lian, S.N. Financial development, local government behavior and regional innovation. Reform Econ. Syst. 2019, 129–134. Available online: https://kns.cnki.net/kcms2/article/abstract?v=3uoqIhG8C44YLTlOAiTRKibYlV5Vjs7iLik5jEcCI09uHa3oBxtWoCxYGouNFUdRig5ZzgPJfaq3Ir2Gqq64-iS2NiebAqxZ&uniplatform=NZKPT (accessed on 25 June 2023).
- Sheng, Z.H.; Liang, R. Research on core decision paradigm of major engineering based on complex systems management: A case study of two typical long-span bridges in China. Manag. World 2022, 38, 200–212. [Google Scholar] [CrossRef]
- Zhang, Y.L.; Zhang, G.Y.; Ma, W.C.; Huang, S.F. What kind of new R&D institutions have innovation performance?—Configuration analysis based on TOE framework. Stud. Sci. Sci. 2022, 40, 758–768. [Google Scholar] [CrossRef]
- Zhou, Q.; Chen, C.Y. The empirical study of China regional technical innovation ecosystem suitability. Stud. Sci. Sci. 2008, 26, 242–246. [Google Scholar] [CrossRef]
- Liu, H.J.; Hu, Y.R.; Ma, W.M. Ecological system suitability of regional innovation and correlation of economic development. Chin. J. Manag. Sci. 2013, 21, 764–770. [Google Scholar] [CrossRef]
- Li, X.D.; Zhang, X.Y.; Yin, S. Observation on the development of regional innovation ecosystem in China from the perspective of symbiosis—Research on spatial and temporal features based on TOPSIS niche evaluation projection model. Oper. Res. Manag. Sci. 2020, 29, 198–209. [Google Scholar] [CrossRef]
- Liao, K.C.; Zhang, Y.C.; Du, Q.H. Research on the decomposition and formation mechanism of regional differences in the dynamic operating efficiency of China’s regional innovation ecosystem. Sci. Sci. Manag. S. T. 2022, 43, 94–116. [Google Scholar]
- Jia, J.; Zhang, Z.; Zhang, W. The synergetic development of technological innovation system in high-tech industries—Taking Chinese manufacture of aircrafts and spacecrafts as an example. Sci. Res. Manag. 2013, 34, 9–15+59. [Google Scholar] [CrossRef]
- Meng, Q.S.; Han, W.X. Study on Coordination Degree Model of Composite System. J. Tianjin Univ. 2000, 444–446. Available online: https://kns.cnki.net/kcms2/article/abstract?v=3uoqIhG8C44YLTlOAiTRKgchrJ08w1e79zTD32bjb4yBfjCCHpuAZgY80grg7XUF93lo15xMZ_OsXXQk3lf9gwfAN4xwv26c&uniplatform=NZKPT (accessed on 25 June 2023).
- Ragin, C.C. Redesigning Social Inquiry: Fuzzy Sets and Beyond; University of Chicago Press: Chicago, IL, USA, 2008. [Google Scholar]
- Fiss, P.C. Building better causal theories: A fuzzy set approach to typologies in organization research. Acad. Manag. J. 2011, 54, 393–420. [Google Scholar] [CrossRef]
- Huang, Y.J.; Li, K.X.; Li, P. Innovation ecosystems and national talent competitiveness: A country-based comparison using fsQCA. Technol. Forecast. Soc. Chang. 2023, 194, 122733. [Google Scholar] [CrossRef]
- Cheng, Q.W.; Zhao, Y.X. Research on the configuration path of knowledge fusion in the innovation ecosystem. Sci. Res. Manag. 2023, 44, 41–49. [Google Scholar]
- Li, X.D.; Rao, M.X. Research on the development path of the regional digital innovation ecosystem: Configuration analysis based on fsQCA. J. Ind. Eng. Eng. Manag. 2023, 37, 20–31. [Google Scholar] [CrossRef]
- Zhang, M.; Chen, W.H.; Lan, H.L. Why do Chinese enterprises completely acquire foreign high-tech enterprises-A fuzzy set qualitative comparative analysis(fsQCA) based on 94 cases. China Ind. Econ. 2019, 37, 117–135. [Google Scholar] [CrossRef]
- Du, Y.Z.; Jia, L.D. Configuration perspective and qualitative comparative analysis (QCA): A new approach to management research. Manag. World 2017, 157–167. [Google Scholar] [CrossRef]
- Du, Y.Z.; Li, J.X.; Liu, Q.C.; Zhao, S.T.; Chen, K.W. Configurational theory and QCA method from a complex dynamic perspective: Research progress and future directions. Manag. World 2021, 37, 180–197+12–13. [Google Scholar] [CrossRef]
- Liu, W. Technological innovation efficiency of high-tech industries considering environmental factor in China-Comparison of two periods from 2000–2007 and from 2008–2014. Sci. Res. Manag. 2016, 37, 18–25. [Google Scholar] [CrossRef]
- Xiao, J.; Zeng, P.; Ren, G. How to improve the green transformation performance of manufacturing industry?—TOE framework-based configuration study. Stud. Sci. Sci. 2022, 40, 2162–2172. [Google Scholar] [CrossRef]
- Gu, A.W.; Jiang, H.H.; Lu, X.F.; Chen, S.S. Configuration effect of user participation in product innovation in digital context: An fsQCA analysis based on TOE framework. Sci. Technol. Prog. Policy 2022, 39, 72–81. [Google Scholar] [CrossRef]
- Olya, H.G.; Altinay, L. Asymmetric modeling of intention to purchase tourism weather insurance and loyalty. J. Bus. Res. 2016, 69, 2791–2800. [Google Scholar] [CrossRef]
- Woodside, A.G. Embrace· perform· model: Complexity theory, contrarian case analysis, and multiple realities. J. Bus. Res. 2014, 67, 2495–2503. [Google Scholar] [CrossRef]
- Pappas, I.O.; Kourouthanassis, P.E.; Giannakos, M.N.; Chrissikopoulos, V. Explaining online shopping behavior with fsQCA: The role of cognitive and affective perceptions. J. Bus. Res. 2016, 69, 794–803. [Google Scholar] [CrossRef]
- Fiss, P.C.; Sharapov, D.; Cronqvist, L. Opposites Attract? Opportunities and Challenges for Integrating Large-N QCA and Econometric Analysis. Political Res. Q. 2013, 66, 191–198. [Google Scholar]
- Xiao, Z.H.; Fan, J.D. Research on the impact of scientific and technological human resources input on regional innovation performance. Stud. Sci. Sci. 2019, 37, 1944–1954. [Google Scholar] [CrossRef]
- Fan, D.C.; Gu, X.M. Research on multiple modes for improving technological innovation efficiency of high-tech industry-Based on the perspective of innovation environment. Sci. Technol. Prog. Policy 2020, 37, 52–59. [Google Scholar] [CrossRef]
- Zhang, M.L.; Li, B.Z.; Yin, S. Configurational paths to regional innovation performance: The interplay of innovation elements based on a fuzzy-set qualitative comparative analysis approach. Technol. Anal. Strateg. Manag. 2020, 32, 1422–1435. [Google Scholar] [CrossRef]

| The System Structure | The Dominant Factor | Order Parameter/Measure Factor/Niche Index | Symbol | Unit |
|---|---|---|---|---|
| Enterprise operation subsystem | Enterprise operation capability | Number of enterprises with R&D activities | X11 | Piece |
| Revenue from new product sales | X12 | CNY ten thousand | ||
| Market liquidity | Amount of technology contract inflow | X13 | CNY one hundred million | |
| Amount of technology contract outflow | X14 | CNY one hundred million | ||
| Research and development subsystem | R&D innovation ability | Number of R&D Institutions | X21 | Piece |
| R&D personnel equivalent to full-time | X22 | One year | ||
| Number of green invention patent applications | X23 | Piece | ||
| R&D investment | R&D investment intensity | X24 | % | |
| Expenditure for technological improvement and upgrading | X25 | CNY ten thousand | ||
| Mediation service subsystem | Innovative talents support | Number of incubated business mentors | X31 | People |
| Platform financial support | Total investment in public technology platform of science and technology business incubator | X32 | CNY one thousand | |
| Accumulated venture capital investment of incubated enterprises | X33 | CNY one thousand | ||
| Government-driven subsystem | R&D financial input | R&D is funded by the government | X41 | CNY ten thousand |
| Science and technology funds of higher education and government funds | X42 | CNY ten thousand | ||
| Financial input for platform innovation | Financial support for productivity promotion center | X43 | CNY one thousand | |
| Social participation subsystem | Public offline participation | The number of visitors to science museums that year | X51 | Thousands of people |
| Number of participants in popular science activities | X52 | Thousands of people | ||
| Public online participation | High-tech Baidu search index overall daily average | X53 | — |
| Results and Conditions | Goal Set | The Calibration | ||
|---|---|---|---|---|
| Full Membership | The Crossover Point | Full Non-Membership | ||
| System synergetic development capability | High synergetic development capability | |||
| R&D personnel input | Sufficient R&D personnel investment | |||
| Product technology innovation | Rich product technology innovation | |||
| Government support | Strong government support | |||
| Size of industrial entities | Good industrial entity scale | |||
| Market openness degree | High market openness | |||
| Provinces | Year | |||||||
|---|---|---|---|---|---|---|---|---|
| 2013 | 2014 | 2015 | 2016 | 2017 | 2018 | 2019 | 2020 | |
| Beijing | ||||||||
| Tianjin | ||||||||
| Hebei | ||||||||
| Shanxi | ||||||||
| Inner Mongolia | ||||||||
| Liaoning | ||||||||
| Jilin | ||||||||
| Heilongjiang | ||||||||
| Shanghai | ||||||||
| Jiangsu | ||||||||
| Zhejiang | ||||||||
| Anhui | ||||||||
| Fujian | ||||||||
| Jiangxi | ||||||||
| Shandong | ||||||||
| Henan | ||||||||
| Hubei | ||||||||
| Hunan | ||||||||
| Guangdong | ||||||||
| Guangxi | ||||||||
| Hainan | ||||||||
| Chongqing | ||||||||
| Sichuan | ||||||||
| Guizhou | ||||||||
| Yunnan | ||||||||
| Shaanxi | ||||||||
| Gansu | ||||||||
| Qinghai | ||||||||
| Ningxia | ||||||||
| Xinjiang | ||||||||
| Condition Variable | High Synergetic Development Capability | Non-High Synergetic Development Capability | ||
|---|---|---|---|---|
| Consistency | Coverage | Consistency | Coverage | |
| R&D personnel input (R&D PI) | ||||
| ~R&D personnel input (~R&D PI) | ||||
| Product technology innovation (PTI) | ||||
| ~Product technology innovation (~PTI) | ||||
| Government support (GS) | ||||
| ~Government support (~GS) | ||||
| Size of industrial entities (SIE) | ||||
| ~Size of industrial entities (~SIE) | ||||
| Market openness degree (MOD) | ||||
| ~Market openness degree (~MOD) | ||||
| Conditional Variable | High Synergetic Development Configuration | |||
|---|---|---|---|---|
| Configuration 1 | Configuration 2 | Configuration 3 | Configuration 4 | |
| R&D personnel input (R&D PI) | ⬤ | ⬤ | ⊗ | ⊗ |
| Product technology innovation (PTI) | ⬤ | ⊗ | ⬤ | |
| Government support (GS) | ⊗ | ⬤ | ⊗ | ⬤ |
| Size of industrial entities (SIE) | ⊗ | ⬤ | ⬤ | ⊗ |
| Market openness degree (MOD) | ⬤ | ⬤ | ⬤ | |
| Consistency | ||||
| Raw coverage | ||||
| Unique coverage | ||||
| Cover typical cases | Henan, Shandong | Beijing, Anhui, Hunan | Hebei | Guangxi, Xinjiang |
| Overall solution consistency | ||||
| Overall solution coverage | ||||
| Independent Variable | Coefficient | Std. Error | z-Statistic | Prob. |
|---|---|---|---|---|
| Dependent variable: ~Z | ||||
| Configuration 1 | ||||
| Configuration 2 | ||||
| Configuration 3 | ||||
| Configuration 4 |
Disclaimer/Publisher’s Note: The statements, opinions and data contained in all publications are solely those of the individual author(s) and contributor(s) and not of MDPI and/or the editor(s). MDPI and/or the editor(s) disclaim responsibility for any injury to people or property resulting from any ideas, methods, instructions or products referred to in the content. |
© 2023 by the authors. Licensee MDPI, Basel, Switzerland. This article is an open access article distributed under the terms and conditions of the Creative Commons Attribution (CC BY) license (https://creativecommons.org/licenses/by/4.0/).
Share and Cite
Li, M.; Chen, H.; Li, J.; Liu, X. How to Improve the Synergetic Development Capabilities of the Innovation Ecosystems of High-Tech Industries in China: An fsQCA Analysis Based on the TOE Framework. Sustainability 2023, 15, 12579. https://doi.org/10.3390/su151612579
Li M, Chen H, Li J, Liu X. How to Improve the Synergetic Development Capabilities of the Innovation Ecosystems of High-Tech Industries in China: An fsQCA Analysis Based on the TOE Framework. Sustainability. 2023; 15(16):12579. https://doi.org/10.3390/su151612579
Chicago/Turabian StyleLi, Mingqiu, Heng Chen, Jinqiu Li, and Xiaolei Liu. 2023. "How to Improve the Synergetic Development Capabilities of the Innovation Ecosystems of High-Tech Industries in China: An fsQCA Analysis Based on the TOE Framework" Sustainability 15, no. 16: 12579. https://doi.org/10.3390/su151612579
APA StyleLi, M., Chen, H., Li, J., & Liu, X. (2023). How to Improve the Synergetic Development Capabilities of the Innovation Ecosystems of High-Tech Industries in China: An fsQCA Analysis Based on the TOE Framework. Sustainability, 15(16), 12579. https://doi.org/10.3390/su151612579