Article

Exploring the Relationship between Touristification and Commercial Gentrification from the Perspective of Tourist Flow Networks: A Case Study of Yuzhong District, Chongqing

1
School of Public Policy and Administration, Chongqing University, Chongqing 400044, China
2
School of Architecture, Chang’an University, Xi’an 710064, China
3
China Southwest Architectural Design and Research Institute, Chengdu 610041, China
4
School of Architecture and Urban Planning, Chongqing University, Chongqing 400044, China
5
College of Environment and Ecology, Chongqing University, Chongqing 400044, China
*
Author to whom correspondence should be addressed.
These authors contributed equally to this work.
Sustainability 2023, 15(16), 12577; https://doi.org/10.3390/su151612577
Submission received: 20 July 2023 / Revised: 11 August 2023 / Accepted: 14 August 2023 / Published: 18 August 2023
(This article belongs to the Section Tourism, Culture, and Heritage)

Abstract

:
Existing research has noted a clear interaction between touristification and commercial gentrification; however, the differences between these two coexisting but distinct phenomena require further research. This study uses online big data and quantitative methods to explore the relationship between touristification and commercial gentrification. Taking Yuzhong District in Chongqing as an example, this study constructs an inter-attraction network based on 1306 itineraries extracted from online travel diaries, develops a method to evaluate community tourism centrality based on network analysis, and examines the correlation between community tourism centrality, touristification, and commercial gentrification. The results suggest that attractions with historical value, unique local landscapes, and mixed functions show greater tourism centrality in the tourist flow network. Attractions with similar themes are more likely to be included in one travel route, and the influence of distance is insignificant at the district level. Communities with higher tourism centrality are clustered in old city areas with a rich historic heritage and have experienced profound commercialisation. Although similar, touristification is primarily a bottom-up process, while commercial gentrification tends to be more involved with the top-down urban planning process. This study contributes to the methodological development of network analysis in tourism research and advances the understanding of the different mechanisms of touristification and commercial gentrification.

1. Introduction

As an important economic-growth engine, the tourism industry substantially contributes to GDP and is currently experiencing a strong recovery from the COVID-19 pandemic. In particular, as the fastest-growing tourism segment, urban tourism constitutes an important force in the current urban transformation in tourism cities [1]. The process of an area transforming from resident-oriented to tourist-oriented is termed touristification and involves spatial, social, economic, and cultural changes in the urban landscape, resulting in growing concerns for sustainable tourism due to its dilution of culture, damage to historic places, displacement of original users, and conflicts among residents and tourists [2,3]. Existing research has pointed out a clear interaction between touristification and commercial gentrification [2], with recent research starting to focus on the differences between these two coexisting, but with distinct phenomena [4,5]. Furthermore, some scholars are advocating for quantitative analysis in touristification studies. Most previous touristification studies used conventional qualitative approaches, such as first-hand observations, interviews, and questionnaires, to explore the complicated influence of touristification. While this can help interpret the results of quantitative studies, it can be inadequate for an in-depth examination of how a tourism city can be imagined, negotiated, and developed for different social actors [6].
Tourism movement has sparked continuous interest in tourism research and can support effective quantitative research through network analysis. Among many factors, tourism movement, alongside tourists’ various sociocultural characteristics and consumption preferences, directly and significantly impacts destinations’ environments and subtly affects regional development and economic revitalisation [7]. As the projection of tourists’ movement and activities in geographical space, tourist flow connects origins and destinations and the various attractions within destinations; it can also manifest tourists’ needs and preferences. Since the 1960s, scholars have increasingly applied network analysis to investigate tourist flows on multiple scales, and have investigated tourist flow’s distribution in time and space [7,8,9,10], the characteristics of its network structure at different levels [11,12,13], and the impacts and mechanisms of this network’s formation and development [14,15,16].
Nevertheless, the literature concentrates on tourist flows across countries, regions, and cities; thus, micro-scale flows within cities or districts require further research. Tourists’ behaviours are more complicated in intra-destinations than in inter-destinations, as tourists tend to visit diverse attractions as part of their trips, and their movement is more flexible and unpredictable. Moreover, data collection difficulties still hinder tourist flow research at the micro-scale. In the current study, data were mostly obtained from official statistics, questionnaires, and Global Positioning Systems (GPSs), and each method has its applicable spatial scales. While the use of big data can potentially improve the accuracy and validity of the results by considerably increasing the sample size, it is still relatively rare in tourist flow studies.
To fill the gaps in the current literature, this study has three research aims. First, it aims to identify the characteristics and patterns of a district-scale tourist flow network by using network analysis and online travel diaries uploaded by tourists, taking the core urban tourism precinct in Chongqing, China as an example case. Second, it develops a method to evaluate community tourism centrality based on network analysis results, thereby allowing us to examine community tourism development, which allows us to examine community tourism development and conduct quantitative analyses at the community level. Third, it develops indicators for touristification and commercial gentrification based on tourism accommodation facilities, including hotels and short-term rentals (STRs), and commercial facilities such as gift shops, cafés, and Western restaurants. It then measures the indicators’ correlation with community tourism centrality to explore the relationship between touristification and commercial gentrification. In doing so, this study makes two theoretical contributions: (1) using network analysis to study inter-attraction tourist flows on a district scale and (2) applying network analysis to commercial gentrification research. The authors construct a tourist flow network using online travel diaries, develop a method to evaluate communities’ degree of touristification based on network analysis, and provide practical implications for the planning and management of future urban tourism development.

2. Literature Review

2.1. Network Analysis

Based on mathematics and graph theory, network analysis uses a set of methods and tools to map and measure the pattern, flow, and strength of relationships between actors [17]. The structural view of network analysis distinguishes it from other analysis methods [18]. A network comprises a series of interrelated actors and the ties between them. To understand the network structure, studies have examined indicators such as size, density, average path length, and clustering coefficient, and have measured various centrality indices using different strategies to identify the role and position of a particular node within the network.
When focusing on the tourism system, extant network-based tourism research can be divided into two types: production and demand. The first concentrates on structure, interaction, and power relationships among different tourism suppliers, such as stakeholders, tourism agencies, and government organisations. These studies have emphasised collaborations among competitive destinations [18,19], illustrated the formation and evolution of collective inter-organisational relationships and partnerships [8,20], and proposed new network analysis indicators to identify the distinctive and prevalent position of company brokers [21].
The second strand of research has conducted network analyses of tourist movements and behavioural patterns from a tourist demand perspective. Based on the various network models that describe tourists’ spatial movement, researchers have identified distinct movement patterns between first-time and repeat visitors [22]. Others have noted that both destination and tourist characteristics can influence tourist movement patterns [16]. Liu et al. [23] explored the underlying mechanisms of the tourist attraction network through network analysis and the quadratic assignment procedure. They found that region and tenure proximity among a destination’s major attractions were positively related to attraction network, while grade proximity was negatively related to it, indicating that same-grade attractions were mostly competing among themselves for tourists. Noting that a network’s structural relations can be flexible and adaptable, Jeon and Yang [24] identified the structural changes to a local tourism network before and after COVID-19 and revealed that the demand for tourism was concentrated in places that previously tended to have a low tourism density. Zhu [10] analysed the dynamic changes in the structure of China’s inbound tourist-flow network from 2004 to 2017 and found a significant correlation between network structure and tourism performance.

2.2. Tourist Flow

Tourist flow, the movement of tourists from an origin place to a destination or within one destination, is a key issue in tourism geography research. It is shaped by complicated interrelations between tourists, transit routes, and original and destination regions. Research on tourist flow has been conducted on both the macro and micro scales ranging from global [9,25], national [13], and regional [24,26] to and intra-city [27]. Analysis of cross-boundary tourist flow can help forecast tourism demand and implement appropriate policies to ensure the sustainable growth of tourism activities. Understanding the micro-scale tourist flow within one destination area can facilitate tourist package design, tourism guidance policy-making, and marketing management [16].
In recent years, network analysis has been employed to comprehensively depict tourist flows and reveal the roles, functions, and cohesive groups of tourist spots [28]. In the tourist flow network, a destination or attraction is regarded as a node, and the actual movement between two nodes is a link. Different data sources are used to extract tourist flows. Traditional methods of tracking tourist flows include observations, interviews, post-visit questionnaires, recall maps, and movement diaries [13]; however, such methods are time-consuming, labour-intensive, and cannot ensure sufficient accuracy. With the development of information technology, new methods have been applied to track tourist flows. GPSs provide new ways to collect reliable and precise data on travel behaviour [29], and analysing Geographic Information System (GIS) data helps improve the geographical accuracy of tourist flow maps [22,30]. Additionally, researchers have explored and used various kinds of online big data and Web-scrapping technologies in tourism research, including travel diaries, photographs, itineraries from travel agencies, cellular signalling data, and data from location-based services. For instance, Leung et al. [15] used content and network analyses to examine online travel diaries and overseas tourist movement patterns in Beijing during the Olympics. Vu et al. [31] identified international tourists’ behaviour and travel routes in Hong Kong using user-contributed geotagged photos. Zeng [13] collected itineraries from travel services and tourists’ trip dairies to track tourists’ movements and analysed the patterns of Chinese tourist flow networks in Japan.

2.3. Touristification and Commercial Gentrification

Tourism development has become a major strategy for creating economic vitality in post-industry cities worldwide. A large number of existing studies have pointed out that touristification coexists with gentrification and brings about profound social and economic transformation that disrupts life in older urban neighbourhoods [6,32,33]. Touristification is the process by which a space is produced or reproduced for tourist lifestyles, often by creating attractions, services, and infrastructure that cater to visitors. Commercial gentrification, on the other hand, refers to the replacement of independent and original businesses by national or international chain stores and facilities of ‘upscale’ tastes. Both phenomena are associated with transformations in land use and commercial landscapes and result in various forms of displacement [34].
Specifically, from the production side, the emergence of short-term rentals has been identified as a key driver for tourism-induced gentrification in tourist destinations [35]. Under the ‘sharing economy’ umbrella, STRs are promoted as being able to facilitate local economies, reduce the number of empty houses, and diversify tourism accommodations. However, research has demonstrated the innate relationship between STR growth and gentrification. To obtain greater profits, landlords transform their dwellings from long-term rentals to STRs, which can bring about tenant evictions—the front line in the wave of gentrification [36,37,38,39]. Amidst the reduction of housing stock and growth in tourism facilities and services, increases in STRs are positively correlated with increases in rents and housing costs [40,41]. Moreover, compared with traditional hotels, which require whole buildings and relevant permits from the authorities, STRs enjoy greater flexibility to expand into historical centres and can aggravate the problems of crowding and gentrification [42,43]. With STR growth, local residents and tenants are supplanted by floating tourists, and daily-life-based commercial facilities are gradually adjusted to be tourist-oriented. Traditional markets and groceries are replaced by convenience stores, boutiques, and shops selling souvenirs and local products. Bars, cafés, and exotic restaurants are opened to entertain tourists [44,45].
Tourists’ increasingly active and important roles influence the local environment and residents and drive urban transformation [37]. Previous research has pointed out that touristification is a relatively spontaneous, bottom-up, and unplanned process in tourism development [35,37]. Building upon tourists’ real movement, tourist flow can provide a bottom-up perspective for understanding the touristification and commercial gentrification processes in tourism destinations from the demand side.

3. Case Study and Methodology

3.1. Study Area: Yuzhong District in Chongqing

In China, tourism has developed rapidly since the country’s reform and opening up in 1978. In 1998, tourism was selected as a new growth pole of the national economy, and in 2009 it became a strategic pillar industry [46]. In recent years, China has had the fastest growth rate of tourism development in the world [47]. Chongqing was the fourth municipality of mainland China designated in 1997 and is a growth pole (along with Xi’an and Chengdu) of the West Triangle Economic Zone. As the tourism industry was selected as a strategic sector for local development by the municipality government, Chongqing has developed into a popular national tourist destination in recent years owing to the proliferation of online social media platforms.
As well as being Chongqing’s political, economic, historical, and cultural centre, Yuzhong District also has great appeal for urban tourism because its unique topography generates distinctive urban forms and everyday experiences. The district is a peninsula surrounded by the Yangtze and Jialing Rivers, covers 23.24 km2, and holds a population of 0.6 million scattered across 79 communities. In previous decades, Yuzhong District’s regeneration has mainly centred around infrastructure improvement, mobility easement, and historic heritage conservation.

3.2. Data Collection

Our study was based on big data retrieved from the Internet. First, tourism nodes and real itineraries were determined using online travel diaries. In this research, attractions within Yuzhong District were defined as nodes in the network, and tourists’ movement among attractions created links between nodes. We collected online travel diaries shared by independent and anonymous tourists who travelled to and within Yuzhong District in June 2022; these diaries were obtained using Web-scrapping technology [48,49] from three travel websites in China: Ctrip (N = 1481), Qunar (N = 13), and Mafengwo (N = 50). After manually eliminating travel diaries with incomplete information or repetitive content, 1306 valid travel diaries were included in the final analysis. Fifty-five important attractions were initially generated based on the travel diaries; these attractions were used as the tourism nodes in this research. Based on the list of tourism nodes, one itinerary was extracted for each travel diary, resulting in 1306 total itineraries. The number of flow counts between every two nodes was used to define the strength of the connection between nodes, and the direction of the flow was not considered.
Second, we collected data on service facilities, including tourism accommodations and other commercial facilities, to reflect the development of touristification and commercial gentrification in Yuzhong District. Specifically, accommodation addresses and types (hotels and STRs) were extracted from the Ctrip website (https://ctrip.com/; accessed on 10 August 2023.) in June and July 2022, and 531 hotels and 696 STRs were identified in this research. In July 2022, the locations of STRs and hotels were downloaded based on address information from Baidu Map (https://map.baidu.com/; e.g., accessed on 10 August 2023.). Commercial facilities, including shops for gifts, souvenirs, and local products (N = 138); convenience stores (N = 97); bars (N = 97); cafés (N = 188); bubble tea shops (N = 166); and Western restaurants (N = 53) were included in this study. The Point of Interest data were extracted in April 2023 from Baidu Map.

3.3. Data Analysis

3.3.1. Network Analysis

Based on the itineraries identified from the online travel diaries, the tourist flow network was generated by considering each movement between two nodes as one link. We conducted various network analyses to understand the network property and node characteristics (Table 1). For the network-level research, we first analysed the dynamic changes in network property for different levels of tourist volumes based on size, density, average path length, and degree centralisation. Second, we identified the core–periphery structure and subgroups of the tourist flow network by dividing the network’s nodes into the core and the periphery categories based on how closely the nodes were connected. The nodes in the core category occupied a more important position in the network. Subgroups of the network were detected based on the Convergence of Iterated Correlations (CONCOR) algorithm. Nodes in the same subgroup blocks had the same role and position in the network; therefore, different subgroups represented different types of travel communities and patterns of route choices. The CONCOR algorithm also provided the density of and between each block, which enabled the identification of connections within and between blocks [8]. For node-level research, this study adopted degree centrality to reveal the tourism centrality of attractions [10].

3.3.2. Tourism Centrality, Touristification, and Commercial Gentrification

This study further developed an approach to evaluate the tourism centrality of communities with attractions in Yuzhong District. We first identified the geometric centres of 79 communities and then calculated the shortest distance between these geometric centres and the 55 identified attractions. Because of the mountainous topography of Yuzhong District, it was necessary to use the real road network to calculate accessibility based on travel distance. Therefore, we obtained road network information from Amap (https://ditu.amap.com/; e.g., accessed on 10 August 2023.) and used the OD Cost Matrix in Arc GIS to measure accessibility between communities and attractions. On this basis, we standardised the community–attraction distance and conducted a cluster analysis to grade the distance. Because the closer the attraction is to the community, the higher the contribution it makes to the community’s tourism competitiveness, we used the community–attraction distance to determine the attraction’s degree centrality. The formula for community tourism centrality was as follows:
Yij = C11/D11 + … +Ci1/Di1 + C12/D12 + … + Ci2/Di2 + … + Cij/Dij
where Yij represents the tourism centrality of j communities related to i attractions; Cij represents the degree centrality of the i attraction to the j community; and Dij represents the distance between the geometric centre of the j community and the i attraction.
We then tested the validity of the community tourism centrality calculation using a correlation test. Using principal component analysis, service facilities were classified into three categories of indicators, representing the degree of touristification, commercial gentrification, and daily-life-oriented facilities. Specifically, the touristification indicator included STRs, hotels, and shops for gifts, souvenirs, and local products, while the commercial gentrification indicator includes convenience stores, bubble tea shops, cafés, Western restaurants, and bars. Both indicators were expressed in terms of the density of relevant service facilities. The specific calculation method was used to standardise the community area, and then the service facilities of the community were divided by the standardised area to obtain the specific value of the touristification and gentrification. Because touristification and commercial gentrification are two interrelated phenomena, we analysed the relationship between community tourism centrality, touristification, and commercial gentrification. The correlation test was conducted using SPSS, v. 26 software, and Pearson’s correlation was used to evaluate the association between community tourism centrality and the touristification and commercial gentrification indicators.

4. Results

4.1. Network Characteristics

4.1.1. Network Properties

Based on 55 attractions and 1306 itineraries, we created a tourist flow network of Yuzhong District which contains 682 links (Figure 1). The network exhibited different characteristics under different levels of tourist volume control [50,51]. Theoretically, in the gradual increase in control values, core attractions and major paths continuously evolve. Based on the tourist flow count data (Iij) for the attractions in Yuzhong District, this study set six levels of tourist flow counts (Iij ≥ 1, Iij ≥ 5, Iij ≥ 10, Iij ≥ 20, Iij ≥ 50, Iij ≥ 100) to analyse the dynamic changes in network properties (Table 2). The results suggest that as the network level rises, the share of total tourist flow counts and the number of nodes and links decrease, and only the more important nodes and links remain. Meanwhile, the average tourist flow counts and degree centralisation increased significantly, which suggests that the core nodes of the network have become clearer. We hypothesised that there is a core–periphery structure within Yuzhong District’s tourist flow network.

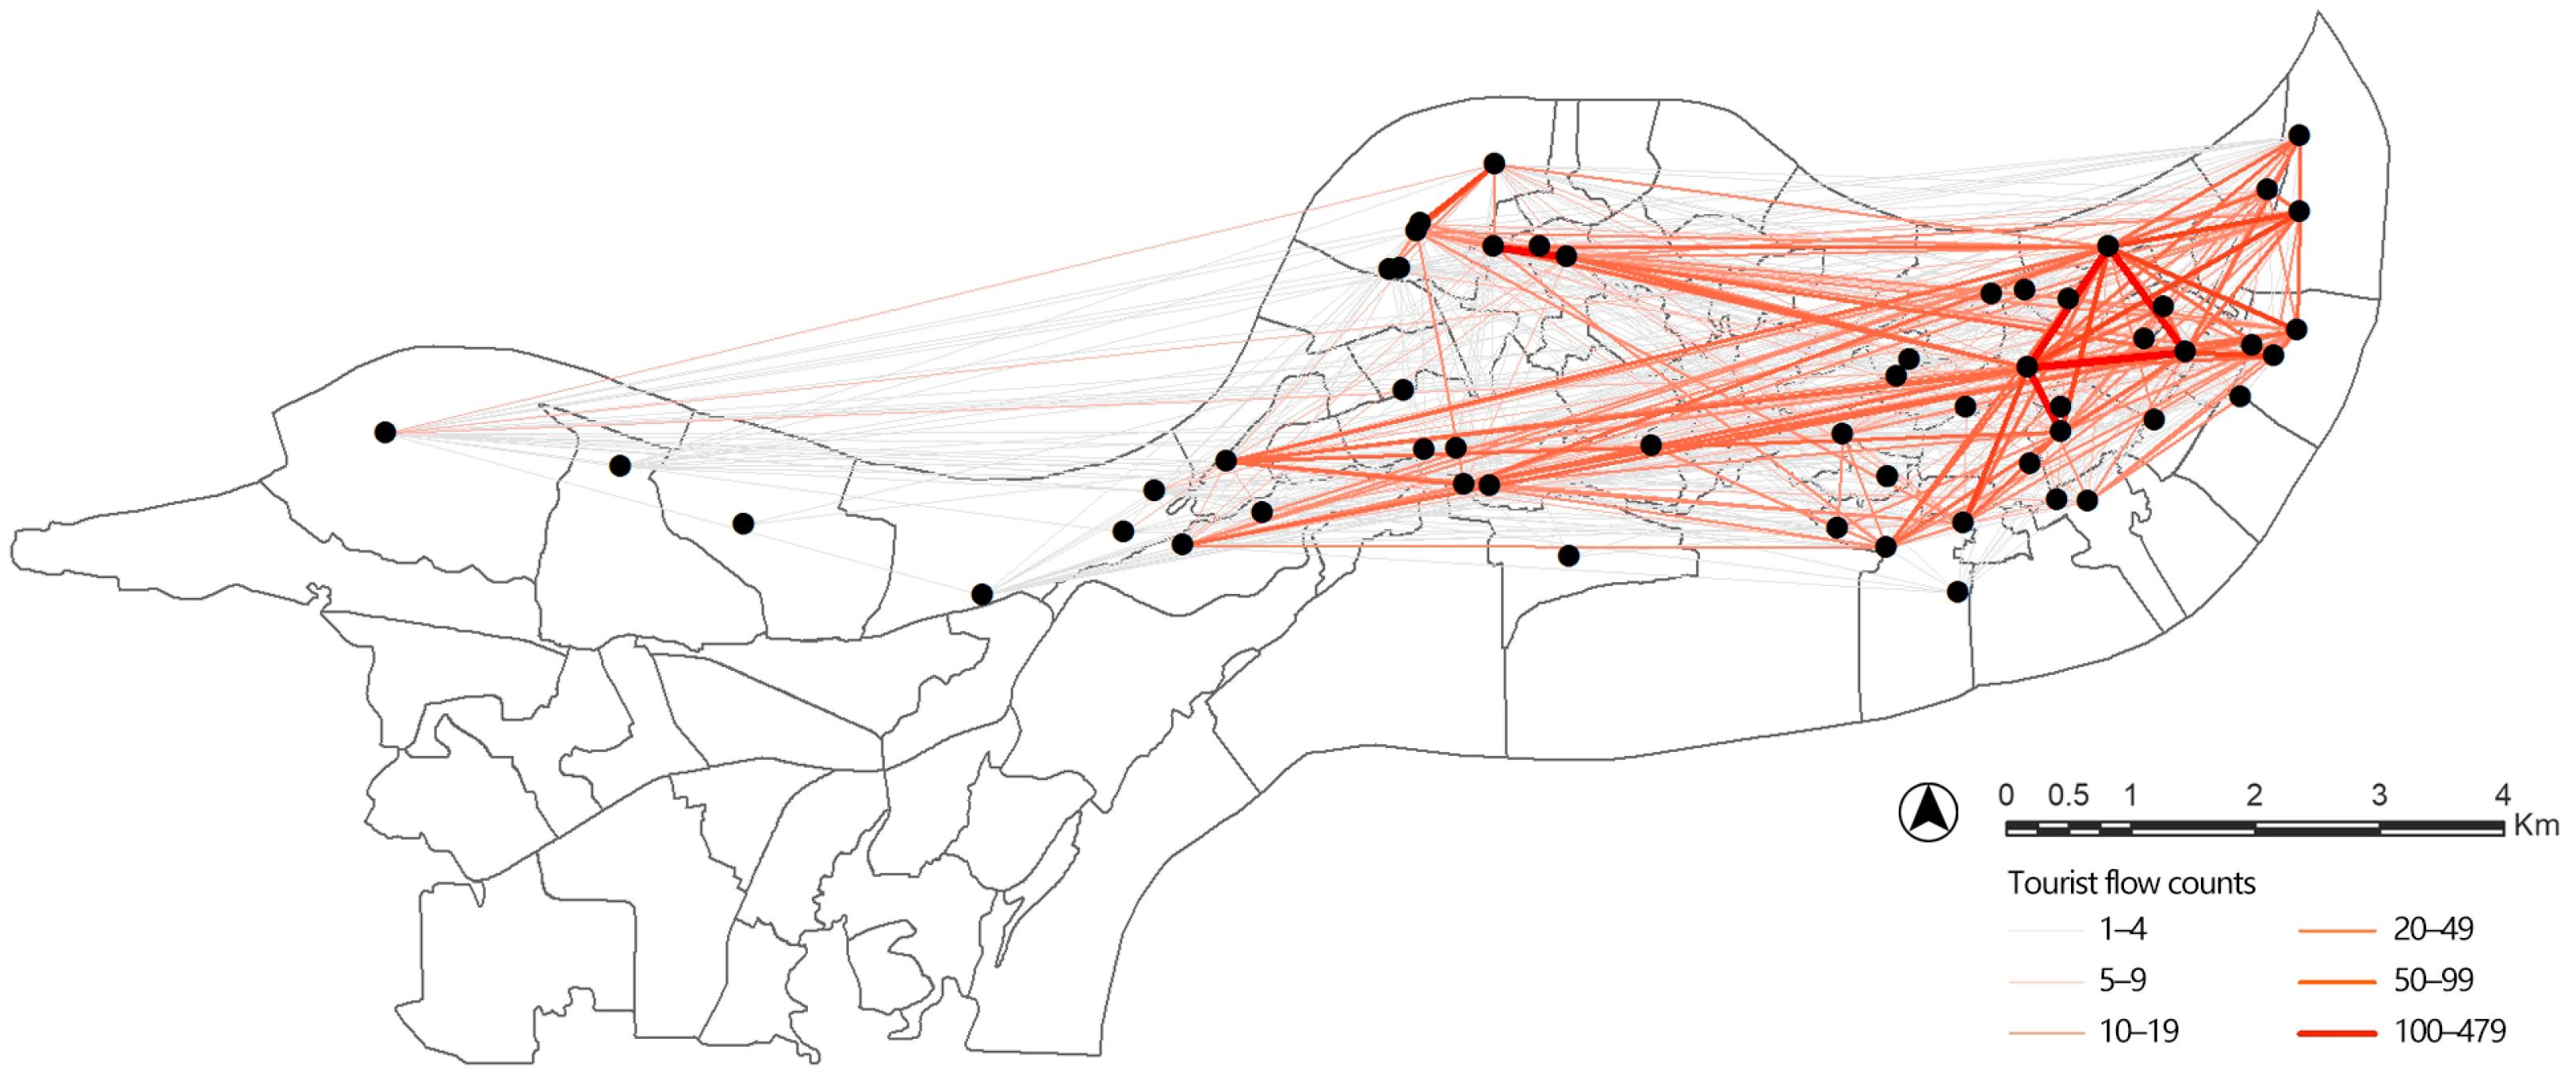
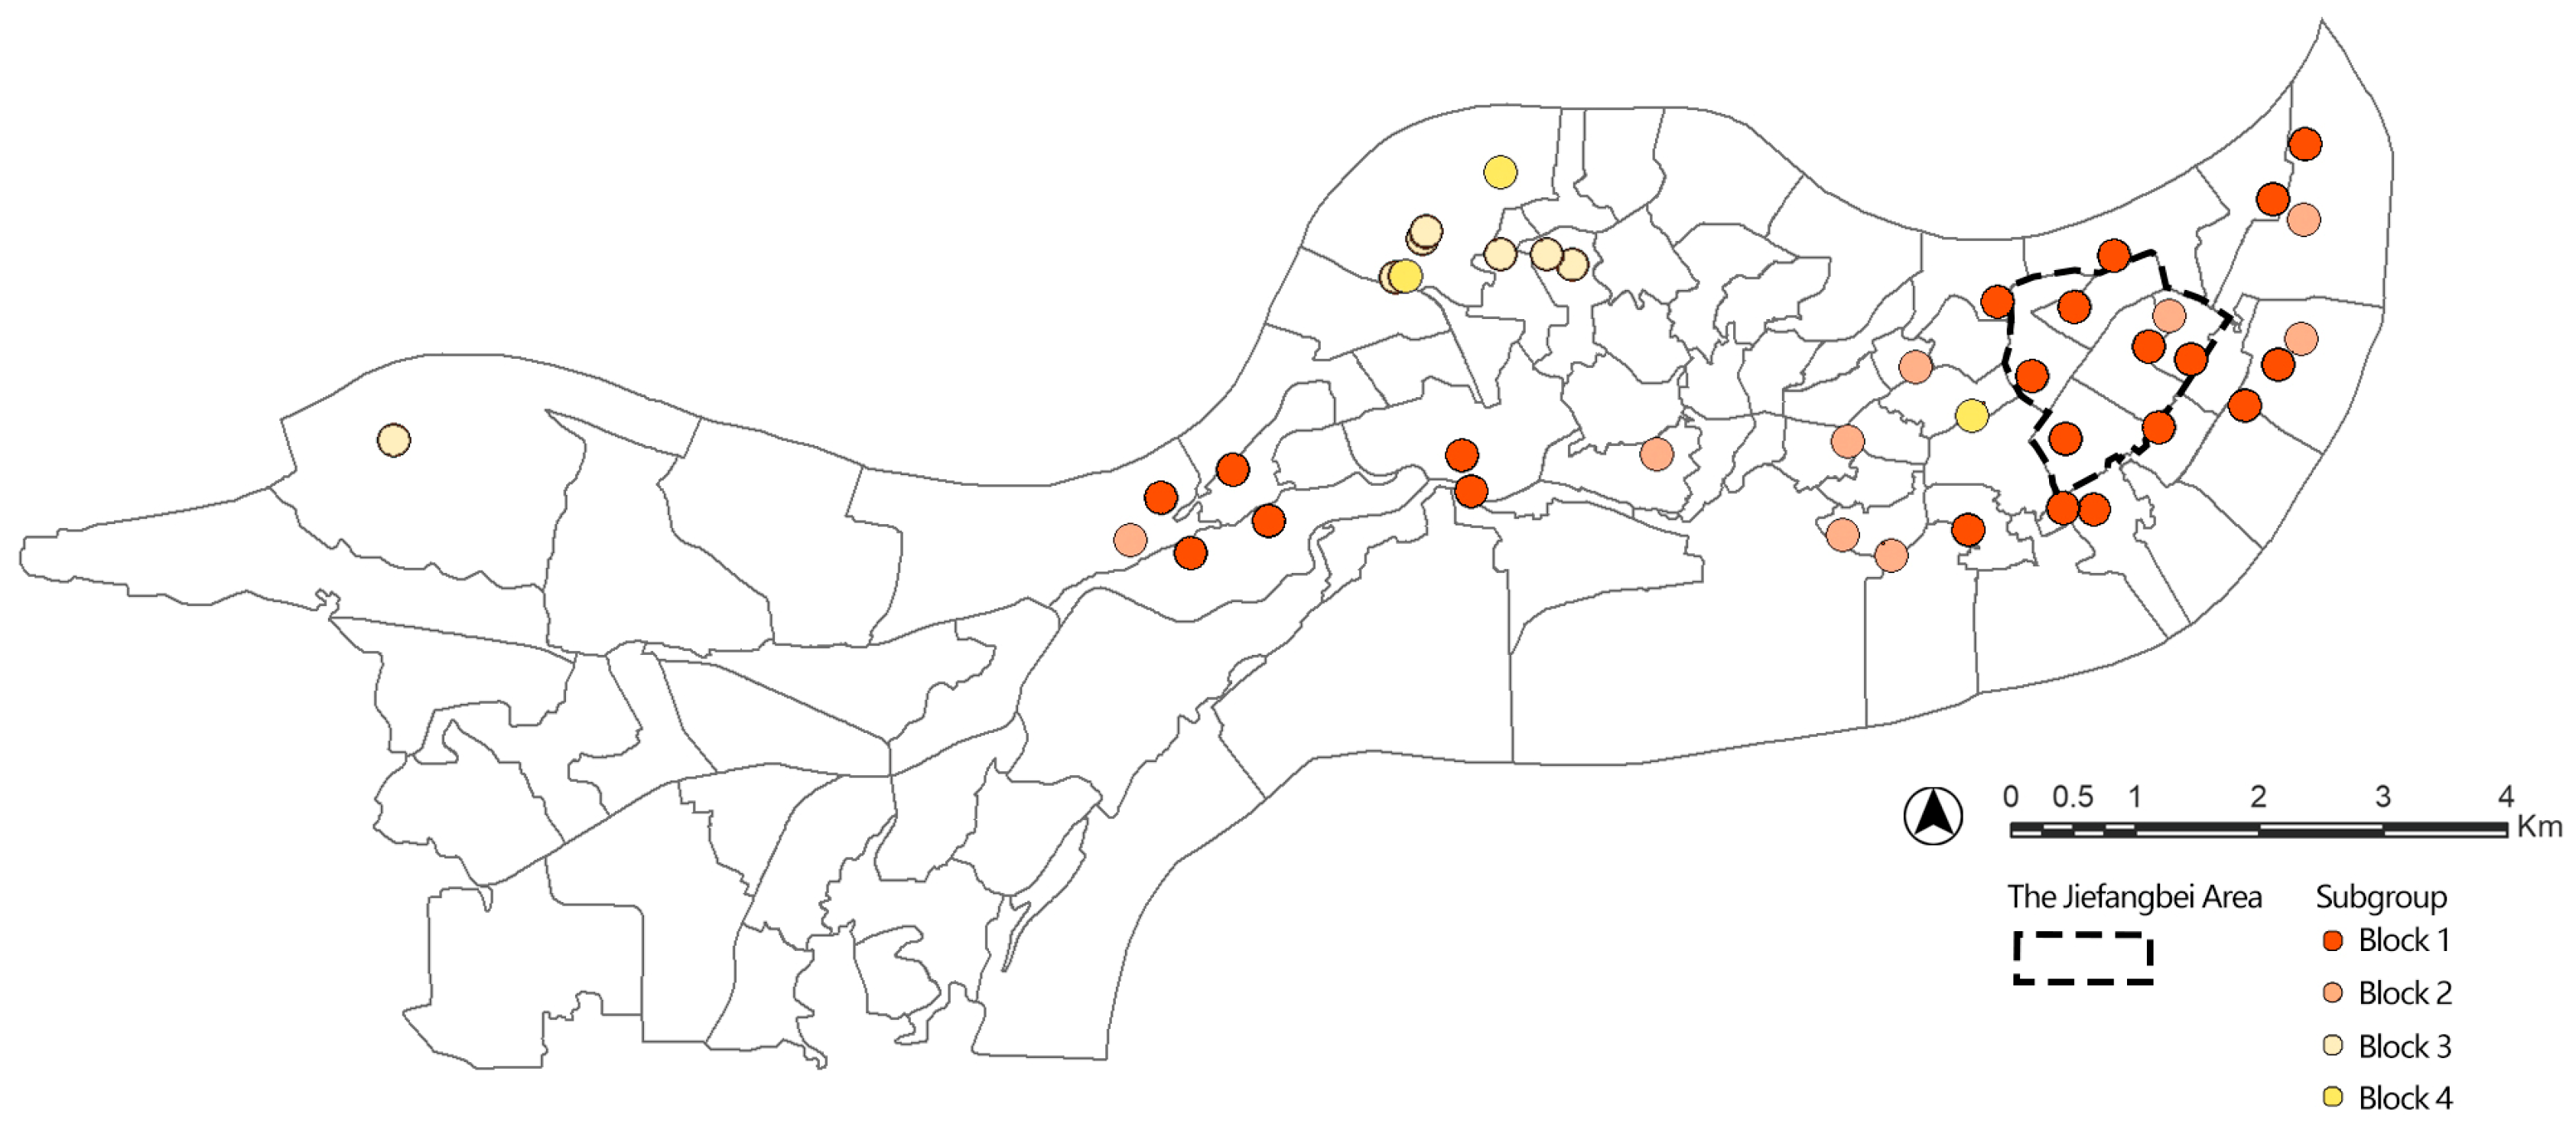
4.1.2. Network Structure

The network with Iij ≥ 5 tourist flow counts contained 40 nodes and carried 83.26% of the tourist flow, retaining the majority of the tourist flows and excluding contingent flows; therefore, it was used to analyse the network structure, including the core–periphery structure and subgroup detection. To test the aforementioned hypothesis on the core–periphery structure, we conducted a core–periphery analysis. The correlation coefficient was 0.824, suggesting that the hypothesis is valid. Specifically, the result showed 37 peripheral nodes and 3 core nodes: Jiefangbei, Hongya Cave, and Yangtze River Ropeway. Each core attraction enjoys an influential position in the network, with tourist flow counts exceeding 800 times.
Based on the CONCOR algorithm, four blocks were identified in Yuzhong District’s tourist flow network, representing four typical thematic travel routes (Figure 2). Block 1 had 21 attractions and represented the most popular and best-known attractions in Yuzhong District. Block 2 contained nine attractions, most of which were newly developed and dispersed in Yuzhong District. Attractions in Block 3 had a highly concentrated geographical distribution and were all created in the period of political transformation, from the 1930s—when Chongqing was the temporary capital during World War II—to the 1950s—when the People’s Republic of China had just been established. Block 4 had only three attractions, two of which are closely related to Chongqing’s political history. The density analysis results suggest that the attractions in Blocks 1, 2, and 3 are closely interconnected, with Block 3 having the highest block density (Density = 0.524). Moreover, a close interaction was only observed between attractions in Blocks 3 and 4, which share similar cultural themes and are geographically contiguous.

4.2. Tourism Centrality

4.2.1. Attraction Tourism Centrality

Building on real tourist-flow counts, degree centrality describes the role and position of attractions from the scale of tourist visitation; therefore, it also reveals the tourism centrality of attractions. In this study, the degree centrality of the 55 attractions ranged from 0.013 to 5.685. In light of existing research [13,23,52], attractions were divided into five classes: the core, secondary core, important, common, and attached nodes (Figure 3). According to the K-means clustering analysis, Jiefangbei was the core node, Hongya Cave was the secondary core node, Yangtze River Ropeway was the important node, and there were 12 common and 40 attached nodes. Overall, the tourist flow network of Yuzhong District exhibits a multi-centre equilibrium structure. The core nodes are intricately linked to each other and to numerous secondary core nodes.

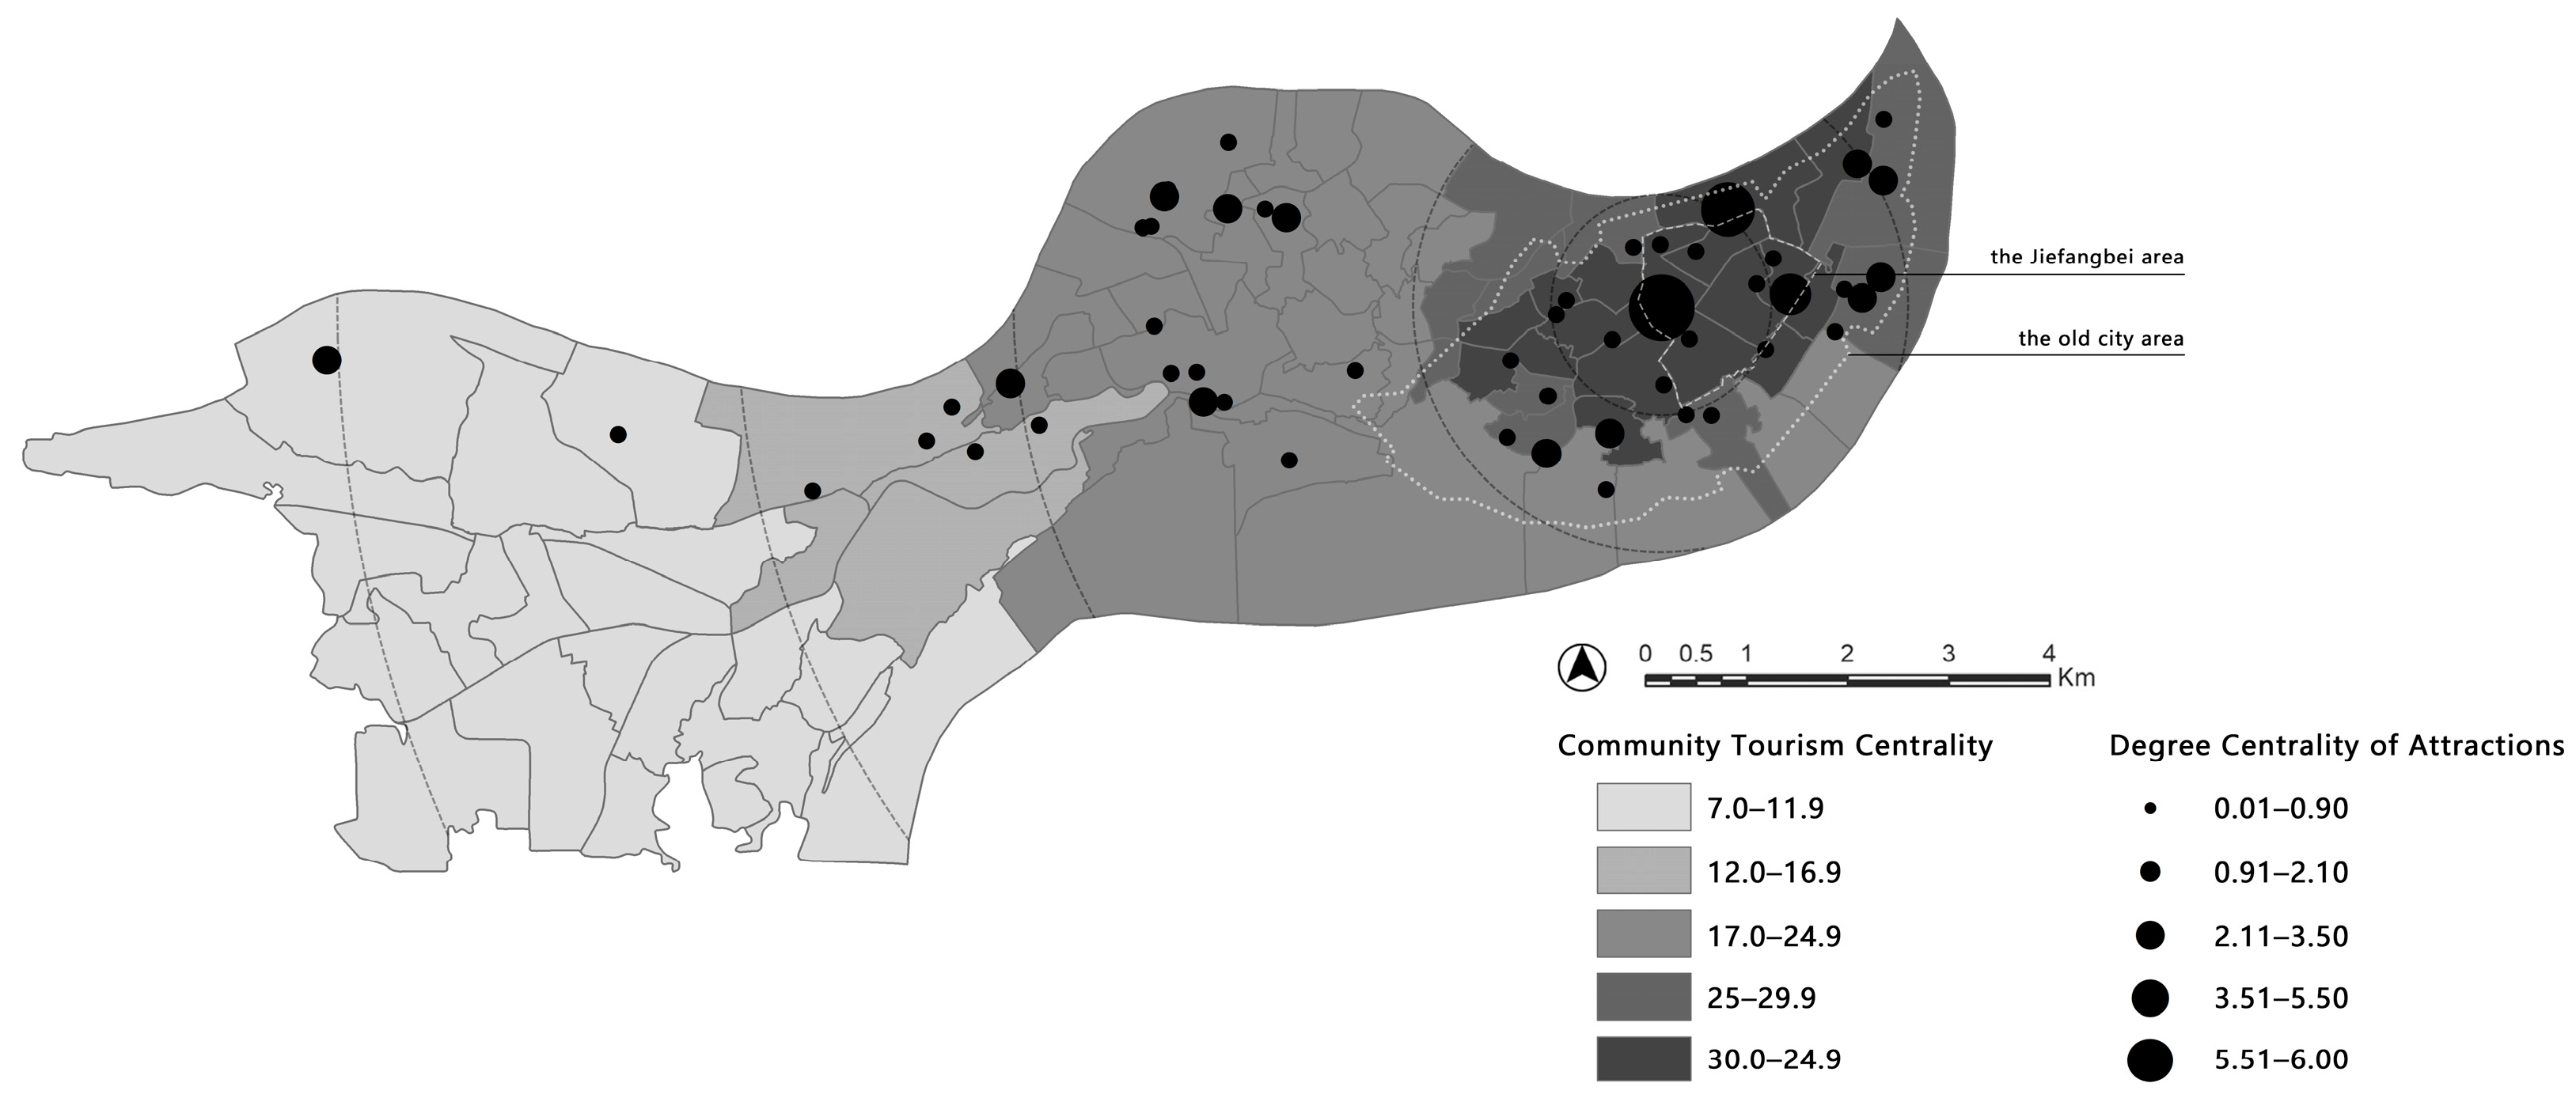
4.2.2. Community Tourism Centrality

According to the result of the OD Cost Matrix analysis, the values of the community–attraction distance varied widely. We standardised the distance using Z-score normalisation, and the result ranged from −0.709 to 4.258. The K-means cluster analysis showed that it is the most appropriate to divide the distance values into seven clusters (Table 3). If we divide them into four or five clusters, the number of clusters is too small to analyse the differences between clusters, and there would be one cluster with more than 2500 samples, which would add up to 58.9% of the total sample and require further subdivision. Also, eight clusters would result in a scattered classification and embody less particularity. Therefore, in order to ensure the diversity of various categories and an organised classification, we divided the community–attraction distance into seven clusters. After assigning the distance to Clusters 1–7, the community tourism centrality was obtained using the calculation formula (Table 4).
The mean of community tourism centrality was 21.001, the maximum was 33.545, the minimum was 7.075, and the standard deviation (SD) was 8.173, indicating that the community tourism centrality in Yuzhong District is generally high, but the difference between communities is great, and our treatment of community tourism centrality was reasonable [53]. The SD shows that centrality varied greatly among all communities in Yuzhong District, while the mean shows that most communities had a high degree of tourism development. In addition, the geographic distribution of community tourism centrality had a significant concentric structure (Figure 3). Communities with higher tourist centralities were clustered around the Jiefangbei area; as the distance increased, both the density of attractions and the tourism centrality of communities decreased.

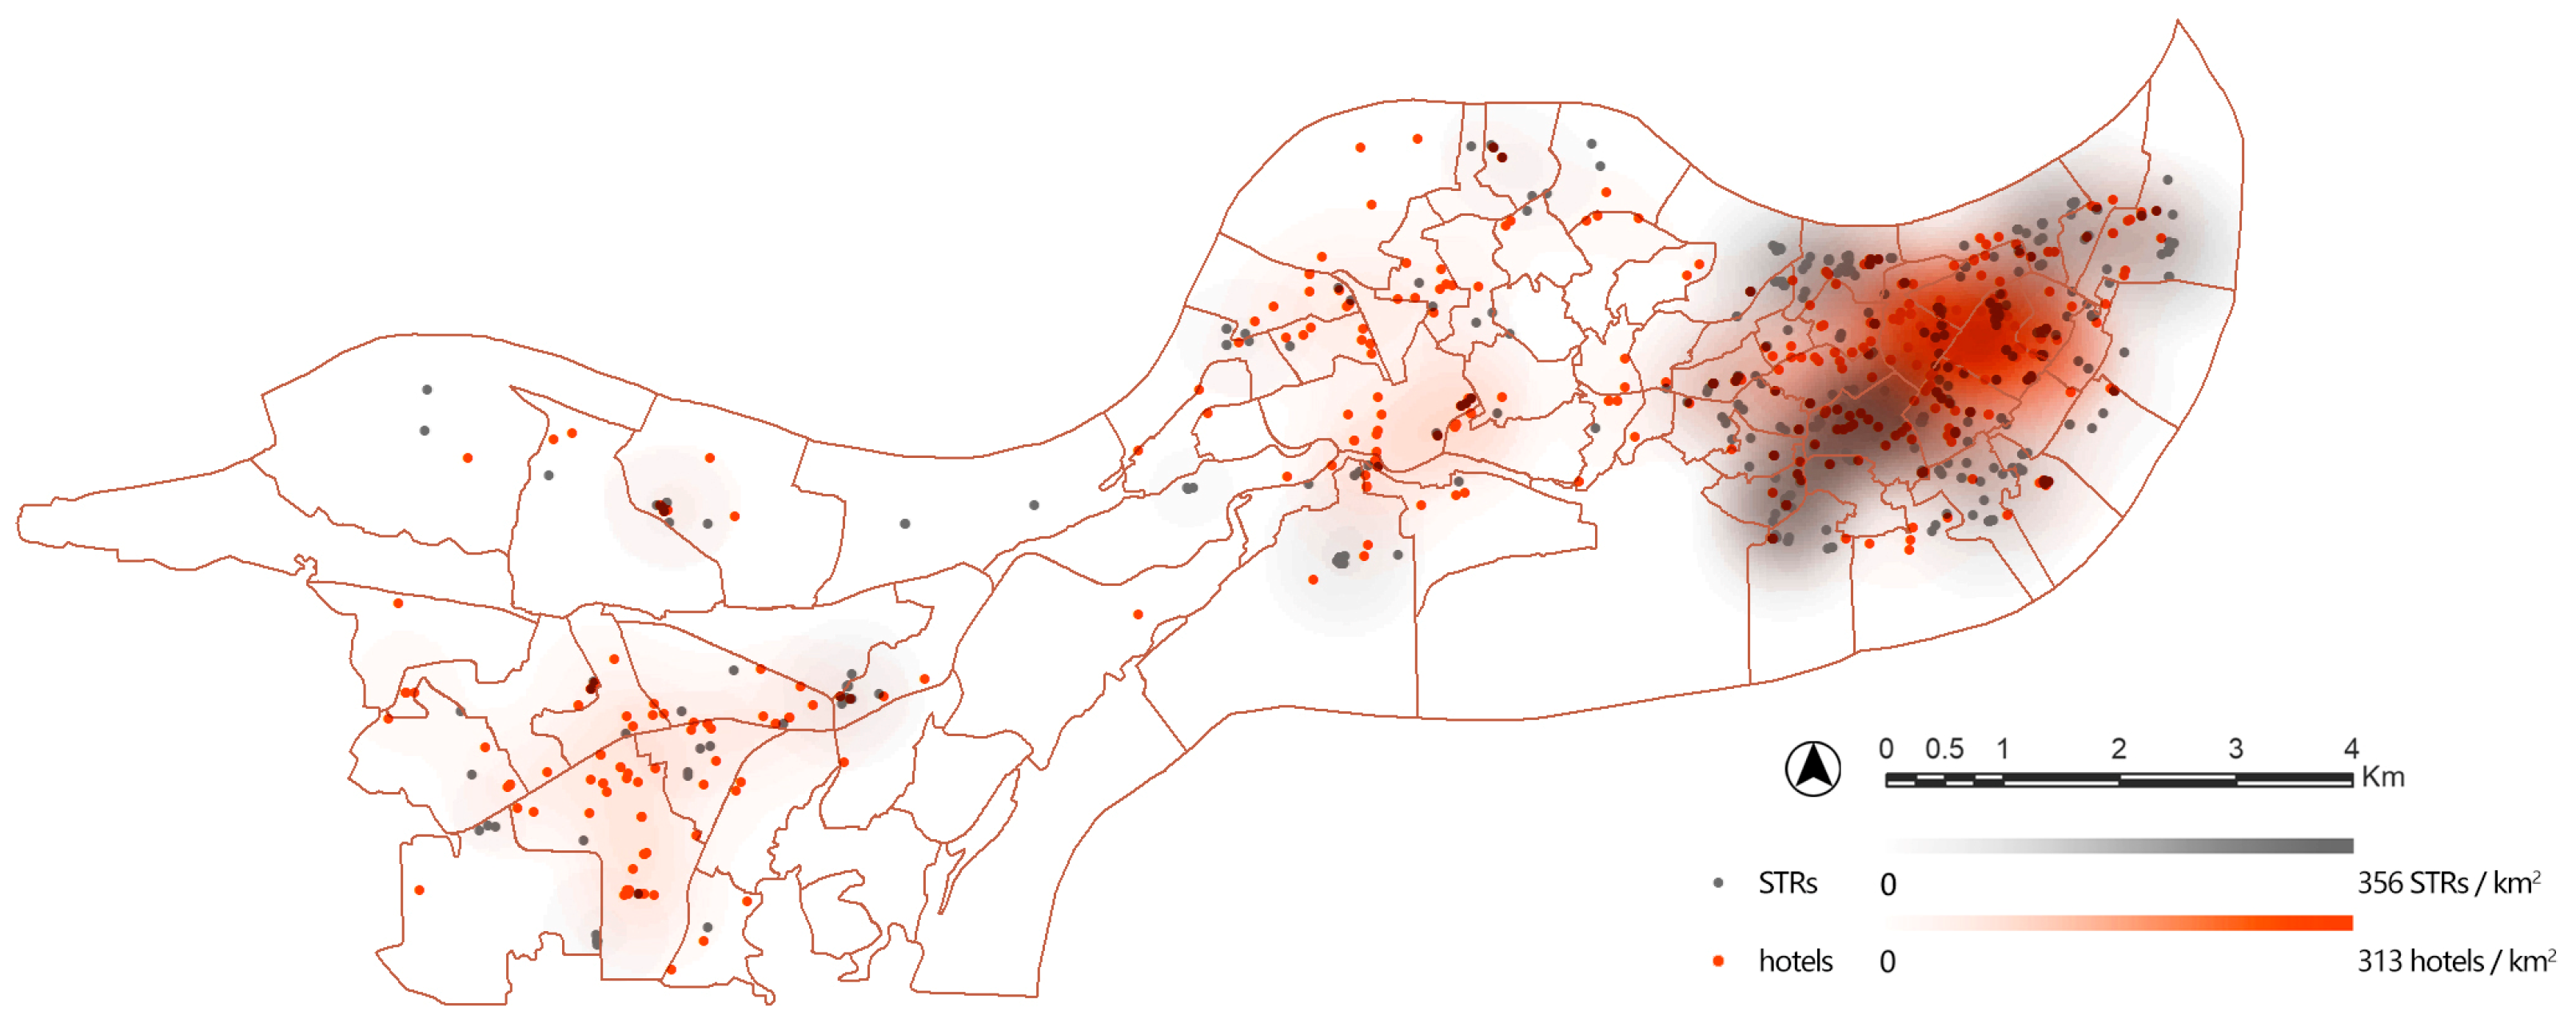
4.3. Relationship between Community Tourism Centrality, Touristification, and Commercial Gentrification

We conducted a correlation analysis of community tourism centrality, touristification, and commercial gentrification. The results show that community tourism centrality was significantly correlated with both touristification (β = 0.627, p < 0.01) and gentrification (β = 0.412, p < 0.01) (Table 5). The positive correlations indicate that our community tourism centrality results are appropriate and that the network-analysis-based approach is valid. In this study, we also identified a significant correlation between touristification and commercial gentrification (β = 0.709, p < 0.01). In addition, we found that community tourism centrality had a stronger association with the density of STRs (β = 0.573, p < 0.01) than that of hotels (β = 0.500, p < 0.01). Meanwhile, commercial gentrification was more significantly correlated with the density of hotels (β = 0.788, p < 0.01) than that of STRs (β = 0.478, p < 0.01).
The kernel density estimation results for STRs and hotels in Yuzhong District suggest that hotels are concentrated in three areas, while STRs are mainly concentrated in the periphery of the Jiefangbei area (Figure 4).

5. Discussion

5.1. Network Characteristics of the District-Scale Tourism Destination

While existing studies on tourist flow networks have mainly focused on macro scales (from global to city levels), this research presents a micro-scale case study at the district level in Chongqing, China. Our findings indicate that the core–periphery structure of the district-level tourist flow network is significant, and that core node attractions have two typical characteristics. First, all three core attractions are closely rooted in Chongqing’s unique history and topography. Among them, Jiefangbei is a commercial district that originated in the early 1930s and is a historical political arena that functioned as the ‘spiritual fortress’ of Chongqing, as well as China in general, during the great bombing by the Japanese air force in World War II. Meanwhile, both Hongya Cave and Yangtze River Ropeway have been developed into key attractions by leveraging the mountainous topography and riverfront landscape to create unusual spatial experiences. Second, in line with existing city-scale studies that suggest that destinations with higher hierarchies are more likely to have comprehensive functions [13], all three attractions have mixed functions. Jiefangbei and Hongya Cave are commercial districts with various restaurants, retail stores, and hotels. Yangtse River Ropeway is used not only for sightseeing but also as a daily-use-based transport station linking the urban areas separated by the Yangtze River. In other words, while the attractions’ resource endowments—such as their historical and cultural value, unique urban form, and spatial experiences—are important, their diverse functions, such as commercial centres and transportation, can also contribute to their role and position in the network.
The subgroup detection identified four typical thematic travel routes; however, attractions in both Classes 1and 2 are scattered throughout Yuzhong District, indicating that distance is not a significant selection criterion for district-scale sightseeing. Given that distances between attractions and community centres do not exceed 11 km, the longest travel time is only around 10 min by car. Analysis results at the node level also confirm this point. Nodes at or below the secondary core class are loosely connected and are geographically dispersed, showing that geographical proximity does not have a significant impact on tourists’ movement in Yuzhong District [50].

5.2. Insights into the Distribution of Community Tourism Centrality

The distribution of tourism centrality of communities in Yuzhong District has a significant core–periphery structure. Communities with higher degrees of tourism centrality are mainly clustered in the old city area, which can date back to 300 BC. These communities have two distinct features. First, attractions are densely located in these communities. In line with previous studies, attractions are at the core of the tourism system as both critical resources for destination development and motivators for visitors, and cultural heritage is one of the most important types of visitor attraction [53]. As the birthplace of Chongqing City, the old city area has a high density of attractions of various kinds. According to official statistics, there are 76 historical heritage sites in Yuzhong District, nearly half of which are clustered in the old city area. These sites are closely related to the local history and culture of Chongqing since the Qing Dynasty, including the culture of wharves, port opening, migration, and temporary capital. Thus, community tourism centrality is to some extent a reflection of the historical richness of the corresponding communities.
Second, these communities, especially those near the Jiefangbei area, have a large proportion of commercial land use and include all sorts of commercial and entertainment facilities. The Jiefangbei area is not only one of Chongqing’s iconic attractions, it has also been an important commercial centre since the 1900s. Similar to other cities and districts in China that have undergone tourism development [44,54], the Jiefangbei area experienced profound commercialisation due to the pedestrianisation project undertaken in 1997 and the official designation of Chongqing’s central business district in 2003. According to the master plans of Yuzhong District from 1983 to 2014, the area of commercial land use in Jiefangbei increased more than 15 times in this period. With the wealth of commercial facilities and travel resources, the Jiefangbei area has become one of the most important urban destinations in Chongqing.

5.3. Implications of the Different Touristification and Commercial Gentrification Mechanisms

Other than the significant correlation with touristification, the calculation logic of community tourism centrality is built upon tourists’ activities, which directly represents the bottom-up power and impact of tourists, mirroring the notion of touristification. Therefore, community tourism centrality can be used as an indicator for touristification. According to the correlation test, while community tourism centrality (here representing the degree of touristification) and commercial gentrification are both significantly correlated with the density of tourism accommodation, community tourism centrality is more intimately interrelated with STRs, and commercial gentrification has a stronger correlation with hotels. This indicates that although touristification and commercial gentrification share a high degree of similarity, touristification is primarily a bottom-up process, while commercial gentrification tends to be more involved with the top-down process. Moreover, these two processes in opposite directions reinforce each other. This finding corresponds with Cocola-Gant et al.’s [55] argument that touristification is relatively spontaneous and unplanned, as well as Estevens’s assertion that the neoliberal state has played an active role in the touristification process [56].
The increase in STRs effectively represents a bottom-up initiative to propel touristification from the production side. In pursuit of greater profits, apartment owners willingly move out, selling or refurbishing their properties into STRs. Small-scale and independent business can be opened in areas of either residential or commercial land use. Therefore, the distribution of STRs is flexible and highly sensitive to the development of touristification. In contrast, the location of traditional hotels must comply with the commercial land use plan, and most of them are concentrated in large-scale commercial districts. This process cannot be separated from top-down urban planning and is mainly dominant by the public sector. The aforementioned process of Jiefangbei’s commercialisation provides a typical case of government-led commercial gentrification in tourism destinations.

5.4. Strengths and Limitations

Using online travel diaries, this study uniquely conducted network analyses on a district-level destination where actual numbers of tourists are difficult to obtain. Most previous research has focused on macro-scale tourist flow networks among countries, regions, provinces, and cities. This study also developed an approach to evaluate community tourism centrality and demonstrated the correlation between tourism centrality, touristification, and gentrification.
This study has several limitations. First, the research was primarily based on online big data. Although the data size provided adequate samples, data omissions can exist, considering that there are tourists who do not share their experiences online, as well as STRs and second-hand apartments that are not registered on online platforms. Future studies can supplement the data by conducting field research using GPS and questionnaires. Second, this study did not analyse the evolution of the tourist flow network over time. To explore the evolution and fluctuation of tourist flow networks on annual, seasonal, or monthly bases would further contribute to understanding the driving factors and mechanisms of network formation and evolution.

5.5. Management Recommendations

Inter-attraction networks are complicated, dynamic, and involve different factors, and attractions play different roles in the formation and development of destination networks [23]. This study provides specific implications for both destination and attraction management. For destination management, identifying dominant attractions and understanding their connections with other attractions are essential steps for developing effective strategies to improve the synergic effects of the attraction system. Moreover, our case study suggests that identifying attractions with similar themes and improving accessibility via related pedestrian systems and public transportation would benefit travel route planning and facilitate tourist visitation. For attraction management, the findings suggest that attractions’ resource endowments are crucial to ensuring attractiveness and competitiveness. Furthermore, diversifying the functions of attractions can significantly promote their competitiveness; however, this should be deliberately planned to conserve the historical and cultural uniqueness of attractions and avoid homogenous competition and over-commercialisation.

6. Conclusions

The tourism industry is expected to grow significantly worldwide. The complicated process of touristification and commercial gentrification has considerable impacts on current urban transformation, and there is a growing concern for sustainable tourism. Through online travel diaries and network analysis, and using Yuzhong District in Chongqing as an example, this study constructed an inter-attraction tourist flow network at the district level and analysed its characteristics. We also developed an approach to evaluate community tourism centrality and examined the correlation between community tourism centrality, touristification, and commercial gentrification. In our study, we found that attractions with historical value, unique local landscapes, and mixed functions show greater tourism centrality in the tourist flow network. Attractions with similar themes are more likely to be included in travel routes, and the influence of distance is insignificant at the district level. Communities with higher tourism centrality are clustered in the old city area, which has rich historic heritage and has experienced profound commercialisation. While touristification and commercial gentrification are two coexisting processes, touristification is related to bottom-up initiatives, while commercial gentrification is closely involved with top-down processes. Future research should explore the relationships between additional network parameters and various indicators, such as community demographic characteristics, the real estate market (the spatial distribution and price of dwellings for sale and rent), and community cohesion, to obtain an in-depth understanding of the comprehensive influence of touristification.

Author Contributions

Conceptualisation, M.J., X.G. and D.F.; methodology, M.J., Y.D., B.W. and X.W.; software, M.J., Y.D. and X.W.; validation, M.J. and X.W.; formal analysis, M.J., X.W. and D.F.; investigation, M.J. and Y.D.; resources, Y.D.; data curation, M.J., Y.D. and X.W.; writing—original draft preparation, M.J., X.W. and D.F.; writing—review and editing, M.J., X.W. and D.F.; visualisation, M.J.; supervision, M.J.; project administration, M.J.; funding acquisition, M.J. All authors have read and agreed to the published version of the manuscript.

Funding

This research was funded by the National Natural Science Foundation of China (grant number 42101200) and Fundamental Research Funds for the Central Universities (grant number 2022CDJXY-014).

Data Availability Statement

The data that support the findings of this study are available upon reasonable request from the authors.

Acknowledgments

We would like to express our gratitude to everyone who contributed to this study.

Conflicts of Interest

The authors declare no conflict of interest.

References

  1. Lin, C.S.; Shyu, C.S.; Li, C.P. The Greener the Hotel, the Better Operating Efficiency It Has? A Sustainable Tourism Perspective. Sustainability 2023, 15, 10927. [Google Scholar] [CrossRef]
  2. Tanaka, R.; Kato, H.; Matsushita, D. Population Decline and Urban Transformation by Tourism Gentrification in Kyoto City. Sustainability 2023, 15, 2247. [Google Scholar] [CrossRef]
  3. Speake, J.; Kennedy, V.; Love, R. Visual and aesthetic markers of gentrification: Agency of mapping and tourist destinations. Tour. Geogr. 2023, 25, 756–777. [Google Scholar] [CrossRef]
  4. Cheung, K.S.; Yiu, C.Y. Unfolding touristification in retail landscapes: Evidence from rent gaps on high street retail. Tour. Geogr. 2022, 25, 1224–1250. [Google Scholar] [CrossRef]
  5. Nofre, J.; Giordano, E.; Eldridge, A.; Martins, J.C.; Sequera, J. Tourism, nightlife and planning: Challenges and opportunities for community liveability in La Barceloneta. Tour. Geogr. 2018, 20, 377–396. [Google Scholar] [CrossRef]
  6. Sequera, J.; Nofre, J. Shaken, not stirred: New debates on touristification and the limits of gentrification. City 2018, 22, 843–855. [Google Scholar] [CrossRef]
  7. Fang, L.; Liu, Z.; Jin, C. How Does the Integration of Cultural Tourism Industry Affect Rural Revitalization? The Mediating Effect of New Urbanization. Sustainability 2023, 15, 10824. [Google Scholar] [CrossRef]
  8. Kim, Y.R.; Scott, N. Network dynamics of tourism development in South Korea. Curr. Issues Tour. 2018, 21, 1239–1259. [Google Scholar] [CrossRef]
  9. Shao, Y.; Huang, S.; Wang, Y.; Li, Z.; Luo, M. Evolution of international tourist flows from 1995 to 2018: A network analysis perspective. Tour. Manag. Perspect. 2020, 36, 100752. [Google Scholar] [CrossRef]
  10. Zhu, H. Multilevel understanding dynamic changes in inbound tourist flow network (ITFN) structure: Topology, collaboration, and competitiveness. Curr. Issues Tour. 2021, 24, 2059–2077. [Google Scholar] [CrossRef]
  11. Kang, S.; Kim, W.G.; Park, D. Understanding tourist information search behaviour: The power and insight of social network analysis. Curr. Issues Tour. 2021, 24, 403–423. [Google Scholar] [CrossRef]
  12. Roth, C.; Kang, S.M.; Batty, M.; Barthelemy, M. Structure of uUrban movements: Polycentric activity and entangled hierarchical flows. PLoS ONE 2011, 6, e15923. [Google Scholar] [CrossRef]
  13. Zeng, B. Pattern of Chinese tourist flows in Japan: A Social Network Analysis perspective. Tour. Geogr. 2018, 20, 810–832. [Google Scholar] [CrossRef]
  14. Jin, X.; Qu, M.; Bao, J. Impact of crisis events on Chinese outbound tourist flow: A framework for post-events growth. Tour. Manag. 2019, 74, 334–344. [Google Scholar] [CrossRef] [PubMed]
  15. Leung, X.Y.; Wang, F.; Wu, B.; Bai, B.; Stahura, K.A.; Xie, Z. A Social network analysis of overseas tourist movement patterns in Beijing: The impact of the Olympic Games. Int. J. Tour. Res. 2012, 14, 469–484. [Google Scholar] [CrossRef]
  16. Lew, A.; McKercher, B. Modeling tourist movements: A local destination analysis. Ann. Tour. Res. 2006, 33, 403–423. [Google Scholar] [CrossRef]
  17. Casanueva, C.; Gallego, Á.; García-Sánchez, M.R. Social network analysis in tourism. Curr. Issues Tour. 2016, 19, 1190–1209. [Google Scholar] [CrossRef]
  18. Scott, N.; Cooper, C.; Baggio, R. Destination networks: Four Australian cases. Ann. Tour. Res. 2008, 35, 169–188. [Google Scholar] [CrossRef]
  19. Baggio, R. Collaboration and cooperation in a tourism destination: A network science approach. Curr. Issues Tour. 2011, 14, 183–189. [Google Scholar] [CrossRef]
  20. Pavlovich, K. The evolution and transformation of a tourism destination network: The Waitomo Caves, New Zealand. Tour. Manag. 2003, 24, 203–216. [Google Scholar] [CrossRef]
  21. Ruggieri, G.; Iannolino, S.; Baggio, R. Tourism destination brokers: A network analytic approach. Ann. Tour. Res. 2022, 97, 103488. [Google Scholar] [CrossRef]
  22. Lau, G.; McKercher, B. Understanding tourist movement patterns in a destination: A GIS approach. Tour. Hosp. Res. 2006, 7, 39–49. [Google Scholar] [CrossRef]
  23. Liu, B.; Huang, S.; Fu, H. An application of network analysis on tourist attractions: The case of Xinjiang, China. Tour. Manag. 2017, 58, 132–141. [Google Scholar] [CrossRef]
  24. Jeon, C.Y.; Yang, H.W. The structural changes of a local tourism network: Comparison of before and after COVID-19. Curr. Issues Tour. 2021, 24, 3324–3338. [Google Scholar] [CrossRef]
  25. Bowden, J. A cross-national analysis of international tourist flows in China. Tour. Geogr. 2003, 5, 257–279. [Google Scholar] [CrossRef]
  26. Peng, H.; Zhang, J.; Liu, Z.; Lu, L.; Yang, L. Network analysis of tourist flows: A cross-provincial boundary perspective. Tour. Geogr. 2016, 18, 561–586. [Google Scholar] [CrossRef]
  27. Shih, H.Y. Network characteristics of drive tourism destinations: An application of network analysis in tourism. Tour. Manag. 2006, 27, 1029–1039. [Google Scholar] [CrossRef]
  28. Kang, S.; Lee, G.; Kim, J.; Park, D. Identifying the spatial structure of the tourist attraction system in South Korea using GIS and network analysis: An application of anchor-point theory. J. Destin. Mark. Manag. 2018, 9, 358–370. [Google Scholar] [CrossRef]
  29. Hallo, J.C.; Beeco, J.A.; Goetcheus, C.; McGee, J.; McGehee, N.G.; Norman, W.C. GPS as a method for assessing spatial and temporal use distributions of nature-based tourists. J. Travel Res. 2012, 51, 591–606. [Google Scholar] [CrossRef]
  30. Connell, J.; Page, S.J. Exploring the spatial patterns of car-based tourist travel in Loch Lomond and Trossachs National Park, Scotland. Tour. Manag. 2008, 29, 561–580. [Google Scholar] [CrossRef]
  31. Vu, H.Q.; Li, G.; Law, R.; Ye, B.H. Exploring the travel behaviors of inbound tourists to Hong Kong using geotagged photos. Tour. Manag. 2015, 46, 222–232. [Google Scholar] [CrossRef]
  32. Jover, J.; Díaz-Parra, I. Gentrification, transnational gentrification and touristification in Seville, Spain. Urban Stud. 2020, 57, 3044–3059. [Google Scholar] [CrossRef]
  33. Ojeda, A.B.; Kieffer, M. Touristification. Empty concept or element of analysis in tourism geography? Geoforum 2002, 115, 143–145. [Google Scholar] [CrossRef] [PubMed]
  34. Kim, M.; Holifield, R. Touristification, commercial gentrification, and experiences of displacement in a disadvantaged neighborhood in Busan, South Korea. J. Urban Aff. 2022, 1–19. [Google Scholar] [CrossRef]
  35. Cheung, K.S.; Yiu, C.Y. Touristification, Airbnb and the tourism-led rent gap: Evidence from a revealed preference approach. Tour. Manag. 2022, 92, 104567. [Google Scholar] [CrossRef]
  36. Cocola-Gant, A.; Gago, A. Airbnb, buy-to-let investment and tourism-driven displacement: A case study in Lisbon. Environ. Plan. A 2021, 53, 1671–1688. [Google Scholar] [CrossRef]
  37. Freytag, T.; Bauder, M. Bottom-up touristification and urban transformations in Paris. Tour. Geogr. 2018, 20, 443–460. [Google Scholar] [CrossRef]
  38. González-Pérez, J.M. The dispute over tourist cities. Tourism gentrification in the historic Centre of Palma (Majorca, Spain). Tour. Geogr. 2020, 22, 171–191. [Google Scholar] [CrossRef]
  39. Wachsmuth, D.; Weisler, A. Airbnb and the rent gap: Gentrification through the sharing economy. Environ. Plan. A Econ. Space 2018, 50, 1147–1170. [Google Scholar] [CrossRef]
  40. Barron, K.; Kung, E.; Proserpio, D. The effect of home-sharing on house prices and rents: Evidence from Airbnb. Mark. Sci. 2021, 40, 23–47. [Google Scholar] [CrossRef]
  41. Robertson, D.; Oliver, C.; Nost, E. Short-term rentals as digitally-mediated tourism gentrification: Impacts on housing in New Orleans Short-term rentals as digitally-mediated tourism gentrification: Impacts on housing in New Orleans. Tour. Geogr. 2020, 24, 954–977. [Google Scholar] [CrossRef]
  42. Neuts, B.; Nijkamp, P. Tourist crowding perception and acceptability in cities: An Applied Modelling Study on Bruges. Ann. Tour. Res. 2012, 39, 2133–2153. [Google Scholar] [CrossRef]
  43. Zervas, G.; Proserpio, D.; Byers, J.W. The rise of the sharing economy: Estimating the impact of Airbnb on the hotel industry. J. Mark. Res. 2017, 54, 687–705. [Google Scholar] [CrossRef]
  44. Song, W.; Sun, J.; Chen, Y.R.; Yin, S.G.; Chen, P.Y. Commercial gentrification in the inner city of Nanjing, China. Acta Geogr. Sin. 2020, 75, 426–442. [Google Scholar]
  45. Sun, J.; Zhu, X.; Song, W.; Ma, G.Q. Commercial gentrification driven by cultural consumption in neighborhoods around university campuses: A case study of the original campuses of NJU and NNU. City Plan. Rev. 2018, 42, 25–32. (In Chinese) [Google Scholar]
  46. Guo, Y.; Zhang, J.; Yang, Y.; Zhang, H. Modeling the fluctuation patterns of monthly inbound tourist flows to China: A complex network approach. Asia Pac. J. Tour. Res. 2015, 20, 942–953. [Google Scholar] [CrossRef]
  47. Tolkach, D.; Chon, K.K.S.; Xiao, H. Asia Pacific tourism trends: Is the future ours to see? Asia Pac. J. Tour. Res. 2016, 21, 1071–1084. [Google Scholar] [CrossRef]
  48. Olmedilla, M.; Martínez-Torres, M.R.; Toral, S.L. Harvesting Big Data in social science: A methodological approach for collecting online user-generated content. Comput. Stand. Interfaces 2016, 46, 79–87. [Google Scholar] [CrossRef]
  49. Smith, M.K.; Egedy, T.; Csizmady, A.; Jancsik, A.; Olt, G.; Michalkó, G.; Kay, M.; Egedy, T.; Csizmady, A.; Jancsik, A.; et al. Non-planning and tourism consumption in Budapest’ s inner city inner city. Tour. Geogr. 2018, 20, 524–548. [Google Scholar] [CrossRef]
  50. Jin, C.; Xu, J.; Huang, Z.F.; Cao, F.D. Analyzing the characteristics of tourist flows between the scenic spots in inner city based on tourism strategies: A case study in Nanjing. Acta Geogr. Sin. 2014, 69, 1858–1870. (In Chinese) [Google Scholar]
  51. Yan, S.H.; Jin, C. Characteristics of spatial network structure of tourist flow in urban area of Luoyang. Sci. Geogr. Sin. 2019, 39, 1602–1611. [Google Scholar]
  52. Lew, A.A.; McKercher, B. Trip destinations, gateways and itineraries: The example of Hong Kong. Tour. Manag. 2002, 23, 609–621. [Google Scholar] [CrossRef]
  53. Yu, X.; Xu, H. Cultural Heritage Elements in Tourism: A Tier Structure from a Tripartite Analytical Framework. J. Destin. Mark. Manag. 2019, 13, 39–50. [Google Scholar] [CrossRef]
  54. Shin, H.B. Urban Conservation and Revalorisation of Dilapidated Historic Quarters: The Case of Nanluoguxiang in Beijing. Cities 2010, 27, S43–S54. [Google Scholar] [CrossRef]
  55. Cocola-Gant, A.; Lopez-Gay, A. Transnational gentrification, tourism and the formation of ‘foreign only’ enclaves in Barcelona. Urban Stud. 2020, 57, 3025–3043. [Google Scholar] [CrossRef]
  56. Estevens, A.; Cocola-Gant, A.; López-Gay, A.; Pavel, F. The role of the state in the touristification of Lisbon. Cities 2023, 137, 104275. [Google Scholar] [CrossRef]
Figure 1. Geographical distribution of tourist flows in Yuzhong District. (Source: the authors).
Sustainability 15 12577 g001
Figure 2. Geographical distribution of tourist flow network blocks in Yuzhong District. (Source: the authors).
Sustainability 15 12577 g002
Figure 3. Degree centrality of attractions and geographical distribution of community tourism centrality in Yuzhong District. (Source: the authors).
Sustainability 15 12577 g003
Figure 4. Geographical distribution of STRs and hotels in Yuzhong District. (Source: the authors).
Sustainability 15 12577 g004
Table 1. Explanation of the network analysis parameters used in this study.
ParameterFunctionFormula
NetworkSizeReflects the scale of a network/
DensityDescribes the level of linkages among destinations ρ = 2 m n ( n 1 )
Average path lengthDescribes the degree of separation between network nodesL = 2 n ( n 1 ) i j d i j
Degree centralisationDescribes the holistic network’s centrality; a high degree of centralisation indicates that a small number of nodes account for several connections in the networkC = i = 1 n [ D i m a x D i ] ( n 2 ) ( n 1 )
BlockmodelSuitable for detecting the communities within a network/
NodeDegree centralityThe higher the degree or the more connections per node, the more advantageous its position or the greater its effect on other nodes D i = j = 1 i A i j n 1
A i j = { 1           i f   i   i s   c o n n e c t e d   t o   j 0                                           o t h e r w i s e
Notes. n: number of nodes in the network; dij: the length of the shortest path between nodes i and j; Dimax: the largest value of degree centrality; Aij: the adjacent matrix of the network. (Sources: [9,10,13,17]).
Table 2. Results of network properties with different tourist volumes.
Network Level123456
Tourist Flow Counts≥1≥5≥10≥20≥50≥100
Share of total tourist flow counts100.00%83.26%70.51%51.58%29.09%20.54%
Average tourist flow counts7.36819.19230.02552.898121.833206.400
Number of nodes55403321137
Number of links68221811849125
Network density0.4590.2790.2230.2330.1540.238
Average path length1.5721.8762.0221.6761.7671.286
Clustering coefficient0.7280.7360.6570.8450.5870.778
Degree centralisation4.71%6.24%7.36%10.97%14.29%25.93%
Table 3. Cluster analysis result of community-attraction distance.
Type12345678
Cluster (4)960304016080
Cluster (5)1040264016032080
Cluster (6)720216088016080240
Cluster (7)7208808080802402160
Cluster (8)56012008056080240144080
Table 4. Number of communities according to community tourism centrality.
Range of Community Tourism Centrality0–1010–2020–30>30
Number of Communities (Total of 79)13173316
Table 5. Correlation coefficients of variables.
Variables12345
1. Community Tourism Centrality1
2. Commercial Gentrification0.412 **1
3. Touristification0.627 **0.709 **1
4. Density of STRs0.573 **0.478 **0.902 **1
5. Density of Hotels0.500 **0.788 **0.827 **0.527 **1
Note: ** p-value is significant at the 0.01 level (two-tailed).
Disclaimer/Publisher’s Note: The statements, opinions and data contained in all publications are solely those of the individual author(s) and contributor(s) and not of MDPI and/or the editor(s). MDPI and/or the editor(s) disclaim responsibility for any injury to people or property resulting from any ideas, methods, instructions or products referred to in the content.

