Article

Exploring the Influence of Parking Penalties on Bike-Sharing System with Willingness Constraints: A Case Study of Beijing, China

1
Key Laboratory of Transport Industry of Big Data Application Technologies for Comprehensive Transport, Ministry of Transport, Beijing Jiaotong University, Beijing 100044, China
2
School of Transportation and Logistics Engineering, Wuhan University of Technology, Wuhan 430070, China
*
Author to whom correspondence should be addressed.
Sustainability 2023, 15(16), 12526; https://doi.org/10.3390/su151612526
Submission received: 6 July 2023 / Revised: 5 August 2023 / Accepted: 14 August 2023 / Published: 17 August 2023
(This article belongs to the Special Issue Advances in Transportation Planning and Management)

Abstract

:
Dockless bike-sharing has experienced explosive growth, establishing itself as an integral component of urban public transport systems. Challenges such as parking violations have spurred operators and users to pursue standardized management. While electronic parking spots are employed to promote standard parking, suboptimal parking layouts can lead to illegal parking. Inadequate post-violation penalties fail to achieve standard parking, while excessive punishment diminishes user engagement. This study combines parking spot density and penalties to incentivize standard parking, and Beijing, China, was selected as the research object. Using an SP questionnaire survey, a binary logistic model analyzes bike-sharing users’ standard parking behavior and willingness to adhere to different rules. Findings reveal that optimal walking distances range from 300 to 450 m for service levels and exceed 400 m for service efficiency. Influential factors include gender, age, occupation, usage behavior, and travel preferences. Users with high-frequency, low-convenience expectations, low travel costs, and flexible travel exhibit strong adherence. Additionally, user acceptance of the maximum distances without penalties follows an exponential distribution, with 80% accepting 400 m and 40% accepting 800 m. Enforcement has a visible effect within 300 m, but diminishes with longer distances. Excessive penalties result in significant user loss.

1. Introduction

With the rapid process of urbanization, the proliferation of private vehicular traffic has exacerbated urban congestion. In the realm of sustainable transportation, the act of traversing on bicycles yields benefits such as emission reduction, congestion alleviation, and has provided a new solution for last-kilometer connection [1], thereby fostering the wholesome progress of cities. In alignment with the burgeoning sharing economy, bike-sharing has emerged as one of the swiftest expanding modes of transportation, boasting a remarkable annual growth rate of 37% since 2009 [2]. Leveraging the power of the internet and mobile payment platforms, bike-sharing not only retains the merits of nimble and lightweight bicycles, while offering heightened accessibility and spatiotemporal heterogeneity in the economic benefits [3], but also surmounts the issue of theft, thereby enhancing travel reliability. Nevertheless, despite the market’s enthusiastic response, it concurrently unveils a novel predicament concerning parking: the occupation of public spaces by bike-sharing [4], which escalates the expenses associated with urban space management and bicycle operation and maintenance [5]. The regulation of bike-sharing systems, particularly their parking predicament, has garnered the attention of scholars, enterprises, and governmental entities alike.
The inception of bike-sharing dates back to 1965 when public bicycles with designated parking stations were introduced in Europe. However, the limited availability of bicycles and docking stations hindered the system’s flexibility. Users were required to check the availability of bikes at fixed parking stations and return them after use, often leading to inconveniences as the stations were distant from the actual start and end points of their journeys. Moreover, the issue of full parking stations posed challenges, preventing users from returning the bicycles [6]. Consequently, in response to the limitations of docked public bicycles, dockless bike-sharing was conceived, allowing users to ride and park bikes without constraints. docked systems, dockless bike-sharing entails lower construction and operational costs. According to data released by the Chinese government website in 2017, each docking station in the traditional model requires an investment of approximately 240,000 RMB. However, this approach encroaches upon urban public spaces. Nevertheless, given that bike-sharing is still in its developmental phase, policies and scales may undergo significant transformations in the near future, potentially leading to the addition or adjustment of new stages.
In terms of regulatory measures, the current stage of standardized bike-sharing predominantly employs electronic fence technology, utilizing GPS [7] or Bluetooth within urban areas to establish a judicious allocation of virtual parking spots. Users are required to park their bikes within these designated areas [8]; otherwise, penalties are imposed. This virtual ‘electronic fence’ supplants traditional docking systems [9], facilitating flexible layout adjustments and reducing facility construction costs. A bike-sharing system, which has effective designated parking spots in the effects of built environment factors [10], manages the occupation of public space while leveraging the combined advantages of the two preceding bicycle models to overcome their respective shortcomings. However, if the placement of parking spots proves unreasonable and fails to meet the convenience requirements for bike-sharing usage, users may struggle to adhere to the regulations enforced by the ‘electronic fence’, leading to parking violations. Su et al. discovered that the implementation of punitive measures can effectively regulate users’ parking behavior [11]. Nevertheless, another study by Zhao et al. examines the regulation of user behavior through punishment and constraint [12], highlighting that unscientific penalties and constraints can significantly reduce the utilization rate of bike-sharing and result in user attrition.
In conclusion, this study proposes a research approach that combines parking layout and punishment constraint to regulate user behavior. Through an investigation of bike-sharing usage behavior and parking intentions, optimal density and optimal punishment measures are calculated, allowing for the optimization of bike-sharing parking spot layouts and the promotion of standard parking practices. These findings serve as a valuable reference for government agencies and operating companies.
The remainder of this paper is organized as follows. Section 2 conducts a review of the relevant literature on parking spot layouts and the impact of rewards and punishments on parking behavior. We present the research procedures and experimental design in Section 3. The modeling of the effect of a parking spot layout on parking behavior under penalty conditions is in Section 4. Finally, Section 5 offers some managerial insights and concluding remarks.

2. Literature Review

2.1. Parking Spot System Layout Design

Currently, the scholarly investigation of a bike-sharing parking layout predominantly revolves around model establishment, with a relatively standardized research framework. This framework entails utilizing surveys to analyze location indices, optimizing the layout by solving models that prioritize maximum satisfaction rates and minimal construction costs as constraints, and validating the results through case studies. For instance, Zhang et al. meticulously quantified electronic fence planning for dockless bike-sharing by developing a methodological framework [13]. Du et al. utilized the random forest supervised learning algorithm to extract pertinent features influencing the utilization and return of bike-sharing in specific urban areas [14], identifying time-varying characteristics of location usage patterns at a micro level. Existing studies on parking network design primarily aimed to determine the placement and capacity of parking spots [15]. Nearly all bike network design models incorporate spot location decisions, as the final location significantly impacts the required coverage of the bike-sharing service—an essential design attribute. Additionally, the placement of bike-sharing spots could be influenced by the presence of co-existing traffic systems [16]. Some scholars have also investigated bike-sharing usage and parking factors through questionnaire surveys. The framework devised by Yang and Long revealed that factors such as environmental responsibility, improvement of public transportation systems, considerations of health and safety, and awareness of environmental crises exert a notable influence on individuals’ willingness to participate in public bicycle projects [17]. Gao et al. (2023) leveraged accumulated effect analysis for examining the complex (nonlinear and interactive) effects of correlated built environment factors on the usage of bike-sharing [18]. Constructing a parking behavior model must consider various factors: users’ attributes, bike usage patterns, sharing economy perspectives, and transportation positions. Existing research shows benefits: enhancing public transportation, diversifying travel options, yielding economic and environmental advantages, and revitalizing cycling.
The examination of travel behavior frequently encompasses the consideration of travel economics, with a focus on quantifying costs and employing multi-level, multi-stage models to simulate the impact of bike-sharing usage on the overall operational dynamics of urban transportation networks. Small and Carrion and Levinson delved into the traveler’s willingness to pay for time reliability, emphasizing the role of penalties in influencing the perceived value of uncertain travel times [19,20]. Hosseini and MirHassani introduced a two-stage random location model that transitioned from mobile positioning to analyze intercity networks in Arizona [21]. In the realm of urban public bicycles, Yang et al. proposed a multi-layer coupled spatial network model based on empirical data [22], revealing two factors that alleviate transfer pressure and enhance the uniformity of the public transport network. Additionally, the design of economically sustainable parking station networks often involves considering operator profits and investment costs. Frade and Ribeiro employed an optimization framework to design a bike-sharing system that maximized demand coverage while adhering to budgetary constraints [23]. By incorporating these various factors into the design process, researchers aim to develop efficient and financially viable bike-sharing networks.
In addition to mathematical models, Geographic Information Systems (GIS) have been widely utilized in the design of parking spot networks [24]. GIS provides a valuable tool for assessing the quality of bike infrastructure, analyzing the potential distribution of demand [25], and determining the spatial distribution and overall volume of trips based on factors such as street networks, buildings, traffic areas, and designated station areas [26]. Furthermore, GIS with other multi-target algorithms can help identify areas with insufficient bicycle facilities or parking spots [27], enabling the identification of potential candidate locations for spot placement. GIS could also investigate the travel pattern and trip purpose of the users by combining bike-sharing data and points of interest (POIs) [28]. While GIS offers significant advantages in identifying suitable locations and analyzing demand, it is important to acknowledge that its use may introduce additional challenges. These challenges include the collection and processing of extensive data and the increased complexity in designing models. Nonetheless, GIS remains a valuable tool for enhancing the precision and effectiveness of parking spot network design.

2.2. Parking Behaviors under Monetary Incentives

Currently, the focal point of bike-sharing management lies in the design of parking spot layouts, with the average spacing between parking spots serving as a key factor. As dockless bike-sharing differs from traditional public bike systems, existing research on spot planning for dockless bike-sharing facilities offers valuable insights for this study. Several approaches employed in previous research can be applied here, such as service level analysis [29], bicycle compatibility index assessment [30], and spots layout design [31]. Expanding the layout radius can enhance the efficiency of bike-sharing utilization and reduce operational costs, but it may also lead to an increase in parking violations. Conversely, reducing the layout radius can improve the service level of bike-sharing and decrease parking violations. However, setting the layout radius too small would undermine the goal of effectively managing bike-sharing systems. Striking the right balance is crucial to ensure both efficient utilization and effective management of bike-sharing resources.
Previous research on parking violation behavior in various transportation modes has shown the potential of economic incentives to influence bike-sharing parking practices. Hess and Polak developed a mixed logit model to explore parking violations under different conditions [32]. Morillo and Campos emphasized the importance of curbing street parking violations to enhance road capacity [33]. However, Lu et al. found limited effectiveness of warning messages in deterring parking violations [34]. Studies on travel mode selection and behavior have also shown the influence of economic factors. Zhang et al. investigated the impact of cost disparity on users’ cycling behaviors [35]. The consensus is that economic interventions can significantly influence travel behavior and enhance alternative transportation modes. Economic interventions shape travel behavior; integrating incentives in bike-sharing parking fosters responsible practices and sustainability.
Scholarly works highlight monetary incentives’ potential in controlling bike-sharing parking behavior. Within the realm of bike-sharing, Shi et al. used social network analysis to examine influential factors in the bike-sharing system [36]. Shui and Szeto (2020) highlighted the economic benefits at various levels [37], while Pfrommer et al. optimized sharing system efficiency through intelligent route decision-making and price incentives [38]. They developed an effective mechanism for seamless system operation through intelligent route decision-making and real-time price incentives. Wang et al. have illuminated the indirect impact of social norms on users’ attitudes toward standard parking [5], highlighting the role of individual norms. By employing the mixed logit model, Gao et al. explored the bandwagon effect of economic measures on bike-sharing users [39]. Their findings reveal that increasing incentive intensity makes rewards more effective, but unscientific penalties limit bike-sharing adoption as a transportation mode. Médard de Chardon discussed the complexities of deploying bike-sharing systems and the unequal distribution of benefits [40]. Zhao and Wang investigated the determinants of disorderly parking and the importance of collaboration in promoting standard parking practices [41].
In conclusion, considerable research has been devoted to the design of bike-sharing parking spot layouts, with a prevailing consensus on the efficacy of employing reward and punishment mechanisms as regulatory constraints for users. However, the question of punishment intensity has been insufficiently addressed, neglecting the nuanced consideration of appropriate punitive measures corresponding to the diverse spatial layouts of parking positions, which are instrumental in achieving the desired outcomes of regulating users’ parking behavior. Furthermore, in terms of user acceptance, the optimization of bike-sharing layouts fails to account for the acceptable distance limitations associated with users’ adherence to standard parking behavior, thereby lacking a comprehensive strategy that optimally balances the imperatives of effectiveness and acceptability in coordination.

3. Methodology

In the optimization problem of parking spot layouts, the higher the parking spot density, the shorter the walking distance for accessing bike-sharing, resulting in greater convenience of use and a stronger willingness to standard parking. Conversely, a lower parking spot density leads to longer walking distances, making it less convenient and increasing the tendency for parking violations.
Bike-sharing systems in Beijing were selected as the sample objects. As the capital of the People’s Republic of China and the second most populous city in the world, Beijing is the first operating city of bike-sharing in China. Meanwhile, Beijing is a typical city with intense competition among different shared mobility services [42].
As a green and environmentally-friendly way for travel, bike-sharing has achieved rapid development since entering the market. It was launched in October 2016, and in less than 10 months, there were a total of 2.35 million bikes operated by 16 bike-sharing companies in Beijing [43]. However, the problem of disorderly parking has also aroused great attention from the government [41]. In October 2018, the Beijing Municipal Commission of Transport issued ‘The service quality of shared bikes operation (trial)’, and formulated the special regulation action manual for the control of disorderly parking of bike-sharing. Beijing restricted the volume of operated bike-sharing in the city to a total of 1.91 million bicycles from nine operators with an average of 1.42 million rides per day [44]. It remarked that the Beijing bike-sharing system had experienced three stages [45]: from public bicycles to dockless bike-sharing, and then to bike-sharing with electronic fences.

3.1. Spot Radius Computation

In an earnest endeavor to examine the tangible impact of spot density arrangements, we employed Beijing as a case study to determine whether a critical density threshold exists, facilitating judicious control of parking spot density to encourage users’ inclination toward standard parking while concurrently conserving urban parking space. Information encompassing 2775 public bicycle stations, including their respective names, quantity of available locks, geographic coordinates, and administrative regions, was scrupulously sourced from the official website of the Beijing Municipal Commission of Transport. In order for the sample to be representative, the survey follows a spatially stratified strategy covering the 16 districts in Beijing. The bike-sharing system stations were spread across the city, and each district has homogeneity with respect to the intensity of bike-sharing spots use.
In this paper, the main methods for calculating the presence of spots around spot A are as follows. Let d be the walking distance from spot A to spot B:
(1) Spots in high-density areas
Proposition 1.
If spot B relative to spot A is in high-density areas (blue route in the square), as shown in Figure 1, then the field walking distance from A to B must meet the range d.
Proof. 
Considering the non-linear coefficient brought by the road network streets, the distance between spot A and spot B can be at most A ¯ P ¯ 1 + P ¯ 1 B ¯ by Equation (1). Therefore, in the small square area with d as the side length, if A ¯ P ¯ 1 + P ¯ 1 B ¯ d , then:
d sin θ + d cos θ = 2 d sin ( θ + α ) 2 d
 □
(2) Spots in medium-density areas
Proposition 2.
If spot B is relative to spot A in the medium-density areas (orange route in the circle), as shown in Figure 1, then the field walking distance from A to B may be less than d, and the possibility is calculated by the non-linear coefficient of the road network.
Proof. 
Draw a square with 2d as the side length, and then look for the range within which the linear distance is less than d according to the difference between latitude and longitude. That is, d is the large circle of radius in Figure 1, and point C is in the circle. Although the linear distance A ¯ C ¯ meets the range d, considering the nonlinearity of the urban road network, the field journey from A to C may not be within the range d. □
The distance scalar difference between the north–south and east–west directions can be calculated according to the difference of latitude and longitude, using the formula in Equation (2).
{ | A w B w | = 180 d π 1000 R , A j = B j | A j B j | = 180 π a r c cos [ cos ( d 1000 R ) 1 cos 2 ( A w π 180 ) + 1 ] , A w = B w
where |AwBw| indicates the latitude difference between spot A and spot B, |AjBj| indicates the longitude difference between spot A and spot B, and R is the radius of the earth at 6371 km.
(3) Spots in low-density areas
Proposition 3.
If spot B relative to spot A is in the low-density areas (green route out of the circle), as shown in Figure 1, then the field walking distance from A to B cannot be within the range d.
Proof. 
At the point D outside the great circle, since the linear distance A ¯ D ¯ between D and A is greater than d, it is impossible for the field journey from A to D to be within the scope of d. □
In order to gauge the probability of locating a spot at a specific distance, an average value for the non-linear coefficient is employed. Leveraging the principles of classical probability, the probability of spot discovery at distance d can be calculated by following the subsequent formula.
{ P d = π ( d / C n l ) 2 π d 2 = 0.411 P > d = 1 P d = 0.589
where Cnl is the average value of the non-linear coefficient of the city’s bus lines, and Cnl = 1.56 for Beijing [46,47]. P≤d is the probability of finding the spot within distance d; P>d is the probability of finding the spot beyond distance d.
On the one hand, the utilization of the full probability formula allows for an assessment of the service level offered by the existing bike-sharing system within the city. Using Equation (4), the probability Ps≤d of successfully meeting the parking demand within a specified walking distance d is calculated. On the other hand, applying the Bayes formula enables an evaluation of the actual operational efficiency of the bike-sharing system within this density configuration. Using Equation (5), the probability Phd/s≤d of users unequivocally being able to park their bikes in the designated spot within a walking distance s is determined.
P s d = P h d α 1 + P m d α 2 + P l d α 3
P h d / s d = P s d / h d P h d / P s d
where Ps≤d is the probability that the user could find someplace to meet the parking demand within d; Phd, Pmd, Pld are the percentage of three kinds of spots with different satisfied situations; α1, α2, α3, are the probabilities that the user could find spots to park their bikes in three different spot situations, one choice for the value of the parameter is (1, P≤d, 0).

3.2. Questionnaire Design

There is an extensive empirical literature that uses stated preference (SP) surveys to study travel behavior [48,49,50]. Therefore, the setting for the observed behavior is more realistic. Especially in the context of our study, surveys can cause subjects to exhibit parking violations. Different parking spot layout radii require varying degrees of penalties for effective regulation, but excessively severe penalties may lead to a loss of bike-sharing users. Therefore, we designed an SP questionnaire survey to investigate these two issues. We conducted the questionnaire survey through the WeChat app in July, 2021.
Only bike-sharing system users can receive this questionnaire and answer it. Respondents in the questionnaire were faced with multiple SP scenarios that they usually experience on their bike-sharing parking behavior, for example:
If you are currently 2 min (150 m) walking distance away from the nearest parking spot, but you can park here by paying an extra 0.5 RMB. Are you willing to park directly?
(A) pay and park directly; (B) go to the parking spot.
The walking time mentioned in the question is used to help respondents estimate the walking distance. If choice (A) is selected, which is considered a parking violation, the next question will present in the same distance but with an increased penalty amount. If choice (B) is selected, which is considered standard parking, the questionnaire will jump to the SP scenario with a longer distance. To obtain the corresponding binary decisions for the 48 SP hypotheses within the questionnaire, independent logical judgments were made based on 217 data points, resulting in a total of 10,416 0–1 judgments.
Reliability and validity indices were computed for the 217 valid questionnaires to ensure the randomness and scientific validity of the collected data. The results revealed a Cronbach’s alpha coefficient of 0.928, indicating high internal consistency. The α value remained stable even after removing individual questions. Moreover, the questionnaire’s factor analysis (EFA) yielded a Kaiser–Meyer–Olkin (KMO) value of 0.603, and the cumulative variance of the standardized factor loading reached 54.592%, meeting the standard requirements for index values.
Due to the limited scope of the questionnaire, this survey encompasses nine categorical variables and five continuous variables. The modeling variables involved in this survey questionnaire are encoded as shown in Table 1, The categorical variables are coded as dummy variables, and the continuous variables are coded as numerical.
Through an examination of the independent variables in the survey, it has been determined that each variable exhibits a tolerance significantly surpassing 0.1, while the VIF remains below 10. Most studies on bike-sharing usage consider the correlation between variables essential, as it serves as a crucial link in verifying data and establishing predictive models [51]. The all variables’ Pearson correlation coefficient lies beneath 0.6, thereby affirming the appropriateness of the correlation among model variables.
Mean values can be used to observe respondents’ agreement levels for each option, and the standard deviation can be used to observe the degree of convergence in their choices. All variables display an absolute skewness below 2, and their absolute kurtosis is substantially lower than 10, except DTC, signifying the conformity of the questionnaire design and the collected data to a multivariate normal distribution. The descriptive statistical table for continuous variables is shown in Table 2.
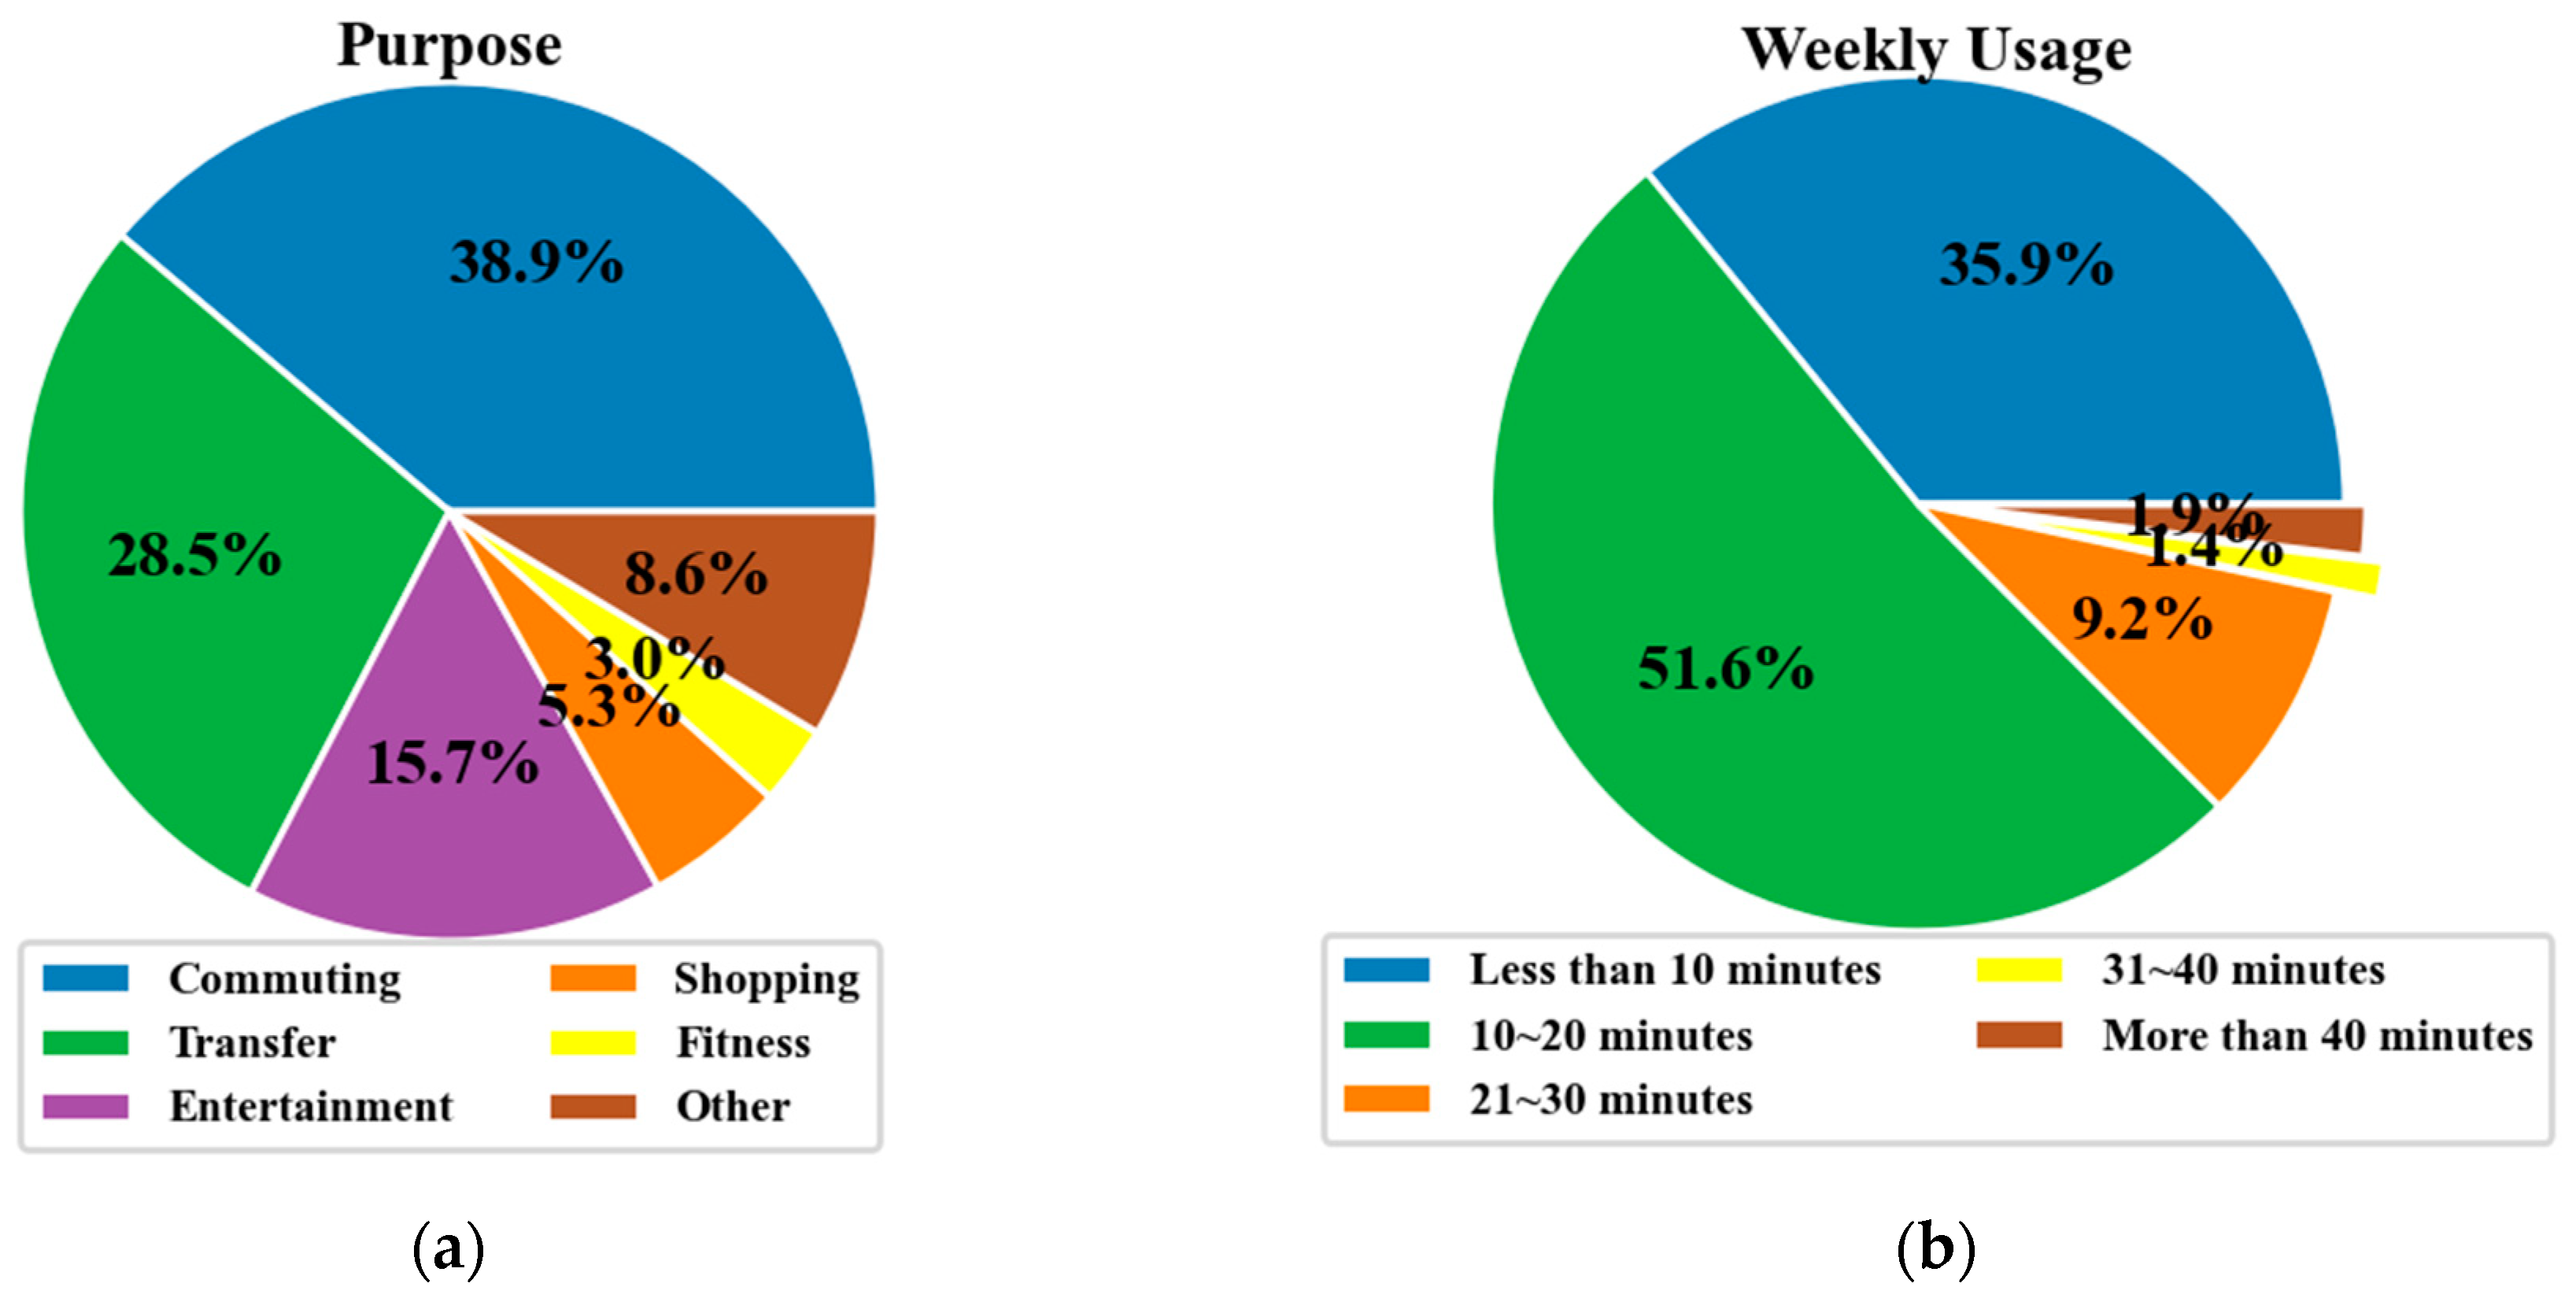
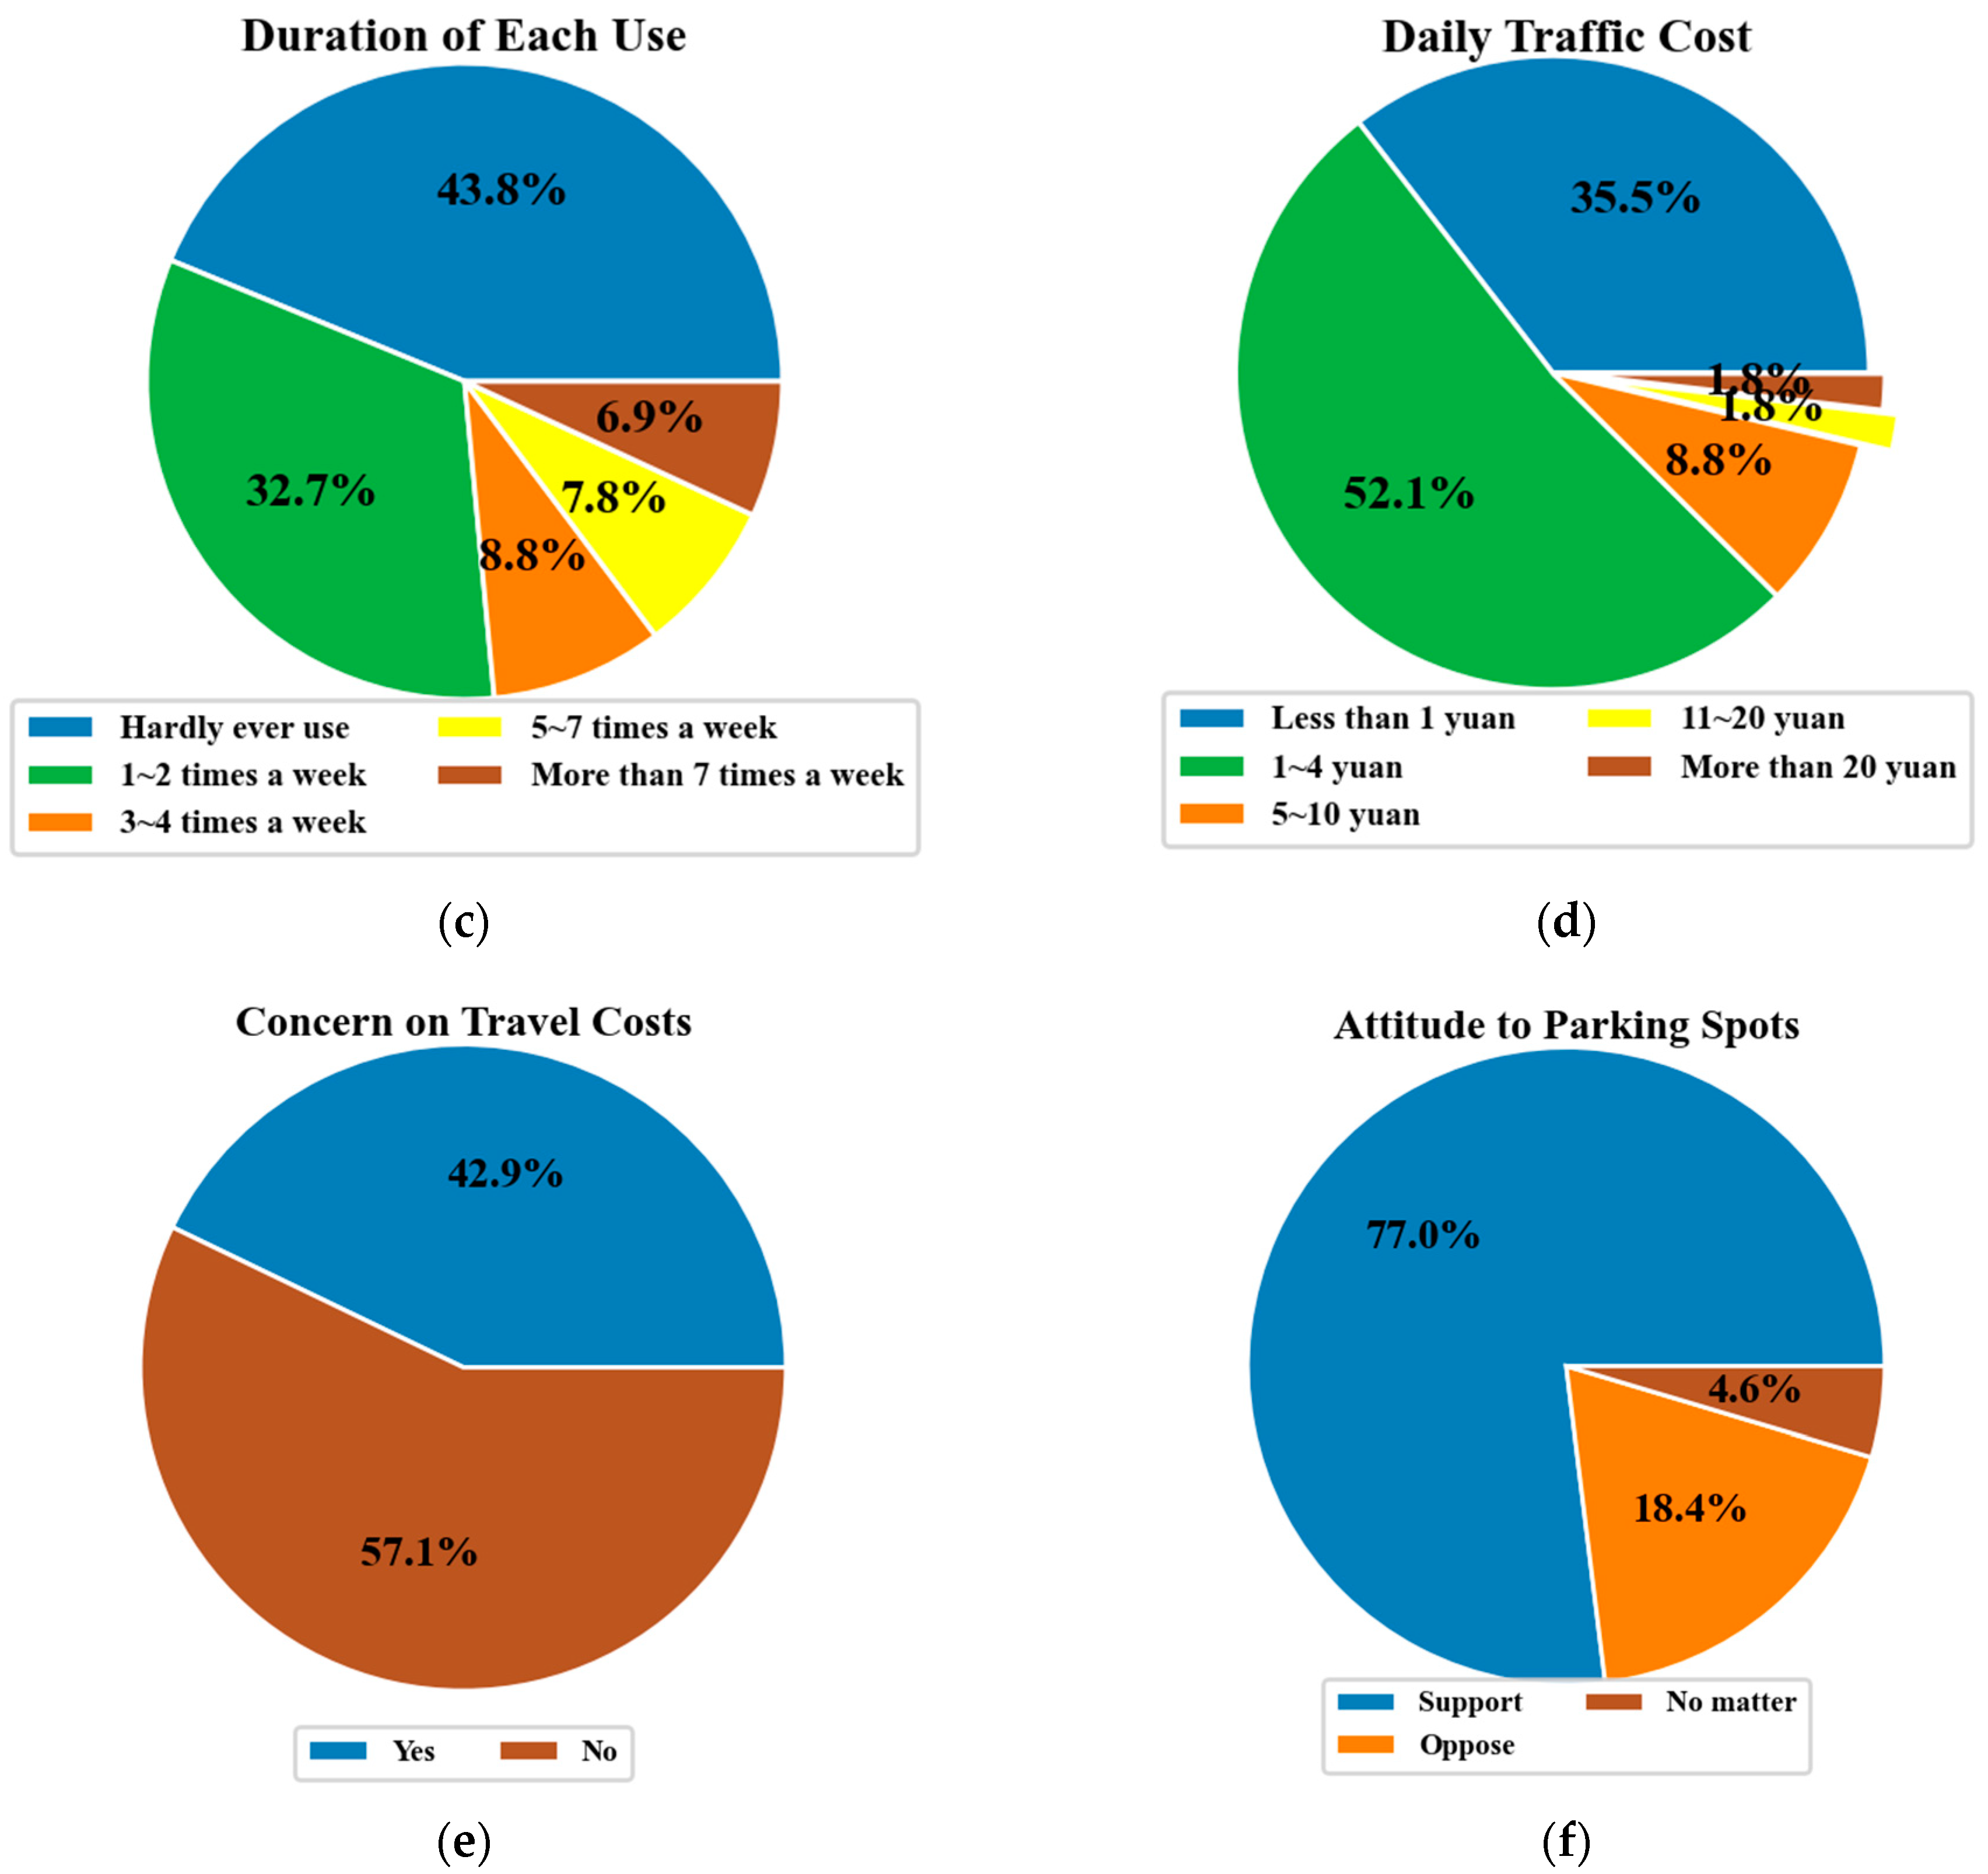
The collection of personal information and usage behavior data is illustrated in Figure 2. While acknowledging potential biases introduced by the questionnaire distribution method, it is noteworthy that the questionnaire recipients predominantly represent the target demographic of bike-sharing, which is closely intertwined with the internet era. Furthermore, a substantial proportion of young individuals, who exhibit a heightened sensitivity toward travel expenditures, are captured in the survey sample.
  • The statistical chart presented above reveals several noteworthy characteristics regarding the usage behavior of bike-sharing users:
  • Users who utilize bike-sharing for commuting purposes (60.37%) and connecting trips (44.24%) tend to engage in more inflexible journeys. In contrast, those who employ bike-sharing for leisure activities (24.42%) and shopping (8.29%) exhibit greater susceptibility to control restrictions.
  • The majority of users (over 60%) utilize bike-sharing less than three times per week. This can be attributed to the increasing stringency of bike-sharing regulations, leading to restricted access in courtyards and parks, consequently diminishing its popularity.
  • A significant portion of users (87.55%) utilize bike-sharing for trips lasting less than 20 min. This signifies that bike-sharing mainly serves as a mode of transportation for short to medium distances, complementing longer-distance travel options and competing with other short to medium-distance modes of transportation.
  • Over 80% of users report a daily travel cost of less than CNY 4. This specific group’s characteristics are indicative of their sensitivity toward parking violation penalties, implying that fines may heighten users’ attention toward travel expenses.
The survey reveals noteworthy characteristics of bike-sharing users’ behavior, showing that different user groups have varying preferences for trip purposes and travel frequency. Bike-sharing is predominantly used for short to medium distances, and most users are sensitive to travel costs, making them attentive to parking violation penalties.

4. Parking Behavior Promotion Balancing the Penalty and Willingness Constraints

Managing bike-sharing systems solely through parking spot layout is insufficient. The incorporation of punitive measures becomes imperative to regulate user behavior. However, imposing excessive penalties may deter users from utilizing bike-sharing services. Hence, there is a need to explore the development of an effective and balanced punitive mechanism. In this chapter, we establish a binary logistic model using the SP questionnaire survey.

4.1. Variable Analysis

In this study, a binary logistic model was employed to analyze the bike-sharing user selection outcomes under various hypothetical scenarios. The omnibus model coefficient comprehensive test table revealed a significance level of 0.032, indicating that the model has overall statistical significance. Additionally, the goodness-of-fit output significance was found to be 0.134, suggesting that the data have been adequately extracted and the model fits well.
To assess the model’s predictive performance, 87.5% of the dataset was randomly selected as the test set, and a standard parking threshold of 0.5 was utilized. By comparing the predicted results with the actual data, it was observed that 7299 out of 9114 sample data points were accurately predicted, resulting in a prediction accuracy of 80.09%. These findings indicate that the model exhibits strong predictive capabilities.
Furthermore, the study examined the receiver operating characteristic (ROC) curve at different standard parking thresholds. The ROC curve, positioned near the upper-left corner, demonstrated an area under the curve (AUC) value of 0.778. This indicates that the binary logistic model established in this research is well-fitted and can effectively mitigate the p-hacking problem to a certain extent.
In this study, the ‘Forward: LR’ technique is employed to conduct variable selection during the modeling phase. The parameters within the model are analyzed as follows.
(1) Single-choice categorical variable
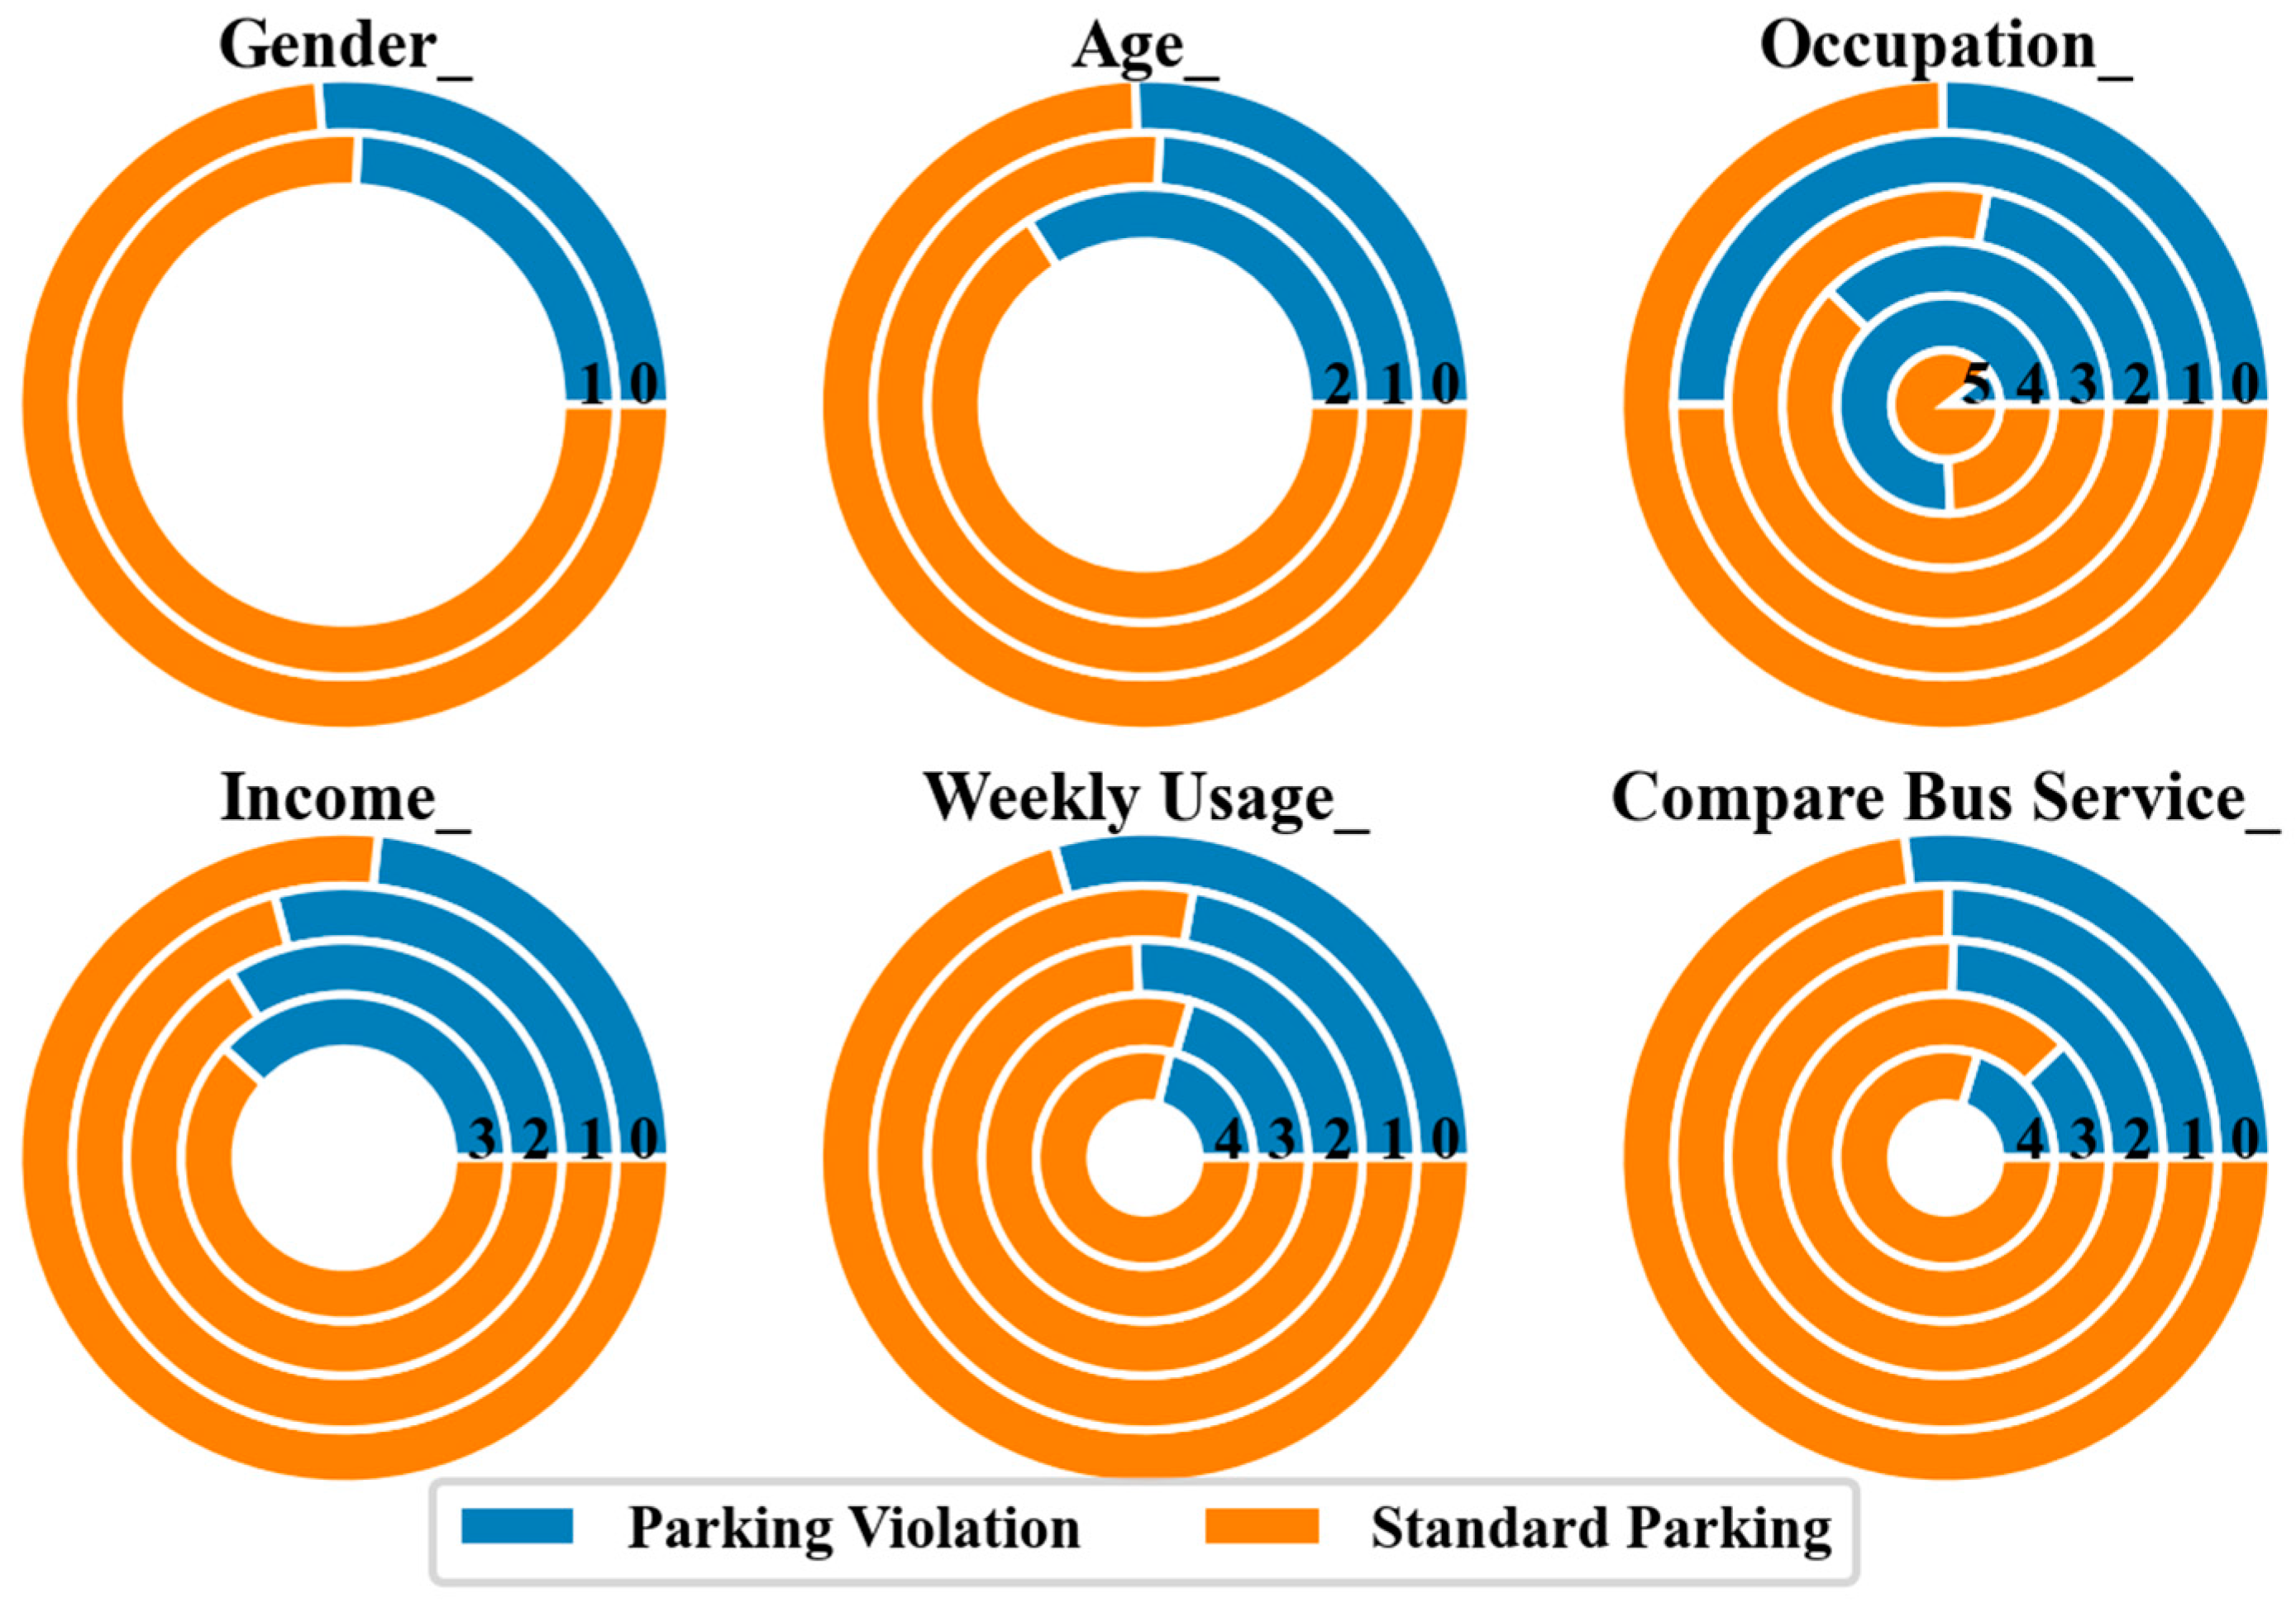
From Table 3, the influence of categorical variables can be observed, and their impact on walking distance and parking penalty incentives is illustrated in Figure 3:
  • Female users exhibit a lower inclination to walk the additional distance for standard parking compared to male users (0.887 times). This discrepancy implies that gender-based physical differences contribute to varying levels of acceptance toward walking.
  • Middle-aged and elderly users display a greater willingness to walk extra distances for standard parking compared to young users (1.65–1.70 times). This suggests that older users are more sensitive to fines and prefer to avoid penalties by investing more time in reaching designated parking spots.
  • Freelancers exhibit a preference for the convenience offered by parking violations (0.083 times) compared to students and enterprise employees (1.827 times). Conversely, other professionals demonstrate a heightened sensitivity to punishment and opt for standard parking (4.231 times).
  • High-income users demonstrate a decreasing probability of adhering to standard parking (0.470–0.480 times) compared to medium-income users (0.859 times), in contrast to low-income users. This trend suggests that individuals with higher incomes prioritize time and show reduced sensitivity to penalties.
  • Users with slightly higher frequencies of bike-sharing display a lower willingness to walk extra distances for standard parking (0.862 times), indicating their readiness to incur fines in exchange for convenience during recreational trips. On the other hand, users with higher frequencies of bike-sharing are more likely to adhere to standard parking (1.706 times), implying that they encounter fewer parking violations during their daily commutes.
  • Users with high expectations of convenience are less inclined towards standard parking, as they perceive bike-sharing to be more convenient than buses (0.850–0.865 times). In contrast, users with low expectations consider the convenience of bike-sharing to be comparable or even lower than that of buses, making them more willing to adhere to standard parking (1.360–5.560 times).
(2) Multiple-choice categorical variable
The multi-choice variable of riding purpose is analyzed using a cross-list of multiple responses, as presented in Table 4, and the response rate represents the standard parking response rate for multiple-choice questions. It is observed that the propensity for parking violations varies among different purposes. Shopping trips exhibit the lowest inclination for parking violations, accounting for only 13.2% of cases. On the other hand, commuting and connection purposes display the highest propensity, with rates of 25.1% and 25.4%, respectively. This indicates that travel with rigid constraints imposed by parking spots is less flexible than elastic travel, which necessitates higher parking density and more stringent penalties.
(3) Continuous variable
As indicated by the numerical variable parameters presented in Table 5, variations in walking distance and parking penalty incentives yield the following insights:
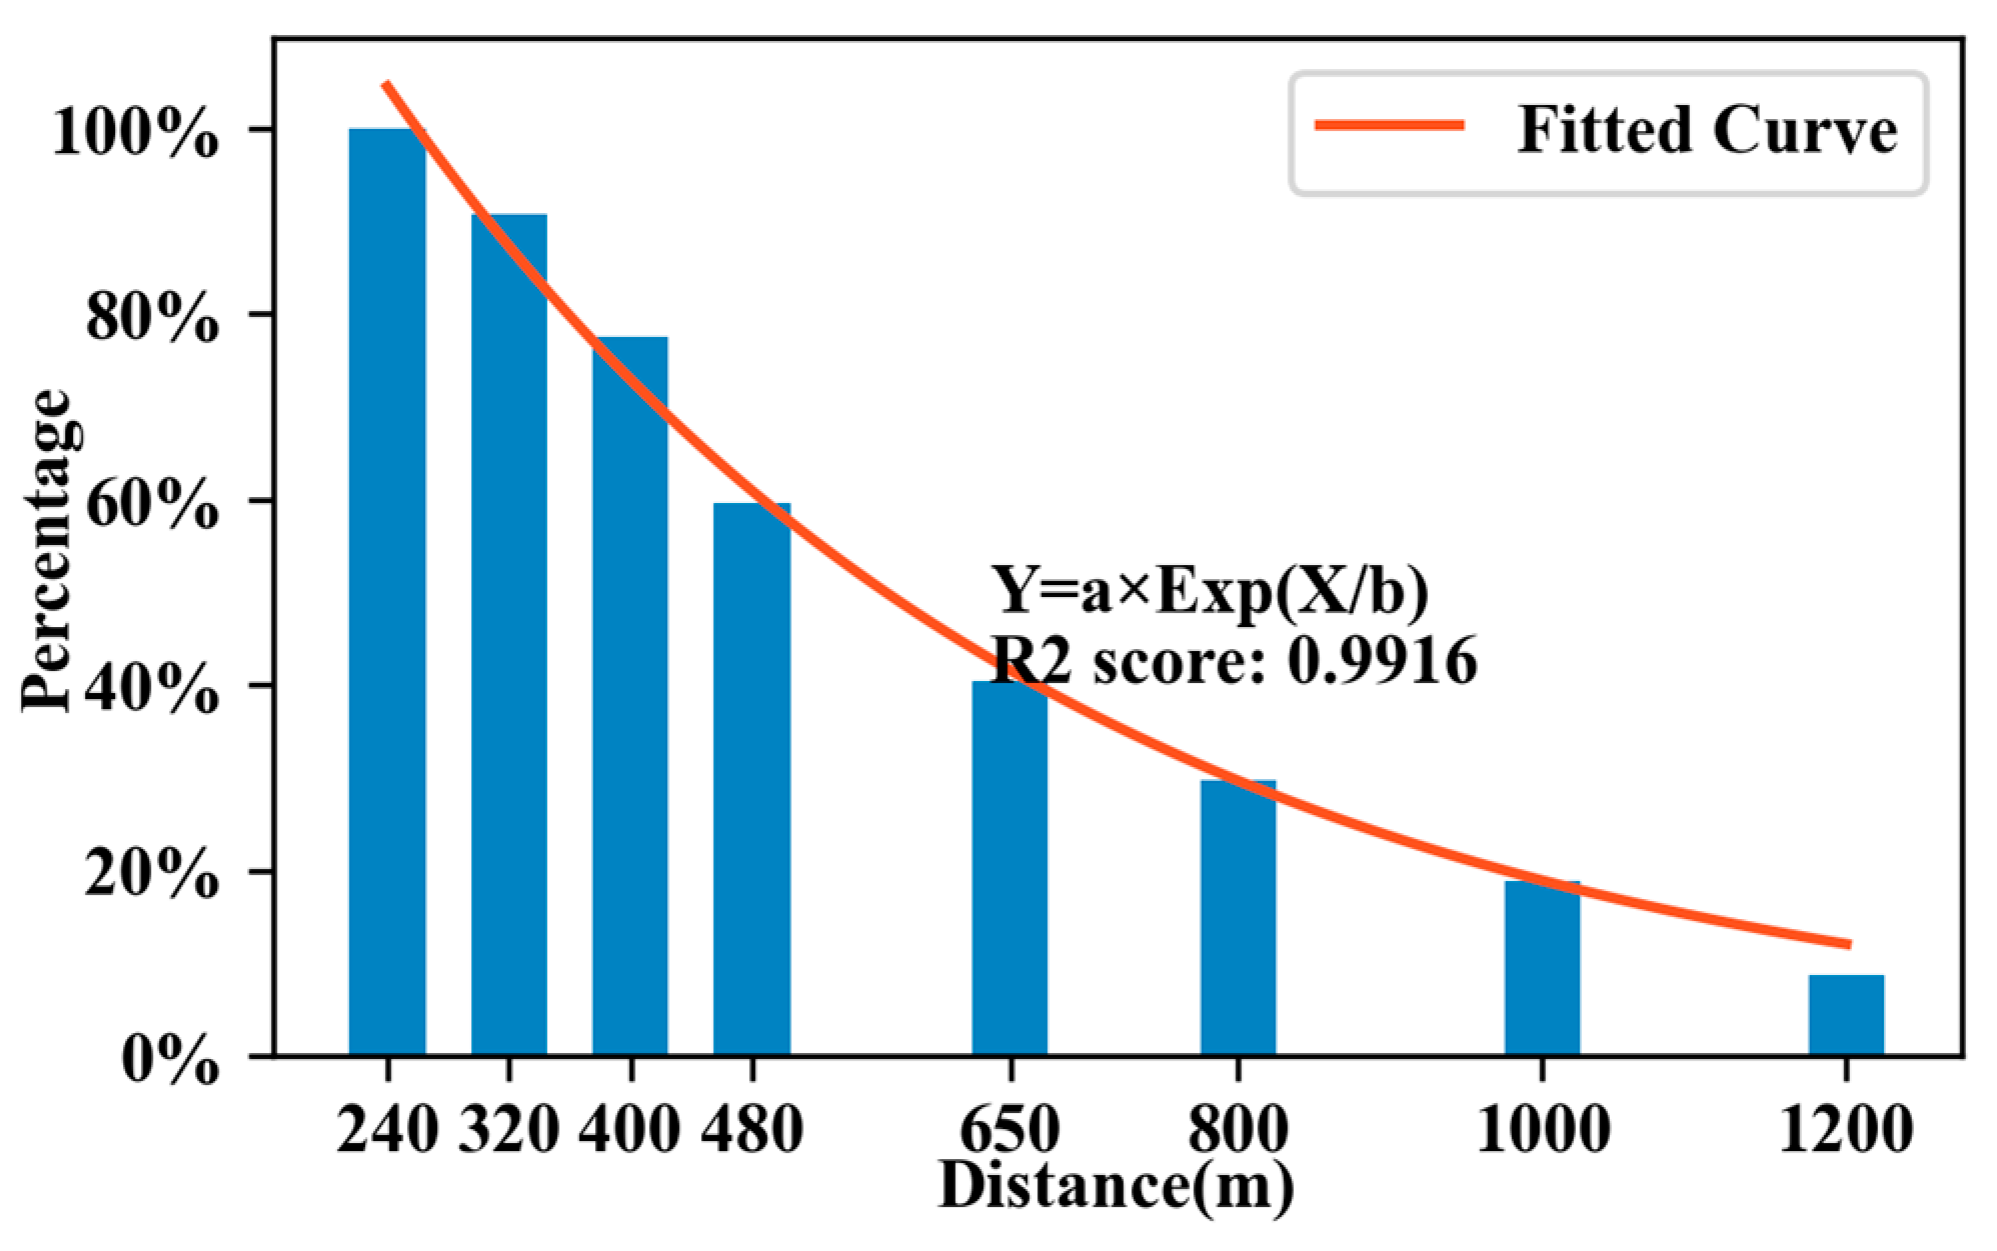
  • The duration of each bike-sharing use and the maximum walking distance positively correlate with users’ inclination towards standard parking. As the bike-sharing system’s service level improves, increased satisfaction and loyalty promote a preference for standard parking. The cumulative percentage of the maximum walking distance is depicted in Figure 4, demonstrating a well-fitted exponential function with an impressive R2 value of 0.9888. In the absence of penalties, 80% of users are willing to accept a maximum limit of 400 m, while 40% can accept a limit of 800 m. The parking radius should not be excessively large for users with an average usage time of less than 15 min, typically engaged in short or connecting trips.
  • The daily travel cost negatively correlates with users’ choice of standard parking. A decreased sensitivity to travel costs weakens the restraining effect of parking violation penalties. The positive normative impact of increased fines (2.216 times) outweighs the violation effect of an increased walking distance (0.998 times). This implies that increasing walking distance through well-designed punishment rules is feasible. When users’ daily travel costs amount to less than CNY 3, indicating a low expected price for bike-sharing, constraints imposed by cost considerations become more significant. Excessive penalties for parking violations may lead to user attrition.

4.2. Spot Radius without Penalty

To regulate and standardize bike-sharing parking behavior, some areas have implemented a radius constraint on the layout of electronic parking spots. Without penalty conditions, as the parking spot radius increases, the reduction in the actual number of parking spots raises parking costs and undermines user convenience, which may lead to a trend of non-compliance, thereby increasing the probability of a parking violation. Bike-sharing enthusiasts demonstrate a remarkable sensitivity to the distances they must traverse in their quest for two-wheeled exploration. Within the context of establishing electronic parking stations, certain individuals deviate from the prescribed guidelines, leading to the unfortunate occurrence of parking violations. Thus, it becomes imperative to determine an optimal layout radius that aligns with users’ anticipated parking distances and psychological expectations regarding bike-sharing utilization.
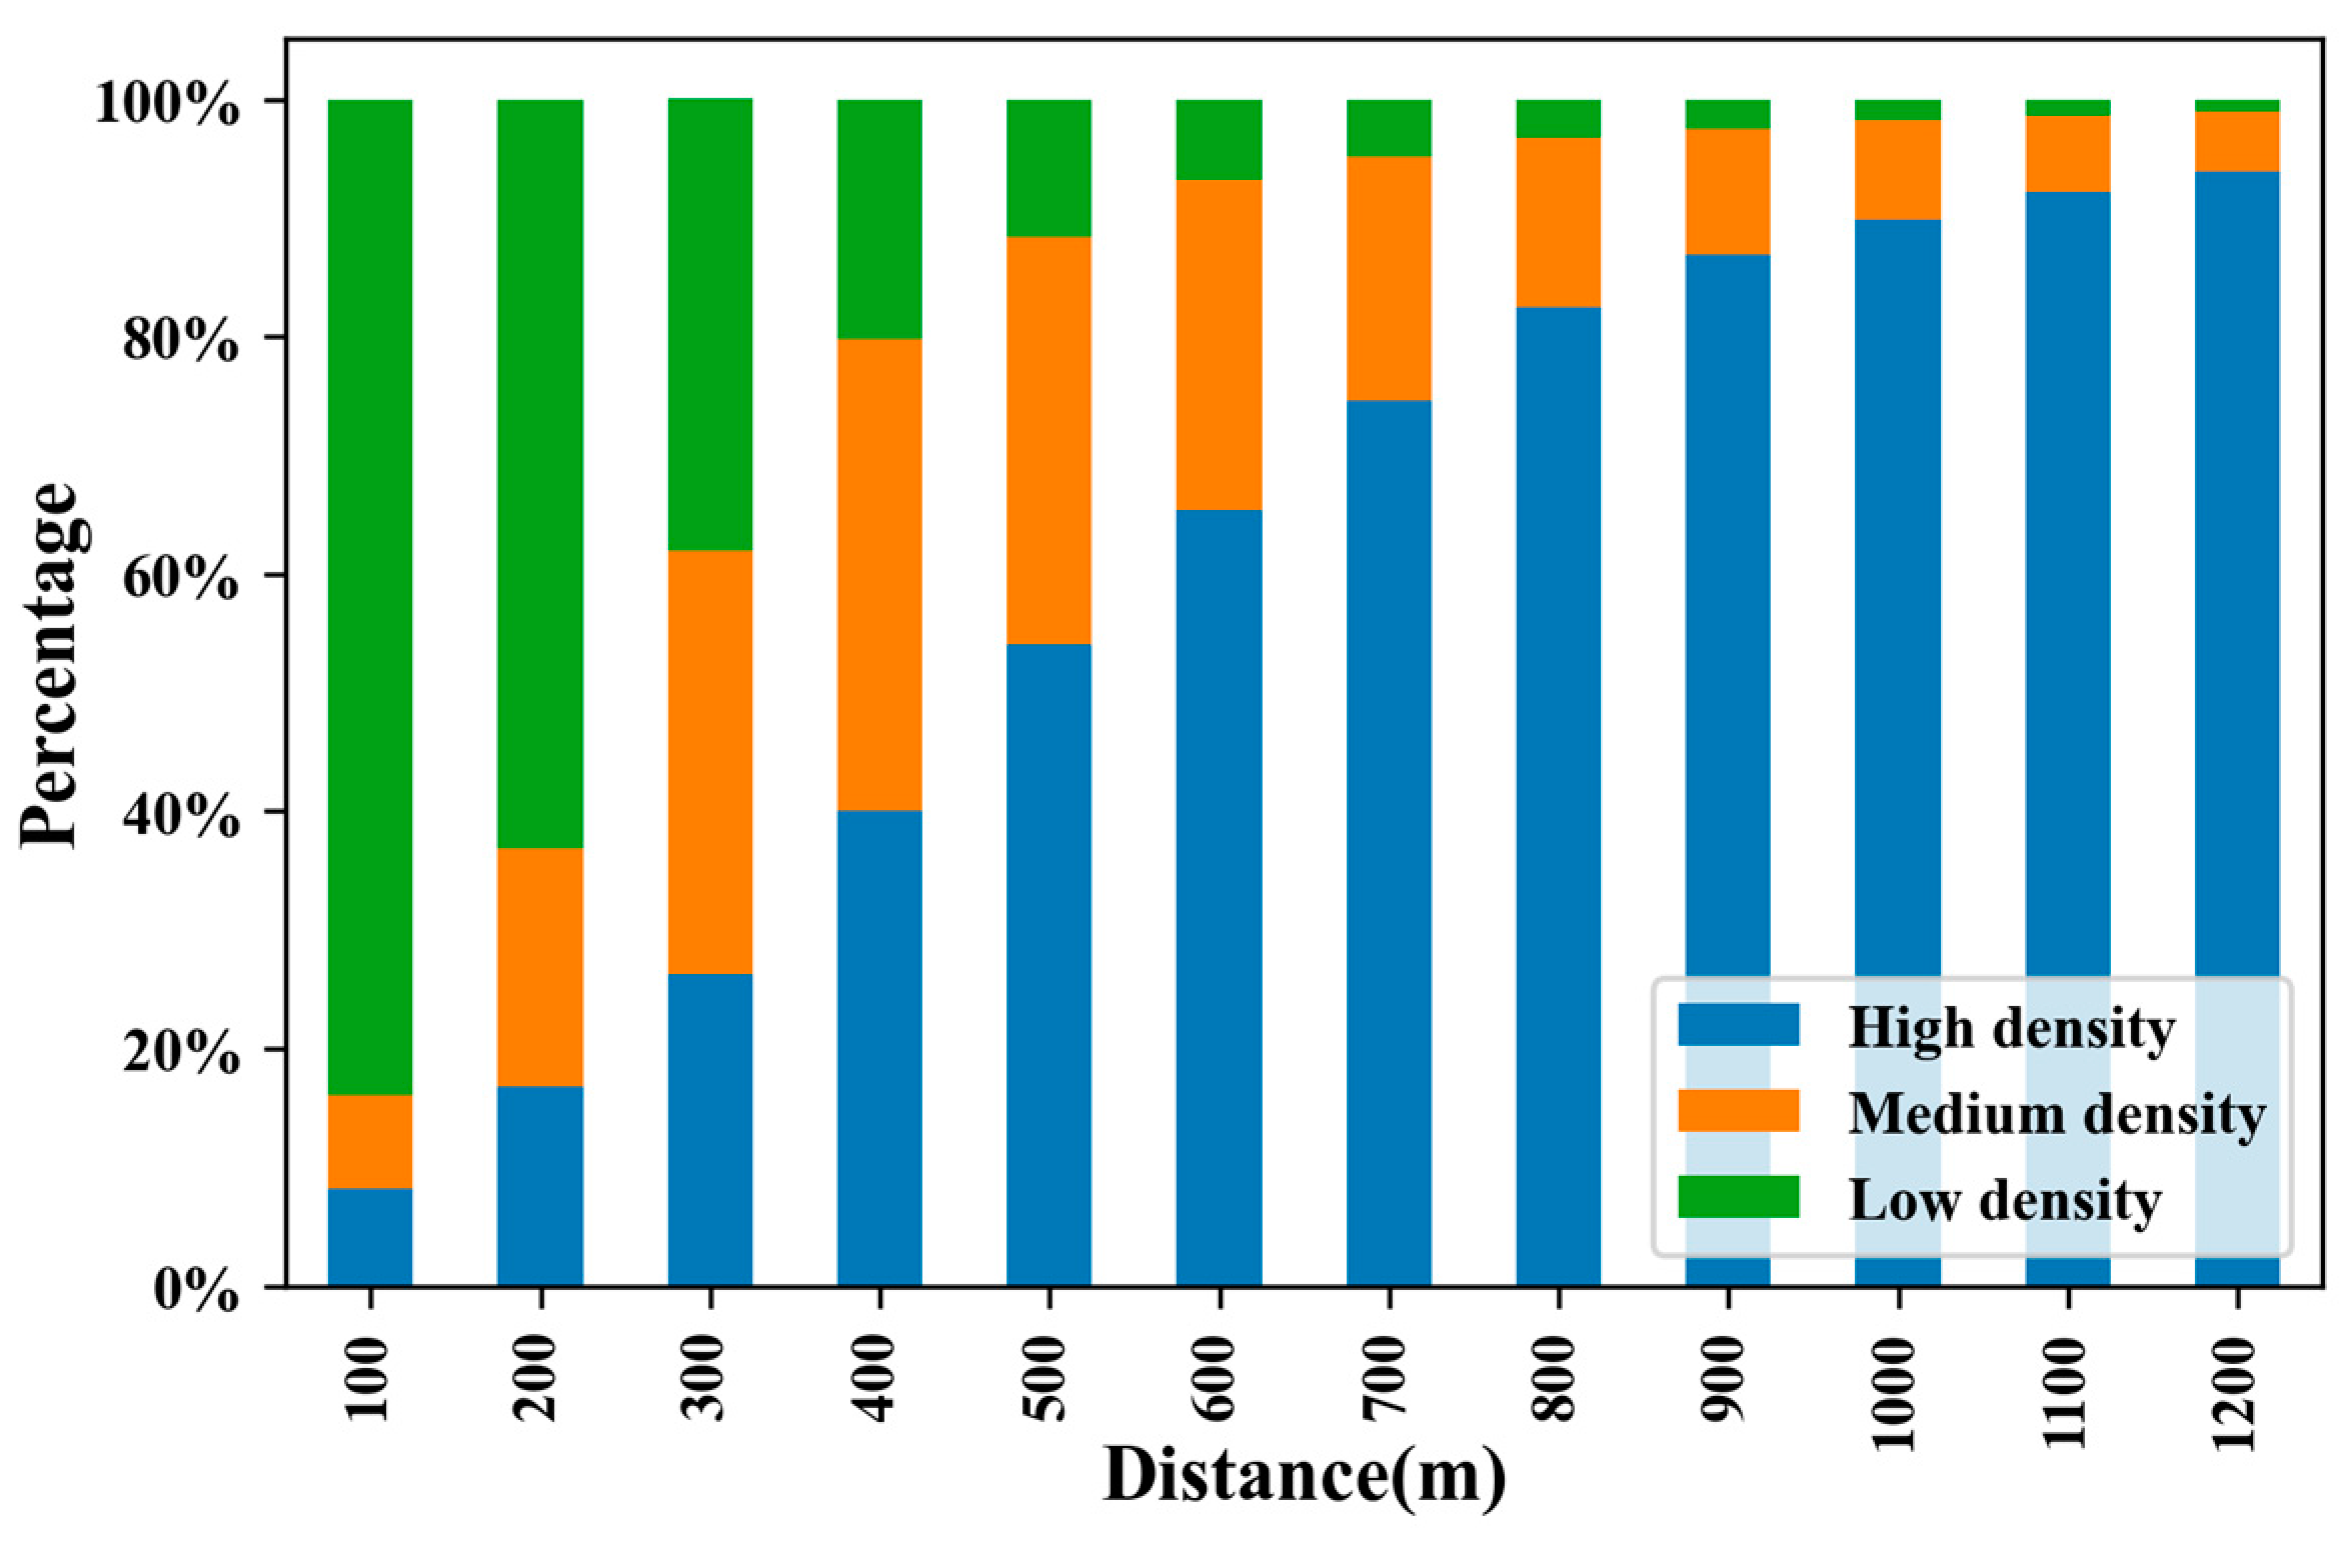
Upon completing the meticulous calculations pertaining to spot distribution and spacing, a comprehensive stack diagram, as illustrated in Figure 5, can be generated. This diagram serves as a visual representation, delineating the presence of spots within a given range of all existing spots, thereby defining three distinct spots: the ‘Spots in high-density areas’, the ‘Spots in medium-density areas’, and the ‘Spots in low-density areas’.
Both the comprehensive service level and the effective utilization of the bike-sharing system warrant consideration, as illustrated in Table 6. It is evident that alterations in spot density exhibit the following characteristics with regard to service level and utilization efficiency:
  • As the distance between spots increases, the likelihood of encountering a bike spot within that range increases. The probability of the existence of a bike spot experiences an initial rise followed by a subsequent decline. When the distance exceeds 800 m, the impact of the road network remains below 15%, indicating a commendable system stability in catering to fluctuations in traffic demand.
  • The holistic service level of the bike-sharing system should adhere to the following guidelines: users possess a 75% chance of discovering a parking spot within a 300 m radius, and a 90% probability of securing a parking spot within a 450 m radius. The overall utilization efficiency is contingent on the spacing between spots: if the distance between spots is less than 400 m, the system efficiency is notably suboptimal; conversely, when the distance exceeds 800 m, the system efficiency surpasses 90%.

4.3. Stepwise Punishment Incentive

As evident from the discussion above, introducing a parking spot layout combined with a penalty mechanism elicits a shift in parking behavior, signifying the corrective impact of penalty incentives on parking violations. Nevertheless, excessive penalties can diminish users’ willingness to utilize the bike-sharing service. Therefore, it becomes imperative to carefully calibrate the stepwise punishment intervals and determine the optimal point at which punishments cease, ensuring user retention and sustained engagement with bike-sharing. This section investigates the optimal inflection point of regulatory effectiveness across various parking distances.
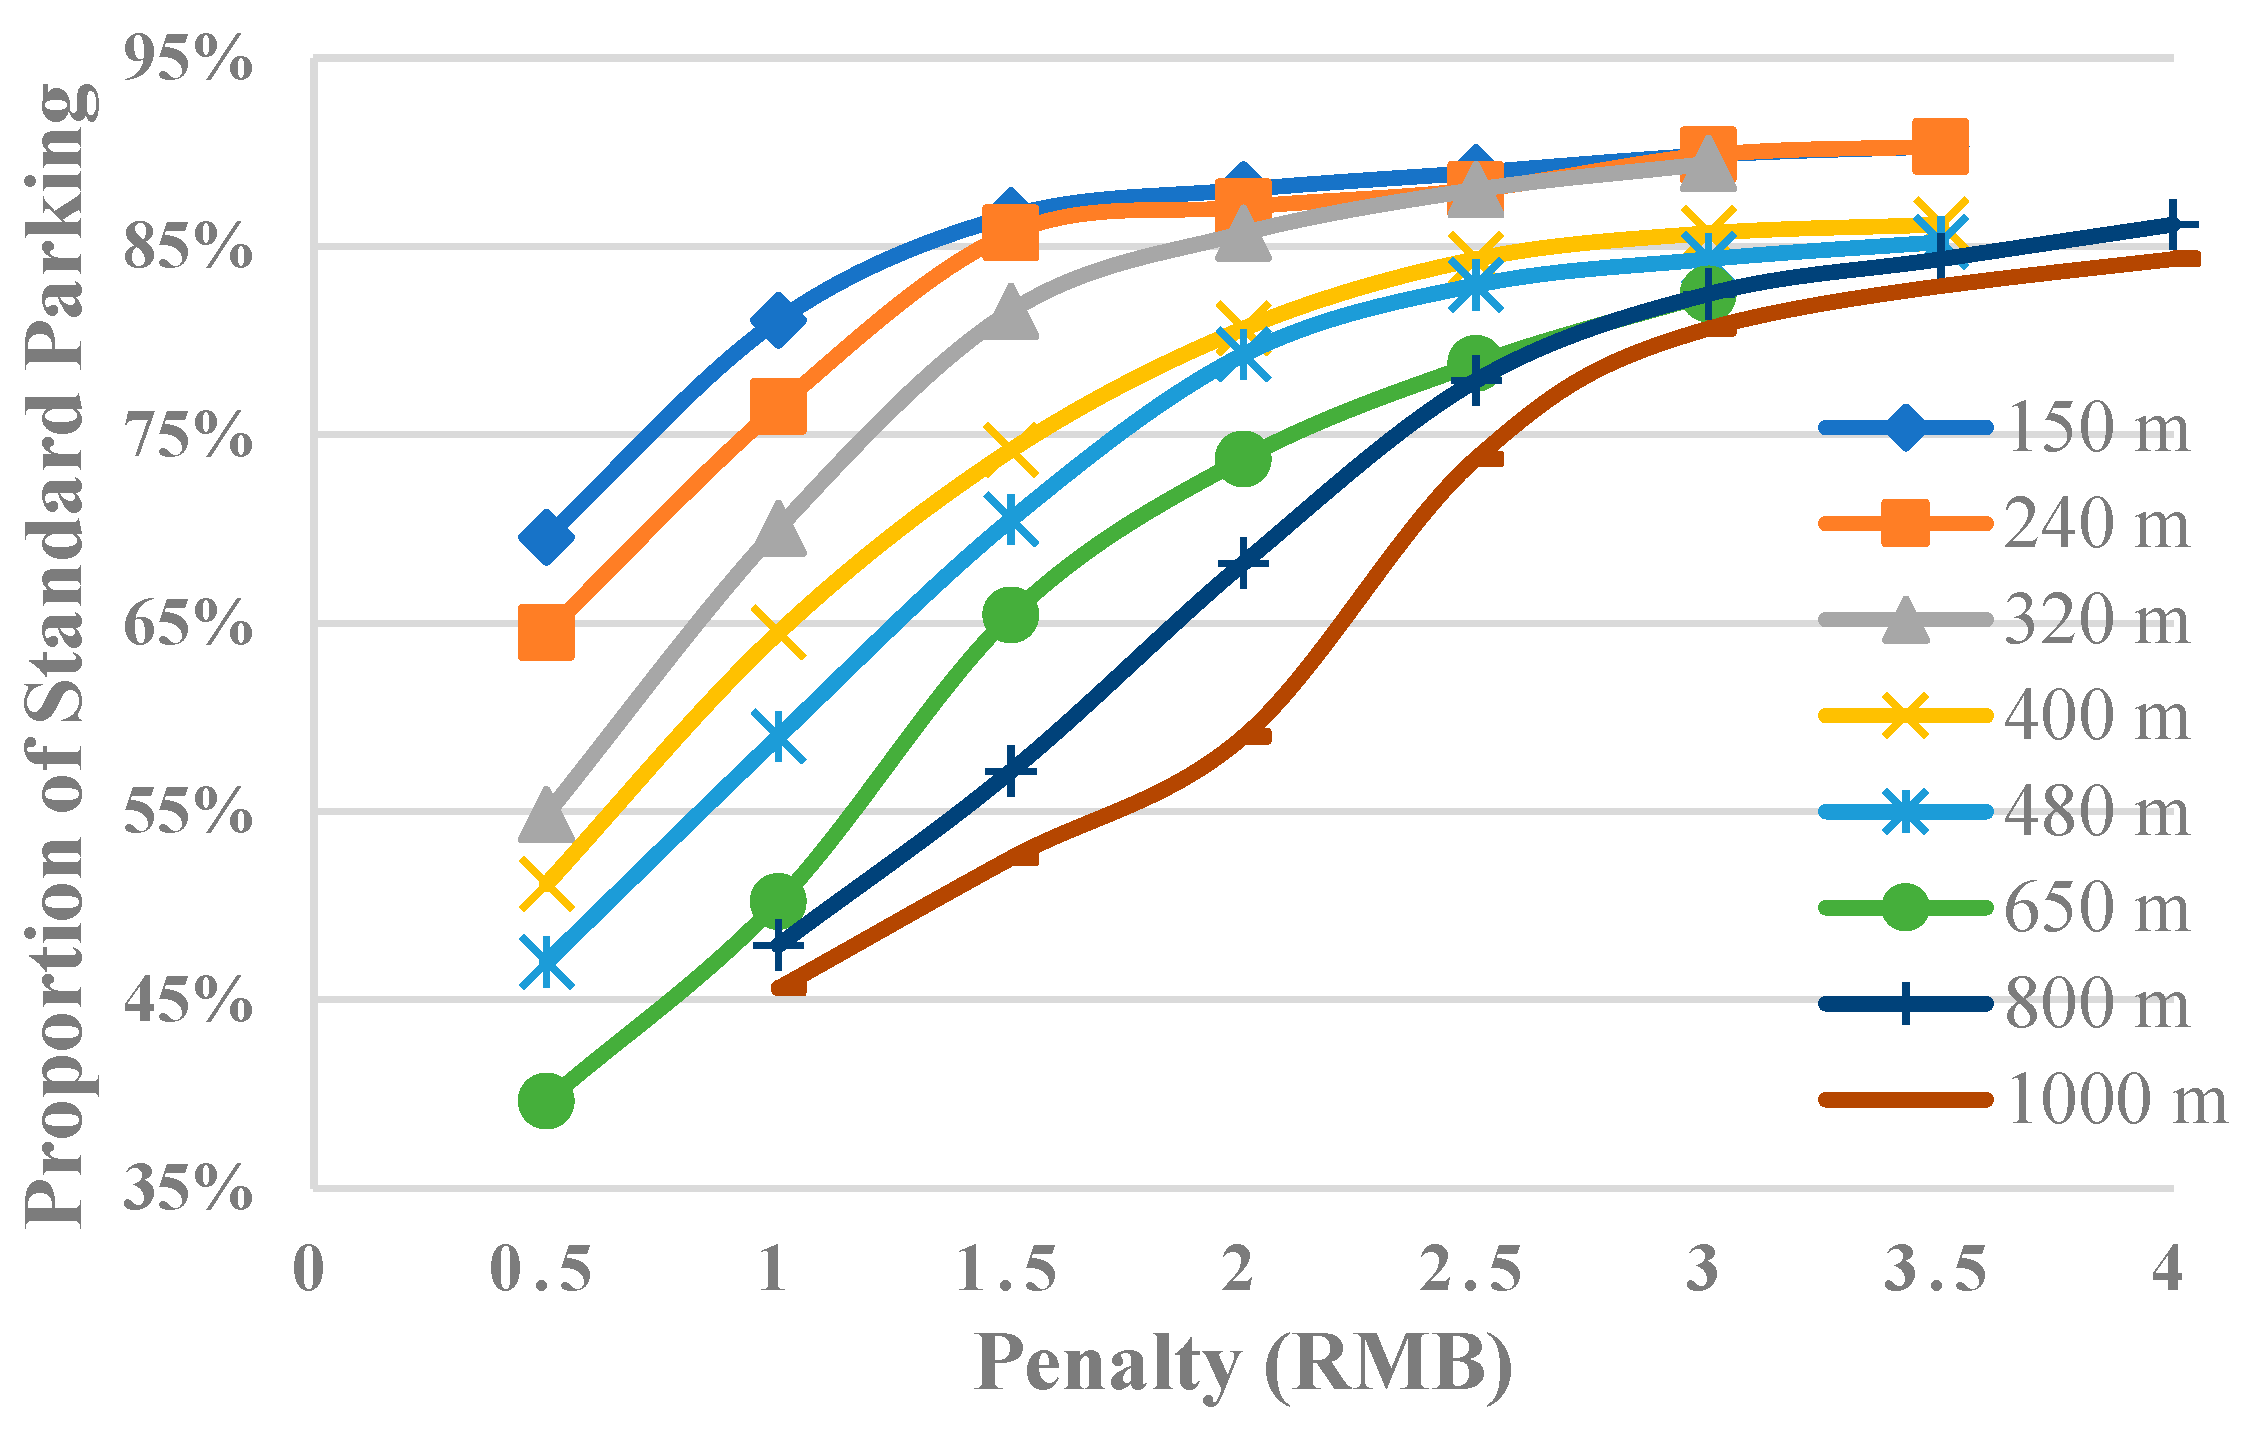
Utilizing the binomial choice model of standard parking, this study focuses on analyzing five factors susceptible to external design influence. The scatter diagram presented in Figure 6 portrays the parking selection dynamics.
Considering the relationship between walking distance and penalties illustrated in Figure 7, a clear pattern emerges. When the walking distance is within 300 m, an increase in fines demonstrates a notable regulatory effect, achieving a standard parking rate of over 85% for a modest cost of CNY 1.5. Even within a range of 500 m, a fine of CNY 2.5 continues to encourage standard parking effectively. However, as the walking distance exceeds 650 m, the constraint imposed by a CNY 2.5 fine becomes inadequate, resulting in approximately 25% to 30% of users choosing to violate parking regulations. Although escalating the fine to CNY 4 to 5 restores a constraint exceeding 85%, it also leads to substantial user attrition.
Drawing from the analysis of the standard parking choice, the optimal design of a bike-sharing parking layout should consider both density and penalties. Here are two key recommendations:
  • The spacing between parking spots should be carefully determined, taking into account user walking distances. In the central urban area, the spacing should range from 400 m to 600 m, while in other areas, it can be extended from 600 m to 800 m. However, it is essential to avoid exceeding a maximum spacing of 1000 m. Furthermore, locating parking spots in open areas with high passenger flow is advisable to ensure accessibility.
  • The penalty system for parking violations should incorporate credit scores and fines. Users who opt for standard parking should be rewarded with increased credit scores, allowing for minor deductions in the case of low-level parking violations. The severity of the penalty for parking violations should be determined based on the distance between the locking place and the nearest parking spot.
According to the above theoretical research and practical questionnaire survey results, we designed a stepwise punishment penalty schedule for Beijing. Table 7 presents the penalty scheme specifically applicable to the central urban area. Distances under 500 m should incur fines below CNY 2.5, while distances exceeding 500 m should be penalized with fines exceeding CNY 2.5.
Then, 25 POIs were randomly set in the area surrounding the questionnaire distribution zone, comparing the proportion of standard parking to test the improvement, as shown in Table 8. The minimum distance is the walking distance from the POI to the nearest parking spot, measured by the Amap API (https://lbs.amap.com/api/webservice/guide/api/direction, accessed on 27 February 2023).
By incorporating density and punishment into the parking layout design, a significant increase in the proportion of standard parking can be achieved, ranging from 10% to 60%. The following observations can be made:
  • With consistent walking distances, the proportion of standard parking decreases as the distance increases. This calls for stricter punishment and greater constraint. The regression coefficients of standard parking intention gradually diminish at different levels, indicating a diminishing effect of punishment on distance. At Level 5, the coefficient approaches horizontally, suggesting a diminished sensitivity to punishment regarding distance.
  • While Level 5 punishment exhibits an effectiveness of over 85%, it is crucial to avoid low parking densities as they can result in substantial user attrition. Maintaining an adequate parking density in densely traveled areas is essential to ensure user willingness to utilize the bike-sharing system.
The case regulated the parking behavior in the bike-sharing system, and the average improvement effect reached 23.20% under stepwise penalty with willingness constraints. It indicated that it has played an optimizing role in the planning and management of the bike-sharing system in Beijing.

5. Conclusions

From the vantage point of bike-sharing users, this study delves into the myriad factors impacting standard parking and usage propensity while artfully crafting a parking layout that harmoniously integrates parking density and punitive measures. The salient findings of this investigation can be distilled as follows:
  • Computation of bike-sharing spot density in Beijing, China: When considering the service level, users ought to be within a walking distance of 300 m to 450 m; however, to optimize utilization efficiency, this distance should exceed 400 m. In urban areas replete with dense travel, the interstitial spacing between bike-sharing parking points (twice the walking distance of users) should ideally fall between 400 m and 600 m, while in other travel areas, a range of 600 m to 800 m is recommended.
  • Analysis of parameters in the parking constraint model: Among the various individual factors influencing parking behavior, it emerges that men, middle-aged and elderly individuals, those with restricted occupations, and individuals with modest incomes exhibit a heightened inclination toward standard parking. Pertaining to parking behavior factors, users characterized by frequent and vigorous usage patterns, low expectations of convenience, reduced travel costs, and flexible travel preferences manifest a heightened proclivity for standard parking. The cumulative percentage of users’ maximum acceptable walking distance evinces an exponential distribution, with approximately 80% of users amenable to a threshold of 400 m in the absence of penalties, while 40% evince acceptance of an upper limit of 800 m.
  • A discernible quantitative association surfaces between the proportion of standard parking and penalty incentives across diverse walking distances, allowing for the inducement of walking distances via a stepwise penalization framework. Notably, within a walking distance of 300 m, the efficacy of regulations becomes apparent with escalating fines. As the walking distance expands, the constraining influence of moderate penalties gradually wanes. Reaching the echelons of higher fines once again engenders a constraint surpassing 85%, albeit at the expense of substantial user attrition. Consequently, judicious control over the minimum density of parking points assumes paramount importance to ensure the unwavering enthusiasm of users.

Author Contributions

G.C. came up with the original idea for this article; J.B. designed the theoretical model, collected the data, wrote the whole manuscript and polished the language of this paper; Z.L. provided constructive advice to improve the manuscript. All authors have read and agreed to the published version of the manuscript.

Funding

This research received no external funding.

Institutional Review Board Statement

Not applicable.

Informed Consent Statement

Informed consent was obtained from all subjects involved in the study.

Data Availability Statement

Data available on request due to restrictions privacy. The data presented in this study are available on request from the corresponding author. The data are not publicly available due to the confidentiality and privacy of the participants.

Acknowledgments

The research was supported by funding provided by the Laboratory of Transport Pollution Control and Monitoring Technology, Data-Driven Dynamic Calculation of Energy Consumption and Carbon Emissions of Multiple Types Vehicles in Road Network Environment (Grant number (2022)JH-F041). Additional funding was provided by the Fundamental Research Funds for the Central Universities (Grant number 2022RC023).

Conflicts of Interest

The authors declare no conflict of interest.

References

  1. Xiao, G.; Xiao, Y.; Ni, A.; Zhang, C.; Zong, F. Exploring Influence Mechanism of Bikesharing on the Use of Public Transportation—A Case of Shanghai. Transp. Lett. 2023, 15, 269–277. [Google Scholar] [CrossRef]
  2. Cheng, P.; Ou Yang, Z.; Liu, Y. Understanding Bike Sharing Use over Time by Employing Extended Technology Continuance Theory. Transp. Res. Part A Policy Pract. 2019, 124, 433–443. [Google Scholar] [CrossRef]
  3. Gao, K. Quantifying Economic Benefits from Free-Floating Bike-Sharing Systems: A Trip-Level Inference Approach and City-Scale Analysis. Transp. Res. Part A Policy Pract. 2021, 144, 89–103. [Google Scholar] [CrossRef]
  4. Arias-Molinares, D.; Xu, Y.; Büttner, B.; Duran-Rodas, D. Exploring Key Spatial Determinants for Mobility Hub Placement Based on Micromobility Ridership. J. Transp. Geogr. 2023, 110, 103621. [Google Scholar] [CrossRef]
  5. Wang, Y.; Yang, Y.; Wang, J.; Douglas, M.; Su, D. Examining the Influence of Social Norms on Orderly Parking Behavior of Dockless Bike-Sharing Users. Transp. Res. Part A Policy Pract. 2021, 147, 284–296. [Google Scholar] [CrossRef]
  6. Kaltenbrunner, A.; Meza, R.; Grivolla, J.; Codina, J.; Banchs, R. Urban Cycles and Mobility Patterns: Exploring and Predicting Trends in a Bicycle-Based Public Transport System. Pervasive Mob. Comput. 2010, 6, 455–466. [Google Scholar] [CrossRef]
  7. Rybarczyk, G.; Wu, C. Bicycle Facility Planning Using GIS and Multi-Criteria Decision Analysis. Appl. Geogr. 2010, 30, 282–293. [Google Scholar] [CrossRef]
  8. Xiao, G.; Lu, Q.; Ni, A.; Zhang, C. Research on Carbon Emissions of Public Bikes Based on the Life Cycle Theory. Transp. Lett. 2023, 15, 278–295. [Google Scholar] [CrossRef]
  9. Li, L.; He, S.; Zhang, J.; Ran, B. Short-term Highway Traffic Flow Prediction Based on a Hybrid Strategy Considering Temporal–Spatial Information. J. Adv. Transp. 2016, 50, 2029–2040. [Google Scholar] [CrossRef]
  10. Gao, K.; Yang, Y.; Li, A.; Qu, X. Spatial Heterogeneity in Distance Decay of Using Bike Sharing: An Empirical Large-Scale Analysis in Shanghai. Transp. Res. Part D Transp. Environ. 2021, 94, 102814. [Google Scholar] [CrossRef]
  11. Su, D.; Wang, Y.; Yang, N.; Wang, X. Promoting Considerate Parking Behavior in Dockless Bike-Sharing: An Experimental Study. Transp. Res. Part A Policy Pract. 2020, 140, 153–165. [Google Scholar] [CrossRef]
  12. Zhao, L.; Fang, D.; Cao, Y.; Sun, S.; Han, L.; Xue, Y.; Zheng, Q. Impact-Asymmetric Analysis of Bike-Sharing Residents’ Satisfaction: A Case Study of Harbin, China. Sustainability 2023, 15, 1670. [Google Scholar] [CrossRef]
  13. Zhang, Y.; Lin, D.; Mi, Z. Electric Fence Planning for Dockless Bike-Sharing Services. J. Clean. Prod. 2019, 206, 383–393. [Google Scholar] [CrossRef]
  14. Du, Y.; Deng, F.; Liao, F. A Model Framework for Discovering the Spatio-Temporal Usage Patterns of Public Free-Floating Bike-Sharing System. Transp. Res. Part C Emerg. Technol. 2019, 103, 39–55. [Google Scholar] [CrossRef]
  15. Çelebi, D.; Yörüsün, A.; Işık, H. Bicycle Sharing System Design with Capacity Allocations. Transp. Res. Part B Methodol. 2018, 114, 86–98. [Google Scholar] [CrossRef]
  16. Garcia-Gutierrez, J.; Romero-Torres, J.; Gaytan-Iniestra, J. Dimensioning of a Bike Sharing System (BSS): A Study Case in Nezahualcoyotl, Mexico. Procedia-Soc. Behav. Sci. 2014, 162, 253–262. [Google Scholar] [CrossRef]
  17. Yang, R.; Long, R. Analysis of the Influencing Factors of the Public Willingness to Participate in Public Bicycle Projects and Intervention Strategies—A Case Study of Jiangsu Province, China. Sustainability 2016, 8, 349. [Google Scholar] [CrossRef]
  18. Gao, K.; Yang, Y.; Gil, J.; Qu, X. Data-Driven Interpretation on Interactive and Nonlinear Effects of the Correlated Built Environment on Shared Mobility. J. Transp. Geogr. 2023, 110, 103604. [Google Scholar] [CrossRef]
  19. Small, K.A. Valuation of Travel Time. Econ. Transp. 2012, 1, 2–14. [Google Scholar] [CrossRef]
  20. Carrion, C.; Levinson, D. Value of Travel Time Reliability: A Review of Current Evidence. Transp. Res. Part A Policy Pract. 2012, 46, 720–741. [Google Scholar] [CrossRef]
  21. Hosseini, M.; MirHassani, S.A. Refueling-Station Location Problem under Uncertainty. Transp. Res. Part E Logist. Transp. Rev. 2015, 84, 101–116. [Google Scholar] [CrossRef]
  22. Yang, X.-H.; Cheng, Z.; Chen, G.; Wang, L.; Ruan, Z.-Y.; Zheng, Y.-J. The Impact of a Public Bicycle-Sharing System on Urban Public Transport Networks. Transp. Res. Part A Policy Pract. 2018, 107, 246–256. [Google Scholar] [CrossRef]
  23. Frade, I.; Ribeiro, A. Bike-Sharing Stations: A Maximal Covering Location Approach. Transp. Res. Part A Policy Pract. 2015, 82, 216–227. [Google Scholar] [CrossRef]
  24. Wang, J.; Tsai, C.-H.; Lin, P.-C. Applying Spatial-Temporal Analysis and Retail Location Theory to Public Bikes Site Selection in Taipei. Transp. Res. Part A Policy Pract. 2016, 94, 45–61. [Google Scholar] [CrossRef]
  25. Larsen, J.; Patterson, Z.; El-Geneidy, A. Build It. But Where? The Use of Geographic Information Systems in Identifying Locations for New Cycling Infrastructure. Int. J. Sustain. Transp. 2013, 7, 299–317. [Google Scholar] [CrossRef]
  26. García-Palomares, J.C.; Gutiérrez, J.; Latorre, M. Optimizing the Location of Stations in Bike-Sharing Programs: A GIS Approach. Appl. Geogr. 2012, 35, 235–246. [Google Scholar] [CrossRef]
  27. Jia, H.; Miao, H.; Tian, G.; Zhou, M.; Feng, Y.; Li, Z.; Li, J. Multiobjective Bike Repositioning in Bike-Sharing Systems via a Modified Artificial Bee Colony Algorithm. IEEE Trans. Automat. Sci. Eng. 2020, 17, 909–920. [Google Scholar] [CrossRef]
  28. Xing, Y.; Wang, K.; Lu, J.J. Exploring Travel Patterns and Trip Purposes of Dockless Bike-Sharing by Analyzing Massive Bike-Sharing Data in Shanghai, China. J. Transp. Geogr. 2020, 87, 102787. [Google Scholar] [CrossRef]
  29. Landis, B.W.; Vattikuti, V.R.; Brannick, M.T. Real-Time Human Perceptions: Toward a Bicycle Level of Service. Transp. Res. Rec. 1997, 1578, 119–126. [Google Scholar] [CrossRef]
  30. Harkey, D.L.; Reinfurt, D.W.; Knuiman, M. Development of the Bicycle Compatibility Index. Transp. Res. Rec. 1998, 1636, 13–20. [Google Scholar] [CrossRef]
  31. Guo, T.; Yang, J.; He, L.; Tang, K. Layout Optimization of Campus Bike-Sharing Parking Spots. J. Adv. Transp. 2020, 2020, 8894119. [Google Scholar] [CrossRef]
  32. Hess, S.; Polak, J.W. An Analysis of Parking Behaviour Using Discrete Choice Models Calibrated on SP Datasets. In Proceedings of the 44th Congress of the European Regional Science Association: Regions and Fiscal Federalism, Porto, Portugal, 25–29 August 2004; p. ersa04p60. [Google Scholar]
  33. Morillo, C.; Campos, J.M. On-Street Illegal Parking Costs in Urban Areas. Procedia-Soc. Behav. Sci. 2014, 160, 342–351. [Google Scholar] [CrossRef]
  34. Lu, F.; Zhang, J.; Perloff, J.M. General and Specific Information in Deterring Traffic Violations: Evidence from a Randomized Experiment. J. Econ. Behav. Organ. 2016, 123, 97–107. [Google Scholar] [CrossRef]
  35. Zhang, Y.; Brussel, M.J.G.; Thomas, T.; Van Maarseveen, M.F.A.M. Mining Bike-Sharing Travel Behavior Data: An Investigation into Trip Chains and Transition Activities. Comput. Environ. Urban Syst. 2018, 69, 39–50. [Google Scholar] [CrossRef]
  36. Shi, J.; Si, H.; Wu, G.; Su, Y.; Lan, J. Critical Factors to Achieve Dockless Bike-Sharing Sustainability in China: A Stakeholder-Oriented Network Perspective. Sustainability 2018, 10, 2090. [Google Scholar] [CrossRef]
  37. Shui, C.S.; Szeto, W.Y. A Review of Bicycle-Sharing Service Planning Problems. Transp. Res. Part C Emerg. Technol. 2020, 117, 102648. [Google Scholar] [CrossRef]
  38. Pfrommer, J.; Warrington, J.; Schildbach, G.; Morari, M. Dynamic Vehicle Redistribution and Online Price Incentives in Shared Mobility Systems. IEEE Trans. Intell. Transport. Syst. 2014, 15, 1567–1578. [Google Scholar] [CrossRef]
  39. Gao, L.; Ji, Y.; Yan, X.; Fan, Y.; Guo, W. Incentive Measures to Avoid the Illegal Parking of Dockless Shared Bikes: The Relationships among Incentive Forms, Intensity and Policy Compliance. Transportation 2021, 48, 1033–1060. [Google Scholar] [CrossRef]
  40. Médard de Chardon, C. The Contradictions of Bike-Share Benefits, Purposes and Outcomes. Transp. Res. Part A Policy Pract. 2019, 121, 401–419. [Google Scholar] [CrossRef]
  41. Zhao, D.; Wang, D. The Research of Tripartite Collaborative Governance on Disorderly Parking of Shared Bicycles Based on the Theory of Planned Behavior and Motivation Theories—A Case of Beijing, China. Sustainability 2019, 11, 5431. [Google Scholar] [CrossRef]
  42. Zhang, X.; Shao, C.; Wang, B.; Huang, S. The Impact of COVID-19 on Travel Mode Choice Behavior in Terms of Shared Mobility: A Case Study in Beijing, China. Int. J. Environ. Res. Public Health 2022, 19, 7130. [Google Scholar] [CrossRef]
  43. Wang, Y.; Sun, S. Does Large Scale Free-Floating Bike Sharing Really Improve the Sustainability of Urban Transportation? Empirical Evidence from Beijing. Sustain. Cities Soc. 2022, 76, 103533. [Google Scholar] [CrossRef]
  44. Chen, Z.; Van Lierop, D.; Ettema, D. Travel Satisfaction with Dockless Bike-Sharing: Trip Stages, Attitudes and the Built Environment. Transp. Res. Part D Transp. Environ. 2022, 106, 103280. [Google Scholar] [CrossRef]
  45. Gu, T.; Kim, I.; Currie, G. To Be or Not to Be Dockless: Empirical Analysis of Dockless Bikeshare Development in China. Transp. Res. Part A Policy Pract. 2019, 119, 122–147. [Google Scholar] [CrossRef]
  46. An, Y.; Li, M.; Guo, Y.; Xu, D.; Lin, X.; He, F. Detour-Ratio in Urban Traffic Based on Mass Data. J. Transp. Inf. Saf. 2019, 37, 121–127. [Google Scholar]
  47. Zhou, Y.; Wu, J.; Dong, J. Research on the Assessment of Network Accessibility and Traffic Strategy Using Probe Vehicle; China Railway Publishing House: Beijing, China, 2005; pp. 366–372. [Google Scholar]
  48. Ingvardson, J.B.; Nielsen, O.A. The Relationship between Norms, Satisfaction and Public Transport Use: A Comparison across Six European Cities Using Structural Equation Modelling. Transp. Res. Part A Policy Pract. 2019, 126, 37–57. [Google Scholar] [CrossRef]
  49. Nordlund, A.; Jansson, J.; Westin, K. Acceptability of Electric Vehicle Aimed Measures: Effects of Norm Activation, Perceived Justice and Effectiveness. Transp. Res. Part A Policy Pract. 2018, 117, 205–213. [Google Scholar] [CrossRef]
  50. Wang, S.; Wang, J.; Li, J.; Wang, J.; Liang, L. Policy Implications for Promoting the Adoption of Electric Vehicles: Do Consumer’s Knowledge, Perceived Risk and Financial Incentive Policy Matter? Transp. Res. Part A Policy Pract. 2018, 117, 58–69. [Google Scholar] [CrossRef]
  51. Macioszek, E.; Świerk, P.; Kurek, A. The Bike-Sharing System as an Element of Enhancing Sustainable Mobility—A Case Study Based on a City in Poland. Sustainability 2020, 12, 3285. [Google Scholar] [CrossRef]
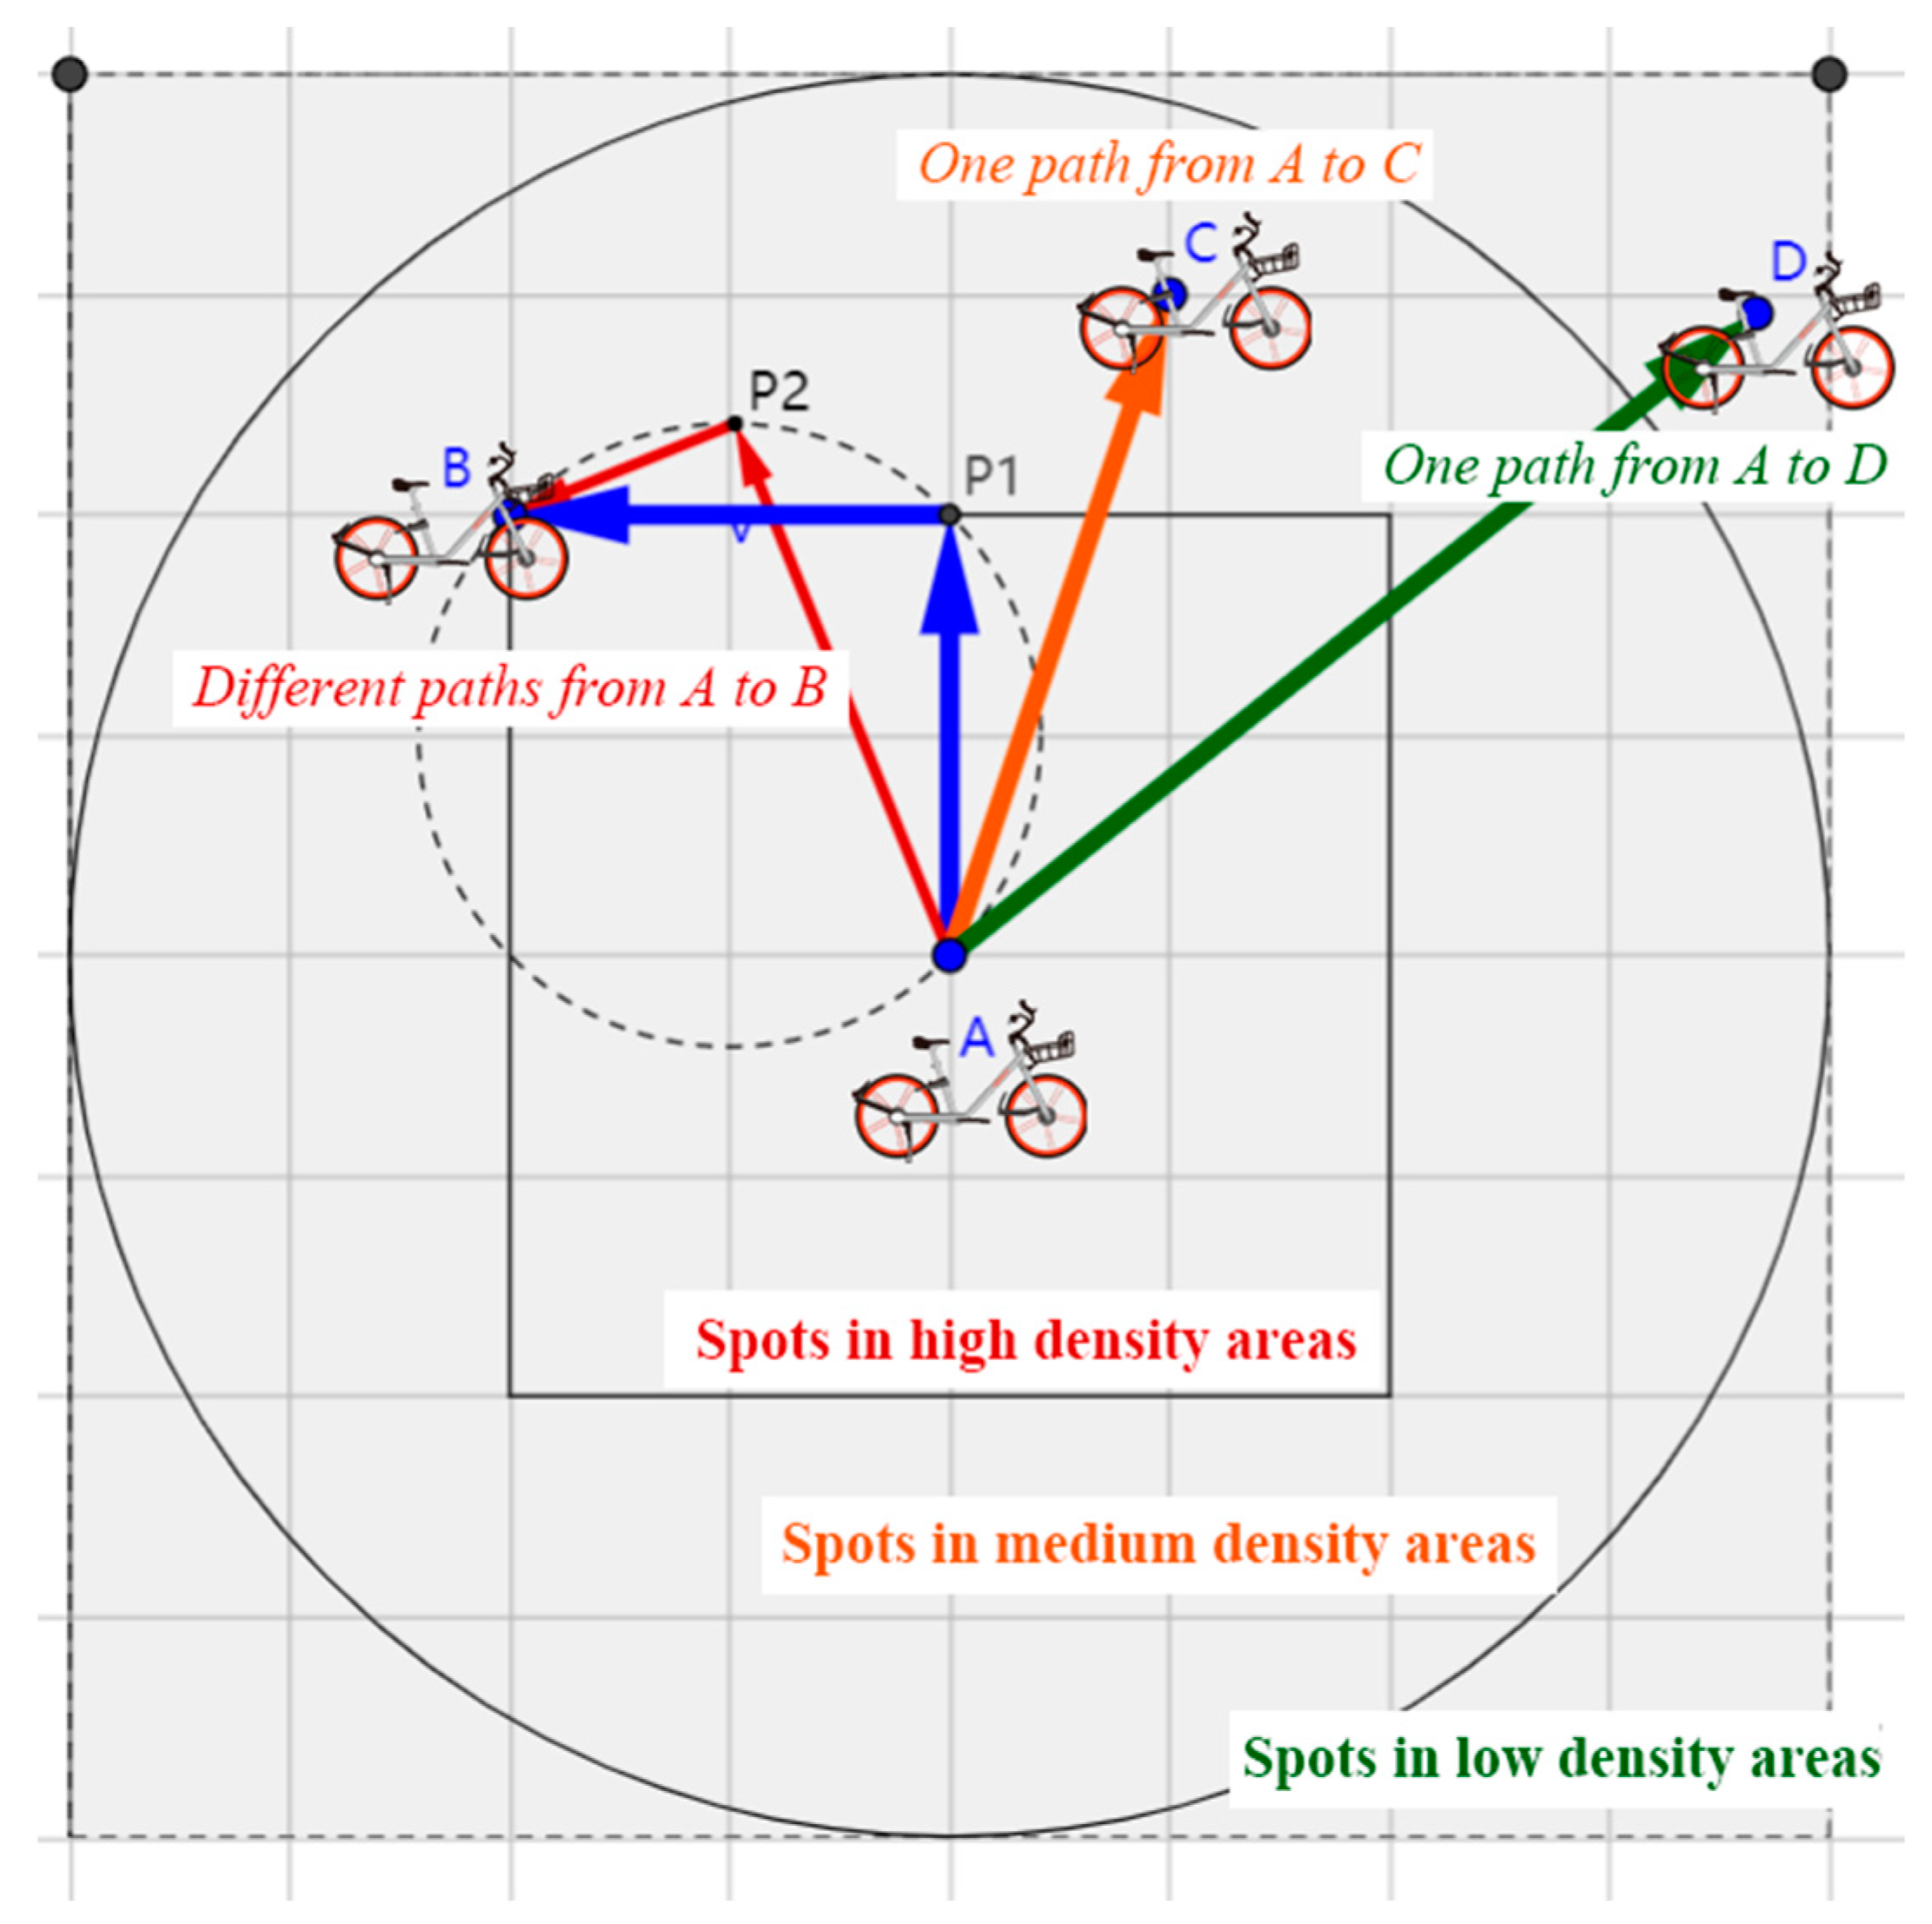
Figure 1. Spots spacing calculation diagram.
Sustainability 15 12526 g001
Figure 2. Questionnaire data distribution. (a) Purpose; (b) weekly usage; (c) duration of each use; (d) daily traffic cost (public transport); (e) concern on travel costs; (f) attitude to parking spots.
Sustainability 15 12526 g002aSustainability 15 12526 g002b
Figure 3. Parking violations under categorical variables. Where the number _0, _1, _2, … represent the dummy variables, such as Variable(0), Variable(1), Variable(2), …
Sustainability 15 12526 g003
Figure 4. The cumulative percentage of the maximum distance.
Sustainability 15 12526 g004
Figure 5. Stacking diagram of three types of spots at different distances.
Sustainability 15 12526 g005
Figure 6. Parking choice scatter plot. The redder the dot, the higher the probability of parking violations, and the greener the dot, the higher the probability of standard parking. The diagonal represents the kernel density estimation of the variable.
Sustainability 15 12526 g006
Figure 7. Standard parking and penalties under different walking distances.
Sustainability 15 12526 g007
Table 1. The coding table of the categorical variables and the continuous variables.
VariableSymbolEncodingToleranceVIF
GenderGD(0) Male; (1) Female0.8711.149
AgeAGE(0) Under 17; (1) 18~25; (2) 26~25
(3) 45~60; (4) Above 60
0.6801.470
OccupationOCP(0) College students
(1) Middle school students
(2) Business employees
(3) Public service workers
(4) Freelancers; (5) Others
0.6301.587
IncomeICM(0) Under 5000; (1) 5000~8000
(2) 8000~10,000; (3) Above 10,000
0.6471.545
Purposes
(Multiple choice)
PURP(0) Commuting
(1) Transfer
(2) Entertainment
(3) Shopping
(4) Fitness
(5) Other
0.633
0.787
0.764
0.838
0.851
0.719
1.579
1.270
1.310
1.193
1.175
1.392
Weekly usageWU(0) Hardly ever use; (1) 1~2 times a week
(2) 3~4 times a week; (3) 5~7 times a week
(4) More than 7 times a week
0.8371.194
Compare bus serviceCBS(0) Within 150 m; (1) Half distance
(2) Approximately same; (3) Twice the distance
(4) More than twice the distance
0.8351.198
Concern on travel costsCTC(0) No; (1) Yes0.9081.101
Attitude to parking spotsAPS(0) Support; (1) No matter; (2) Oppose0.9051.104
Duration of each useDEULess than 10 min: 5 min
10~20 min: 15 min
21~30 min: 25 min
31~40 min: 35 min
More than 40 min: 45 min
0.8321.202
Daily traffic cost (public transport)DTCLess than 1 RMB: 0 RMB
1~4 RMB: 2.5 RMB
5~10 RMB: 7.5 RMB
11~20 RMB: 15 RMB.
More than 20 RMB: 25 RMB
0.8581.165
Maximum walking distanceMWD3 min: 240 m
4 min: 320 m
5 min: 400 m
6 min: 480 m
8 min: 650 m
10 min: 800 m
12 min: 1000 m
Above 1000 m: 1200 m
0.8911.122
Walking distanceWDOriginal values0.8771.141
FineFINOriginal values0.8771.141
Table 2. Descriptive statistical table for continuous variables.
MeanVarSt.DSkewnessKurtosis
DEU13.1663.8897.9931.3723.253
DTC2.69616.5824.07213.57915.377
MWD627.74102,879.893320.7490.489−1.128
WD500.8371,097.798266.6420.464−0.959
FIN1.9901.0891.04330.509−0.073
Table 3. Model categorize factor variables and parameters.
VariableBS.E.WaldDOFSignificanceExp (B)95% C.I. for Exp
GD (1)−0.1200.0564.62510.0320.8870.796~0.989
AGE (0) 19.31920.000
AGE (1)0.5040.11917.81010.0001.6551.310~2.091
AGE (2)0.5260.3122.85110.0911.6930.919~3.119
OCP (0) 239.28350.000
OCP (1)−0.1670.4240.15510.6940.8460.368~1.944
OCP (2)0.6030.14716.75310.0001.8271.369~2.439
OCP (3)−0.4580.1628.01210.0050.6320.460~0.868
OCP (4)−2.4860.246102.04210.0000.0830.051~0.135
OCP (5)1.4420.17270.34110.0004.2313.020~5.926
ICM (0) 65.46430.000
ICM (1)−0.1520.1231.52810.2160.8590.675~1.093
ICM (2)−0.7550.11940.39910.0000.4700.372~0.593
ICM (3)−0.7330.11540.69110.0000.4800.383~0.602
WU (0) 26.71240.000
WU (1)0.1270.0624.15910.0411.1351.005~1.282
WU (2)−0.0340.0980.11610.7340.9670.797~1.173
WU (3)−0.1480.1161.62810.2020.8620.687~1.083
WU (4)0.5340.11920.14810.0001.7061.351~2.155
CBS (0) 79.81040.000
CBS (1)−0.1450.0645.07610.0240.8650.763~0.981
CBS (2)−0.1630.0744.90610.0270.8500.735~0.981
CBS (3)1.7150.21265.27710.0005.5593.666~8.427
CBS (4)0.3070.1962.45210.1171.3600.926~1.998
Table 4. The cross-list of standard parking intentions and riding purposes.
CommutingTransferEntertainmentShoppingFitnessOther
Parking violation25.1%25.4%23.0%13.2%23.1%27.9%
Standard parking74.9%74.6%77.0%86.8%76.9%72.1%
Response rate38.9%28.5%15.7%5.3%3.0%8.6%
Table 5. Model numerical variable factors and parameters.
VariableBS.E.WaldSignificanceExp (B)95% C.I. for Exp
DEU0.0220.00436.9710.0001.0221.015~1.030
DTC−0.0680.00790.6640.0000.9340.922~0.948
MWD0.0020.000309.4770.0001.0021.001~1.002
WD−0.0020.000397.0920.0000.9980.998~0.998
FIN0.7960.028803.1300.0002.2162.097~2.341
Table 6. The proportion and satisfaction degree of spots at different distances.
Distance dHigh Density
Phd
Medium Density
Pmd
Low Density
Pld
Service Level
P(s ≤ d)
Use Efficiency
P(ds|s ≤ d)
100 m8.21%7.89%83.90%11.44%71.74%
200 m16.82%20.06%63.11%25.04%67.16%
300 m26.26%35.66%38.08%40.88%64.24%
400 m40.09%39.66%20.24%56.35%71.14%
500 m54.11%34.29%11.60%68.17%79.38%
600 m65.38%27.85%6.77%76.80%85.13%
700 m74.57%20.50%4.94%82.98%89.87%
800 m82.49%14.19%3.31%88.31%93.41%
900 m86.92%10.59%2.49%91.26%95.24%
1000 m89.88%8.29%1.84%93.28%96.36%
1100 m92.22%6.45%1.33%94.86%97.21%
1200 m93.88%5.12%1.01%95.98%97.81%
Table 7. Penalty schedule.
Walking Distance LevelDistance from the Nearest Parking Spot (m)Amount of Penalty (Credit Score)
Level 1<100¥0 and 2 credit score
Level 2100~300¥1 or 6 credit score
Level 3300~500¥2 or 15 credit score
Level 4500~800¥3
Level 5>800¥5
Credit score: +1/standard parking, and zero at the end of the month.
Table 8. The Proportion of Standard Parking for 25 POIs.
Serial NumberMinimum
Distance (m)
Walking
Distance Level
Original (%)Current (%)Improvement (%)
POI_221Level 1100.00100.000.00
POI_241Level 1100.00100.000.00
POI_14509Level 169.5969.590.00
POI_1250Level 169.5969.590.00
POI_1773Level 169.5969.590.00
POI_00149Level 269.5981.3411.75
POI_15158Level 269.5980.8911.30
POI_08169Level 264.5280.3415.82
POI_16226Level 264.5277.4912.97
POI_21240Level 264.5276.7912.27
POI_11249Level 264.5276.3411.82
POI_06272Level 254.8475.1920.35
POI_19278Level 254.8474.8920.05
POI_23327Level 354.8484.2829.44
POI_09368Level 351.1583.0531.90
POI_13408Level 351.1581.8530.70
POI_18431Level 351.1581.1630.01
POI_01440Level 347.0080.8933.89
POI_10481Level 347.0079.6632.66
POI_05509Level 447.0082.5035.50
POI_07517Level 439.6382.4242.79
POI_20760Level 439.6379.9940.36
POI_04864Level 537.3686.1848.82
POI_03883Level 537.3686.1848.82
POI_021010Level 527.3686.1858.82
Mean57.8581.0523.20
Disclaimer/Publisher’s Note: The statements, opinions and data contained in all publications are solely those of the individual author(s) and contributor(s) and not of MDPI and/or the editor(s). MDPI and/or the editor(s) disclaim responsibility for any injury to people or property resulting from any ideas, methods, instructions or products referred to in the content.